Conformational dynamics in TRPV1 channels reported by an encoded coumarin amino acid
- Universidad Austral de Chile, Chile
- Temple University, United States
- University of Iowa, United States
- Universidad Nacional Autónoma de México, Mexico
- Politecnico di Milano (POLIMI), Italy
- Iniciativa Cientifica Milenio, Chile
Figures
Figure 1 with 2 supplements
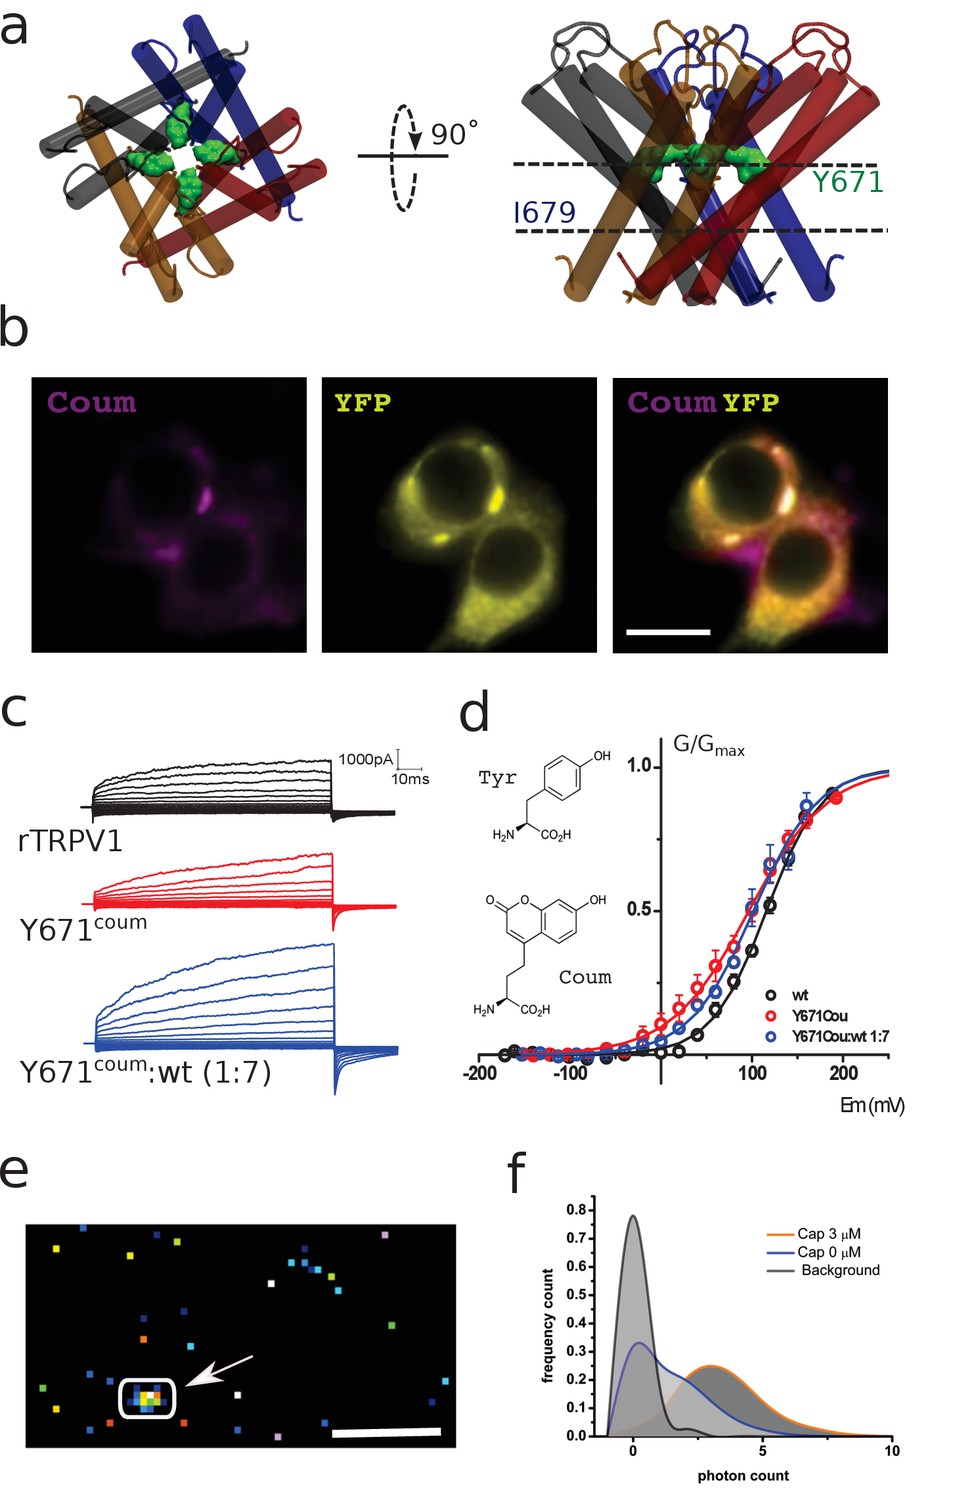
Functional expression of coumarin-containing TRPV1 channels at the membrane of HEK-293T cells.
(a) Top-down and lateral view of the pore region of rTRPV1 tetramers. Dashed lines denote the positions of putative gates, a canonical gate at I679 and a secondary constriction within the pore at Y671 (green shade). The different subunits are shown in different colors. (b) Epifluorescence images obtained from transiently transfected HEK-293T cells. Cells were co-transfected with wild-type rTRPV1-YPF and with rTRPV1-Y671coum. The scale bar corresponds to 10 µm. Images correspond to the average of 50 frames. (c) Representative traces obtained from transiently transfected HEK-293T cells subjected to voltage steps from −180 mV to +180 mV, in 20 mV increments, for the three different conditions indicated. No TRPV1 currents were seen from expressed Y671TAG channels co-expressed with the coumarin Rs and tRNA but lacking the supplemented amino acid in the culture media. (d) Conductance-voltage relation for the wild-type rTRPV1 (black) and the two different coumarin-containing channels (TRPV1-coumarin alone in red; 1xTRPV1coumarin +7xTRPV1wt in blue). Curves were fitted to a Boltzmann distribution of the form I = Imax/(1 + exp([zF(V-V0.5)/RT]), where z is the voltage dependency, V0.5 is the half-activation voltage, and Imax is the maximum current. Each curve represents the average of at least six different experiments performed at 20°C. Error bars correspond to standard errors of the mean (SEM). The structure of coumarin and tyrosine are depicted in wireframe. (e) Ten thousand frames were averaged and a threshold was set on the averaged image in order to define regions of interest (arrow indicates ROI). The scale bar corresponds to 5 µm. (f) The photon count was extracted from the original set of frames. Capsaicin incubation promotes a higher photon count distribution.
Figure 1—figure supplement 1

Two composites of epifluorescence images obtained from transiently transfected HEK-293T cells.
Cells were co-transfected with wild-type rTRPV1-YPF and rTRPV1-Y671coum. Scale bars correspond to 10 µm. Images correspond to the average of 40 frames (upper set) and 50 frames (lower set).
Figure 1—figure supplement 2
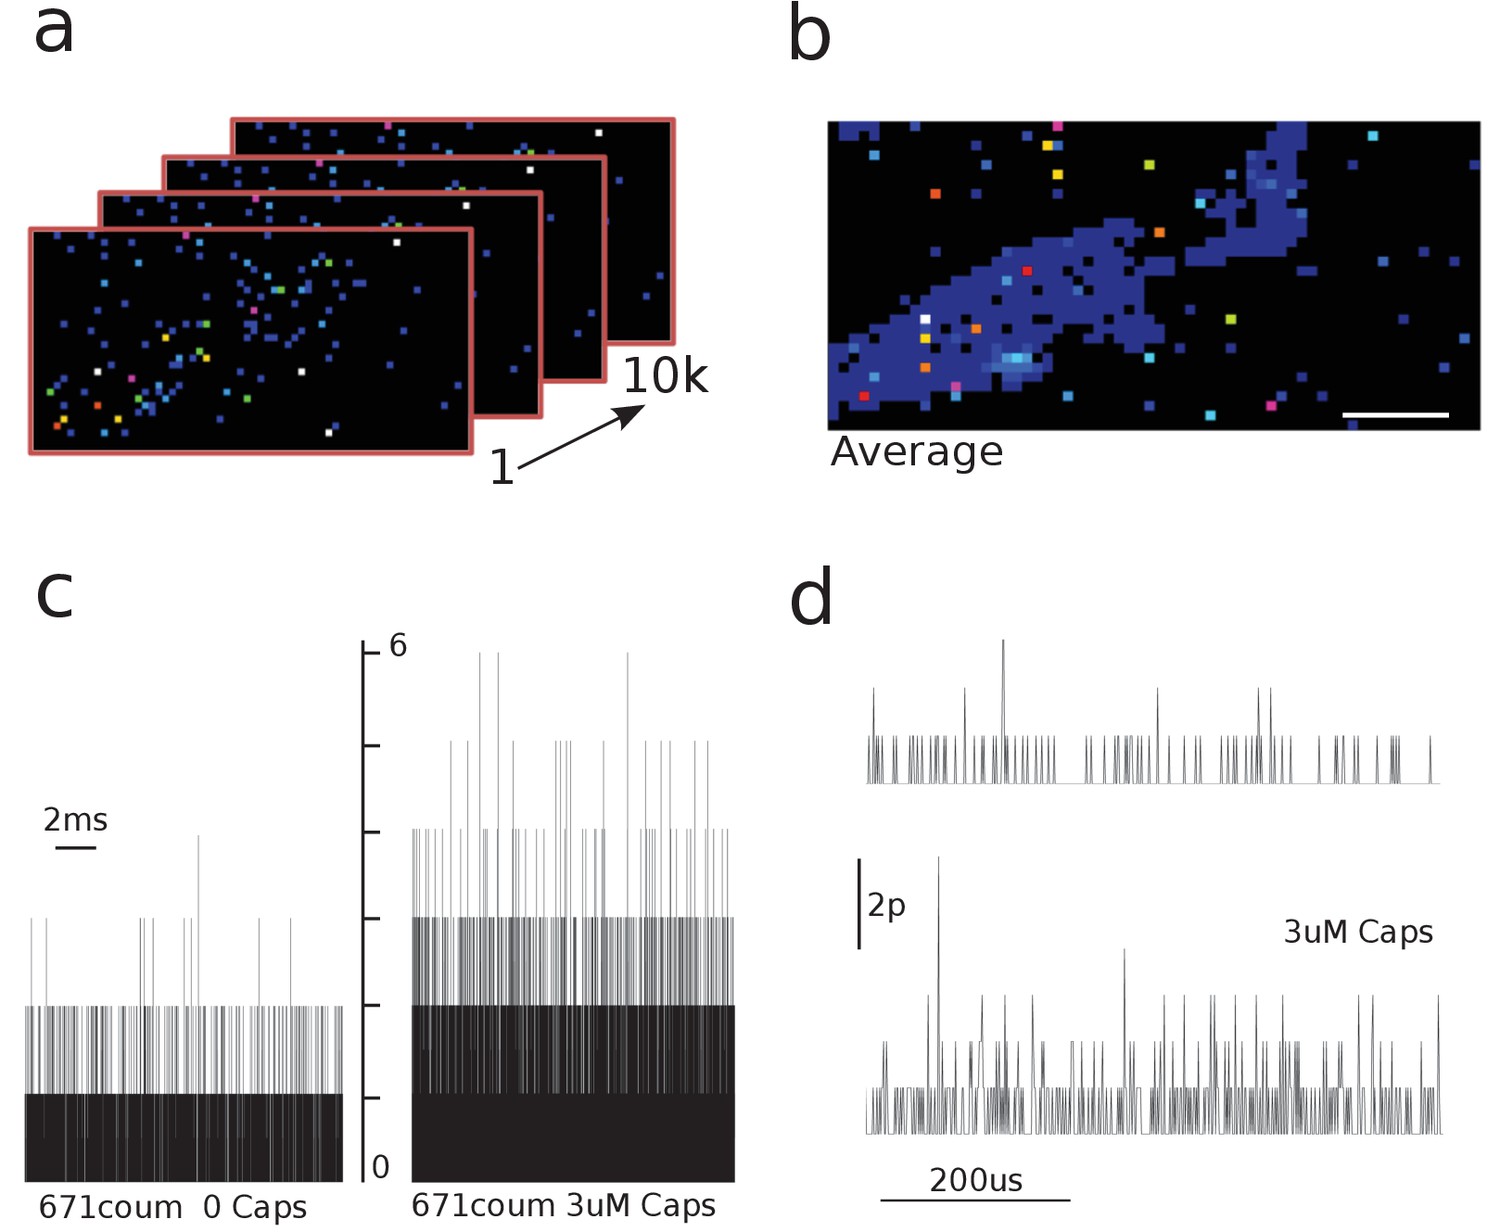
Capsaicin induces an increase in the photon count.
(a) 10, individual frames were taken with the 64 × 32 single-photon avalanche diode (SPAD) camera. (b) Images were averaged to identify cell area and regions of interest (ROIs). Scale bar represents 5 μm. (c) Raw traces of photon count recordings in the absence and presence of capsaicin. (d) Zoomed raw traces comparing background and coumarin-stimulated signals.
Figure 2
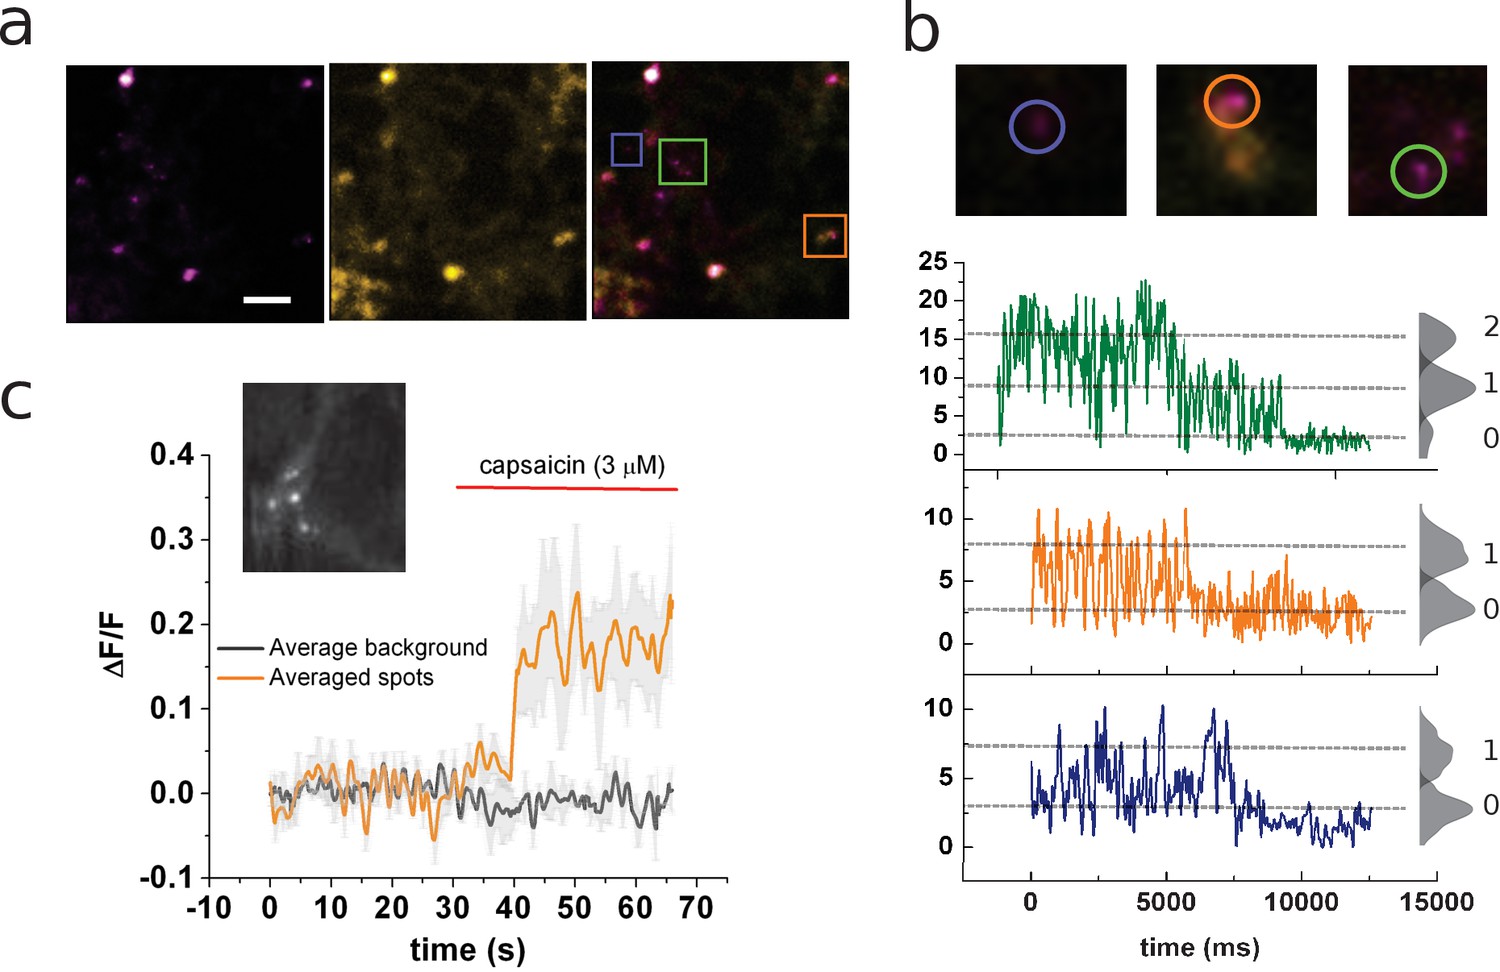
Identification of channels expressing a single coumarin emitter.
(a) Representative TIRF images of the 7:1 transfected cells. Images correspond to the average of 100 frames. Colocalization of coumarin diffraction-limited puncta with YFP signal is marked by colored squares. Scale bar corresponds to 2 µm. (b) Representative traces of photobleaching coumarin-positive spots. Top images correspond to the ROIs depicted in (a). Color-coded traces depict the time course of the fluorescence signal used later for the identification of individual spots that bleach on a single step. (c) Ensemble average of the signal recorded from multiple spots from the cell’s membrane shown in the inset. The image corresponds to the average of 80 frames taken on the coumarin channel (ex405nm/em450nm).
Figure 3 with 2 supplements
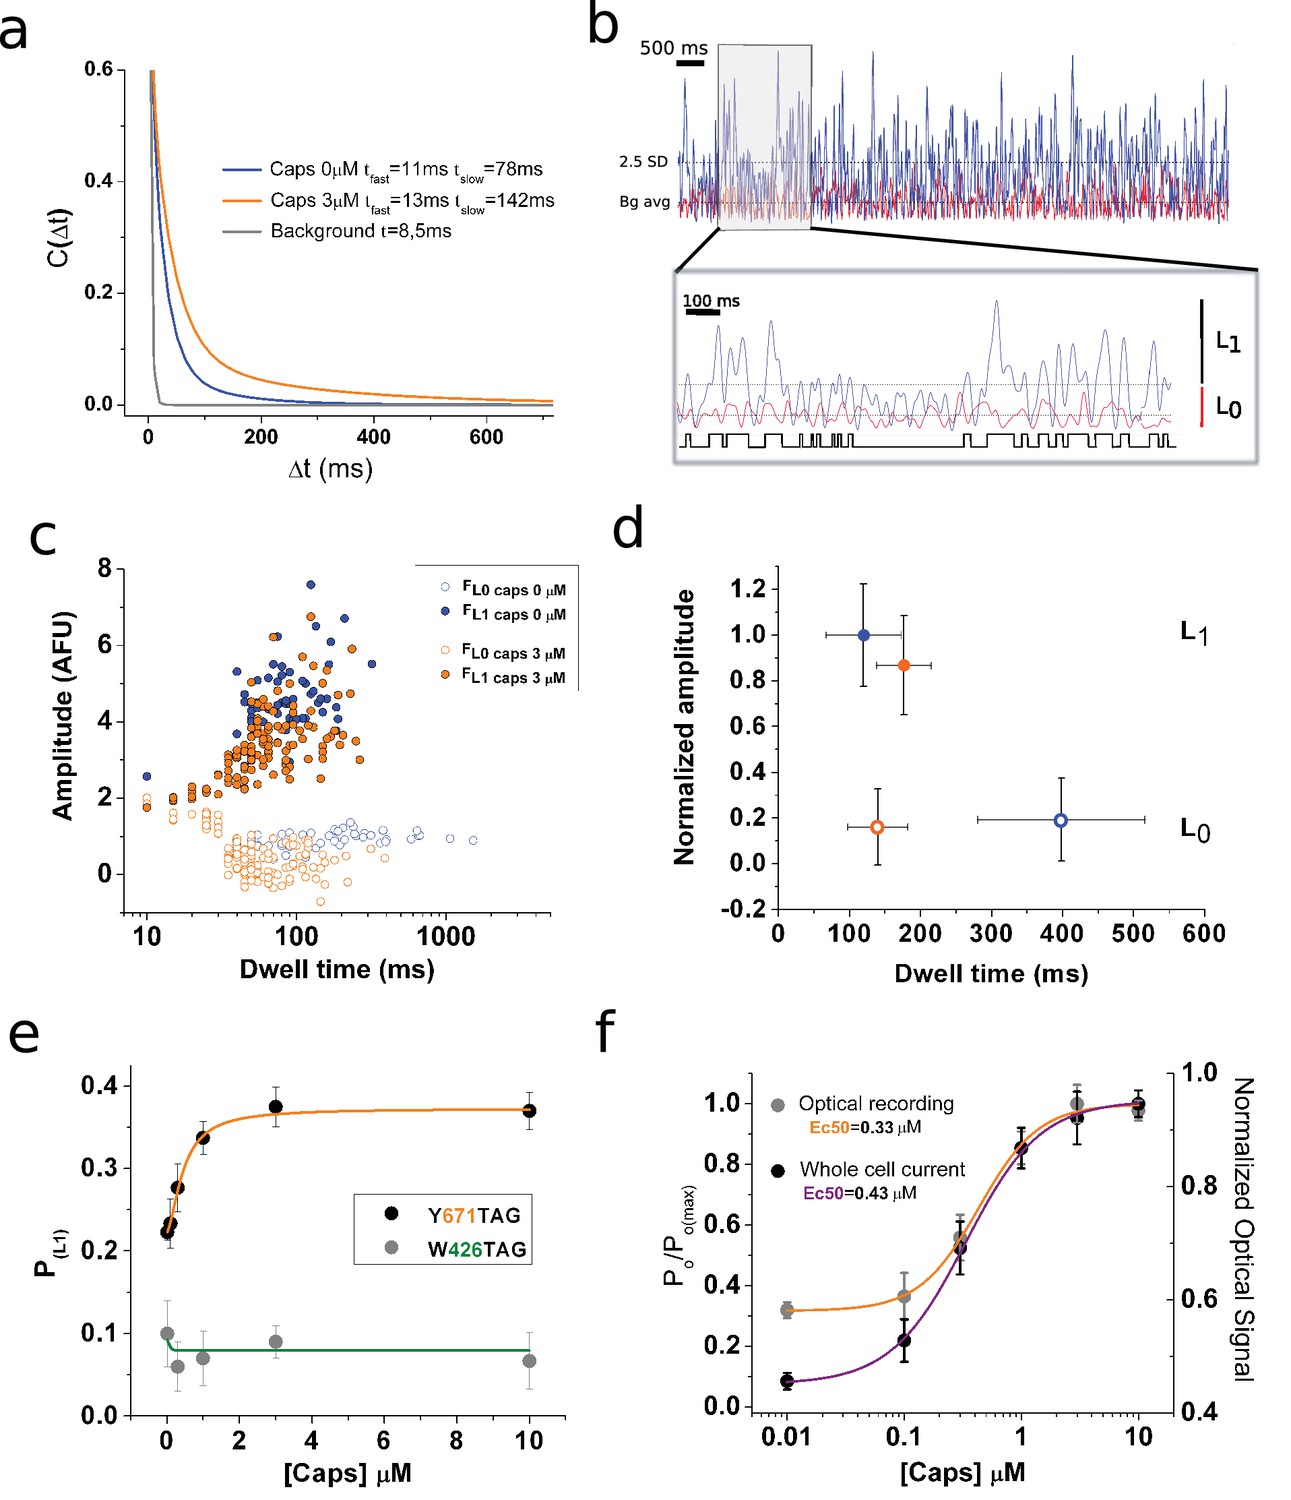
Optical studies of ion channel gating.
(a) Stationary noise of single spots, with each curve corresponding to the averaged fitted curves for the indicated conditions (n = 7, paired). The autocorrelation function was obtained for background (gray), capsaicin free (blue), and 3 μM capsaicin (orange). (b) Analysis of fluorescence fluctuations. Superimposed traces of capsaicin (blue) and background (red). The threshold for level one is highlighted (2.5 standard deviations [SD], dotted line). The gray box indicates the zoomed-in portion of the recording presented in the inset below, with the dotted lines indicating background average.. An idealization is shown in black. (c) Semi-log plot of the amplitude versus dwell-time shows a shortening of mean time L0. (d) Plot summarizing datasets of amplitude versus dwell time at 0 and 3 μM capsaicin (n = 5, paired). Error bars correspond to SEM. (e) Dose–response curve showing changes in the probability of level 1 (PL1), calculated from non-corrected fluorescence fluctuations, for the two positions tested for the indicated channel types expressing coumarin. (f) Normalized dose–response curves for background subtracted fluorescence fluctuations (orange) and whole-cell electrophysiological response (purple). The electrophysiological response was tested at −70 mV in the presence of the indicated concentrations of capsaicin. Error bars correspond to SEM.
Figure 3—figure supplement 1
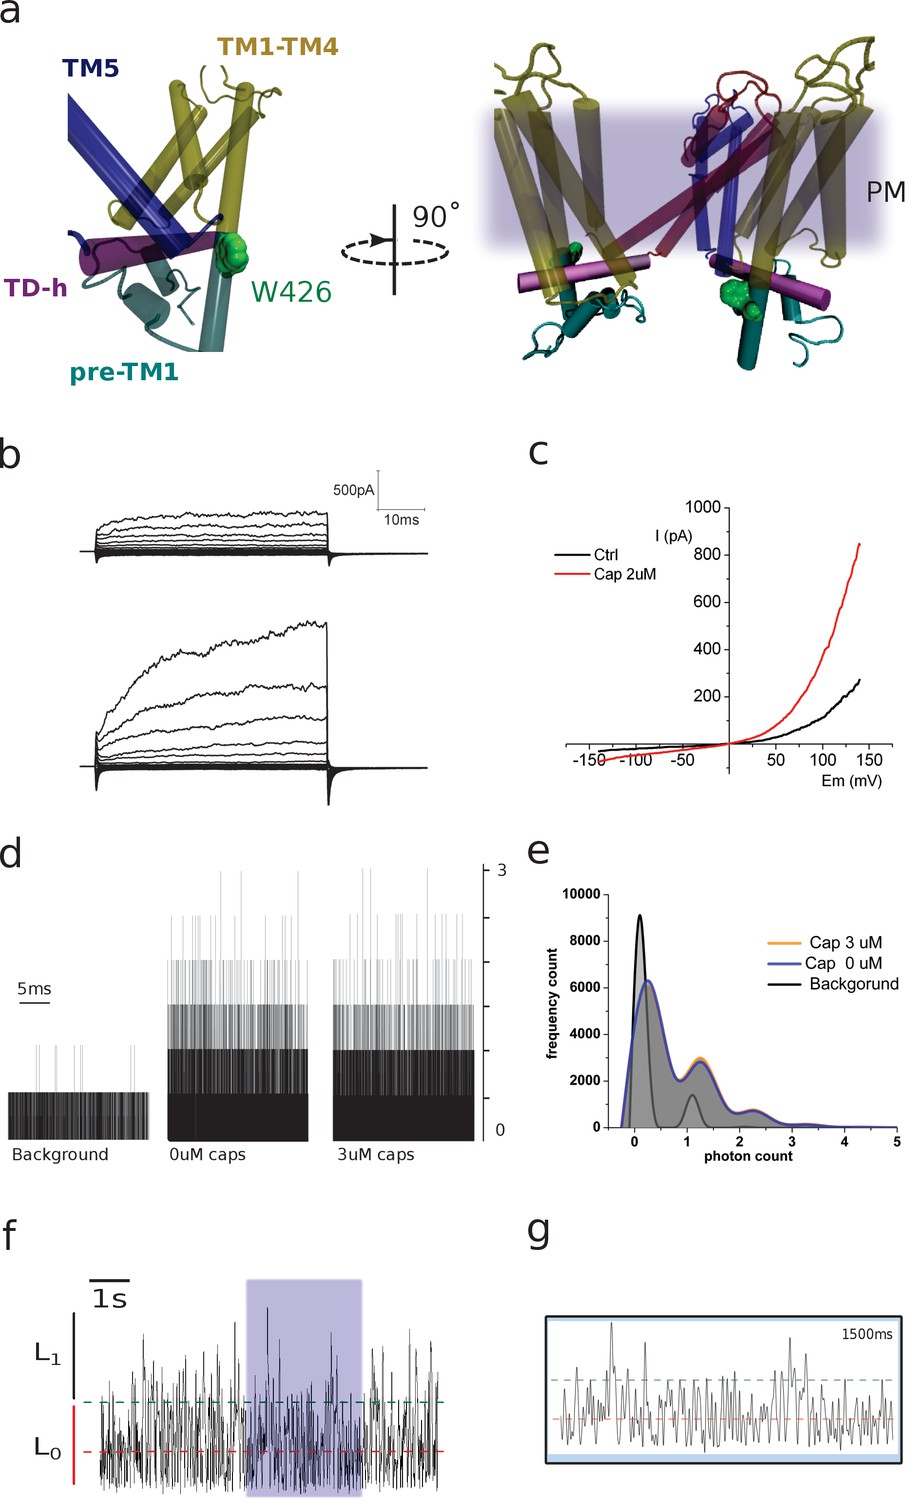
(a) Two lateral views showing the relative position of W426, located on the pre-TM1 region, outside the membrane. The different regions of the monomer are color coded as indicated. The image on the right depicts two subunits and the relative position of the channel with respect to the plasma membrane (diffuse gray). (b) Representative traces obtained from transiently transfected HEK-293T cells subjected to voltage steps from −180 mV to +180 mV in 20 mV increments. Traces correspond to non-stimulated and capsaicin-incubated conditions. (c) Current–voltage relationship for the conditions in b. (d) Raw traces of photon-count recordings in the absence and presence of capsaicin. (e) Capsaicin incubation does not affect photon-count distribution on 426coummutants. (f) Fluorescence fluctuations at 426coum. A signal trace is depicted and the background average indicated (red dashed line). The threshold for a single transition is highlighted (2.5 SD, green dashed line). (g) The purple-shaded box on panel f marks the zoomed-in portion of the recording shown here. Lines indicate background average and threshold. Time corresponds to the full zoomed signal inside the box.
Figure 3—figure supplement 2

Distribution of the whole data set obtained from the fluctuation analysis of the fluorescence signal.
Figure 4

Molecular dynamics simulations to calculate hydration of Y671.
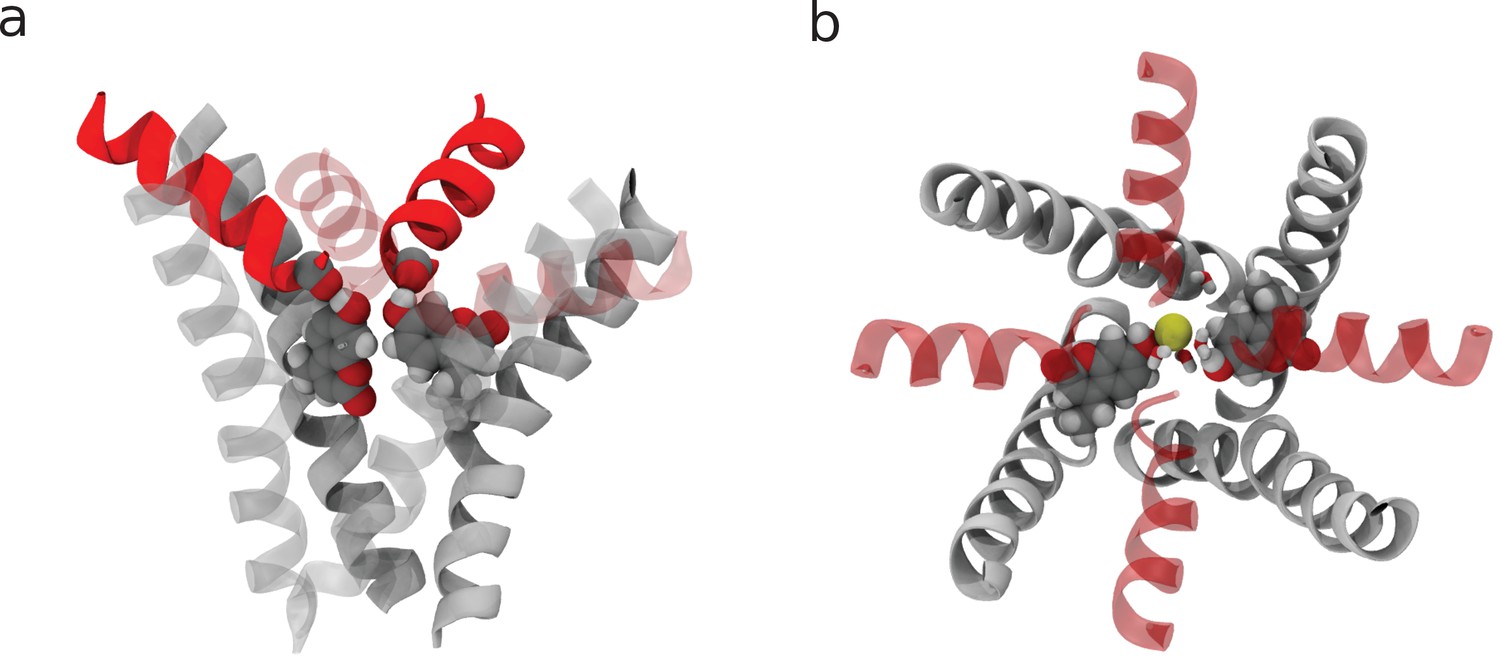
Molecular dynamics (MD) simulations of TRPV1 channels in the open (a) and closed (b) states. The upper and lower panels correspond to the side and top views of the S6 helices bundle (white), respectively. The pore helices (ph) are shown in blue. Y671 residues are represented as yellow sticks. In the open state, four Y671 residues create a ring oriented parallel to the membrane plane (perpendicular to the pore principal axis); whereas in the closed state, three of these residues do not interact with each other and are oriented perpendicular to the membrane plane (parallel to the pore principal axis). (c) Hydration of the channel central pore. Panel c shows the time evolution of the density profile (of water oxygens) along the pore. Specifically, at each time frame, the water oxygen atoms number density (i.e. the number of particles per unit of length) is calculated as a function of z (the axis of the pore). This quantity is shown using a color scale. Note that the units are Å−1 (the number density for a linear system has the dimensions of the inverse of a length). The left and right panels correspond to the closed and open states, respectively. The y-axis of the plot denotes the z-axis of the system (parallel to the channel central pore). The origin of the axis is set at the center of the pore domain transmembrane part. The Y671 residues are located at ~2.5 Å. Note that in the open state, the water density is often interrupted starting from ~280 ns, whereas in the closed state, this density is continuous. (d) Solvent-accessible surface area (SASA) of Y671. Black and red curves correspond, respectively, to SASA over time for the open (black) and closed (red) states as indicated. In the closed state, the Y671 SASA is approximately twice as large as that in the open state starting from ~300 ns. (e) The panels show zoomed view of the Y671 in the closed (left) and open (right) states. In the open state, Y671 establishes a hydrogen bond with the Y671 of the adjacent subunit; whereas in the closed state, this residue interacts with the backbone of F640 located at the pore helix. The backbone of the selectivity filter (SF) is shown using a stick representation.
Figure 5 with 1 supplement

Structural changes resulting from rearrangements in the selectivity filter region.
(a) Representation of the channel structures in the closed (left) and open (right) states. For clarity, only S6 (white) and pore helix (red) are shown for three subunits. The side chains of Y671 (at the upper gate) and I679, I675 (bottom gate) are highlighted using a stick representation and the permeant Na+ ions are shown as purple spheres. Blue shades show the average density of water molecules calculated along the MD trajectory. Note how the water density forms a continuum throughout the pore only when in the open state. (b) Proposed mechanism for the opening and closing of the upper gate: the rearrangement of the four planar groups of residue 671 from the ‘vertical’ to the ‘horizontal ring’ configuration is accompanied by a change in the tilt (with respect to the membrane plane) of the N-terminus section of S6 and of the pore-helix. In particular, the motion of the pore-helix regulates the effective pore radius at the level of the selectivity filter. The outward motion of both the pore helix and the aromatic at position 671 cause a reduction in water and ion accessibility. (c) Molecular structure sampled along the MD trajectory of the coumarin mutant in the closed and open states. For clarity, only S6 and the pore helix are shown with two of the four subunits rendered as gray shading. The coumarin moieties are highlighted using a space-filling representation. Left: closed state. The hydroxyl group of coumarin is able to establish the same H-bonding interactions with the carbonyl group of the pore-helix observed in the wild type. Right: open state. A permeant Na+ ion (yellow sphere) is shown together with its first solvation shell (sticks). Note how the hydroxyl groups from coumarin contribute to the shell of neighbors of the ion.
Figure 5—figure supplement 1
Additional views of the coumarin mutant structures.
(a) Side view of the closed state. Note how the hydroxyl group of coumarin H-bonds a carbonyl oxygen from the adjacent subunit. (b) Top view of the open state highlighting the ‘horizontal’ configuration of the coumarin moieties.
Additional files
Download links
A two-part list of links to download the article, or parts of the article, in various formats.
Downloads (link to download the article as PDF)
Open citations (links to open the citations from this article in various online reference manager services)
Cite this article (links to download the citations from this article in formats compatible with various reference manager tools)
Conformational dynamics in TRPV1 channels reported by an encoded coumarin amino acid
eLife 6:e28626.
https://doi.org/10.7554/eLife.28626


