Host proteostasis modulates influenza evolution
- Massachusetts Institute of Technology, United States
- Tufts University, United States
Figures
Figure 1 with 2 supplements

Chemical biology methods to modify the host cell’s proteostasis environment.
(A) Destabilized domain technology for stress-independent control of HSF1 activity with trimethoprim (TMP). (B) Dosable induction of HSF1 activity by increasing concentrations of TMP shown by increases in Hsp70 transcripts up to physiologically relevant levels; arsenite is a positive control for endogenous HSF1 activation. Transcript levels normalized to vehicle-treated MDCKYFP cells; error bars represent SEM between biological triplicates. (C) 10 nM STA-9090 does not induce a compensatory heat shock response (representative blot shown; N = 3). Figure 1—figure supplement 1. Validation of chemical biology tools used to perturb proteostasis. Figure 1—figure supplement 2. Heat shock protein transcript expression during influenza infection in modulated proteostasis environments.
Figure 1—figure supplement 1
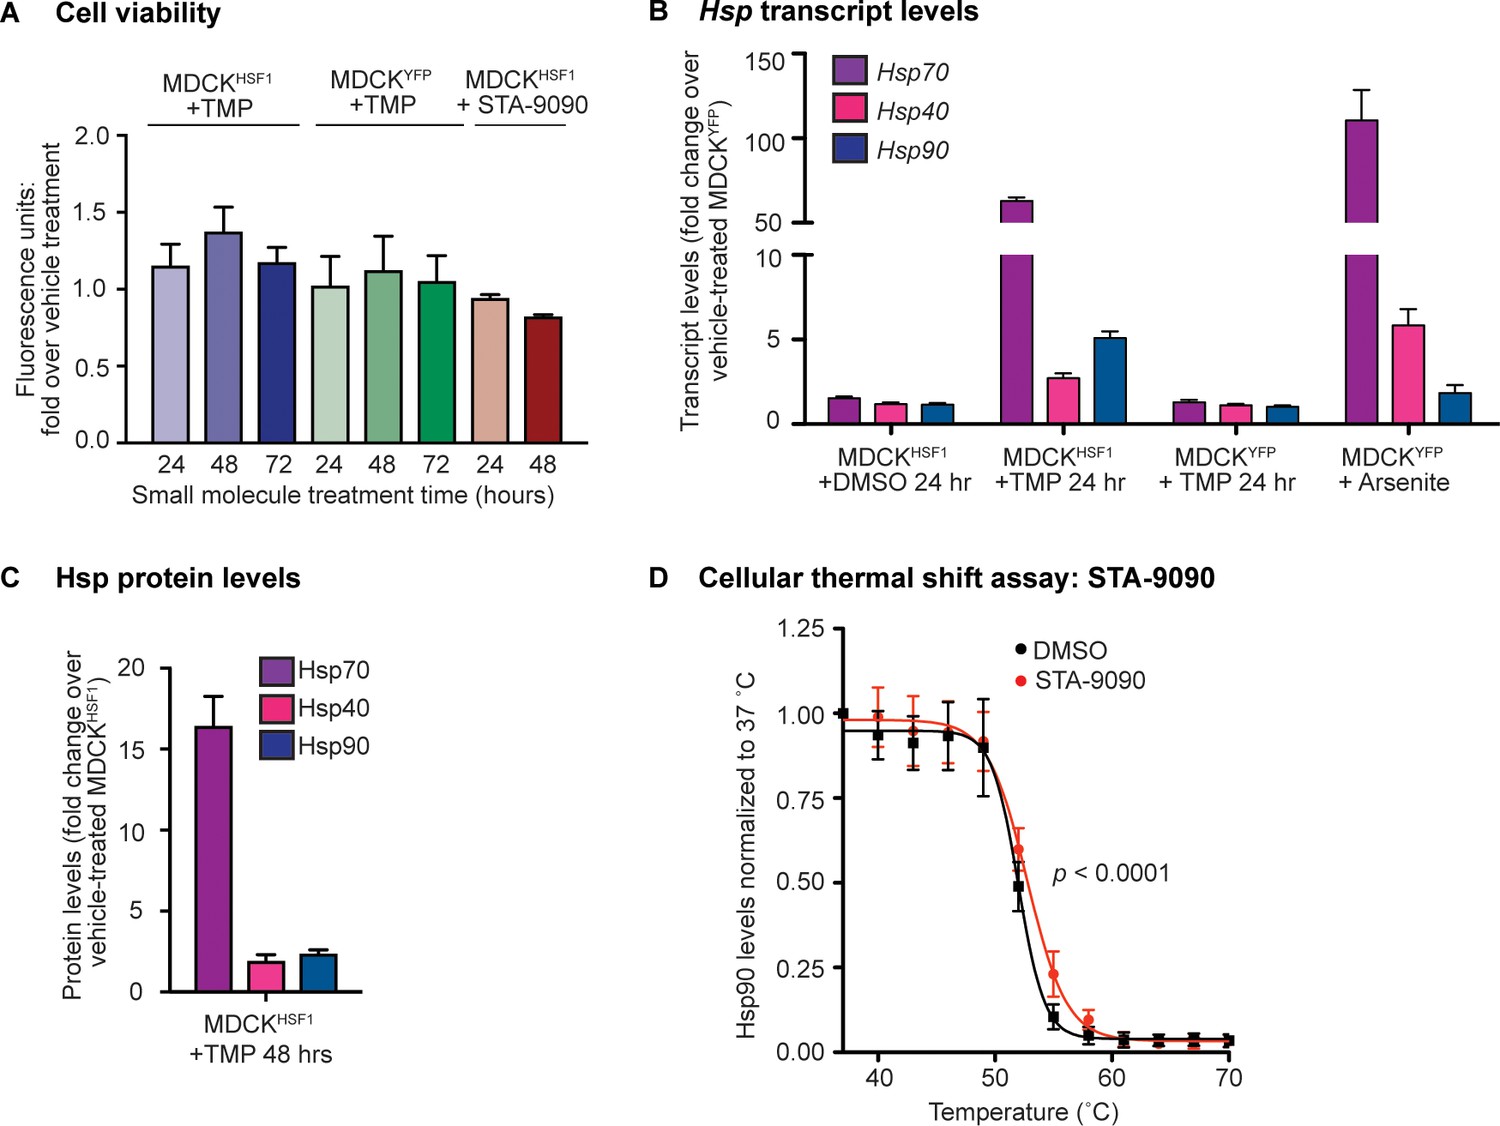
Validation of chemical biology tools used to perturb proteostasis.
(A) Resazurin assay shows that cells treated with small molecules (TMP for cHSF1 and YFP activation; STA-9090 for Hsp90 inhibition) have similar metabolic activity over the course of 72 and 48 hr, respectively, corresponding to the duration of pretreatment and mock-infection. The Y-axis represents the fold-change in fluorescence units relative to vehicle-treated cells; error bars represent SEM between biological triplicates. (B) Chaperone transcript levels in MDCKHSF1 cells (–/+10 μM TMP), relative to vehicle-treated MDCKYFP cells. A typical stress-induced heat shock response is illustrated upon treatment with 100 μM arsenite. The average of biological triplicates is plotted with error bars representing 95% confidence intervals. (C) Chaperone protein levels in HSF1-activated (+10 μM TMP) MDCKHSF1 cells, relative to vehicle-treated MDCKHSF1 cells. The average of biological triplicates is plotted with error bars representing SEM. (D) Cellular thermal shift assay demonstrates STA-9090-mediated Hsp90 stabilization. MDCKHSF1 cells were treated with 0.01% DMSO or 10 nM STA-9090 for 4 hr prior to heating. Error bars represent SEM between three biological replicates.
Figure 1—figure supplement 2
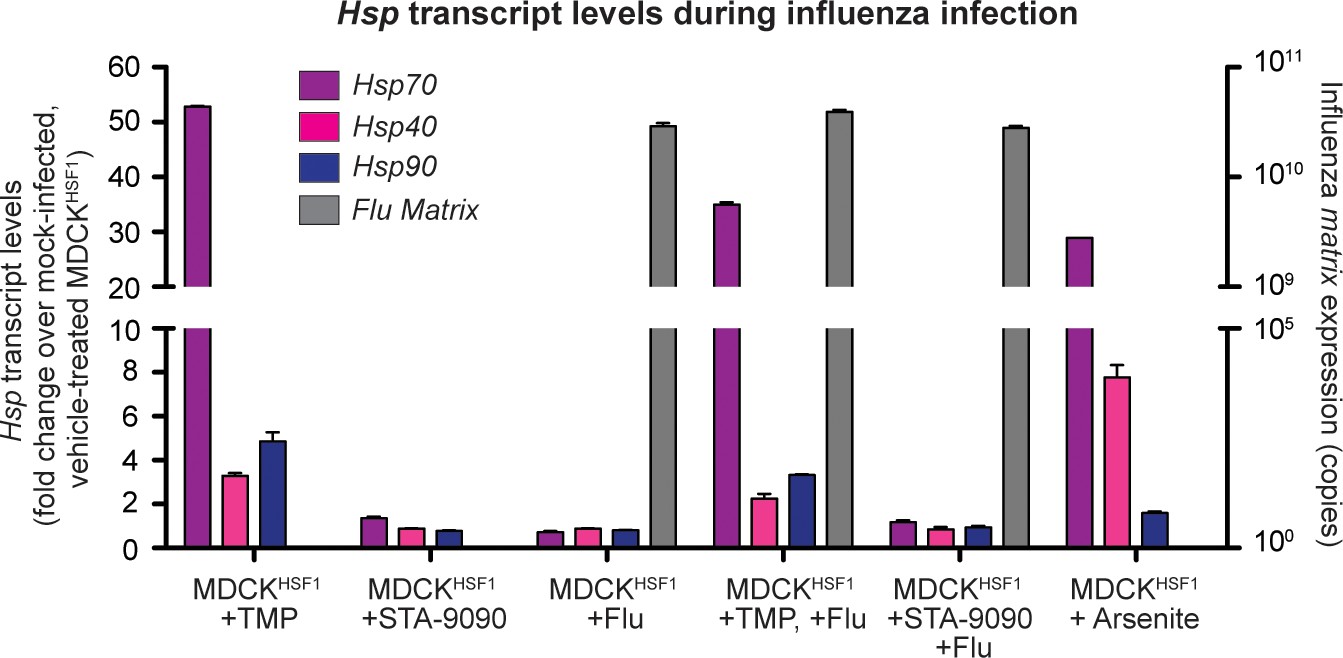
Heat shock protein transcript expression during influenza infection in modulated proteostasis environments.
Infections were performed at an MOI of 1 virion/cell; RNA was harvested 8 hr post-infection. 100 μM arsenite was used to induce the heat shock response as a positive control. A transcript encoding the influenza matrix, M, segment was used as a positive control for productive infection; copy number was determined by absolute qPCR. The average of biological triplicates is plotted with error bars representing 95% confidence intervals.
Figure 2
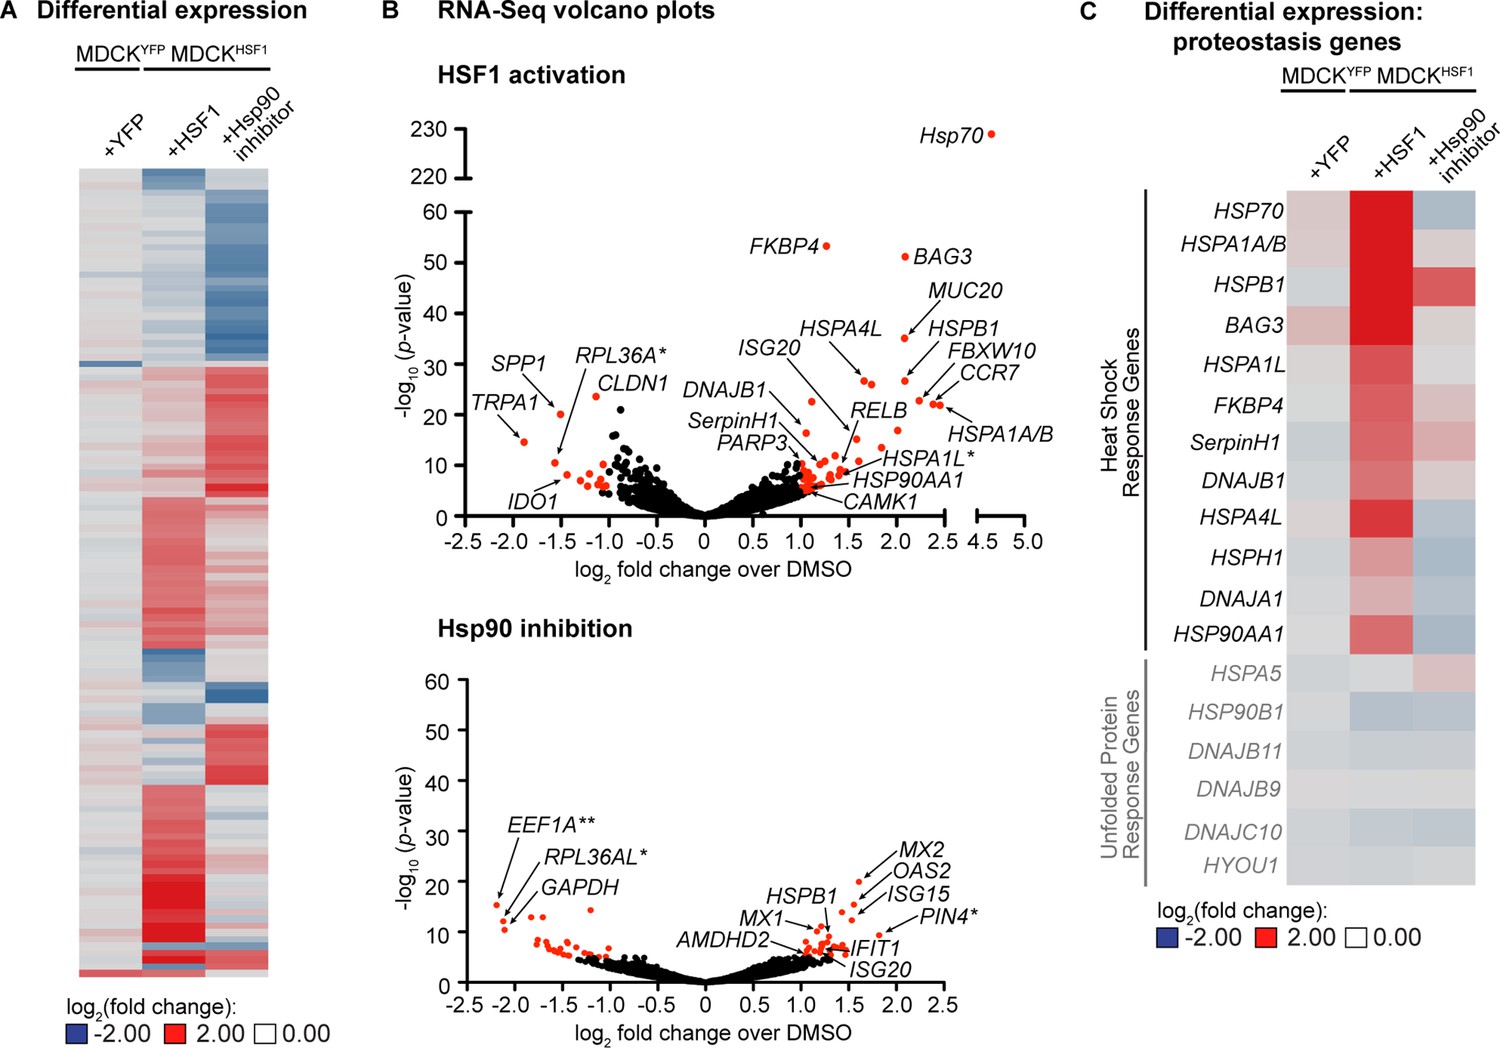
Transcriptomic analysis of perturbed host cell proteostasis environments.
(A) Differential expression analysis of MDCKHSF1 cells treated for 24 hr with 10 μM TMP (+HSF1) or 10 nM STA-9090 (+Hsp90 inhibitor) and MDCKYFP cells treated for 24 hr with 10 μM TMP (+YFP), normalized to vehicle treatment in the corresponding cell line. Transcripts displaying ≥2 fold changes in expression with p-values <10–5 for any of the treatments are included in the heat map (118 transcripts total). (B) Volcano plots showing the global distribution of expressed transcripts upon HSF1 activation or Hsp90 inhibition as in Figure 2A. Transcripts displaying ≥2 fold changes in expression with p-values <10–5 are shaded red. Outliers and transcripts encoding proteostasis network components, stress response genes, and transcription factor modulators are labeled. *=unannotated canine genes homologous to the indicated gene across multiple species; **=unannotated canine genes that fell within the indicated paralog gene family with partial homology. (C) Heat map showing the differential expression of heat shock response and unfolded protein response gene transcripts upon HSF1 activation or Hsp90 inhibition as in Figure 2A. Figure 2—source data 1. RNA-Seq characterization of MDCKHSF1 and MDCKYFP cells: quality control metrics. Figure 2—source data 2. RNA-Seq characterization of MDCKHSF1 and MDCKYFP cells: differential transcript expression. Figure 2—source data 3. RNA-Seq characterization of MDCKHSF1 and MDCKYFP cells: list of all transcripts displaying ≥2 fold changes in expression with p-values <10–5 for each treatment.
-
Figure 2—source data 1
RNA-Seq characterization of MDCKHSF1 and MDCKYFP cells: quality control metrics.
- https://doi.org/10.7554/eLife.28652.007
-
Figure 2—source data 2
RNA-Seq characterization of MDCKHSF1 and MDCKYFP cells: complete RNA-Seq datasets upon vehicle treatment, HSF1 activation, or Hsp90 inhibition in MDCKHSF1 cells and vehicle treatment or YFP activation in MDCKYFP cells.
- https://doi.org/10.7554/eLife.28652.008
-
Figure 2—source data 3
RNA-Seq characterization of MDCKHSF1 and MDCKYFP cells: list of all transcripts displaying ≥2 fold changes in expression with p-values <10–5 for each treatment.
- https://doi.org/10.7554/eLife.28652.009
Figure 3 with 1 supplement
Serial passaging of Influenza A/Wuhan/1995 H3N2.
(A) Serial passaging workflow in modified proteostasis environments in MDCKHSF1 cells. (B) Serial passaging workflow in control MDCKYFP cells. (C) Hemagglutination titers at intermittent passages for each folding environment; error bars represent SEM for biological triplicates. (D) Dn/Ds ratios for each viral population, normalized to the ratio of non-synonymous sites to synonymous sites in the influenza genome (3.5). Figure 3—figure supplement 1. Multiplicity of infection and hemagglutination titers during serial passaging.
Figure 3—figure supplement 1
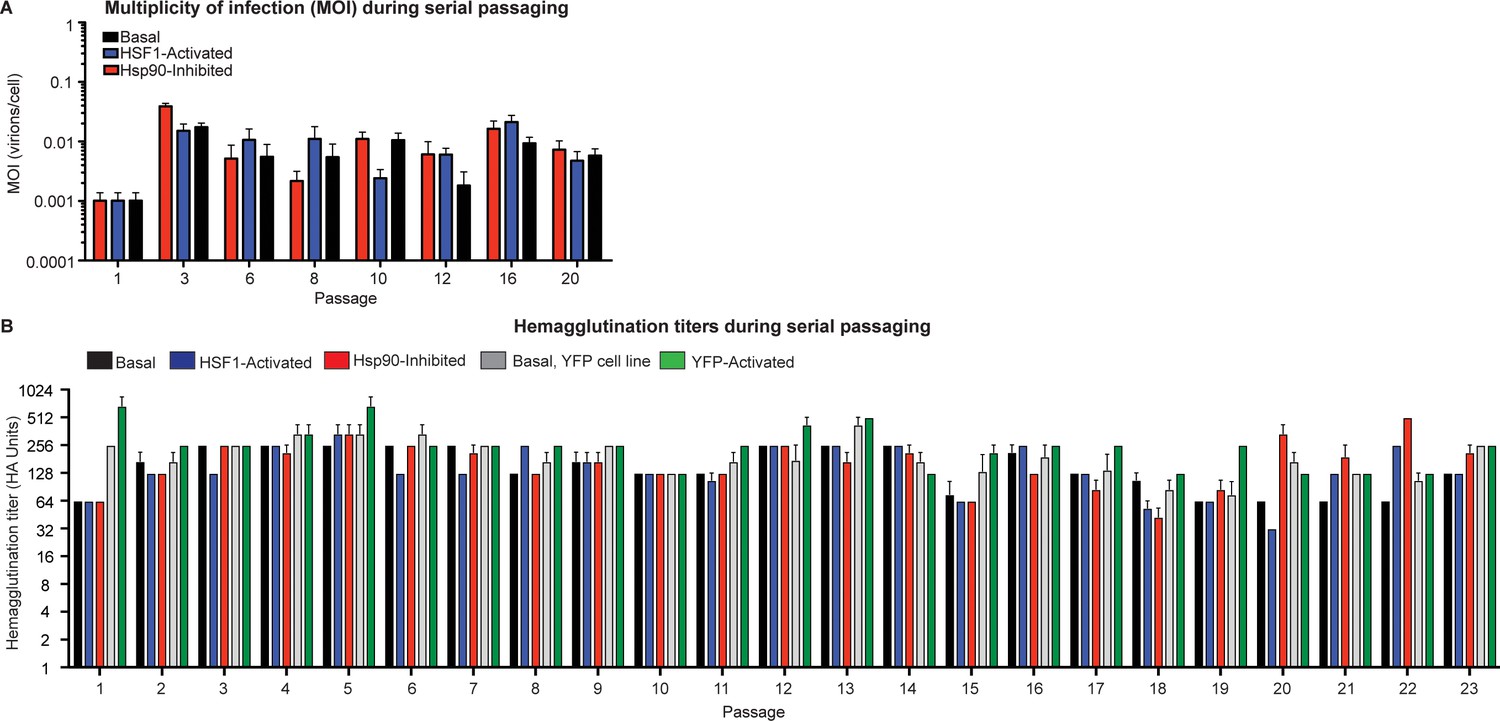
Multiplicity of infection and hemagglutination titers during serial passaging.
(A) Multiplicity of infection at intermittent passages during serial passaging, determined via a TCID50 assay. (B) Hemagglutination titers for each passage of serial passaging. Error bars represent SEM between biological triplicates.
Figure 4 with 1 supplement
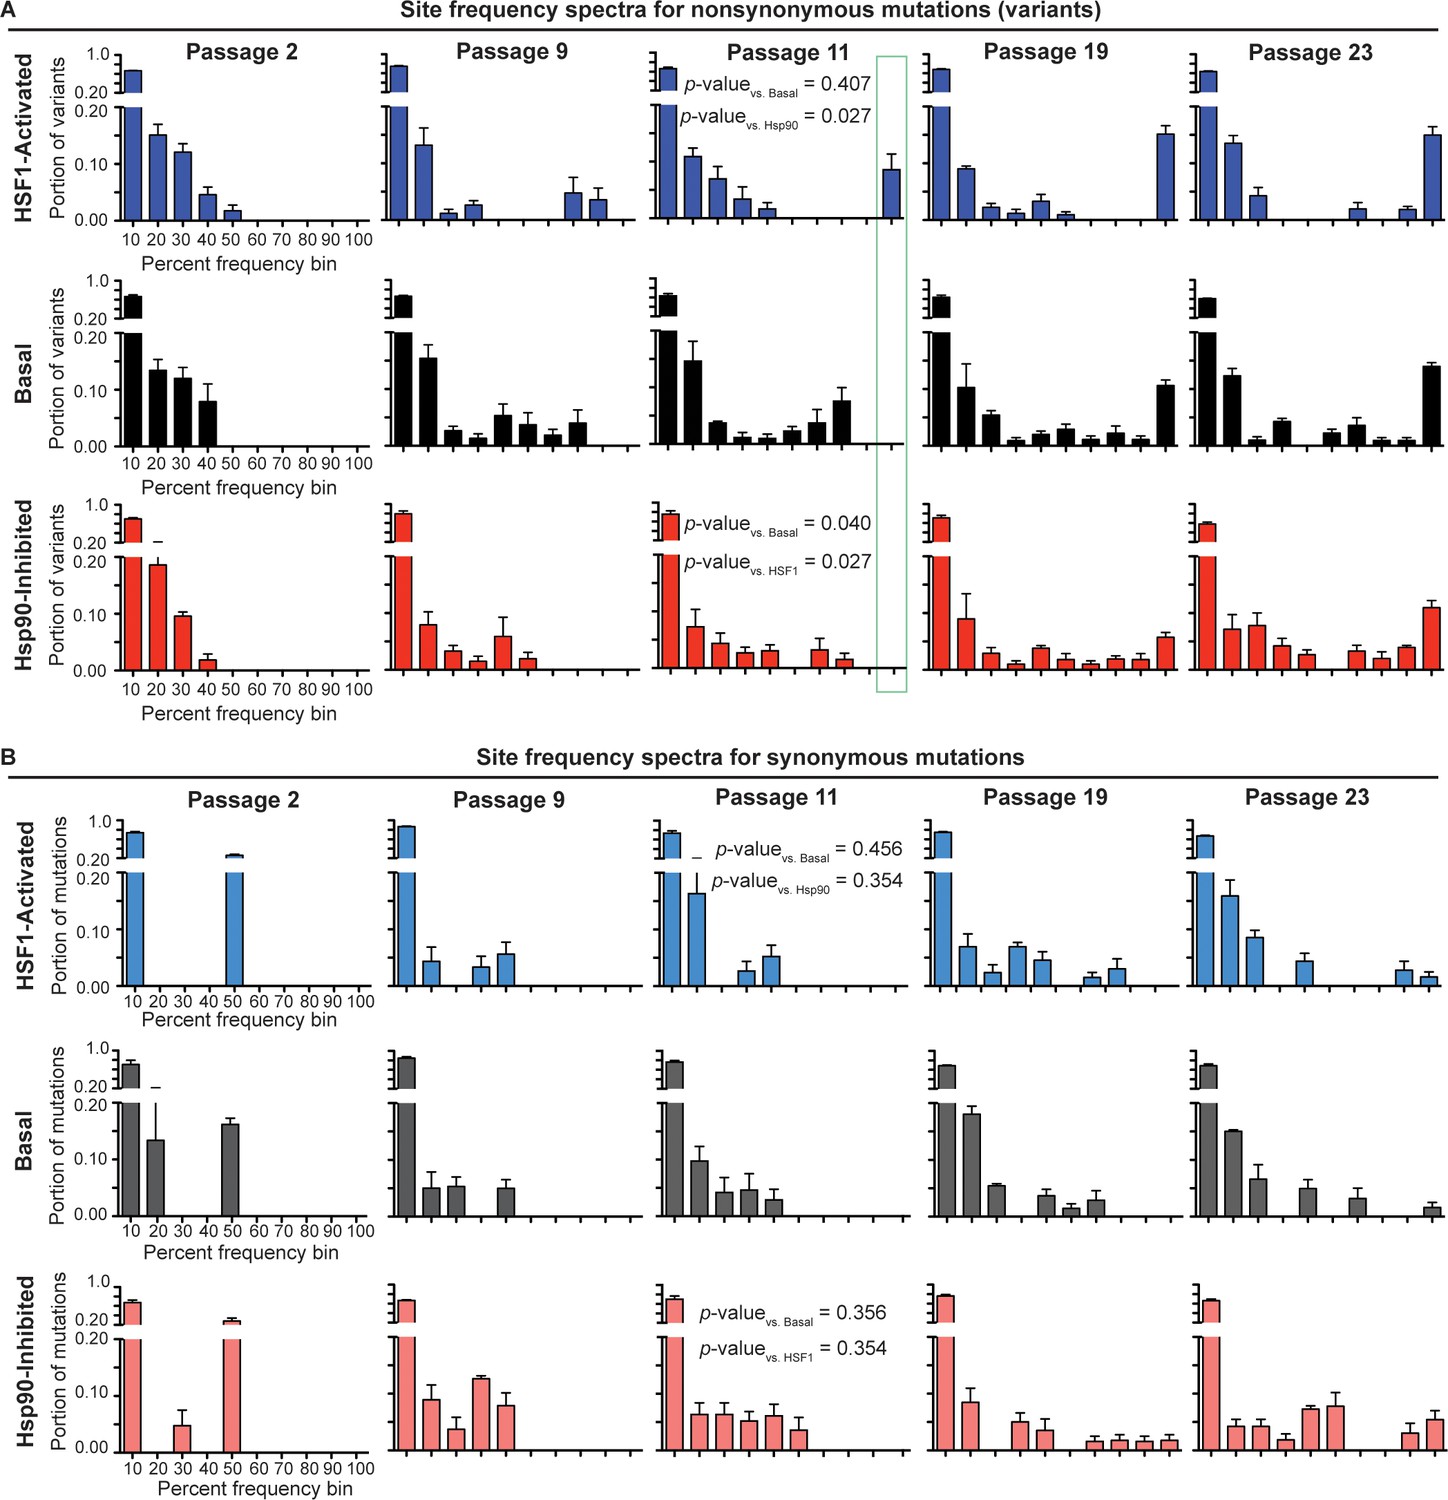
Site frequency spectra show frequency distribution of non-synonymous (A) and synonymous (B) mutations in a given folding environment at a particular passage.
Average between biological triplicates is plotted; error bars represent SEM. The Mann-Whitney test was used to compare the distributions of the SFS and assess statistical significance of these differences; resulting p-values are shown for passage 11 SFS. Figure 4—figure supplement 1. Trajectories for non-synonymous and synonymous mutations that increase in frequency during serial passaging. Figure 4—source data 1. List of ten highest % frequency non-synonymous mutations for each proteostasis environment and passage. Figure 4—source data 2. List of ten highest % frequency synonymous mutations for each proteostasis environment and passage.
-
Figure 4—source data 1
List of ten highest % frequency non-synonymous mutations for each proteostasis environment and passage.
- https://doi.org/10.7554/eLife.28652.014
-
Figure 4—source data 2
List of ten highest % frequency synonymous mutations for each proteostasis environment and passage.
- https://doi.org/10.7554/eLife.28652.015
Figure 4—figure supplement 1

Trajectories for non-synonymous (A) and synonymous (B) mutations that increase in frequency during serial passaging.
Trajectories are grouped by biological replicate and color-coded by gene segment.
Figure 5
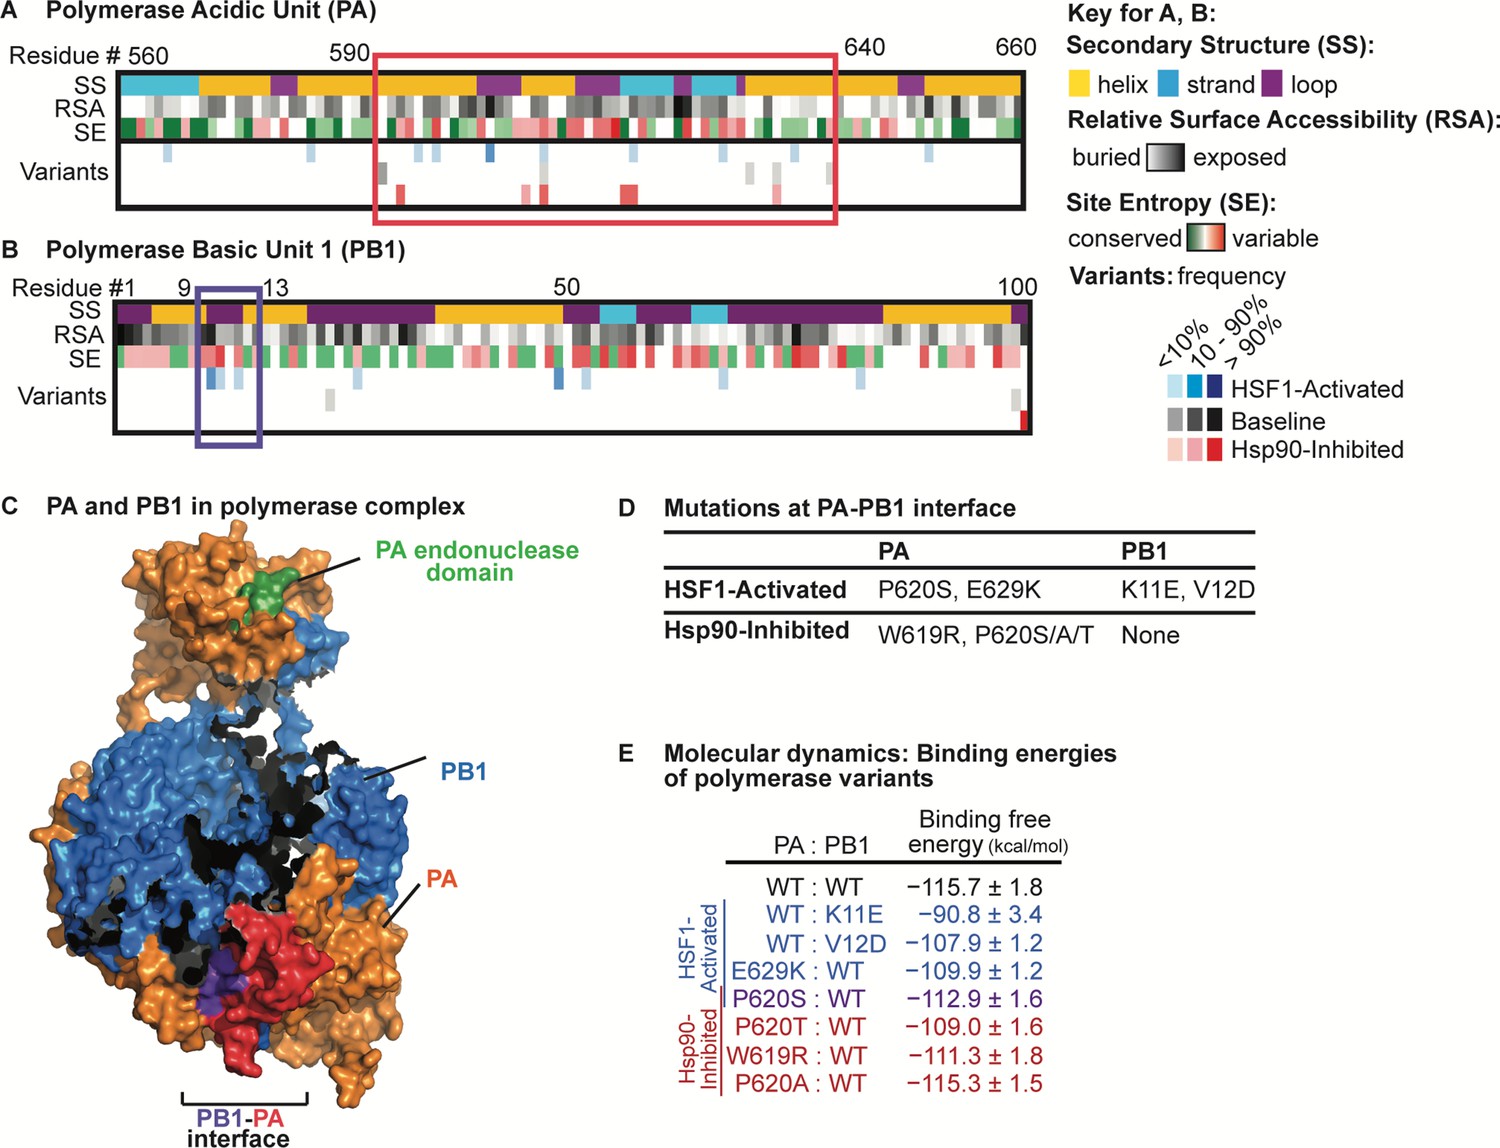
Analysis of non-synonymous mutations observed in distinctive proteostasis environments.
Aligned variants were observed in any of three biological replicates. (A) Alignment of PA variants to secondary structure, relative surface accessibility, and site entropy. Residues 560–660 are shown, highlighting a mutational hotspot that occurs in all proteostasis environments outlined in red. (B) Alignment of PB1 variants to secondary structure, relative surface accessibility, and site entropy. Residues 1–100 are shown, highlighting a mutational hotspot observed only when HSF1 is activated outlined in purple. (C) Mutational hotspots mapped onto the PA-PB1 complex crystal structure (PDBID 4WSB) (Reich et al., 2014). PA hotspot is shaded red; PB1 hotspot is shaded purple. (D) List of amino acid substitutions likely to affect PA-PB1 binding that appear in the HSF1-activated and/or Hsp90-inhibited environments. (E) Binding free energy* of the PAC–PB1N complex (kcal/mol; calculated as the contribution (PAC–PB1N complex) – contribution (PAC) – contribution (PB1N)). Binding free energies shown for simulations with wild-type and mutant subunits; reported error is SEM. *Excludes contribution from solute configuration entropy. Figure 5—source data 1. Energy contributions from molecular dynamics simulations.
-
Figure 5—source data 1
Molecular Dynamics Simulations: Energy Contributions.
*Excludes contribution from solute configuration entropy.
- https://doi.org/10.7554/eLife.28652.017
Figure 6
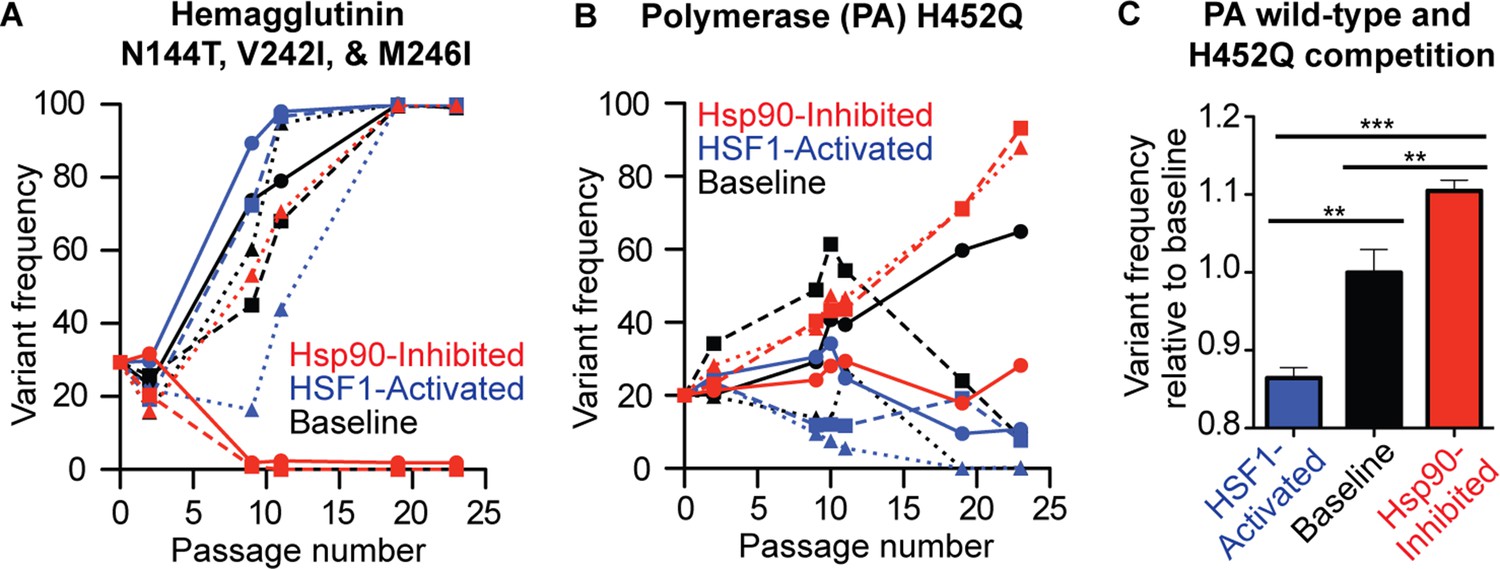
HA and PA display divergent mutational trajectories in HSF1-activated versus basal versus Hsp90-inhibited environments.
(A) Mutational trajectories of HA variants for each biological replicate in all three proteostasis environments; note that the N144T, V242I, and M246I variants all have identical trajectories. (B) Mutational trajectories of the PA H425Q variant for each biological replicate in all three proteostasis environments. (C) Reverse genetics competition between H452Q and wild-type PA in each proteostasis environment. Average variant allele frequency was normalized to that in the basal proteostasis environment. SEM for biological triplicates is shown. Statistical significance was calculated using a Student’s t-test.
Additional files
-
Supplementary file 1
Primer sequences for qPCR and PA sequencing.
- https://doi.org/10.7554/eLife.28652.019
-
Transparent reporting form
- https://doi.org/10.7554/eLife.28652.020
Download links
A two-part list of links to download the article, or parts of the article, in various formats.
Downloads (link to download the article as PDF)
Open citations (links to open the citations from this article in various online reference manager services)
Cite this article (links to download the citations from this article in formats compatible with various reference manager tools)
Host proteostasis modulates influenza evolution
eLife 6:e28652.
https://doi.org/10.7554/eLife.28652


