Combining robotic training and inactivation of the healthy hemisphere restores pre-stroke motor patterns in mice
- CNR Neuroscience Institute, Italy
- Scuola Normale Superiore, Italy
- The BioRobotics Institute, Italy
- Center for Neuroprosthetics and Institute of Bioengineering, Switzerland
Figures
Figure 1 with 1 supplement
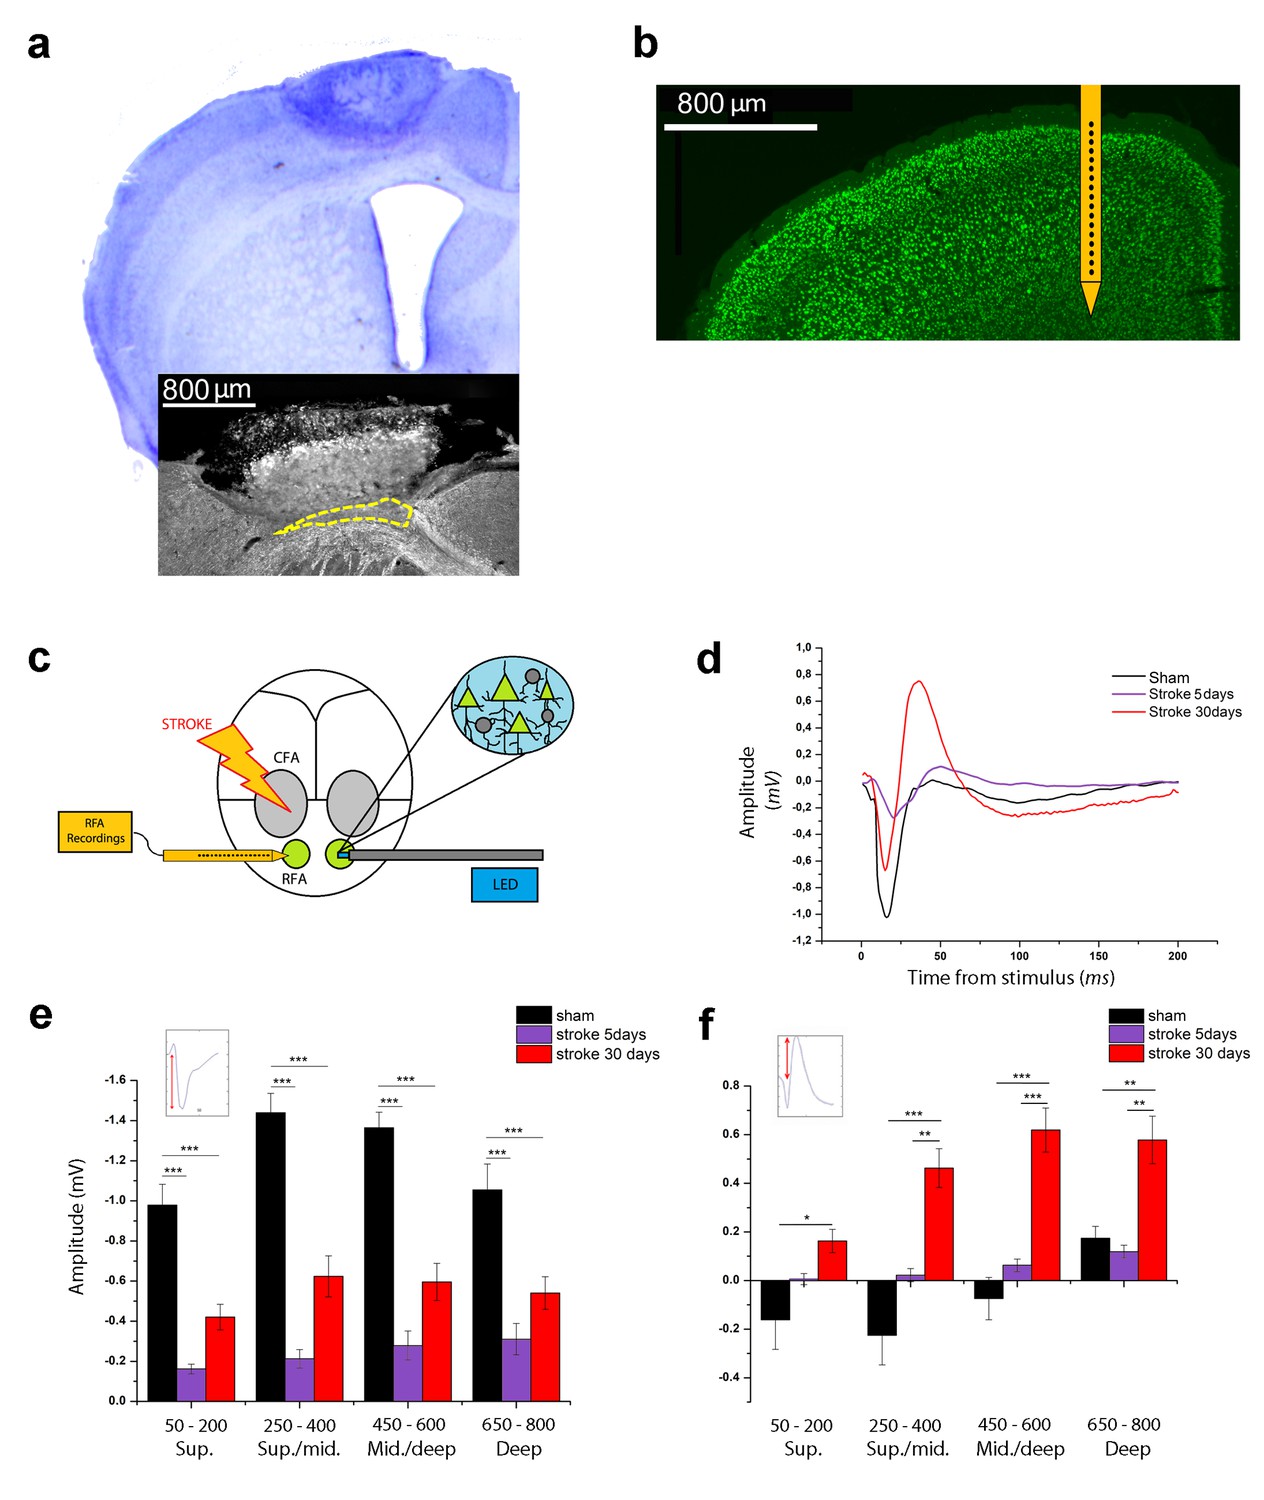
Optogenetic assessment of alterations in transcallosal connectivity between homotopic premotor areas after stroke.
(a) Top: representative Nissl staining of a brain coronal section including the ischemic lesion. Bottom:example of MBP staining in a mouse with partial callosal lesion (indicated by dashed line). (b) Representative NeuN immunostaining of a coronal section indicating the position of the recording electrode in the RFA. (c) Schematic of the experimental protocol. Green triangles represent ChR2-expressing pyramidal neurons activated by blue light. (d) Representative Field Potential response in layer V of the RFA in sham (Black) and ischemic animals at 5 (Purple) and 30 (Red) days post stroke after single pulse stimulation in the contralateral RFA. (e, f) Mean amplitude of the early negative (e) and late positive (f) components of evoked field potentials in sham (Black) and ischemic animals at 5 (Purple) and 30 (Red) days post stroke. The inset illustrates quantification of the baseline-to-peak amplitude. The early component is smaller in ipsilesional RFA of stroke animals while the late positive waveis significantly higher at 30 days with respect to controls across all cortical layers (Two-way Anova, followed by Holm-Sidak test, *p<0.05; **p<0.01; ***p<0.001 between groups). Results from adjacent channels (depths) were pooled to show responses in superficial (Sup), Sup/Middle, Middle/deep and Deep layers. Data are mean ±SE.
-
Figure 1—source data 1
Mean and SEM are presented for the data in Figure 1.
- https://doi.org/10.7554/eLife.28662.005
Figure 1—figure supplement 1
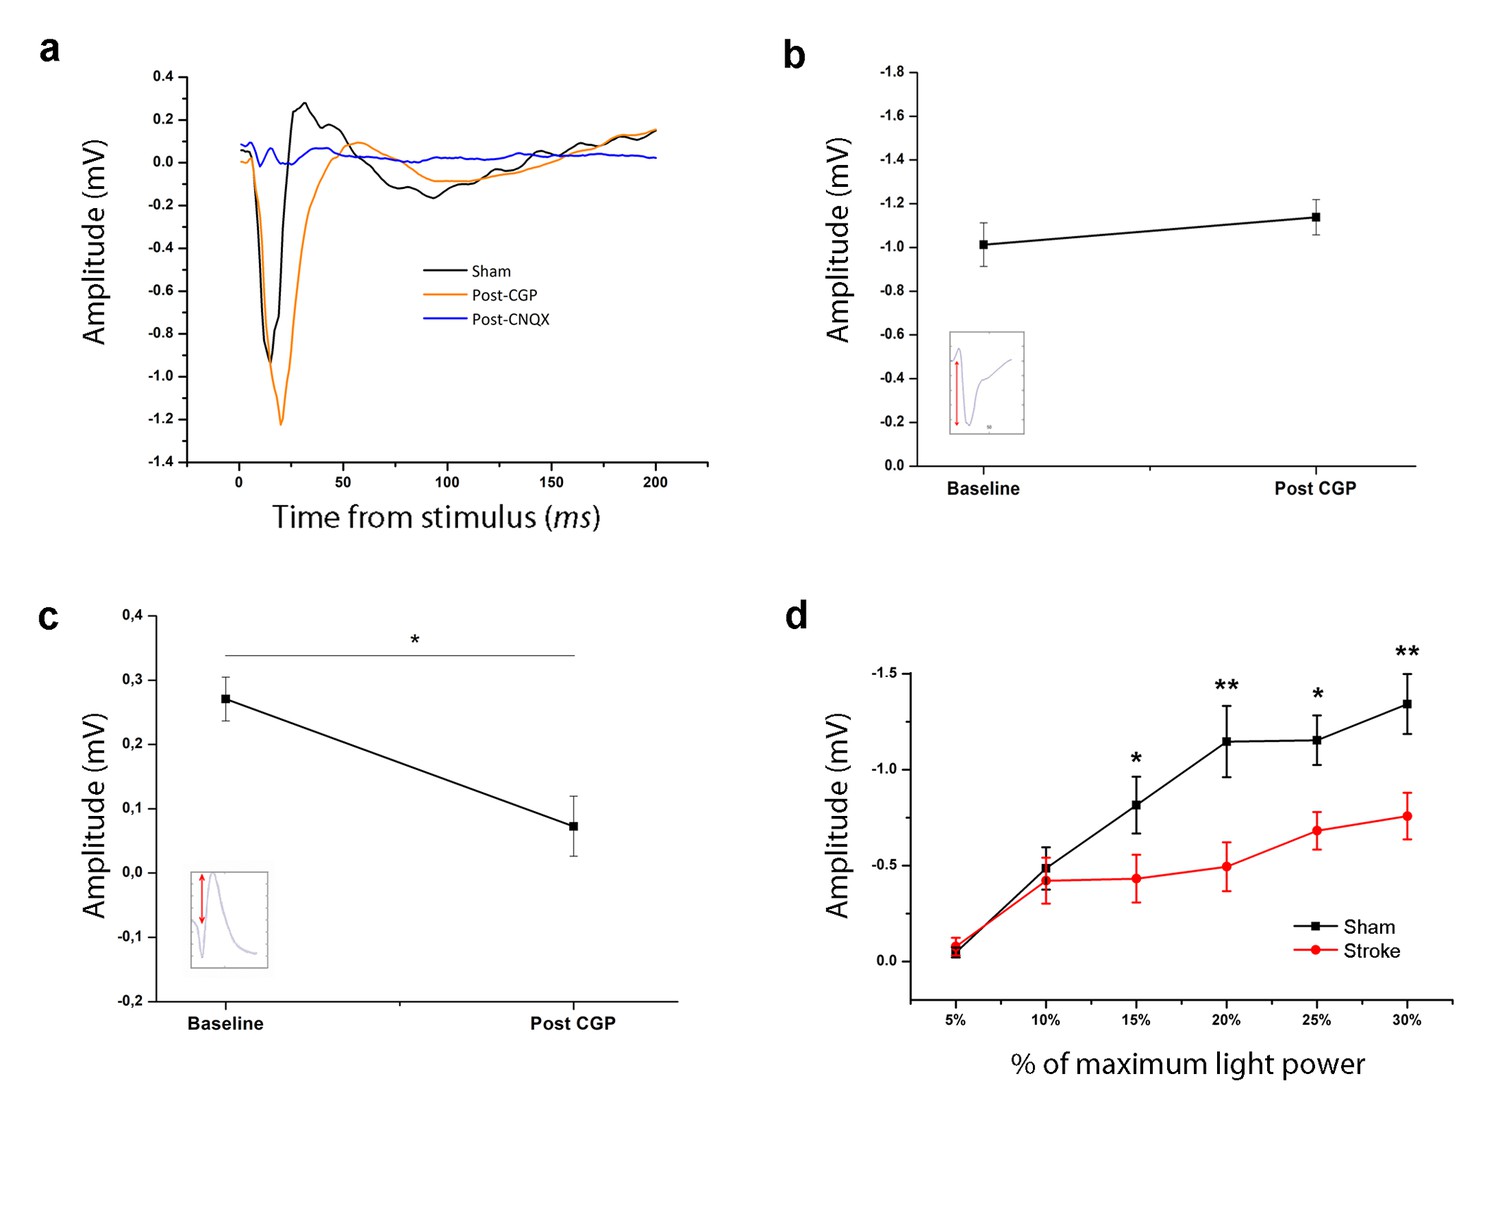
Pharmacological dissection and light-dependency of the evoked Field Potential.
(a) Representative layer V Field Potential (FP) response recorded in the RFA of a healthy animal in baseline conditions (Black), and 30 min after topical application of 2 µl of either CGP 55845 10 µM (Orange) or CNQX 1 mM (Blue). (b, c) Amplitude of the first negative (b) and late positive component (c) of the FP recorded in healthy mice before and after CGP application in a deep electrode (Layer V, *p<0.05 Paired T-Test). (d) Mean amplitude of the first negative component recorded in sham animals (Black) and in the injured hemisphere of stroke mice (Red) in response to contralateral light stimulation with increasing percentage of the maximum light power (10 mW). The field amplitude increased with light power intensity in both groups but after stroke the slope was lower. *p<0. 05, **p<0.01 (Two-way Repeated Measures Anova, followed by Tukey test, sham vs stroke). Data are mean ±SE.
-
Figure 1—figure supplement 1—source data 1
Mean and SEM are presented for the data in Figure 1—figure supplement 1.
- https://doi.org/10.7554/eLife.28662.004
Figure 2
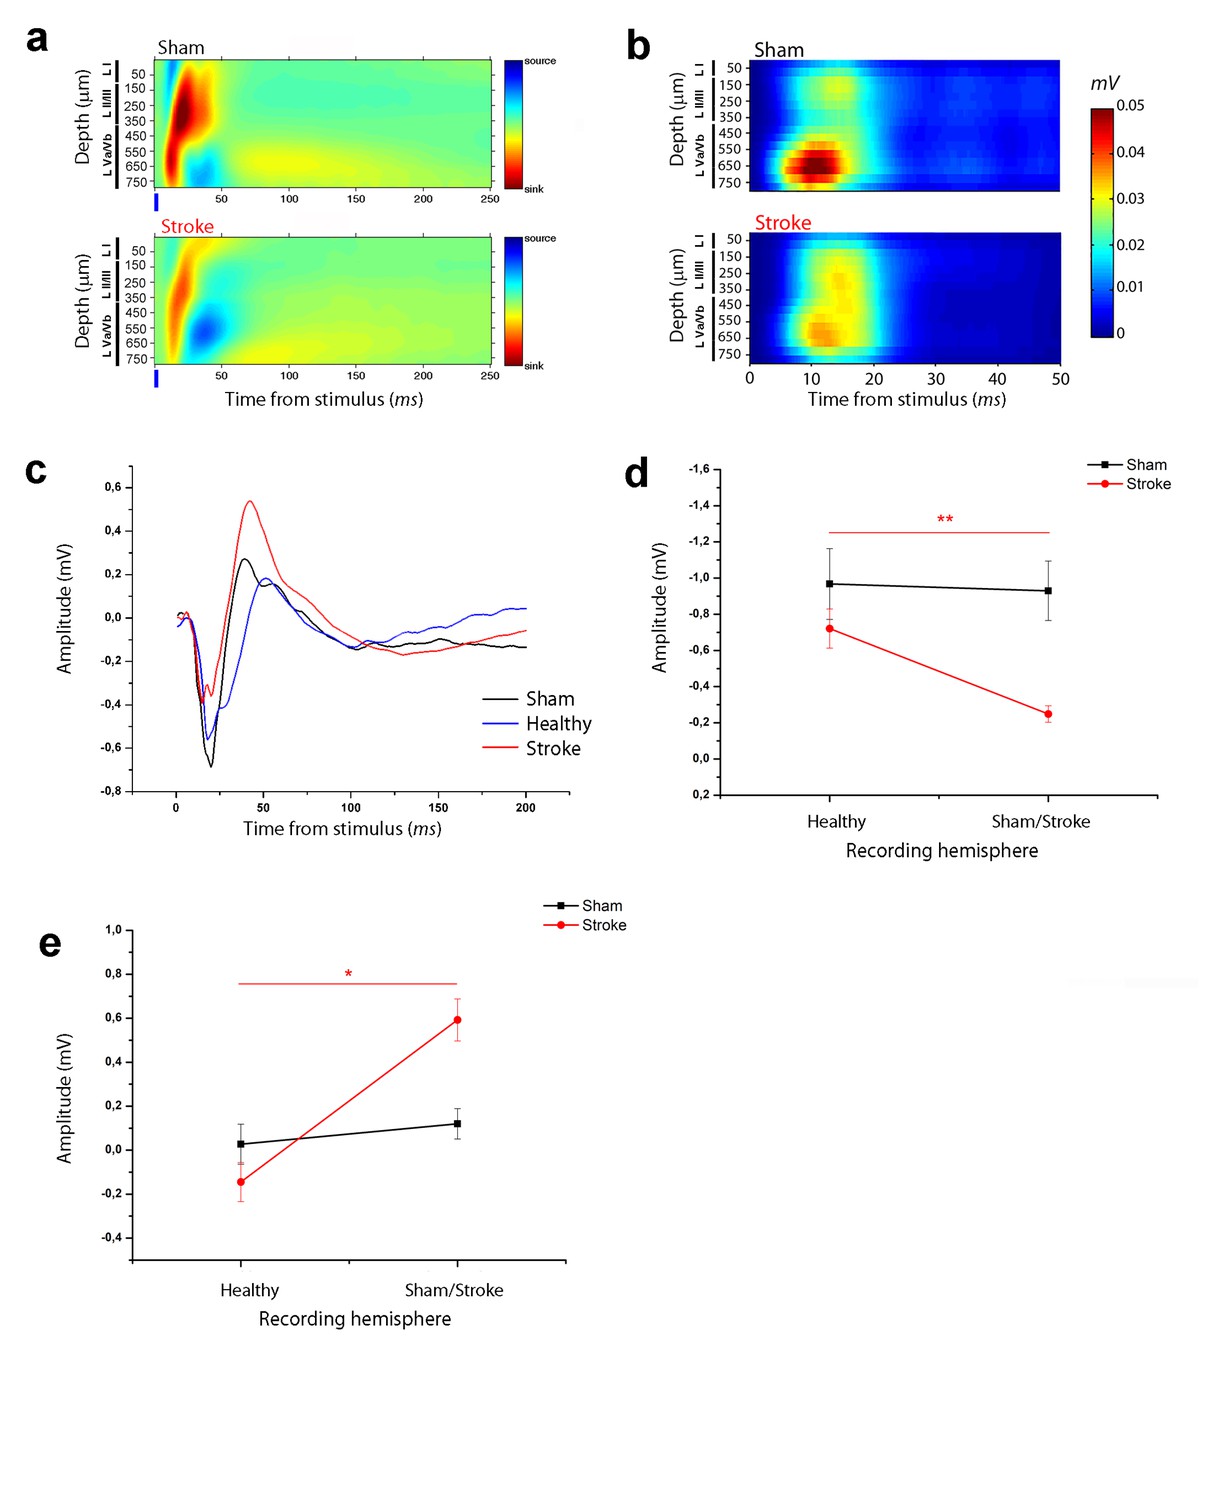
Asymmetry in functional transcallosal connectivity in stroke animals.
(a) Current source density (CSD) analysis of the cortical field potential response to optogenetic stimulation, in naïve (top) and stroke mice (bottom). Warm colours (yellow and red) represent current sinks and cool colours (dark and light blue) represent current sources. Blue bars represent the light pulse. Roman numerals indicate cortical layers. (b) Multi Unit Activity (MUA) triggered by single-pulse stimulation across all cortical layers in the target hemisphere in sham (top) and stroke (bottom) mice. Please note the lower MUA values in infragranular layers of stroke animals with respect to controls. (c) Representative Field Potential (FP) response recorded in layer V of the ipsilesional (Red) and contralesional cortex (Blue) of a stroke animal after transcallosal stimulation. The field response in a control, naïve animal (Black trace) is reported for comparison. (d, e) Amplitude of the first negative (d) and late positive component (e) of the FP recorded in the healthy hemisphere (Healty) after stimulation of the stroke side and vice versa (Sham/Lesioned). Note the robust asymmetry in interhemispheric communication in stroke mice. Paired T test, *p<0.05; **p<0.01.
-
Figure 2—source data 1
Mean and SEM are presented for the data in Figure 2.
- https://doi.org/10.7554/eLife.28662.007
Figure 3 with 2 supplements
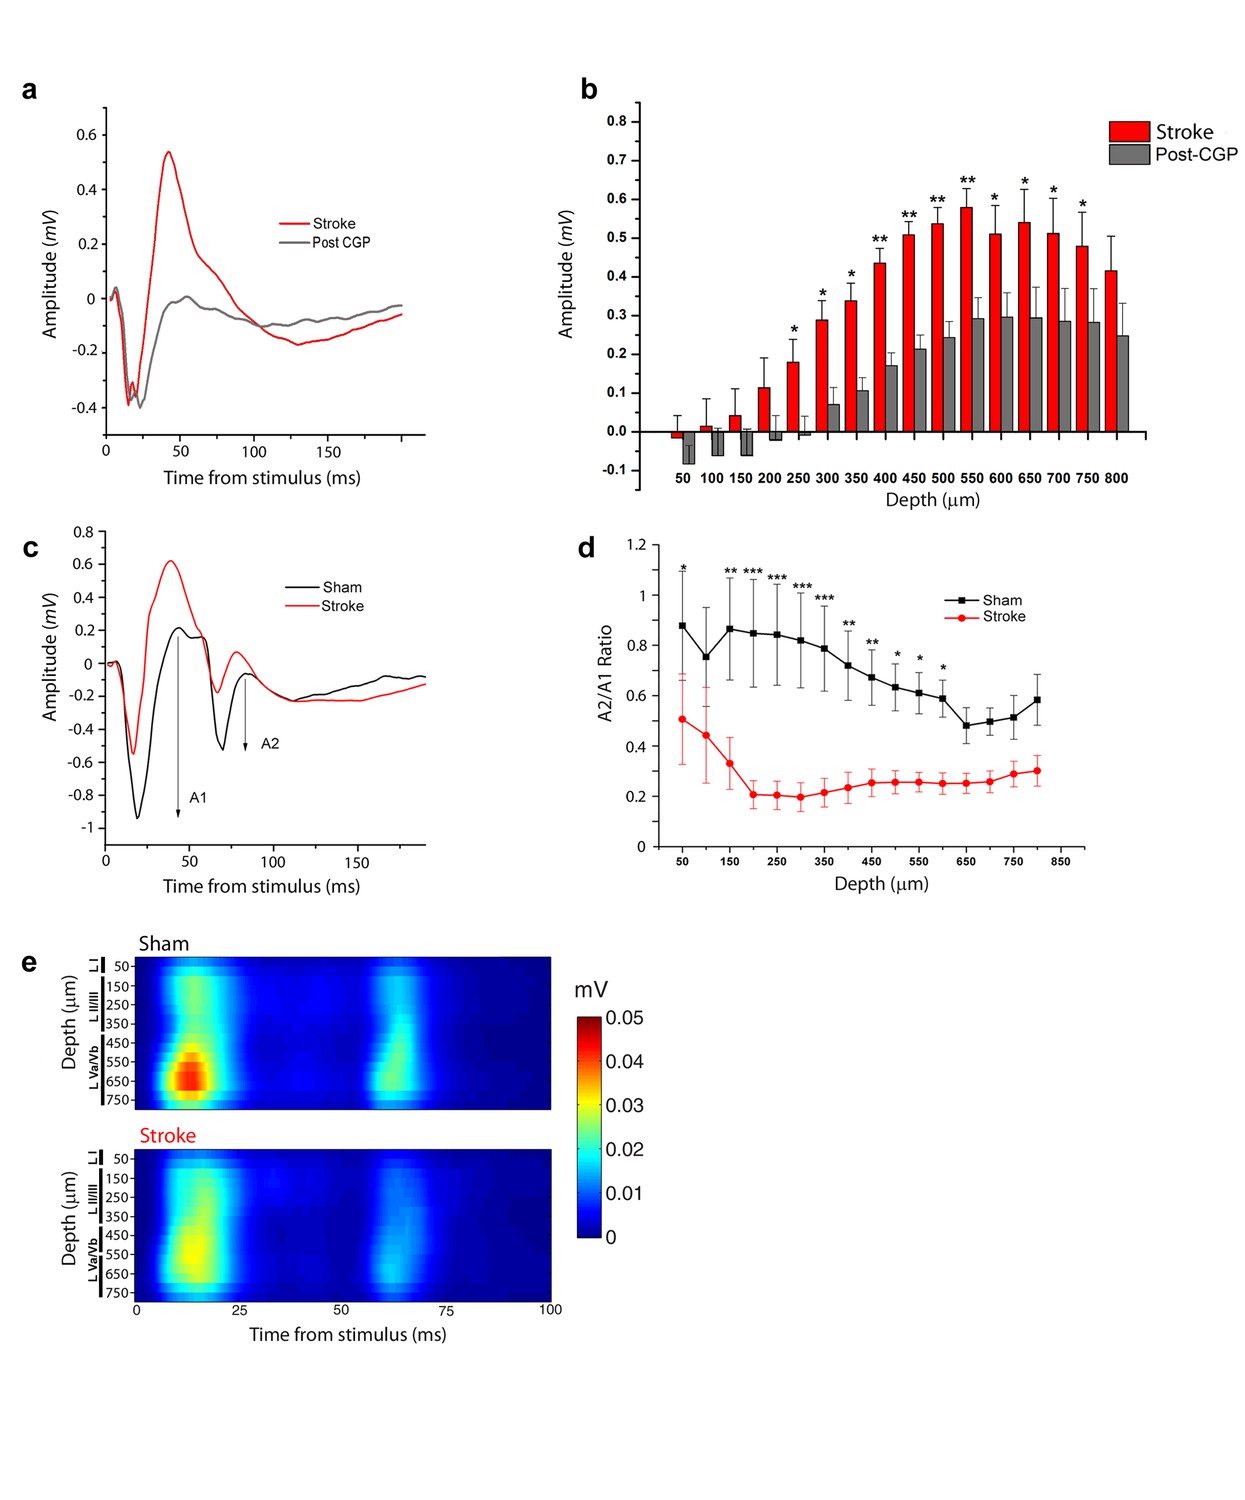
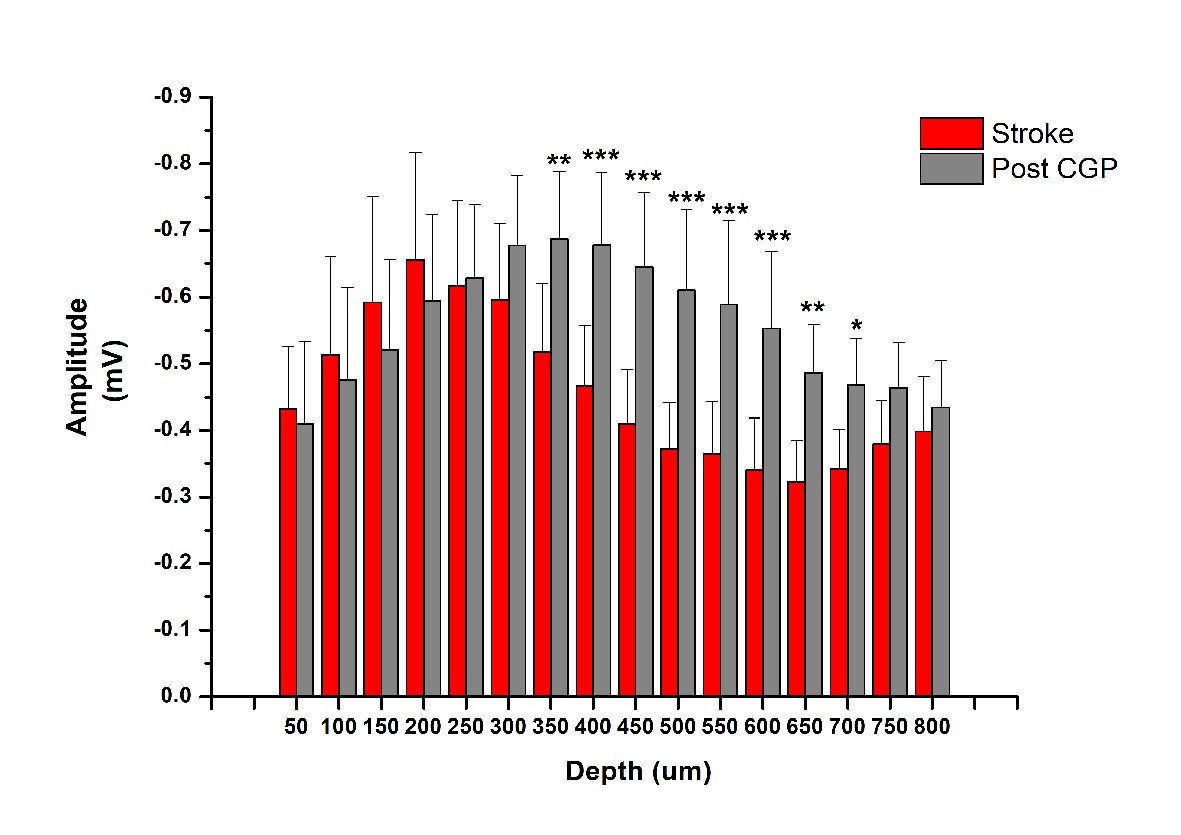
Increased interhemispheric inhibition in stroke animals.
(a) Representative Field Potential response to single pulse stimulation in the contralateral RFA in layer V of the RFA in ischemic animals before (Red) and after (Grey) application of the GABA-B antagonist CGP 55845. (b) Mean amplitude of the late positive component of evoked FP before (red) and after (Grey) application of the GABA-B antagonist CGP 55845. The late positive component is significantly lower after CGP55845 application (Two-way Anova, followed by Holm-Sidak test, stroke vs Post-CGP55845, *p<0.05; **p<0.01; ***p<0.001). Data are mean ±SE. (c) Representative Field Potential response evoked by paired pulse stimulation (50 ms inter-stimulus interval) recorded in the RFA of a sham (Black) and astroke (Red) animal. A1 and A2 represent the amplitude of the first and second response, respectively. (d) Paired Pulse ratio was consistently lower in ischemic (Red) versus healthy animals (Black). ***p<0.001 (Two-way Repeated Measures Anova followed by Holm-Sidak test, sham vs stroke). Data are mean ±SE. (e) MUA triggered by 50 ms ISI paired-pulse stimulation across all cortical layers in the target hemisphere in sham (top) and stroke (bottom) mice. Please note the increased paired-pulse depression in stroke animals with respect to controls, in middle-deep layers (p<0.05, T test). Roman numerals indicate cortical layers.
-
Figure 3—source data 1
Mean and SEM are presented for the data in Figure 3.
- https://doi.org/10.7554/eLife.28662.013
Figure 3—figure supplement 1
Effect of GABA-B blocker CGP55845 on the early negative FP.
Mean amplitude of the early negative component of evoked FP before (red) and after (Grey) application of the GABA-B antagonist CGP 55845 (Two-way Anova, followed by Holm-Sidak test, stroke vs Post-CGP55845, *p<0.05; **p<0.01; ***p<0.001).
-
Figure 3—figure supplement 1—source data 1
Mean and SEM are presented for the data in Figure 3—figure supplement 1.
- https://doi.org/10.7554/eLife.28662.010
Figure 3—figure supplement 2
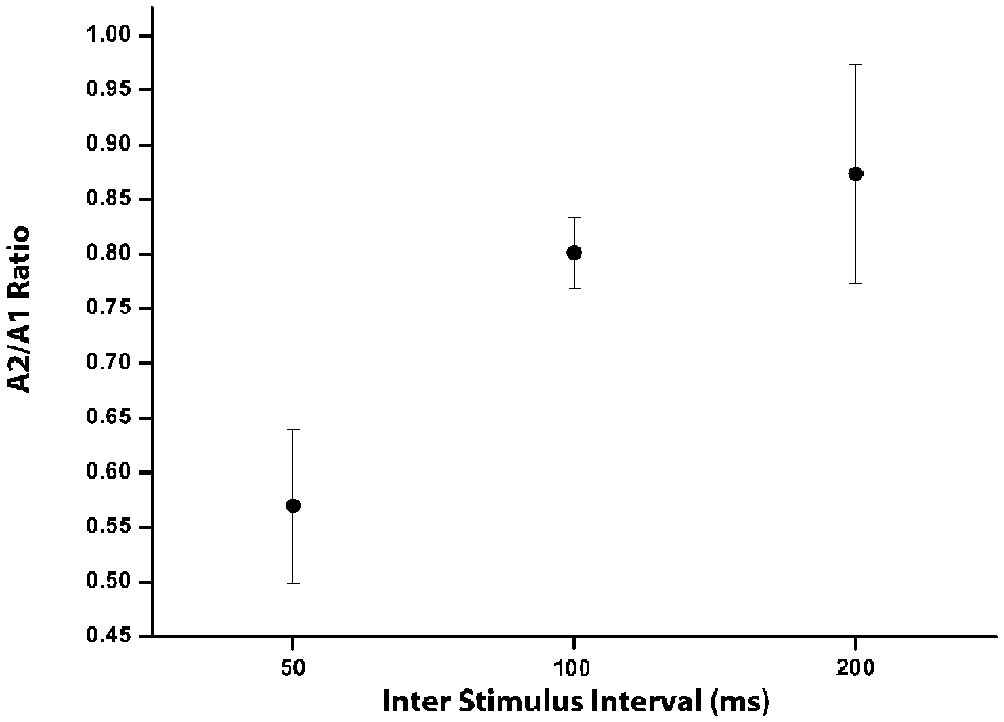
Variation of PPD as a function of ISI.
Mean paired pulse ratio, calculated as the ratio of the second to the first postsynaptic response (A2/A1) at increasing inter-stimulus intervals (50, 100 and 200 ms) in healthy animals. Data are mean ±SE.
-
Figure 3—figure supplement 2—source data 1
Mean and SEM are presented for the data in Figure 3—figure supplement 2.
- https://doi.org/10.7554/eLife.28662.012
Figure 4 with 1 supplement
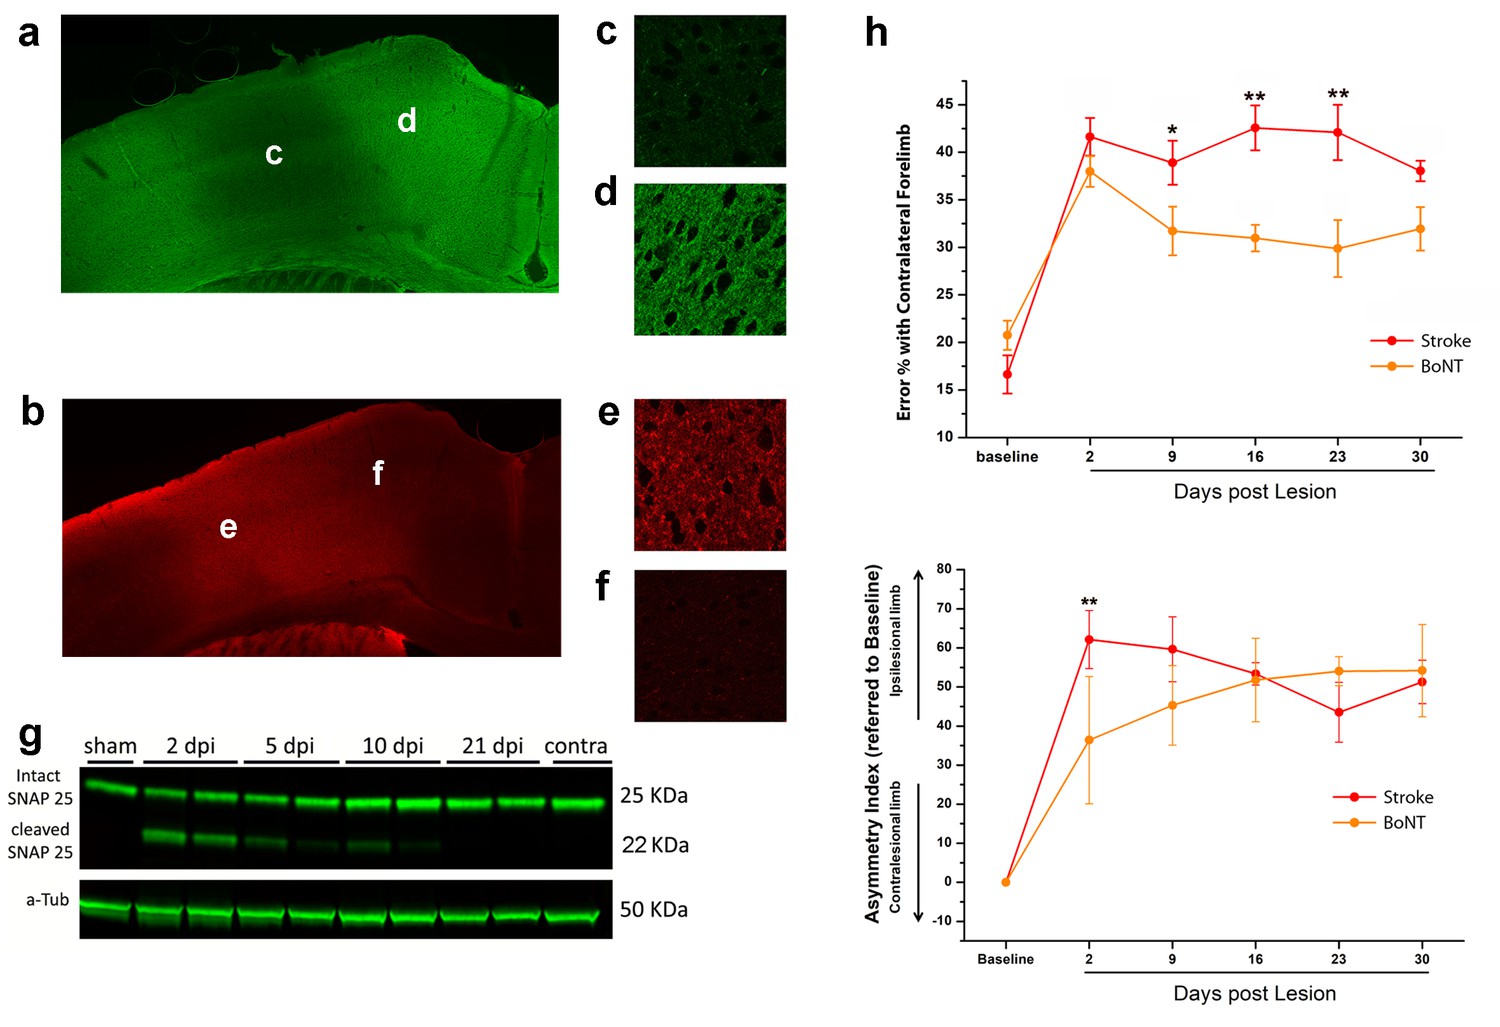
BoNT/E action in motor cortex and its impact on functional recovery.
Immunofluorescence staining for intact (a) and cleaved (b) SNAP-25. Magnification of the injection site showed the nearly total absence of intact SNAP-25 (c) whereas the cleaved SNAP-25 signal is consistent (e). Conversely, in the peri-injection site there is a conspicuous amount of intact SNAP-25 (d), but no signal from cleaved SNAP-25 (f). (g) Representative immunoblotting for intact (25 KDa) and cleaved (22 KDa) SNAP-25 on cortical protein extracts from injected mice. Tissues were harvested from the treated area at different days post-injection (dpi 2, 5, 10 and 21), from the motor cortex contralateral to the injection side (contra) and from a control animal (sham). Each lane represents one animal. a-Tub means α-Tubulin (internal standard). (h) Pre- and post-lesion performance of the stroke untreated (Red) and BoNT/E injected (Orange) groups measured as the percentage of contralesional forelimb foot faults in the Gridwalk task (upper panel) and as Asymmetry Index in the SchallertCylinder test (lower panel). *p<0.05, **p<0.01 vs stroke untreated (Two-way Repeated Measures Anova, followed by Holm-Sidak test).
-
Figure 4—source data 1
Mean and SEM are presented for the data in Figure 4.
- https://doi.org/10.7554/eLife.28662.017
Figure 4—figure supplement 1
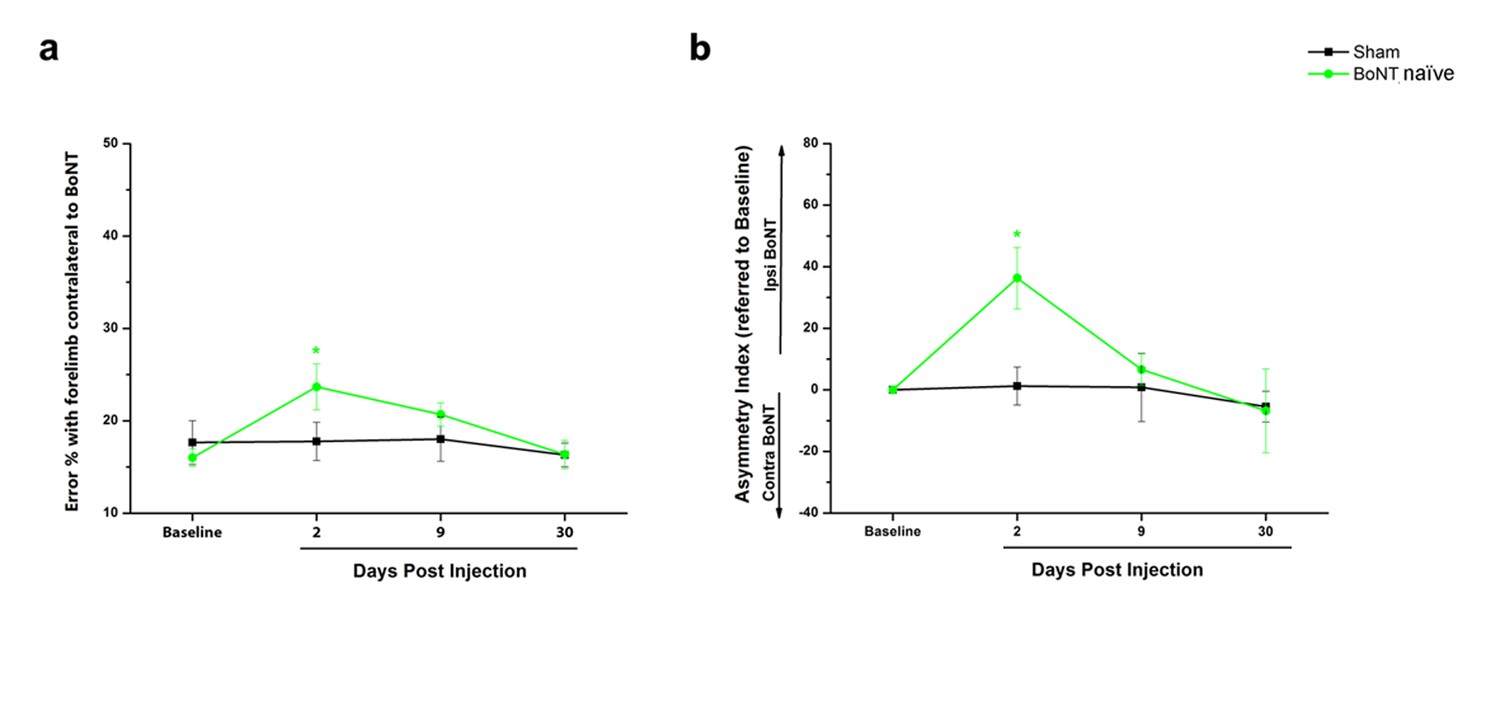
BoNT injection in Sham animals induces a transient deficit in performance of the injured forelimb.
(a) Motor performance before and after intracortical injection of BoNT/E (BoNT naïve, green) or sham surgey (black) in normal mice measured as the percentage of contralateral forelimb foot faults in the Gridwalk task. (b) Pre- and post-injection performance of the sham (Black) and BoNTnaïve (Green) groups measured as Asymmetry Index in the Schallert Cylinder test. *p<0.05 (Two-way Anova followed by Tukey test, Sham vs BoNT).
-
Figure 4—figure supplement 1—source data 1
Mean and SEM are presented for the data in Figure 4—figure supplement 1.
- https://doi.org/10.7554/eLife.28662.016
Figure 5
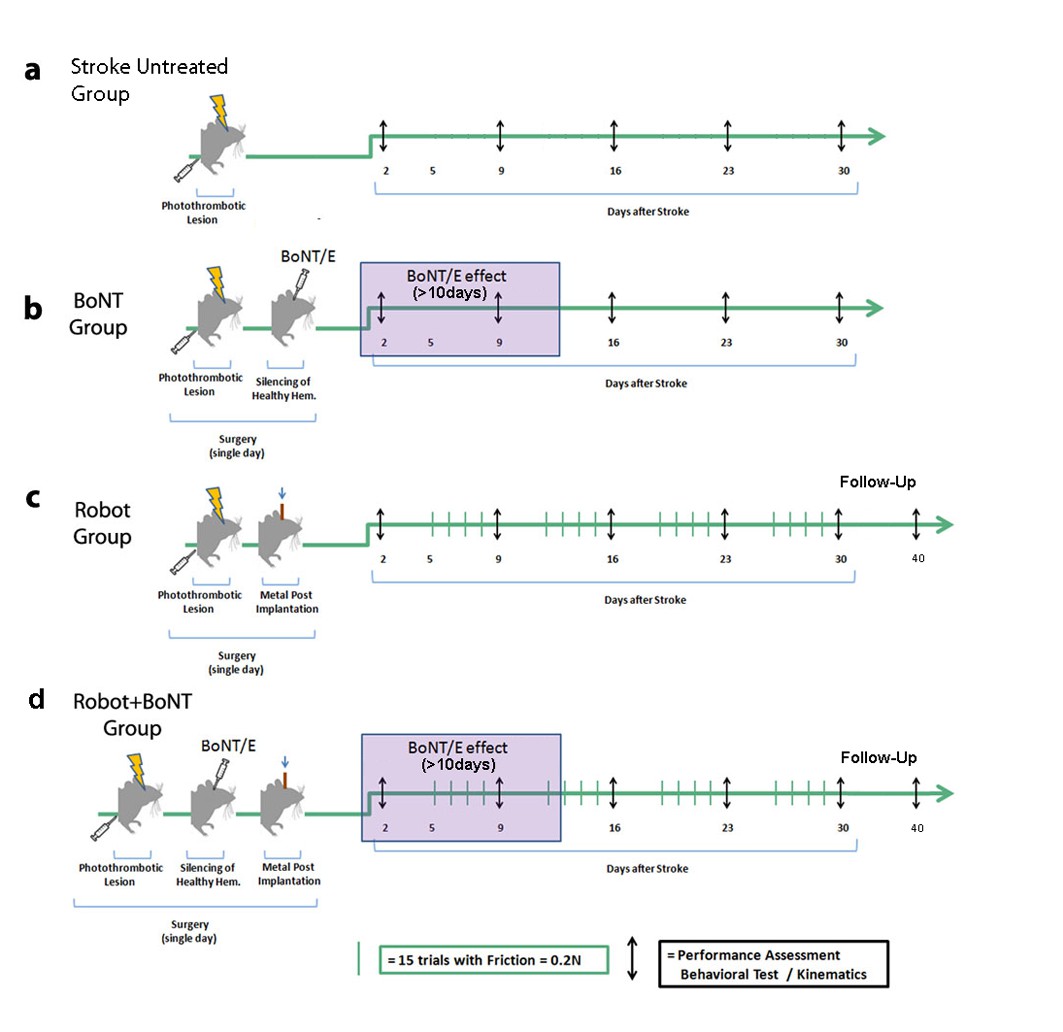
Schematic of the treatment protocols.
Baseline performances in behavioral tests were assessed for all groups before the surgery and then once a week up to 30 days post lesion (black arrows). Stroke animals with no treatment were included in each experimental cohort (a). In the BoNT group (b), photothrombosis was immediately followed by BoNT/E injection into the contralesional hemisphere with toxin effect lasting >10 days (purple box). In the Robot group (c), the metal post for head fixation on the robotic platform was applied immediately after the photothrombotic lesion. Animals started the daily robotic training (green bars) from day 5, 4 days per week up to 30 days post lesion. In the Robot + BoNT group (d), mice received BoNT/E injection into the contralesional hemisphere and head-post application during the stroke surgery, and were subjected to robotic rehabilitation as the Robot group. A subset of animals in the Robot and Robot + BoNT group were also tested 40 days post-stroke to probe the persistence of the therapeutic effects (follow-up phase with no treatment).
Figure 6 with 1 supplement

The combined therapy induces functional improvements that outlast the window of treatment.
(a) Pre- and post-lesion performance of Robot (Light Blue) and Robot+BoNT (Blue) groups measured as the percentage of contralesional forelimb foot faults in the Gridwalk task. ***p<0.001 (Two-way Repeated Measures Anova, followed by Tukey test, Robot vs Robot+BoNT). (b) Pre- and post-lesion performance of Robot (Light Blue) and Robot+BoNT (Blue) groups measured as Asymmetry Index in the Schallert Cylinder test. ***p<0.001 (Two-way Anova followed by Tukey test, Robot vs Robot+BoNT). (c, d) Maintenance of the motor performances in the Gridwalk (c) and Schallert Cylinder (d) tests after 10 days of Follow-Up with no treatment. The Robot+BoNT group (Blue) remains significantly different from Robot (Light Blue) at day 40 (Two-way Repeated Measures Anova, followed by Tukey test between groups, Gridwalk p<0.001, Schallert Cylinder p<0.05).
-
Figure 6—source data 1
Mean and SEM are presented for the data in Figure 6.
- https://doi.org/10.7554/eLife.28662.022
Figure 6—figure supplement 1

Motor performance on the robotic platform.
T-target (a) and number of attempts (b) in the Robot group after stroke. All animals were tested daily on the robotic platform, 4 days per week starting from day five post lesion. Parameters were pooled across weeks of training. Note the significant improvements at the end of the training in both parameters. **p<0.01 (Mann-Whitney Rank Sum Test).
-
Figure 6—figure supplement 1—source data 1
Mean and SEM are presented for the data in Figure 6—figure supplement 1.
- https://doi.org/10.7554/eLife.28662.021
Figure 7
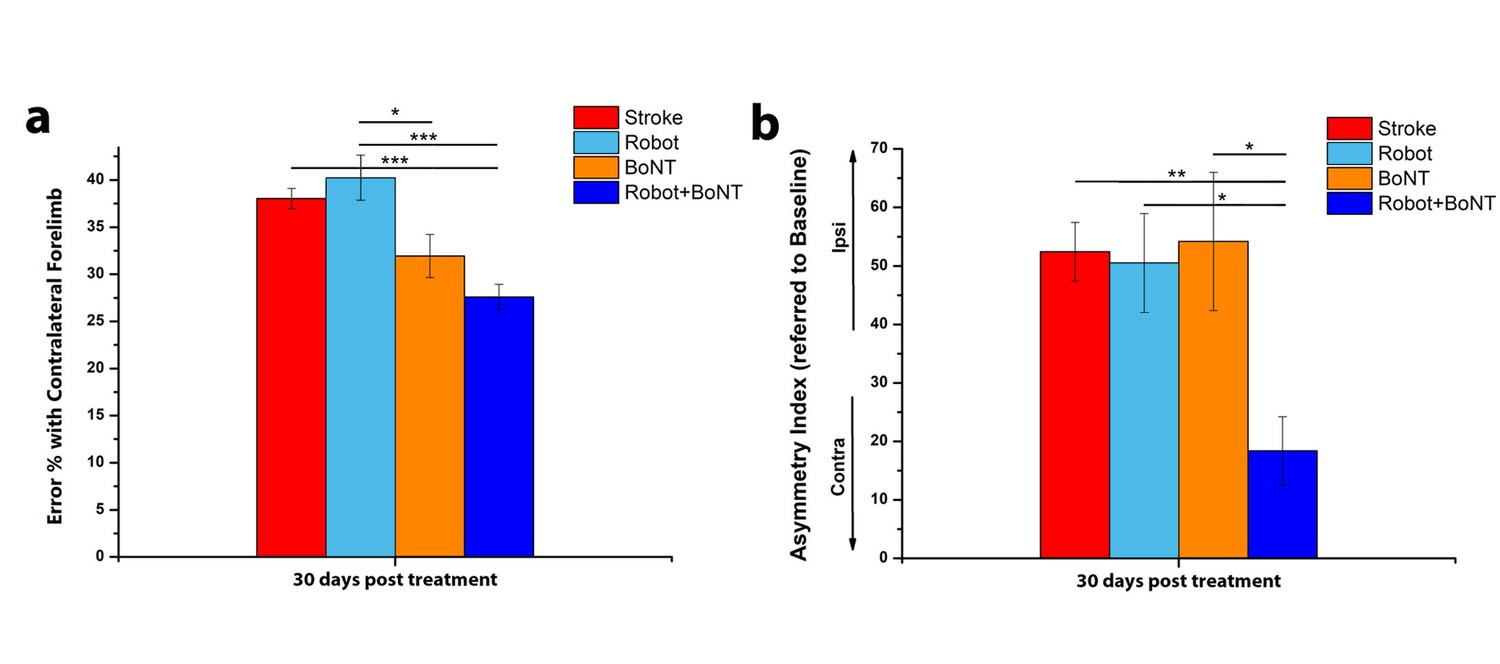
The combined treatment produces better results than the separate therapies.
Percentage of contralesional forelimb foot faults in the Gridwalk task (a) and Asymmetry Index in the Schallert Cylinder test (b) at 30 days post lesion for stroke untreated (Red), Robot (Light Blue), BoNT (Orange) and Robot+BoNT (Blue). One-Way Anova followed by Tukey Test, *p<0.05, **p<0.01, ***p<0.001.
-
Figure 7—source data 1
Mean and SEM are presented for the data in Figure 7.
- https://doi.org/10.7554/eLife.28662.024
Figure 8 with 2 supplements
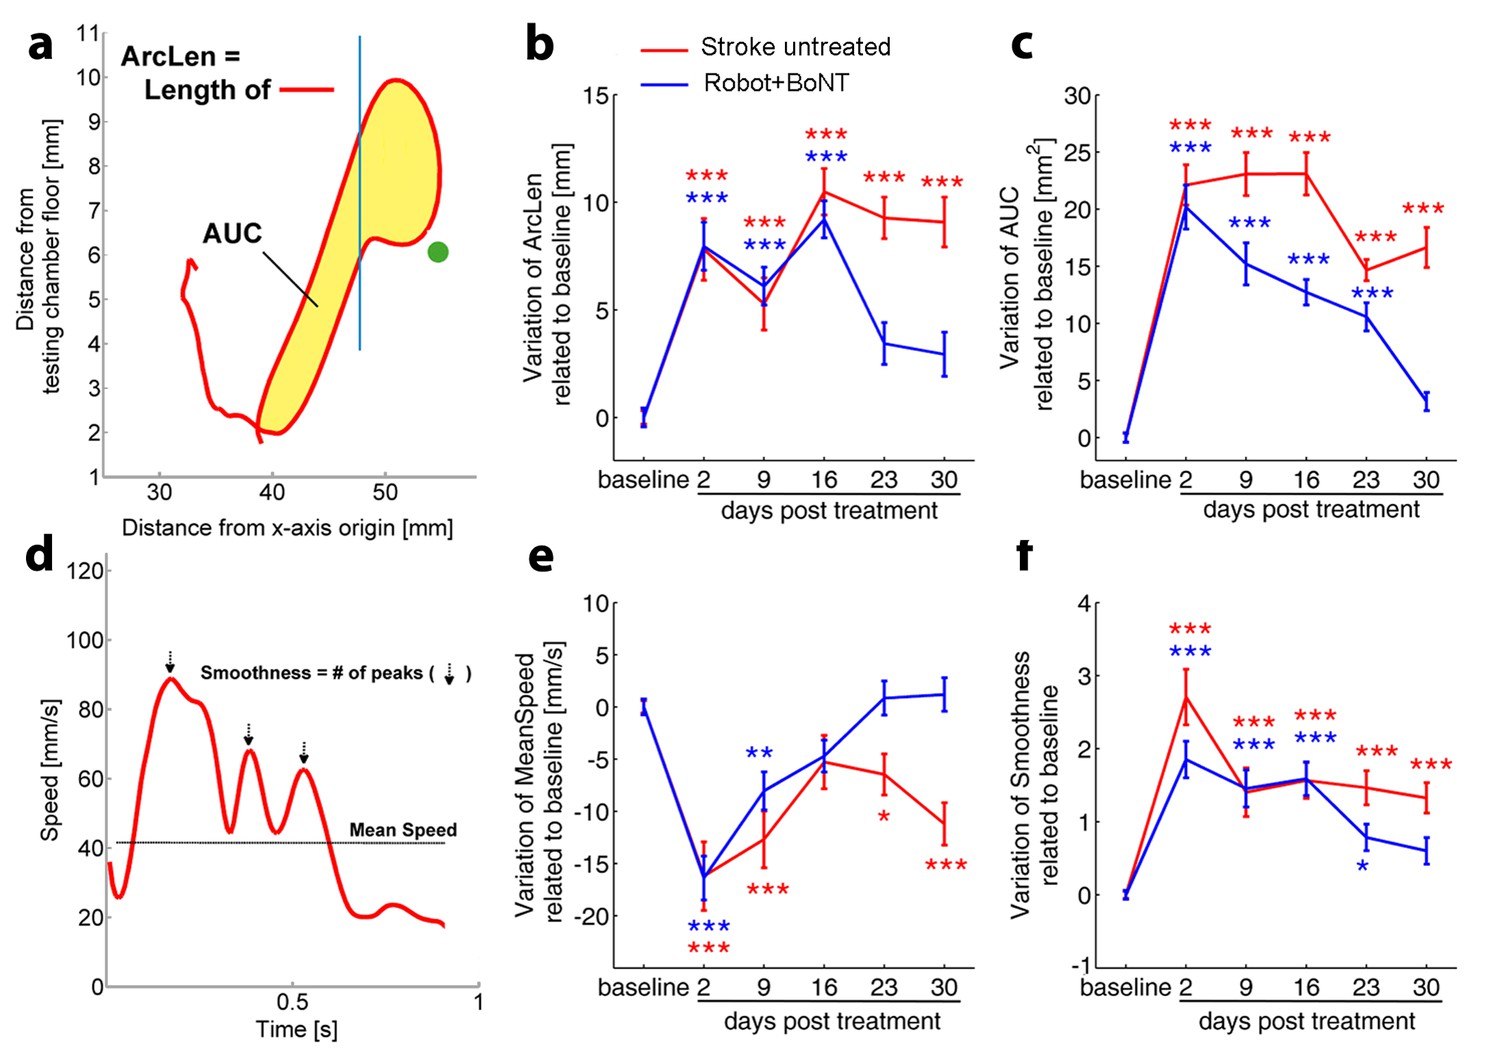
Kinematic analysis of reaching following the combined treatment.
(a) Schematic representation of the reaching trajectory showing pellet position (green dot) and the frontal aperture of the testing cage (Blue line). AUC, Area Under the Curve; ArcLen, length of the curve. Longitudinal variation of ArcLen (b) and AUC (c) computed from reaching movement trajectories in untreated stroke (Red) and Robot+BoNT (Blue) groups. (d) Representative speed profile during reaching. Mean Speed and Smoothness of movement are indicated (Black line and arrows). Longitudinal variation of Smoothness (e) and Mean Speed (f) computed from reaching movement trajectories in untreated stroke (Red) and Robot+BoNT (Blue) groups. Note the substantial amelioration of the parameters in the combined treatment group. Values are normalized by subtracting baselines and plotted as the means ± standard error.Two way repeated measures ANOVA followed by Tukey test vs Baseline *p<0.05, **p<0.01, ***p<0.001.
-
Figure 8—source data 1
Mean and SEM are presented for the data in Figure 81.
- https://doi.org/10.7554/eLife.28662.030
Figure 8—figure supplement 1
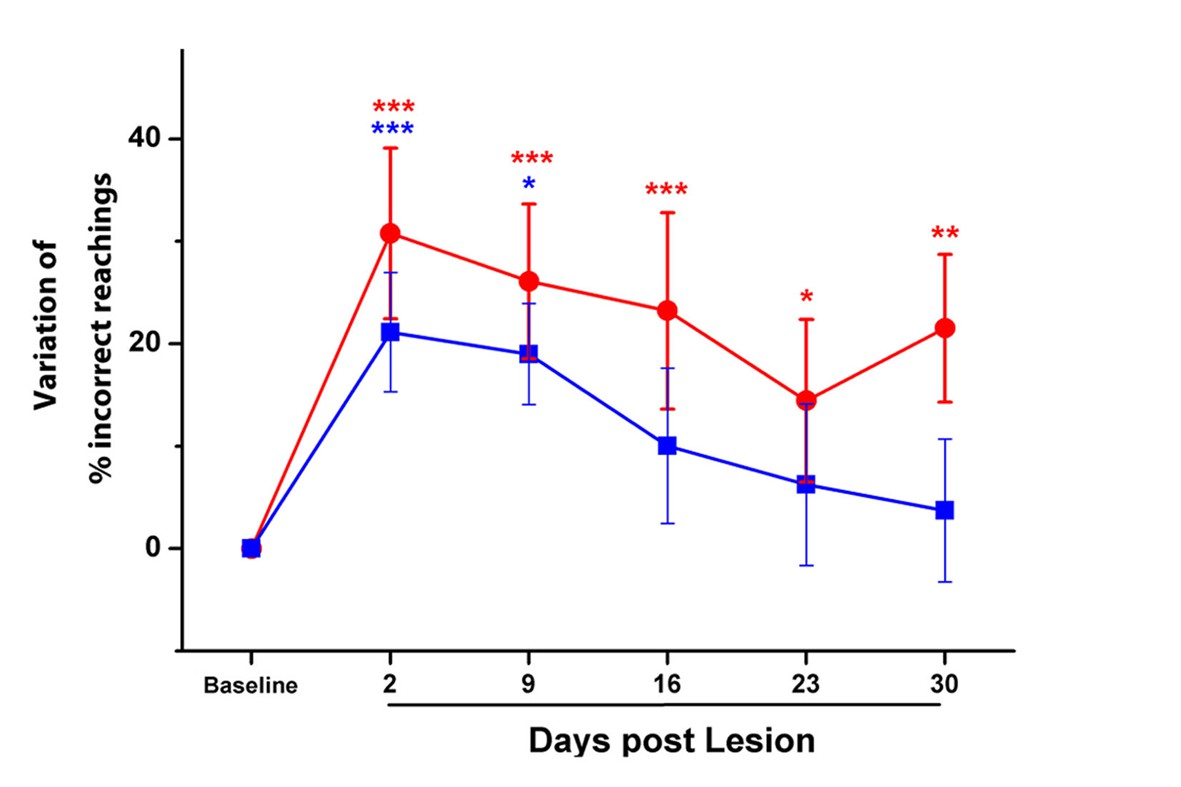
Combined treatment significantly improved motor function in end-point analysis of a skilled task.
Percentage of errors (i.e. missed and dropped pellets) in the Single Pellet Retrieval test before and after the ischemic lesion in untreated stroke (Red) and Robot+BoNT (Blue) groups. Data are normalized by subtracting baseline values and plotted as the means ± standard error (Two-way Anova followed by Holm-Sidak test vs Baseline, *p<0.05, **p<0.01, ***p<0.001).
-
Figure 8—figure supplement 1—source data 1
Mean and SEM are presented for the data in Figure 8—figure supplement 1.
- https://doi.org/10.7554/eLife.28662.027
Figure 8—figure supplement 2
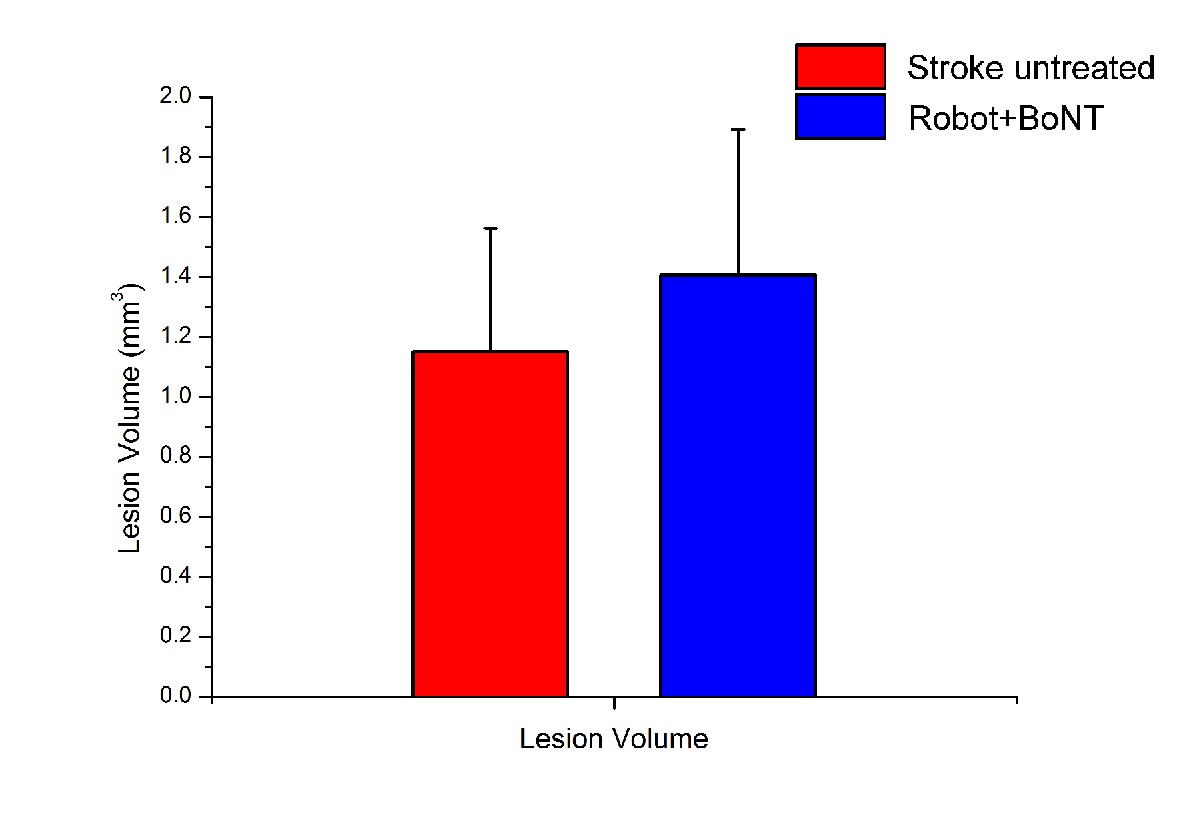
Volumes of the ischemic lesion are statistically comparable in untreated stroke and Robot+BoNT groups.
Mean volumes of the photothrombotic lesion quantified with Hoechst immunostaining as the amount of dead tissue in mm3. T test, p=0.318.
-
Figure 8—figure supplement 2—source data 1
Mean and SEM are presented for the data in Figure 8—figure supplement 2.
- https://doi.org/10.7554/eLife.28662.029
Figure 9

Reduction of plasticity ‘brakes’ after combined treatment.
The number of PV+ cells decreased with combined treatment (a) as shown by representative micrographs of the counting region (b; Robot+BoNT n = 6, untreated stroke n = 8). Consistently, the number of SOM+ cells in the perilesional tissue was also decreased after combined therapy (c) and d), Robot+BoNT n = 6, untreated stroke n = 4). The mean fluorescence of MBP staining indicated that the rehabilitated animals (n = 4) have less MBP in the perilesional cortex with respect to non-rehabilitated group (n = 3) (e and f). In a and c, the dotted lines indicate the range of values for naïve, unlesioned mice. Data are mean ±SE. (T test *p<0.05).
-
Figure 9—source data 1
Mean and SEM are presented for the data in Figure 9.
- https://doi.org/10.7554/eLife.28662.032
Figure 10 with 1 supplement
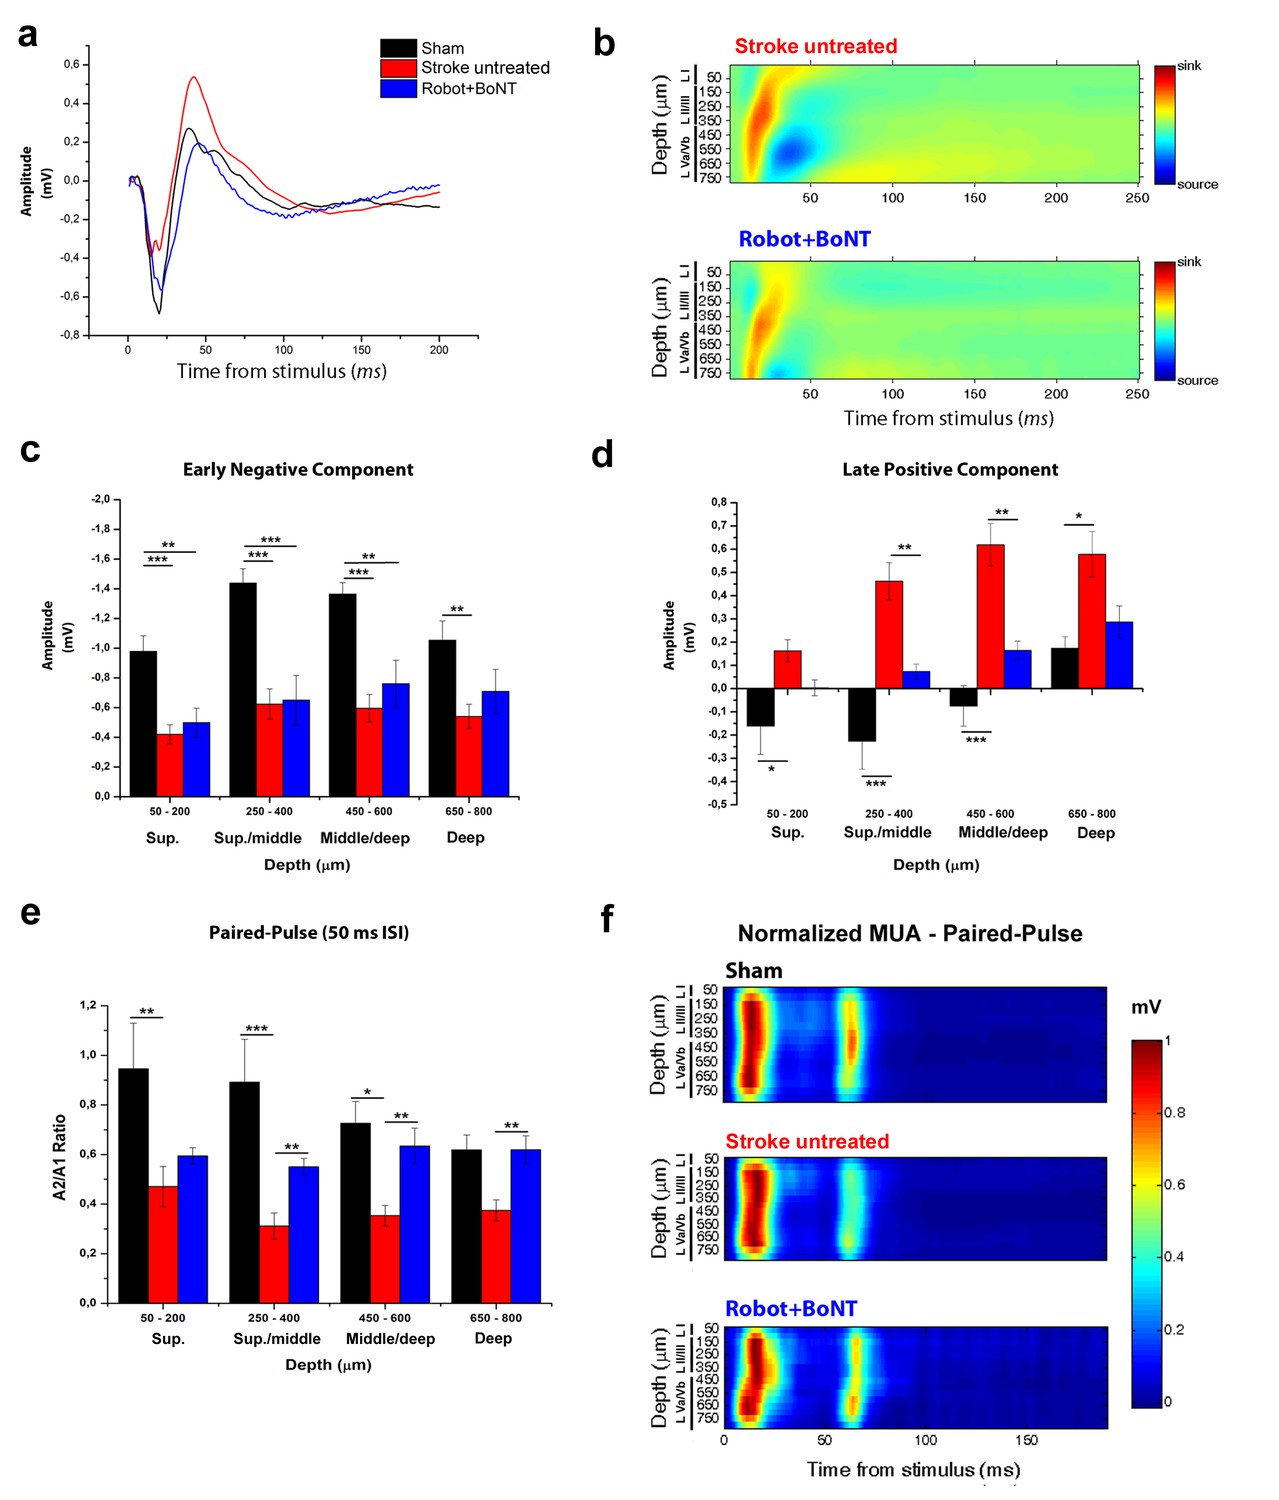
The combined treatment reduced the interhemispheric inhibition in injured animals 30 days after stroke.
(a) Representative Field Potential response in layer V of the RFA in sham (Black), stroke untreated (Red) and Robot+BoNT (Blue) animals after single pulse stimulation in the contralateral RFA. (b) Current source density analysis of the cortical field potential response to optogenetic stimulation, in stroke untreated (top) and Robot+BoNT (bottom) groups. Warm colors (yellow and red) represent current sinks and cool colors (dark and light Blue) represent current sources. (c, d) Mean amplitude of the early negative (c) and late positive (d) components of evoked field potentials in sham (Black), stroke untreated (Red) and Robot+BoNT (Blue) group. Results from adjacent channels (depths) were pooled to show responses in superficial (Sup), Sup/Middle, Middle/deep and Deep layers. The early FP component in the ipsilesional RFA of rehabilitated animals is comparable to sham only in layer V (p=0.089), while the late positive wave is comparable to controls in superficial/middle to deep layers (sup p=0.436, sup./middle p=0.07, middle/deep p=0.179, deep p=0.676) and significantly lower with respect to stroke untreated in middle layers (sup./middle p=0.009, middle/deep p=0.002, Two-way Anova, followed by Tukey test between groups). (e) Paired Pulse ratio in Robot+BoNT(Blue) was comparable to sham across all the cortical layers (sup p=0.659, sup./middle p=0.267, middle/deep p=0.164, deep p=0.197, Two-way Anova, followed by Tukey test between groups) and significantly different from stroke untreated except from superficial layers (sup./middle p=0.006, middle/deep p=0.001, deep p=0.005, Two-way Anova, followed by Tukey test, Robot+BoNT vs Stroke untreated). *p<0.05; **p<0.01; ***p<0.001, data are mean ±SE. (f) MUA triggered by 50 ms ISI paired-pulse stimulation across all cortical layers in the target hemisphere in sham (top), stroke untreated (middle) and Robot+BoNT (bottom) mice. MUA values are normalized to the first peak response value, for each channel separately. Roman numerals indicate cortical layers.
-
Figure 10—source data 1
Mean and SEM are presented for the data in Figure 10.
- https://doi.org/10.7554/eLife.28662.036
Figure 10—figure supplement 1
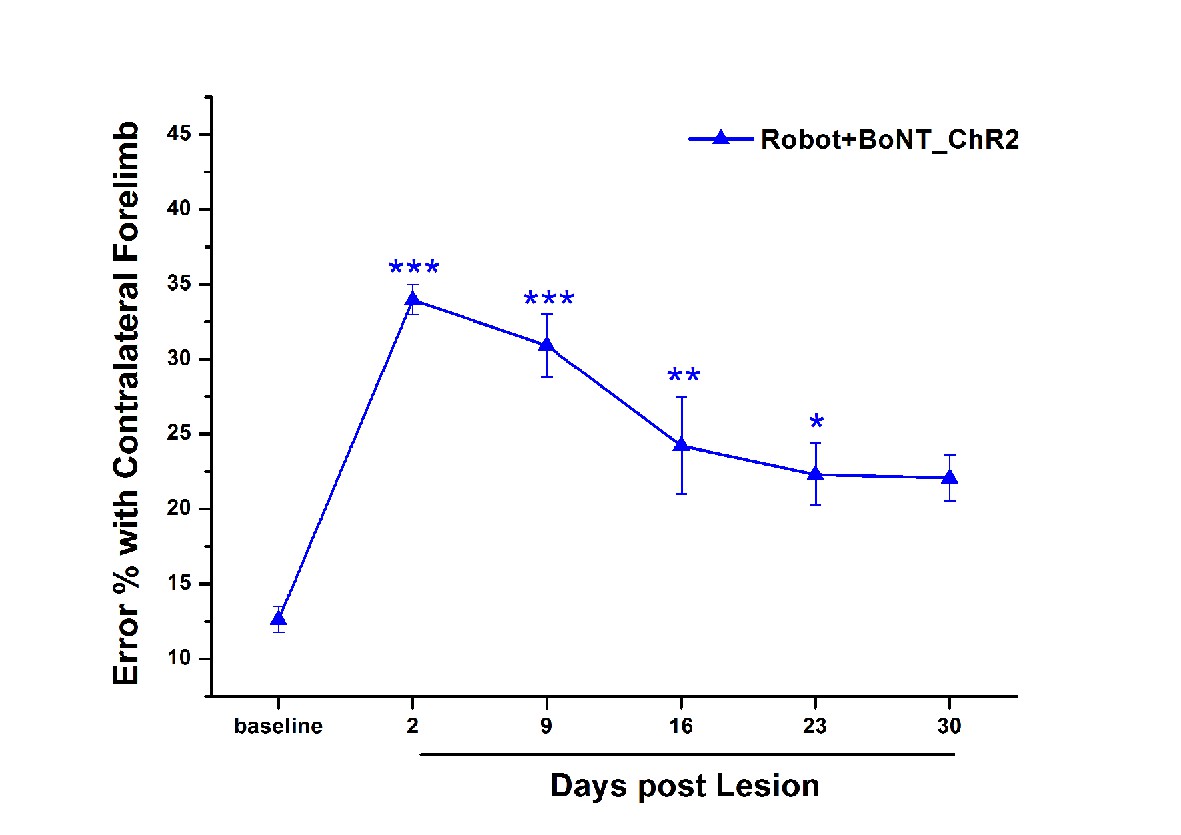
Functional effect of the combined Robot+BoNT treatment in ChR2 transgenic mice.
Pre- and post-lesion performance of the Robot+BoNT_ChR2 group measured as the percentage of contralesional forelimb foot faults in the Gridwalk task. Motor performances were improved by the combined treatment starting from day 16 and similar to Baseline at day 30 post lesion (p=0.06). One-way repeated measures Anova followed by Tukey test, vs Baseline *p<0.05, **p<0.01, ***p<0.001.
-
Figure 10—figure supplement 1—source data 1
Mean and SEM are presented for the data in Figure 10—figure supplement 1.
- https://doi.org/10.7554/eLife.28662.035
Tables
Key resources table
| Reagent type (species) or resource | Designation | Source or reference | Identifiers | Additional information |
|---|---|---|---|---|
| Genetic reagent (Mus musculus) | 21B6.Cg-Tg (Thy1- ChR2/EYFP)18Cfng/J | Jackson Laboratories | IMSR_JAX:007612 | |
| Antibody | NeuN | Millipore | RRID:AB_11205592 | MILLIPORE:ABN90 Guinea Pig polyclonal; diluition (1:1000) |
| Antibody | Parvalbumin | SynapticSystems | RRID:AB_2156476 | SYSY:195004 Guinea Pig polyclonal; diluition (1:300) |
| Antibody | Somatostatin | Millipore | ID_MILLIPORE:MAB354; clone YC7 | Rat monoclonal; diluition (1:400) |
| Antibody | Myelin Basic Protein | Millipore | RRID:AB_2255365 | MILLIPORE:AB980 Rabbit polyclonal; diluition (1:500) |
| Antibody | intact and BoNT/E- truncated SNAP-25 | Other | Ref: https://doi.org/10.1016/j.neuroscience.2010.04.059; https://doi.org/10.1523/JNEUROSCI.0772-07.2007 | |
| Antibody | Hoechst 33258 | Thermo Fischer | RRID:AB_2651133 | Thermo Fisher Scientific Cat# H3569 |
| Chemical compound, drug | Rose Bengal | Sigma-Aldrich | ID_ALDRICH:330000 | |
| Chemical compound, drug | 6-cyano-7- nitroquinoxaline- 2,3-dione (CNQX) | Tocris | ID_PubChem:3721046 | |
| Chemical compound, drug | CGP 55845 | Tocris | ID_PubChem:5311042 | |
| Chemical compound, drug | Botulinum Neurotoxin E (BoNT/E) | Other | Kindly provided by Thomas Binz (Hannover, Germany); ref: https://doi.org/10.1523/JNEUROSCI.4402-04.2005; https://doi.org/10.1523/JNEUROSCI.0772-07.2007 | |
| Commercial Assay or kit | PlexBrightOptogenetic Stimulation System | PlexonInc | PlexBright LD-1 Single Channel LED Driver with 456 nm Table-top LED Module | |
| Commercial Assay or kit | OmniPlex D Neural Data Acquisition System | PlexonInc | ||
| Software, algorithm | LabWindows/CVI | http://www.ni.com/lwcvi/i/ | ||
| Software, algorithm | MATLAB | http://www.mathworks.com/products/matlab | RRID:SCR_001622 | |
| Software, algorithm | Offline Sorter | PlexonInc | RRID:SCR_000012 | |
| Software, algorithm | NeuroExplorer | PlexonInc | RRID:SCR_001818 | |
| Software, algorithm | Stereo Investigator | MBF Bioscience | RRID:SCR_002526 | |
| Software, algorithm | ImageJ | NIH | RRID:SCR_003070 | |
| Software, algorithm | R | https://www.r-project.org/ | RRID:SCR_001905 | |
| Software, algorithm | G Power Software | http://www.gpower.hhu.de/ | RRID:SCR_013726 | version 3.1.5 |
| Software, algorithm | Kinematic Analysis | other | Ref: https://doi.org/10.1177/1545968314545174 | |
| Other | Optic Fiber 200 μm Core 0.39 NA | ThorlabsInc | ID_THORLABS:M83L01 | |
| Other | 16 channels linear probes | NeuroNexus | ||
| Other | USB DAQ board | National Instruments | ID_NI:USB-6212 BNC | |
| Other | M-Platform | other | Ref: https://doi.org/10.1177/1545968313506520 |
Additional files
-
Transparent reporting form
- https://doi.org/10.7554/eLife.28662.037
Download links
A two-part list of links to download the article, or parts of the article, in various formats.
Downloads (link to download the article as PDF)
Open citations (links to open the citations from this article in various online reference manager services)
Cite this article (links to download the citations from this article in formats compatible with various reference manager tools)
Combining robotic training and inactivation of the healthy hemisphere restores pre-stroke motor patterns in mice
eLife 6:e28662.
https://doi.org/10.7554/eLife.28662


