Control of AMPA receptor activity by the extracellular loops of auxiliary proteins
- Humboldt Universität zu Berlin, Germany
- Leibniz-Forschungsinstitut für Molekulare Pharmakologie, Germany
Figures
Figure 1 with 4 supplements
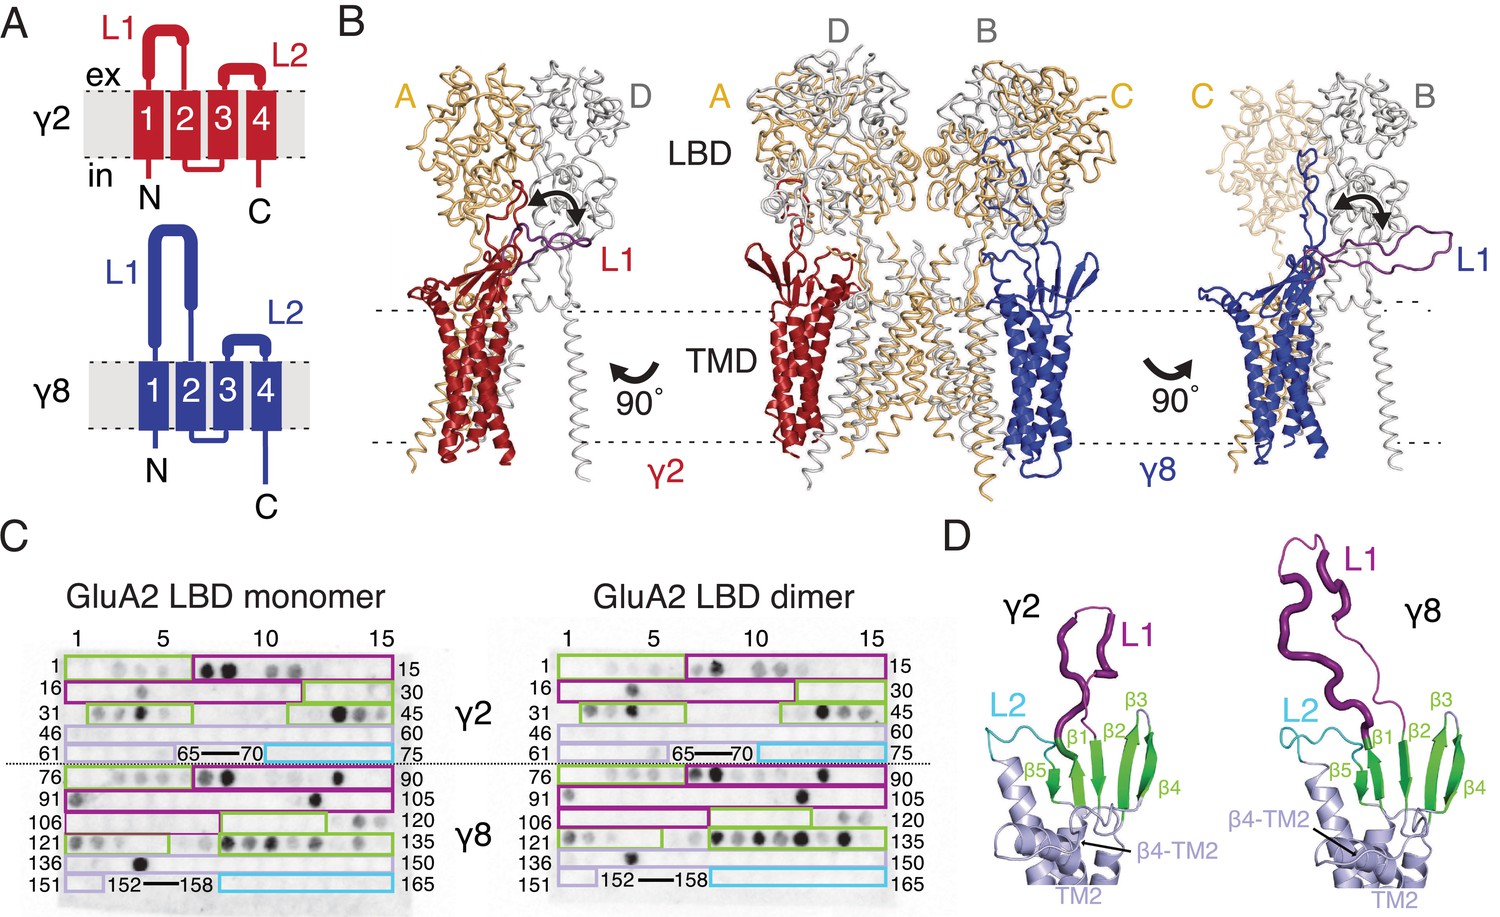
Modeling and biochemical analysis of AMPA-TARP complexes.
(A) Topology of TARP γ2 (red) and γ8 (blue). Membrane helices numbered from 1 to 4. The first extracellular segment includes a flexible loop (L1, thick section, longer in γ8). Transmembrane helices 2 and 3 are connected by loop 2 (L2) (B) The middle panel shows TARPs γ2 (red) and γ8 (blue) positioned between equivalent receptor subunits (A and D and B and C) based on the cryo-EM complex structure (5kk2). The predicted L1 of γ8 is longer than in γ2 enabling it to reach more extensive regions of the receptor. To account for its flexibility we modeled L1 in two extreme positions (indicated by the double-headed arrows), either between the LBD dimer (colored like the respective TARP) or underneath the lower lobe of the LBD (purple; left panel for γ2, right panel for γ8). Potential L1 interactions with the LBD depend on its location in the complex (for example, between subunits A and B or A and D; see Figure 1—figure supplement 1A). (C) Membranes spotted with overlapping hexameric peptides of the extracellular segments of γ2 (1–75) and γ8 (76–165) were incubated with either monomeric (left) or dimeric His-tagged GluA2 LBD (right). Interacting peptides give a dark spot on the membrane (darker spots indicate stronger binding) when developed with an HRP-conjugated antibody against the His-tag (see Materials and methods). Spots from 66 to 69 and 153–157 did not contain any peptides. The colored boxes indicate peptides location, with β-sheets (green), loop1 (purple), β4-TM2 loop containing the sequence of the negative patch (light blue) and L2 (cyan). See also panel D and Figure 1—figure supplement 1C. Quantitation of the spot arrays is found in Figure 1—source data 1. (D) Close up view on the modeled extracellular region of γ2 (left) and γ8 (right). Secondary structure elements are shown in cartoon representation in the same color code as in panel C. Positive peptide hits in L1 are indicated by thicker loop-representation.
-
Figure 1—source data 1
Spot array quantitation.
- https://doi.org/10.7554/eLife.28680.007
Figure 1—figure supplement 1
Loop interactions between TARPs and GluA2.
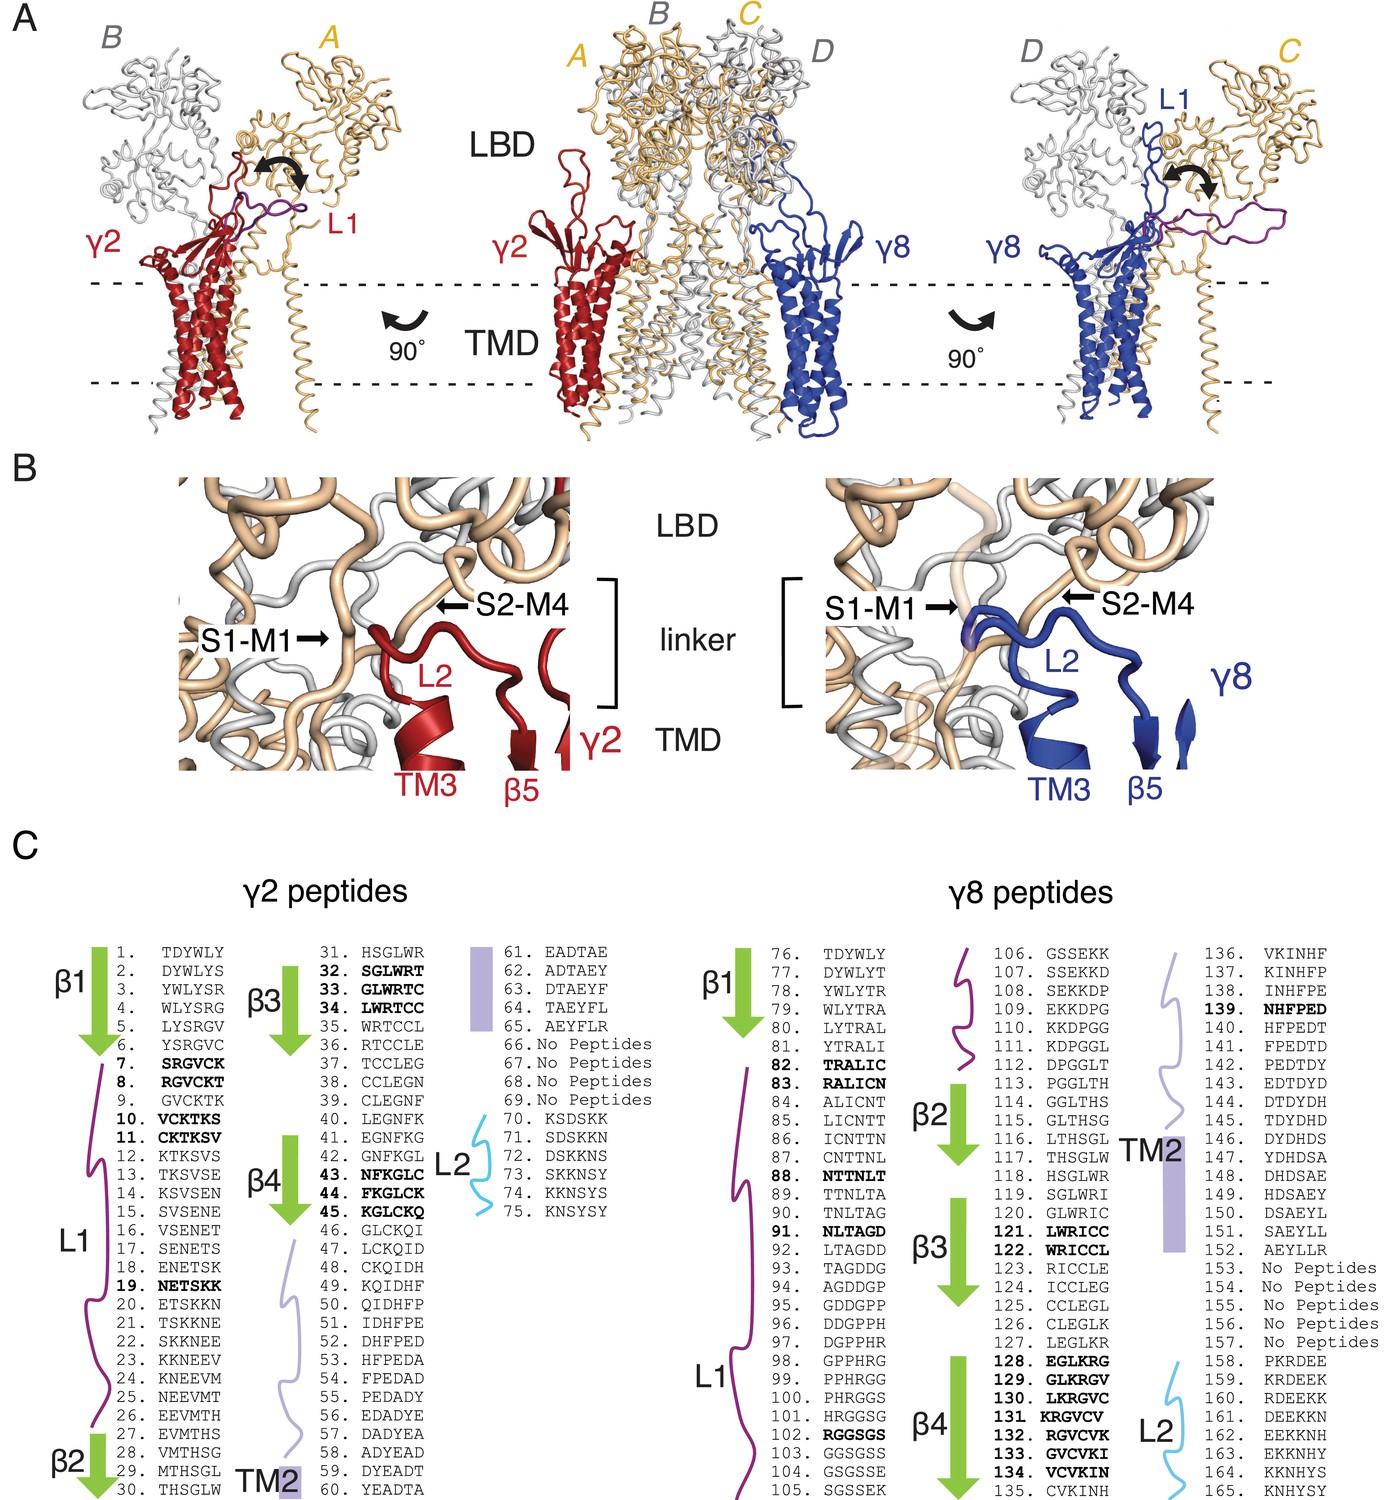
(A) The middle panel shows TARPs γ2 (red) and γ8 (blue) positioned between equivalent receptor subunits (A and B and C and D). We modeled L1 in two positions, either between the LBD dimer (colored as the respective TARP) or underneath the lower lobe of the LBD (purple; left panel γ2, right panel γ8). (B) The model suggests L2 of both γ2 (red, left panel) and γ8 (blue, right panel) engages in similar interactions, independent from the TARP’s location in the complex. L2 is sandwiched between the receptor linkers (S1–M1 and S2–M4) connecting the LBD to the pore-forming TMD. (C) Sequences of the hexameric TARP peptides used in the peptide mapping array are listed according to their position in the array. Secondary structure elements are shown in the same color code as in Figure 1C and D. Peptide sequences and quantitation are found in Figure 1—source data 1. Positive peptide hits are indicated as bold sequences.
Figure 1—figure supplement 2
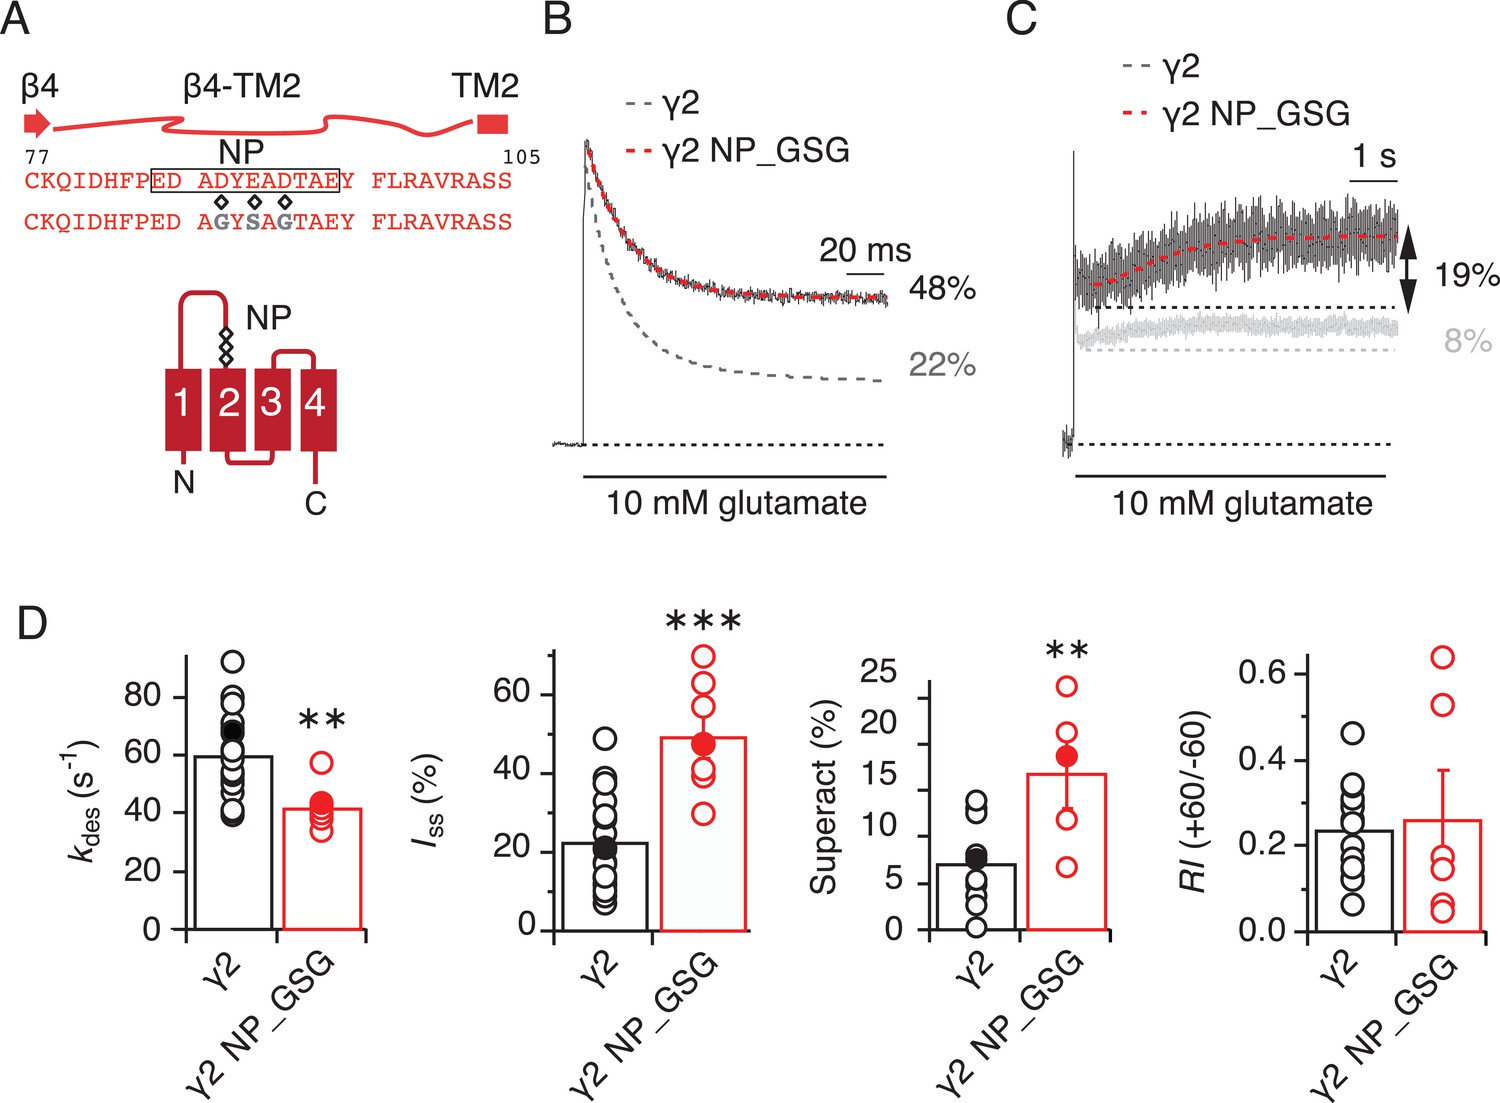
The negatively charged patch on β4-TM2 loop of γ2 negatively modulates AMPA receptor gating.
(A) The sequence of the β4-TM2 loop of γ2 with the secondary element is shown here. The residues mutated in the negative patch (NP, black box) are marked (diamonds, D88G, E90S and D92G) and the sequence of the mutated γ2 NP_GSG is shown underneath. The γ2 membrane topology shows the location of the three negatively charged residues (diamonds) that were neutralized within the negative patch. (B) Representative traces from γ2 NP_GSG coexpressed with GluA2 (red) in response to a 500 ms pulse of 10 mM Glutamate show a substantial reduction in desensitization rate and extent (kdes = 43 s−1; Iss = 48%) compared to wild-type γ2 (dashed grey line). (C) Partially neutralizing the negative patch increased γ2-mediated superactivation more than two-fold. The grey trace represents wild type γ2. (D) Bar graphs showing the effects of neutralization of the γ2 negative patch on desensitization, steady-state current, superactivation. The rectification index was not changed, indicating relief of polyamine block was intact. Filled symbols correspond to the traces shown in A) and B). **p<0.01, ***p<0.001, against γ2. Source data for kinetic data in panel C is found in Table 1–source data 1. Source data for rectification indices in panel C is found in Figure 1–figure supplement 2–source data 1. Error bars represent s.e.m.
-
Figure 1—figure supplement 2—source data 1
Rectification indices for negative patch chimera.
- https://doi.org/10.7554/eLife.28680.008
Figure 1—figure supplement 3
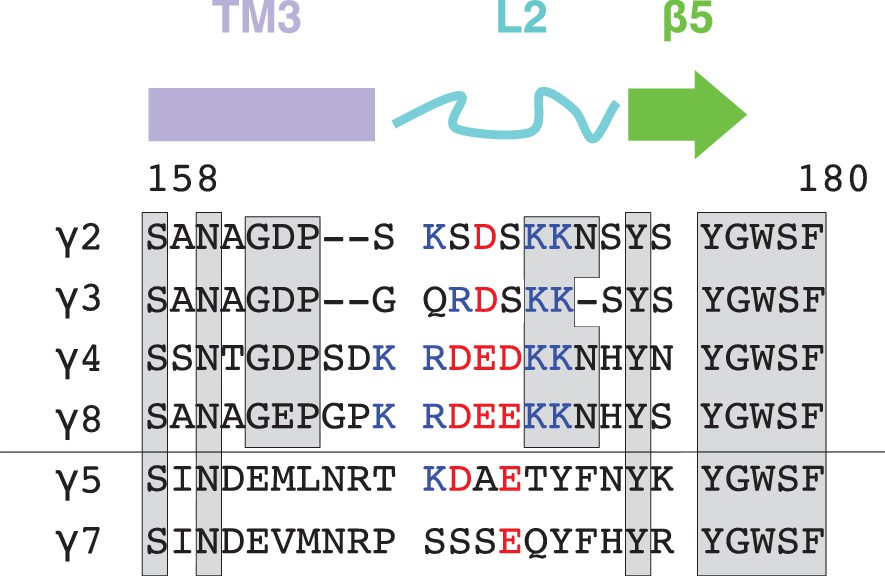
Sequence alignment and conservation of TARP loop 2.
TARP sequences (from rat) encompassing the loop 2 are aligned with secondary structure elements on top. Conserved residues are marked by grey boxes and positively and negatively charged residues are colored blue and red, respectively.
Figure 1—figure supplement 4
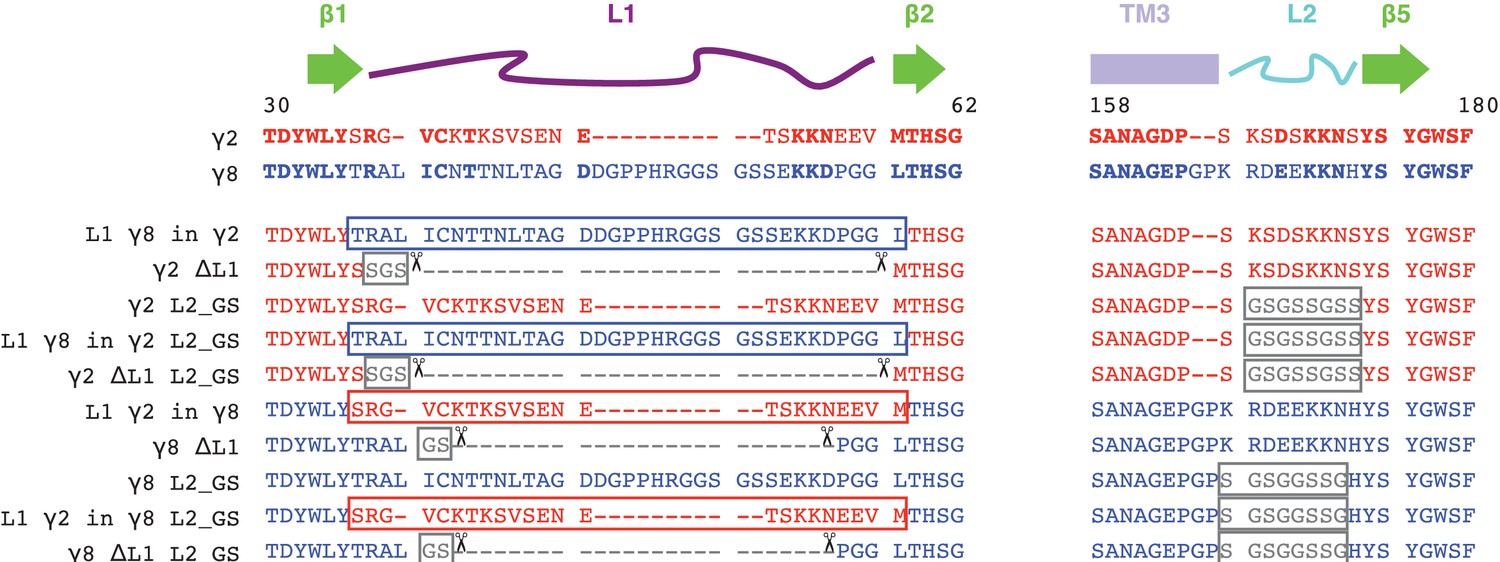
Sequence alignment of γ2 and γ8 constructs.
The sequences of the extracellular regions Loop1 (L1, purple) and Loop2 (L2, cyan) of γ2 (red) and γ8 (blue) are aligned with the secondary structural elements on top. Conserved residues are in bold. Constructs carrying deletions (L1, indicated by scissors), neutralization (L2, glycine-serine (GS)-Linker) and chimeras (switching L1 between the TARPs) and combinations of these are shown below.
Figure 2 with 1 supplement
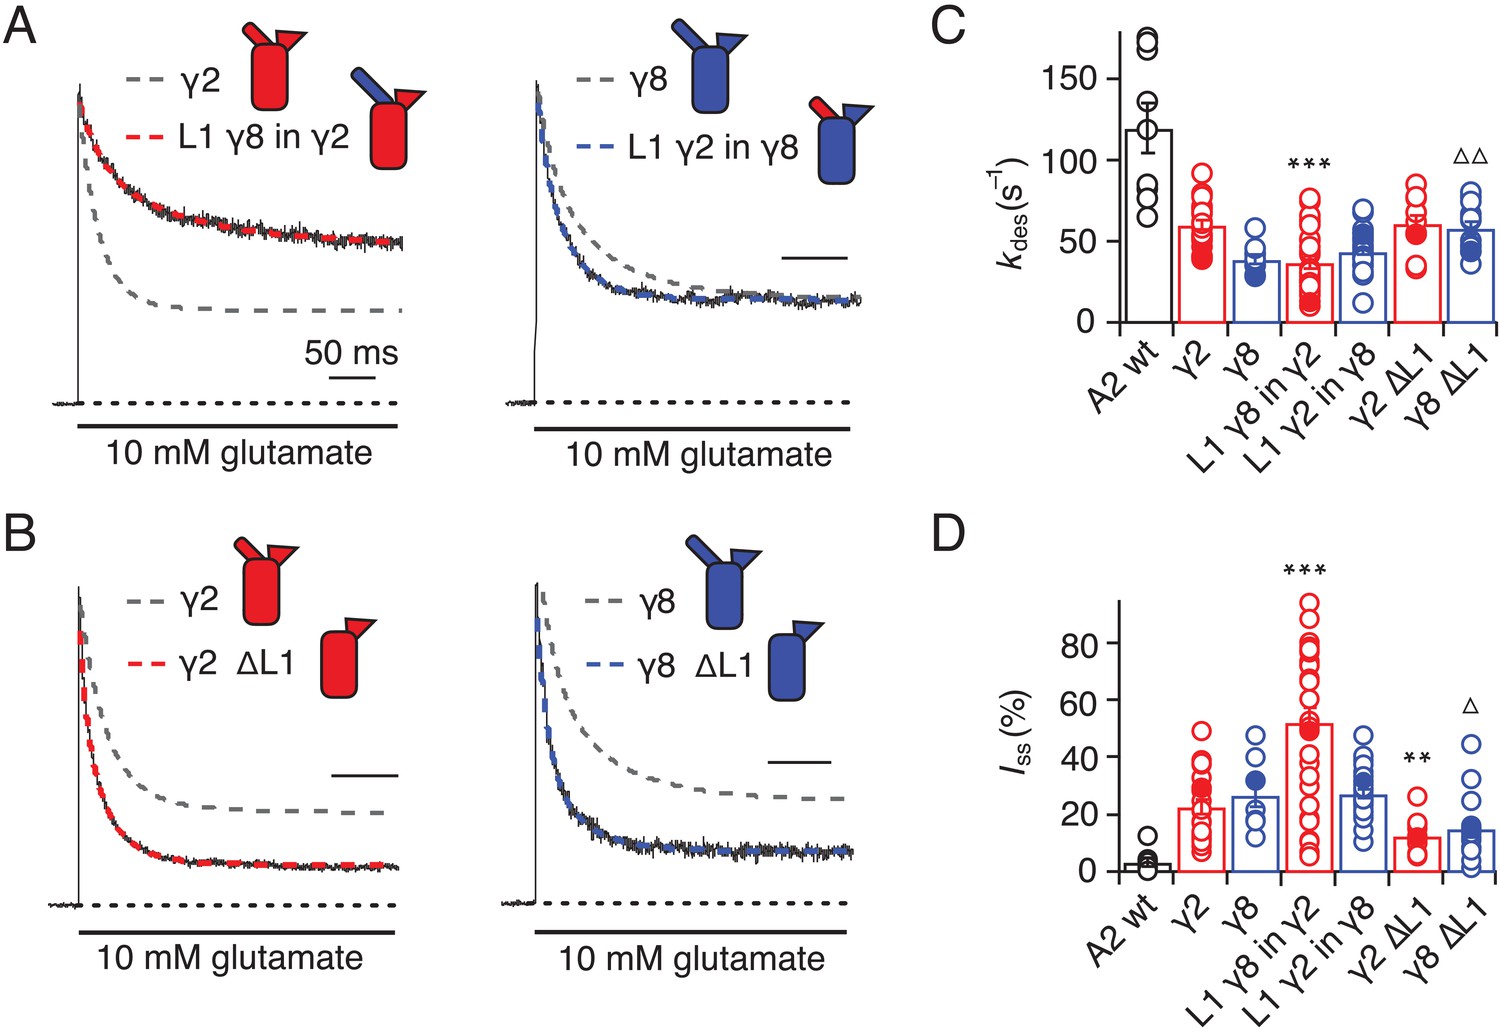
Desensitization properties of γ2 and γ8 L1 mutants.
(A) Representative traces from L1 γ8 in γ2 (red) and L1 γ2 in γ8 (blue) coexpressed with GluA2 in response to a 500 ms pulse of 10 mM Glutamate (kdes = 13 and 55 s−1; Iss = 50% and 30%, respectively). Example traces recorded from the parent TARPs coexpressed with GluA2 are shown in grey for comparison (kdes = 41 and 30 s−1; Iss = 30% and 30%, for γ2 and γ8, respectively). (B) Representative traces from γ2 ∆L1 (red) and γ8 ∆L1 (blue) coexpressed with GluA2 in response to a 500 ms pulse of 10 mM Glutamate (kdes = 55 and 45 s−1; Iss = 10% and 15%, respectively). The wild type constructs coexpressed with GluA2 are shown as dashed lines for comparison. (C) Bar graph summarizing the effects of the L1 mutation on the desensitization kinetics. (D) Bar graph summarizing the effects of the loop1 mutations on the steady state current of the complexes. Currents were recorded at +50 mV in the presence of 50 µM spermine in the pipette solution. For panels C and D, filled symbols correspond to the traces shown in (A) and (B). ***p<0.001, **p<0.01, against γ2; ∆ p<0.05, ∆∆ p<0.01, against γ8. Source data for panels C and D is found in Table 1–source data 1. Error bars represent s.e.m.
Figure 2—figure supplement 1
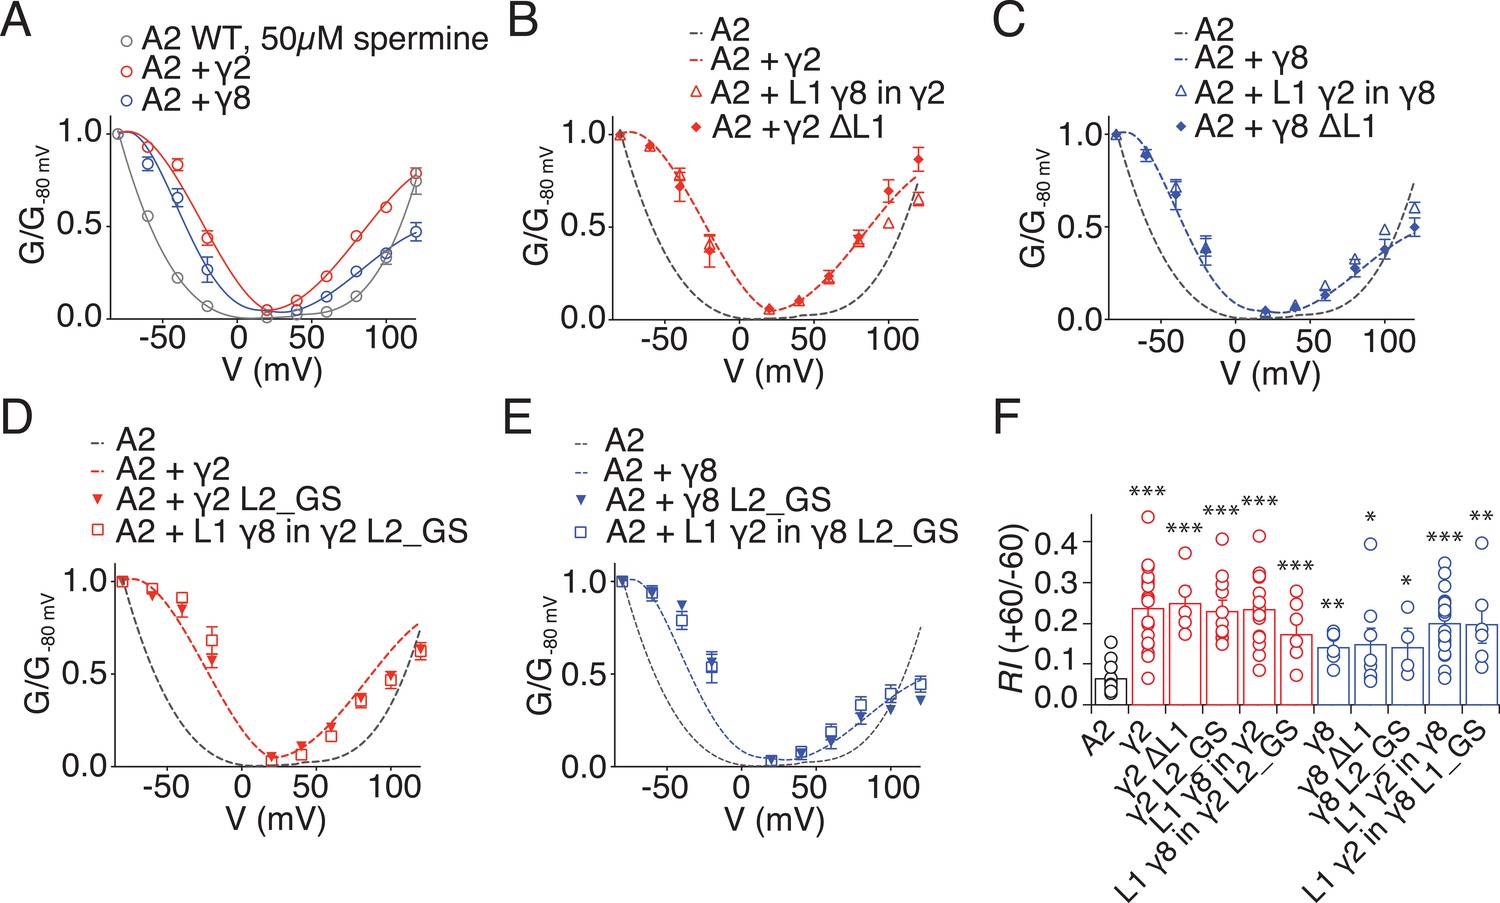
Relief of polyamine block is not affected by loop mutations in γ2 and γ8.
(A) Normalised conductance-voltage plots show that TARP γ2 (red) is better at relieving the polyamine (PA) block of unedited GluA2 receptors (grey) than γ8 (blue). (B) Relief of PA block by γ2 L1 mutants (filled symbols) is indistinguishable from that of the wild type construct (dashed line). GluA2 WT is shown in grey for comparison. (C) Replacing L1 of γ8 with that of γ2 or deleting it does not affect its ability to relief PA block of GluA2(Q) receptors. (D) Neutralizing L2 in γ2, alone or in combination with L1 from γ8, does not affect PA block. (E) Neutralizing L2 in γ8 and in γ8 with L1 from γ2 show similar PA block relief as γ8 wild type. (F) Bar graph summarizing the rectification index (RI, calculated as the ratio between the current recorded at +60 mV and that recorded at −60 mV) of γ2 (in red) and γ8 (in blue) loop mutants coexpressed with GluA2(Q). Currents were recorded in the presence of 50 µM spermine in the pipette solution. *p<0.05, **p<0.01, ***p<0.001, against GluA2(Q). Source data for panel F is found in Figure 2—figure supplement 1. Error bars represent s.e.m.
-
Figure 2—figure supplement 1—source data 1
Rectification indices for electrophysiological recordings of TARP chimeras.
- https://doi.org/10.7554/eLife.28680.013
Figure 3
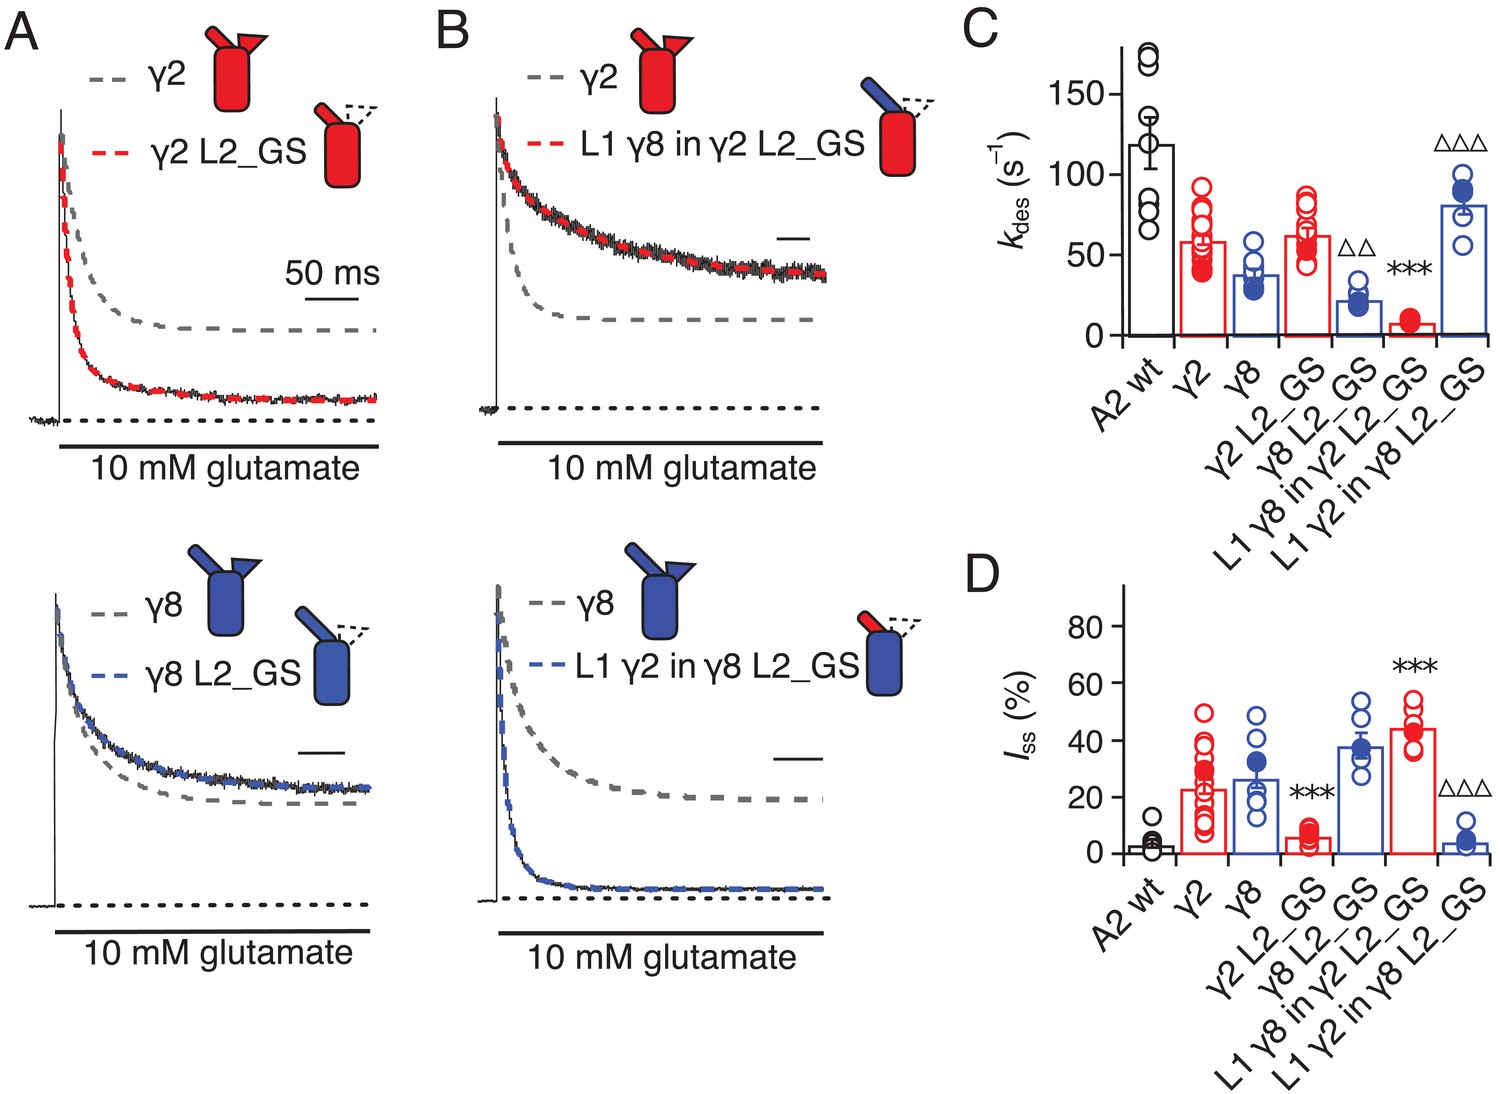
Desensitization properties of γ2 and γ8 L2 mutants.
(A) Neutralization of L2 in γ2 (γ2 L2_GS, red) decreased Iss, with little effect on γ8 (γ8 L2_GS, blue) (kdes = 50 and 20 s−1; Iss = 5% and 35%, respectively). Representative traces recorded from the parent TARPs are shown as dashed grey lines for comparison. (B) Representative traces from L1 γ8 in γ2 L2_GS (red) and L1 γ2 in γ8 L2_GS (blue) coexpressed with GluA2 in response to a 500 ms pulse of 10 mM Glutamate (kdes = 10 and 90 s–1; Iss = 40% and 5%, respectively). Traces from wild type γ2 and γ8 coexpressed with GluA2 are shown in grey for comparison. (C) Bar graph summarizing the effects of the L2 mutation on the desensitization kinetics. (D) Bar graph of the effects of the L2 mutation on the steady state current of the complexes. Filled symbols correspond to the traces shown in (A) and (B). ***p<0.001, against γ2; ∆∆∆ p<0.001, ∆∆ p<0.1, against γ8. Source data for panels C and D is found in Table 1–source data 1. Error bars represent s.e.m.
Figure 4
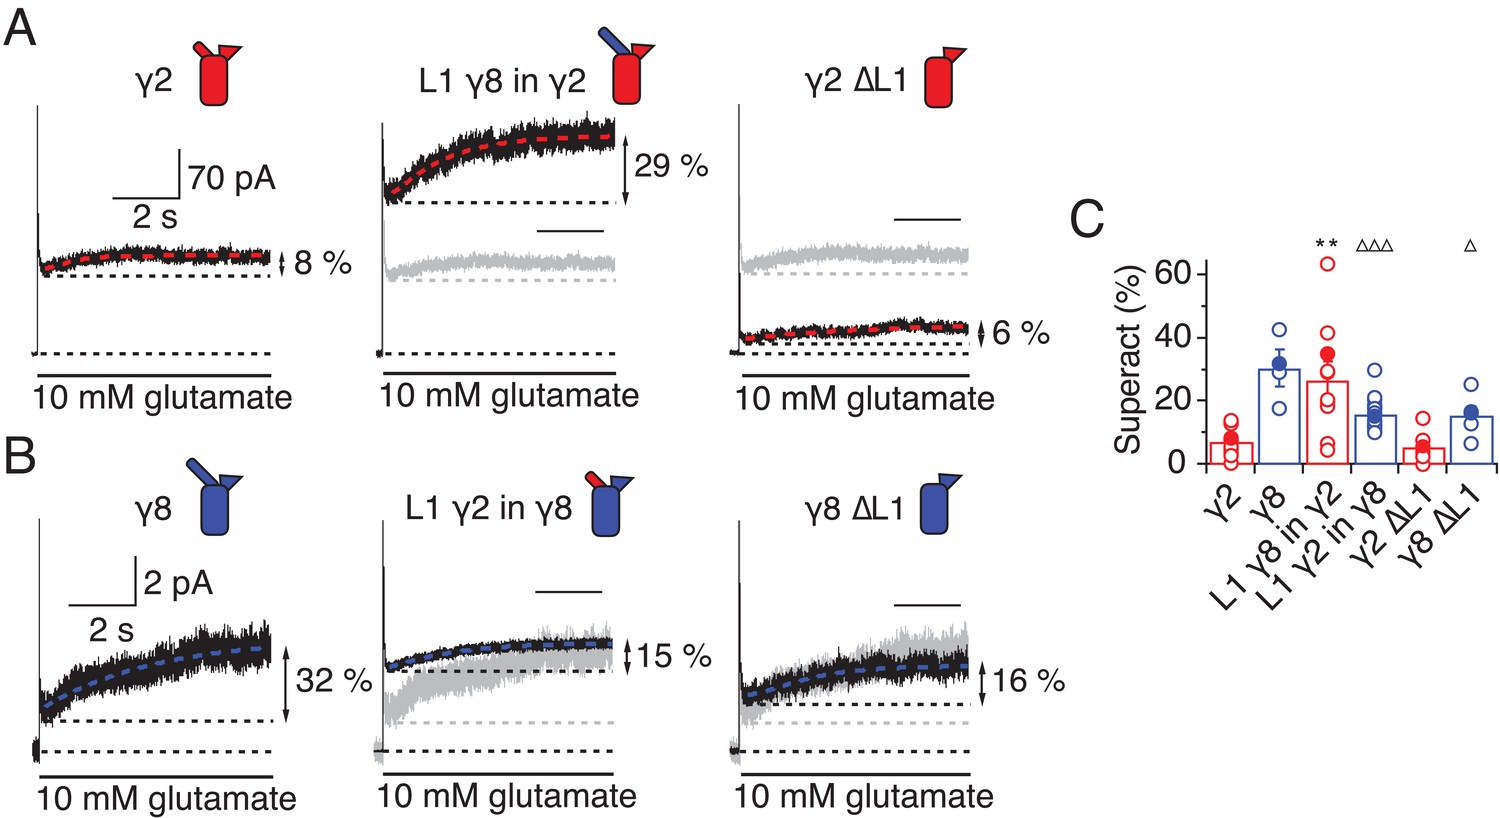
L1 modulates the extent of TARP-mediated superactivation.
(A) Example traces of γ2 wild-type and L1 mutants in response to 7 s application of 10 mM glutamate. During prolonged application of 10 mM Glutamate γ2 induced superactivation of GluA2 receptors, shown as an increase in the steady state current (8% in the example shown, left panel). The extent of superactivation was increased by 3-fold when L1 was replaced with that of γ8 (central panel). Removing loop1 in γ2 did not affect superactivation much (right panel). (B) γ8 showed much bigger superactivation than γ2 during long glutamate exposure (left panel). Shortening loop 1 by replacing it with that of γ2 or removing it decreased superactivation by 2-fold (central and right panel). (C) Bar graph summarizing the effects of the loop1 mutations on receptor superactivation. Currents were recorded at +50 mV in the presence of 50 µM spermine in the pipette solution. Filled symbols correspond to the traces shown in (A) and (B) **p<0.01, against γ2; ∆∆∆ p<0.001, ∆ p<0.05, against γ8. Source data for panel C is found in Table 1–source data 1. Error bars represent s.e.m.
Figure 5
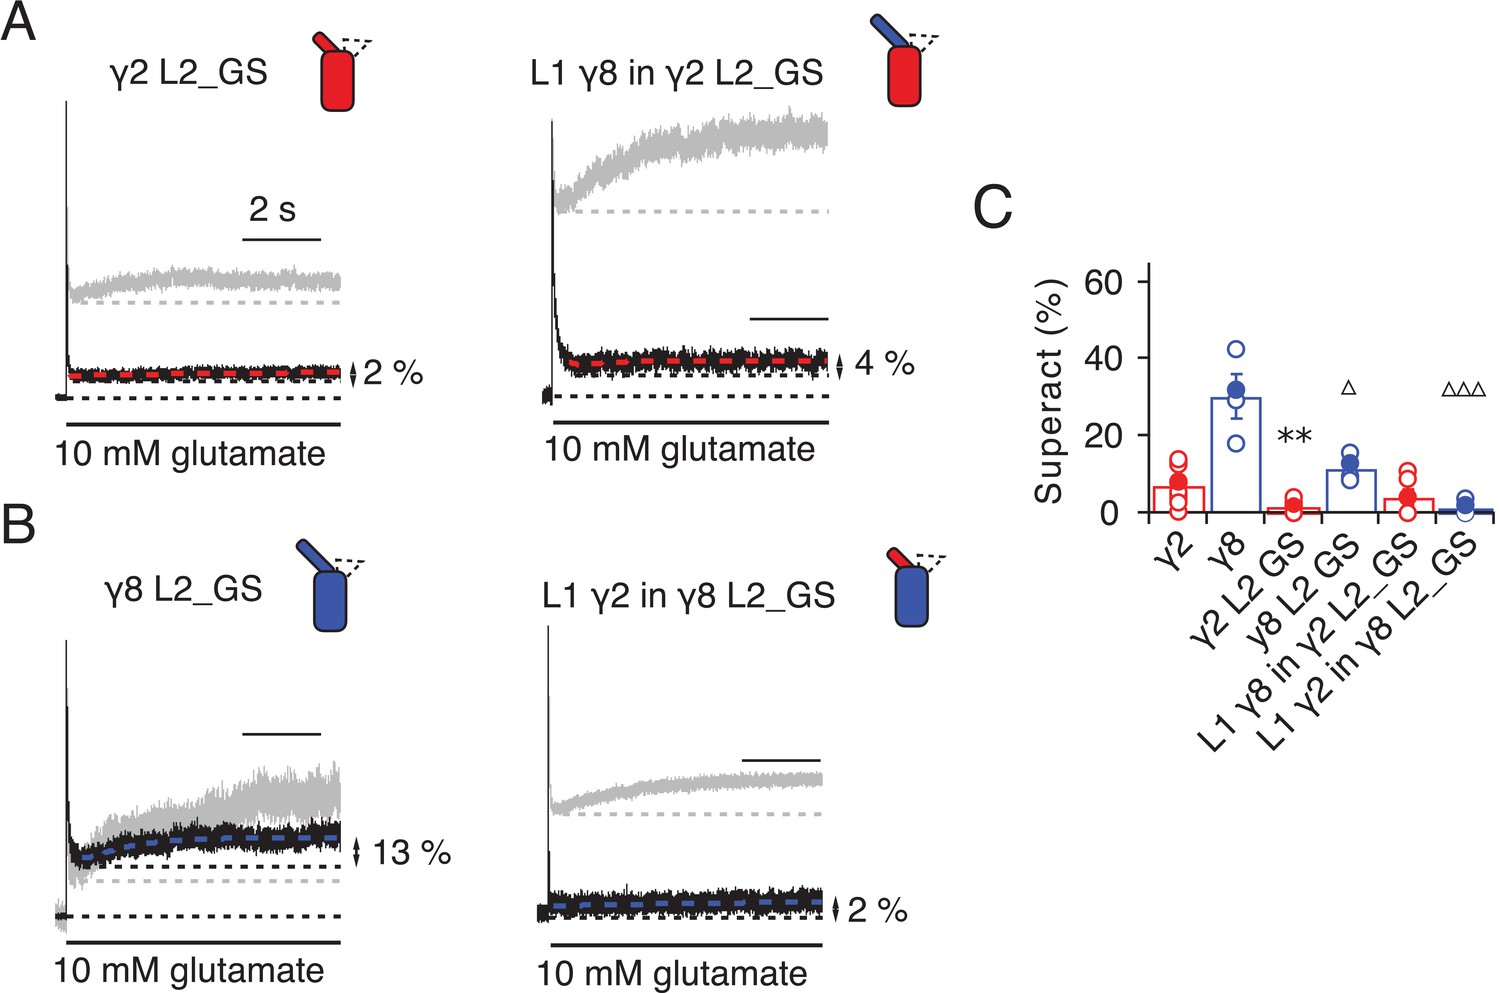
Superactivation of γ2 and γ8 L2 mutants.
(A) Neutralizing L2 from γ2 strongly reduced γ2-mediated superactivation (left panel). On this background, L1 from γ8 induced only minimal superactivation (right panel). The grey traces represent WT γ2 (left) and L1 γ8 in γ2 (right). (B) Removing L2 in γ8 decreased superactivation 2.5 fold (left panel). Introducing L1 from γ2 on this background practically abolished superactivation (right). The grey traces represent WT γ8 (left) and L1 γ2 in γ8 (right). (C) Bar graph of the effects of the L2 neutralization and L1 chimeras on superactivation. Filled symbols correspond to the traces shown in (A) and (B). **p<0.01, against γ2; ∆∆∆ p<0.001, ∆ p<0.05, against γ8. Source data for panel C is found in Table 1–source data 1. Error bars represent s.e.m.
Figure 6
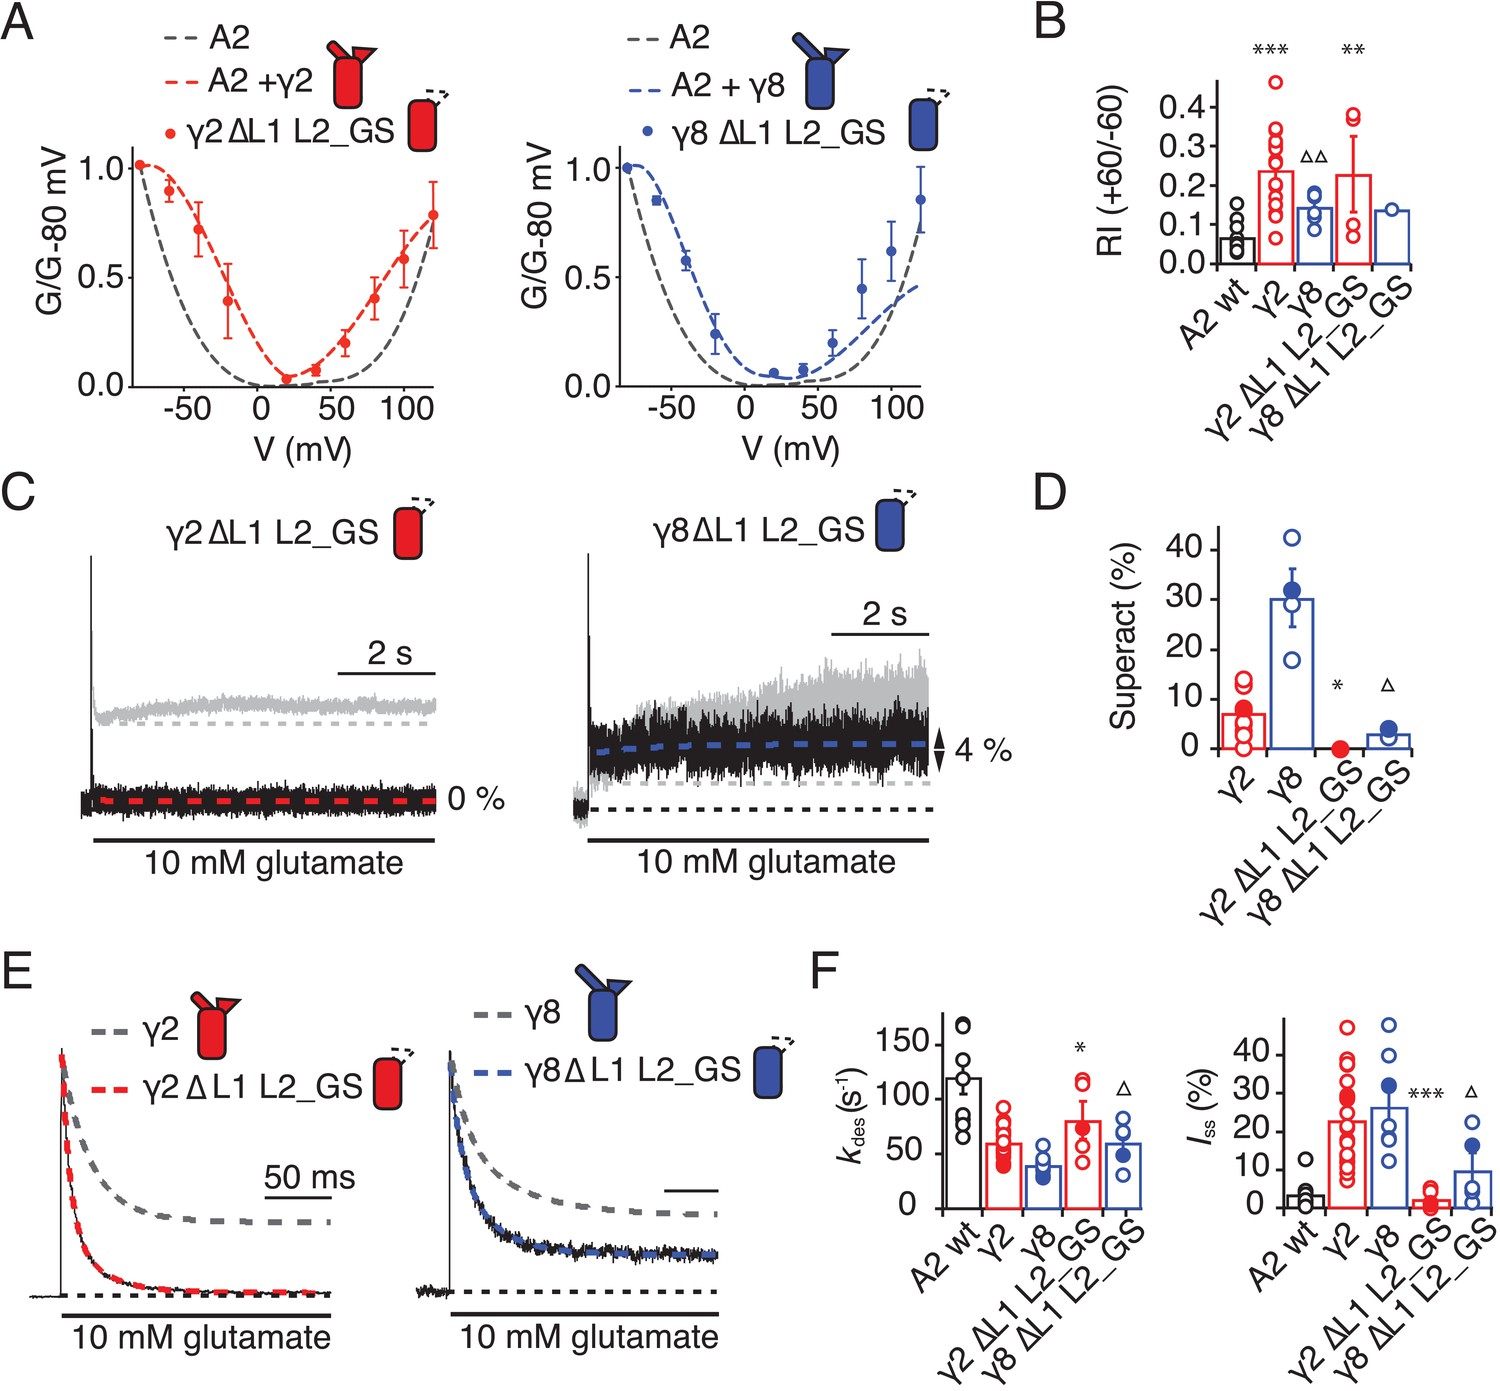
Eliminating L1 and L2 removes modulation by γ2.
(A) Mutation of both L1 and L2 in γ2 (left) and γ8 (right) did not change association of TARPs with AMPA receptors, as assessed by the G-V curve. GluA2 WT is shown in grey. (B) Bar graph summarizing the rectification index of the dual loop mutations. (C) Example traces of γ2 ΔL1 L2_GS (left) and γ8 ΔL1 L2_GS (right) in response to 7 s application of 10 mM glutamate. Corresponding wild-type TARPs are shown as dashed lines. (D) Bar graphs summarizing the effects of the dual loop mutation in γ2 (red) and γ8 (blue) on superactivation. (E) Representative traces from γ2 ΔL1 L2_GS (left) and γ8 ∆L1 L2_GS (right) coexpressed with GluA2 in response to a 500 ms pulse of 10 mM Glutamate (kdes = 74 and 50 s−1 Iss = 1.5% and 16%, respectively). Currents from the parent TARPs are shown in grey. (F) Bar graphs summarizing the effects of the dual loop mutation in γ2 (red) and γ8 (blue) on desensitization decay and the steady state current. Currents were recorded at +50 mV in the presence of 50 µM spermine in the pipette solution. For panels D, F and G, filled symbols correspond to the traces shown in (C) and (E). ***p<0.001, **p<0.01, *p<0.05, against γ2. Source data for panel B is found in Figure 6—source data 1. Source data for panels D, F and G is found in Table 1–source data 1. Error bars represent s.e.m.
-
Figure 6—source data 1
Rectification indices for electrophysiological recordings of TARP deletion chimeras.
- https://doi.org/10.7554/eLife.28680.018
Figure 7 with 2 supplements
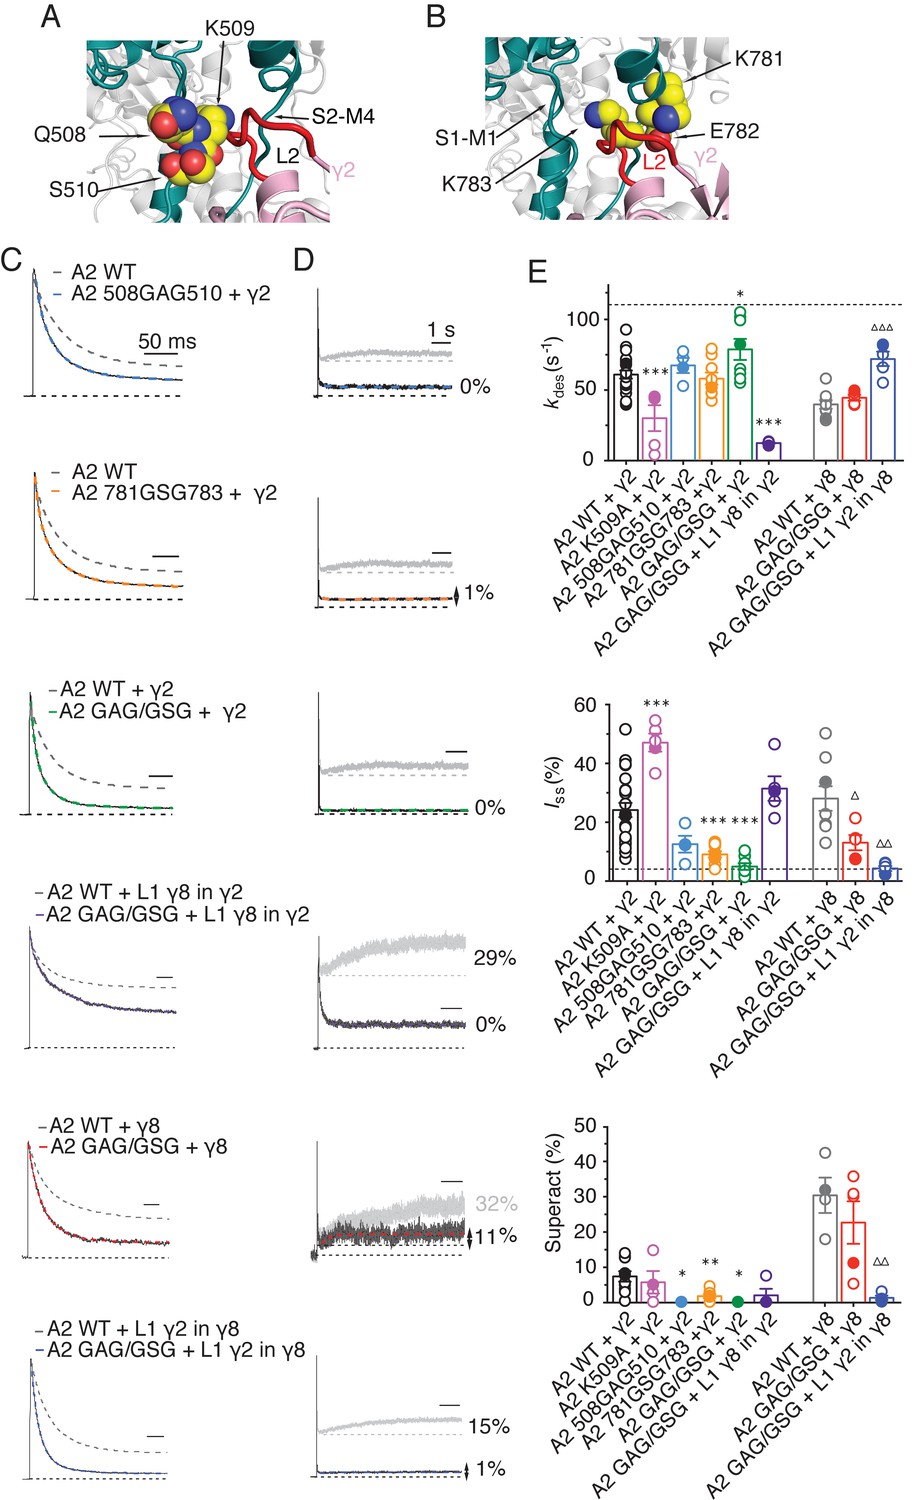
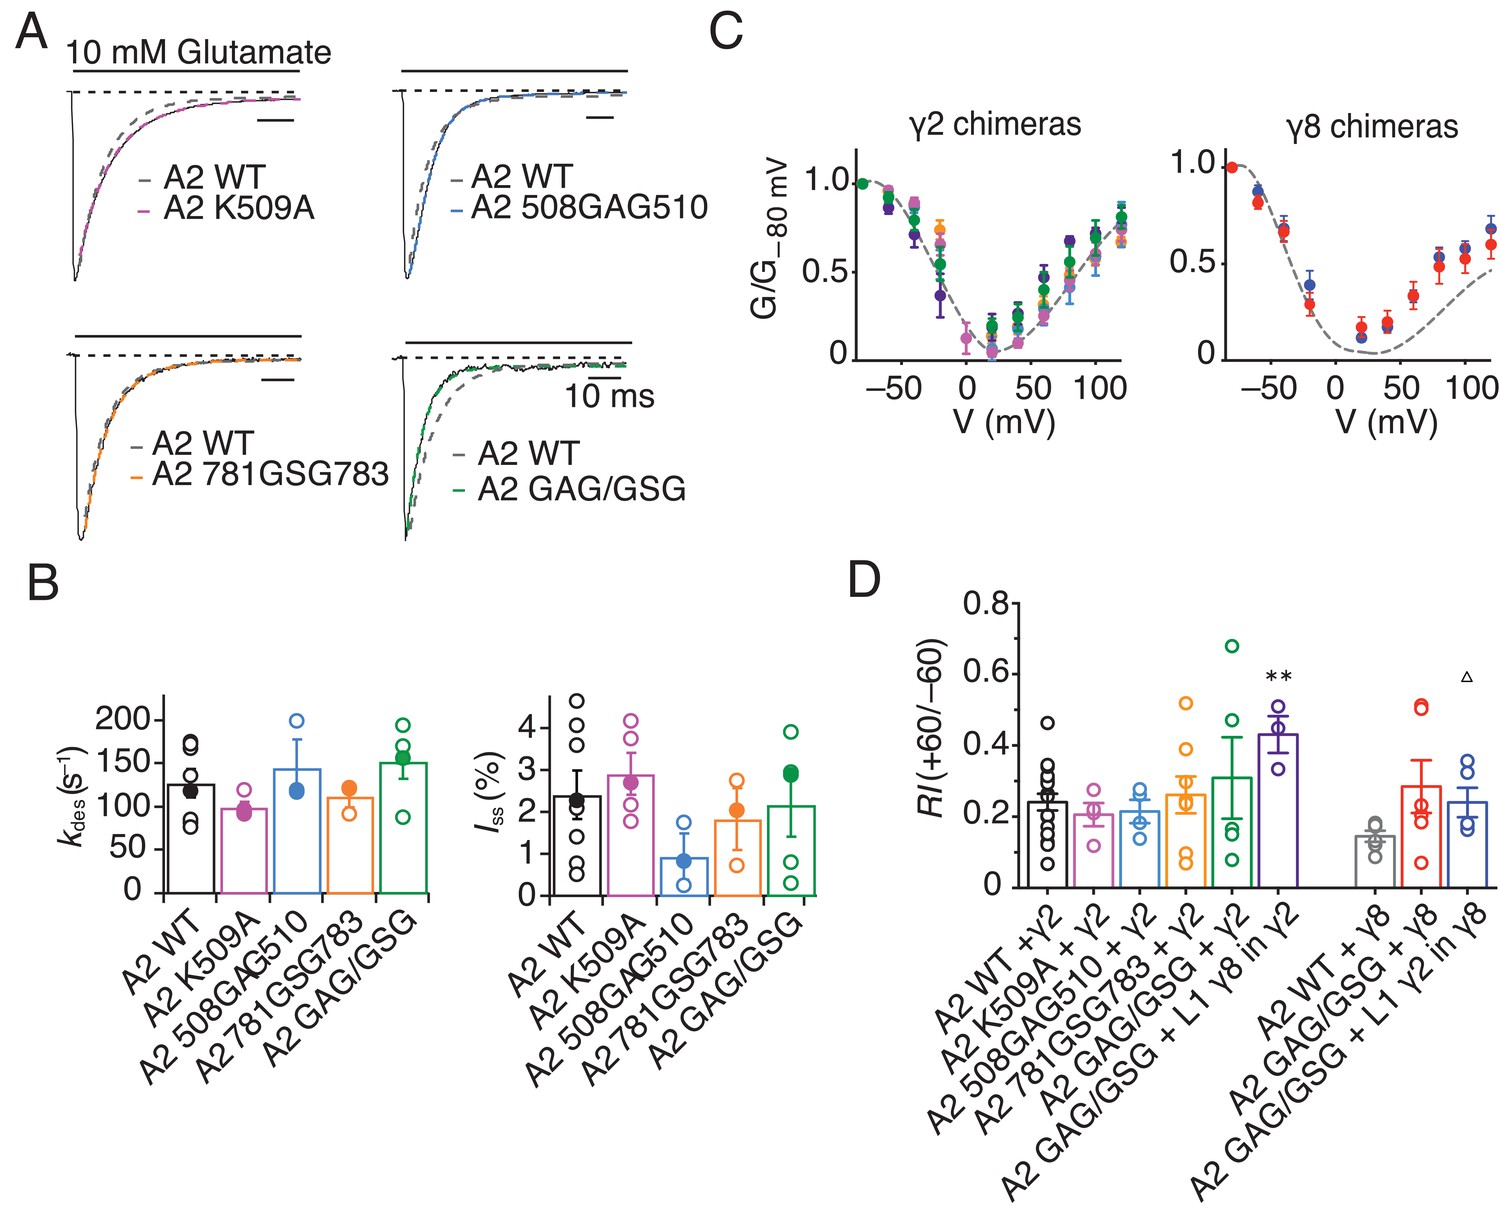
The LBD-TMD linkers are the key sites for modulation of AMPA receptor gating by TARPs.
(A) Residues in the S1-M1 linker (Gln508, Ser509, and Lys510 represented as yellow atomic spheres) are in close proximity to the L2 of TARPs (L2 of γ2 is shown in red). (B) Residues in the S2-M4 linker (Lys781, Glu782 and Lys783) predicted to interact with L2 are labeled and shown as yellow atomic spheres. (C) Example responses from linker mutants coexpressed with γ2, γ8 and loop 1 chimeras to 500 ms 10 mM Glutamate. (D) Representative responses from linker mutants coexpressed with γ2, γ8 and loop 1 chimeras to a 7 s pulse of 10 mM Glutamate. The extent of superactivation is indicated. (E) Bar graphs summarizing the desensitization properties (top panel), steady state current (central) and superactivation (bottom). Colors are as in panel C. Filled symbols correspond to the traces shown in panels C and D; dashed lines represent GluA2 wild-type. ***p<0.001, **p<0.01, *p<0.05, against γ2; ∆∆∆ p<0.001, ∆ p<0.05, against γ8. Source data for panel E is found in Table 1–source data 1. Error bars represent s.e.m.
Figure 7—figure supplement 1
GluA2 linker mutants do not affect receptor kinetics or assembly with TARPs.
(A) Representative traces from GluA2 linker mutants in response to 500 ms pulses of 10 mM Glutamate. GluA2 WT is shown in grey. (B) Bar graph summarizing the desensitization kinetics and the level of steady state current for GluA2 linker mutants. Filled dots represent the traces shown in A). (C) and (D) GV responses and rectification index for GluA2 mutants in complex with γ2 WT or L1 γ8 in γ2 chimera (left) and γ8 WT and L1 γ2 in γ8 chimera (right). **p<0.01, against γ2; ∆ p<0.05, against γ8. Source data for panel C is found in Table 1 – source data 1 and source data for panel D is found in Figure 7—figure supplement 1. Error bars represent s.e.m.
-
Figure 7—figure Supplement 1—source data 1
Rectification indices for electrophysiological recordings of TARPs with GluA2 mutants.
- https://doi.org/10.7554/eLife.28680.022
Figure 7—figure supplement 2
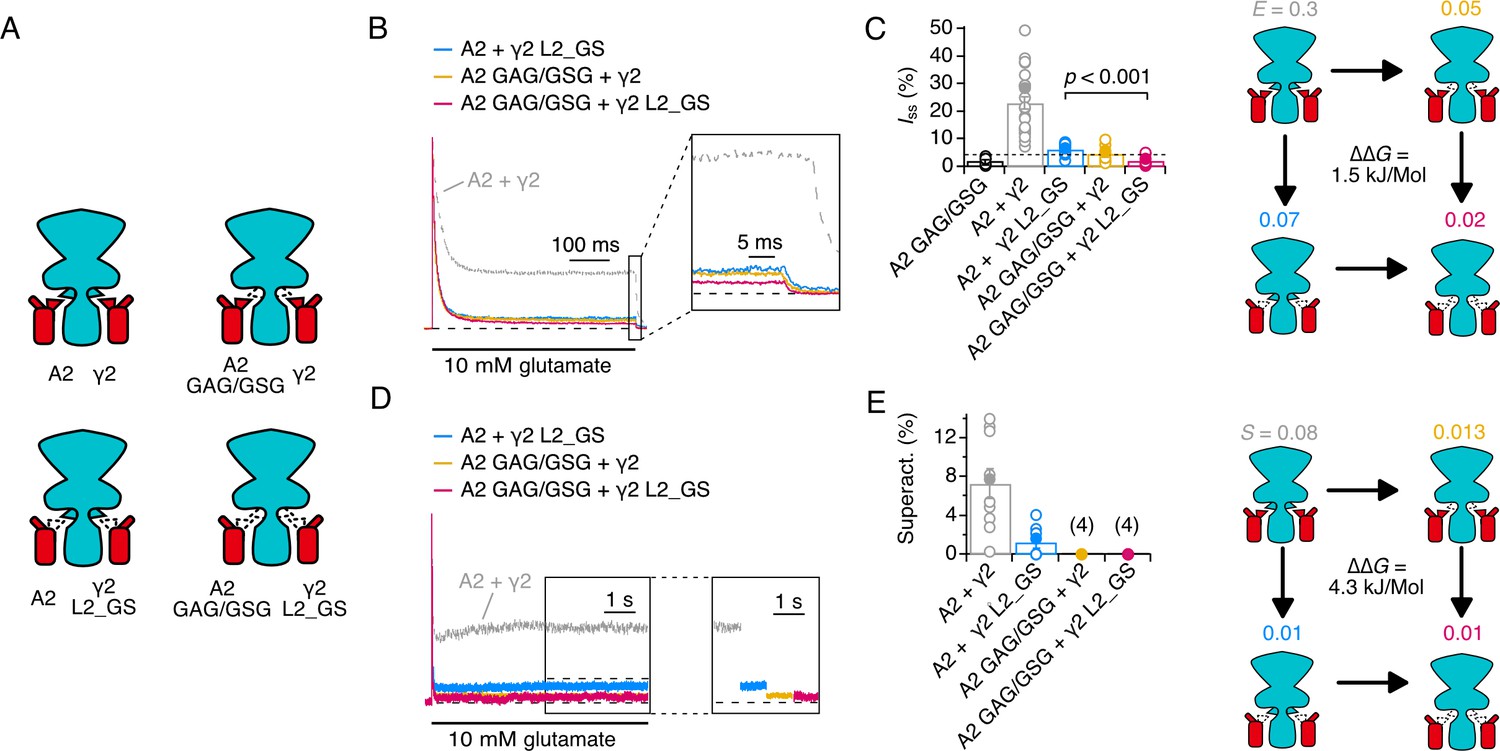
Thermodynamic coupling analysis for AMPAR linkers and γ2 loop 2.
(A) Illustration of the four conditions used to construct the thermodynamic cycle. Receptor (cyan) and γ2 (red) were cotransfected in wild type and mutant forms. (B) Normalised currents in response to a 500 ms pulse of 10 mM glutamate. The steady state current at the end of the pulse is magnified in the inset. (C) Bar plot of the steady state currents. A2 GAG/GSG mutant has a 2-fold lower steady state current than wild-type GluA2. Efficacies for channel opening are indicated on the cycle, with the coupling energy. See Materials and methods for details of calculations. (D) Superactivation in response to a long (7 s) pulse of 10 mM glutamate. Inset shows current levels displaced. (E) Bar plot of superactivation extents. Superactivation was too small to measure for A2 GAG/GSG in either condition. For the coupling analysis, efficacy was calculated with the most conservative reduction in superactivation (to 1%).
Figure 8
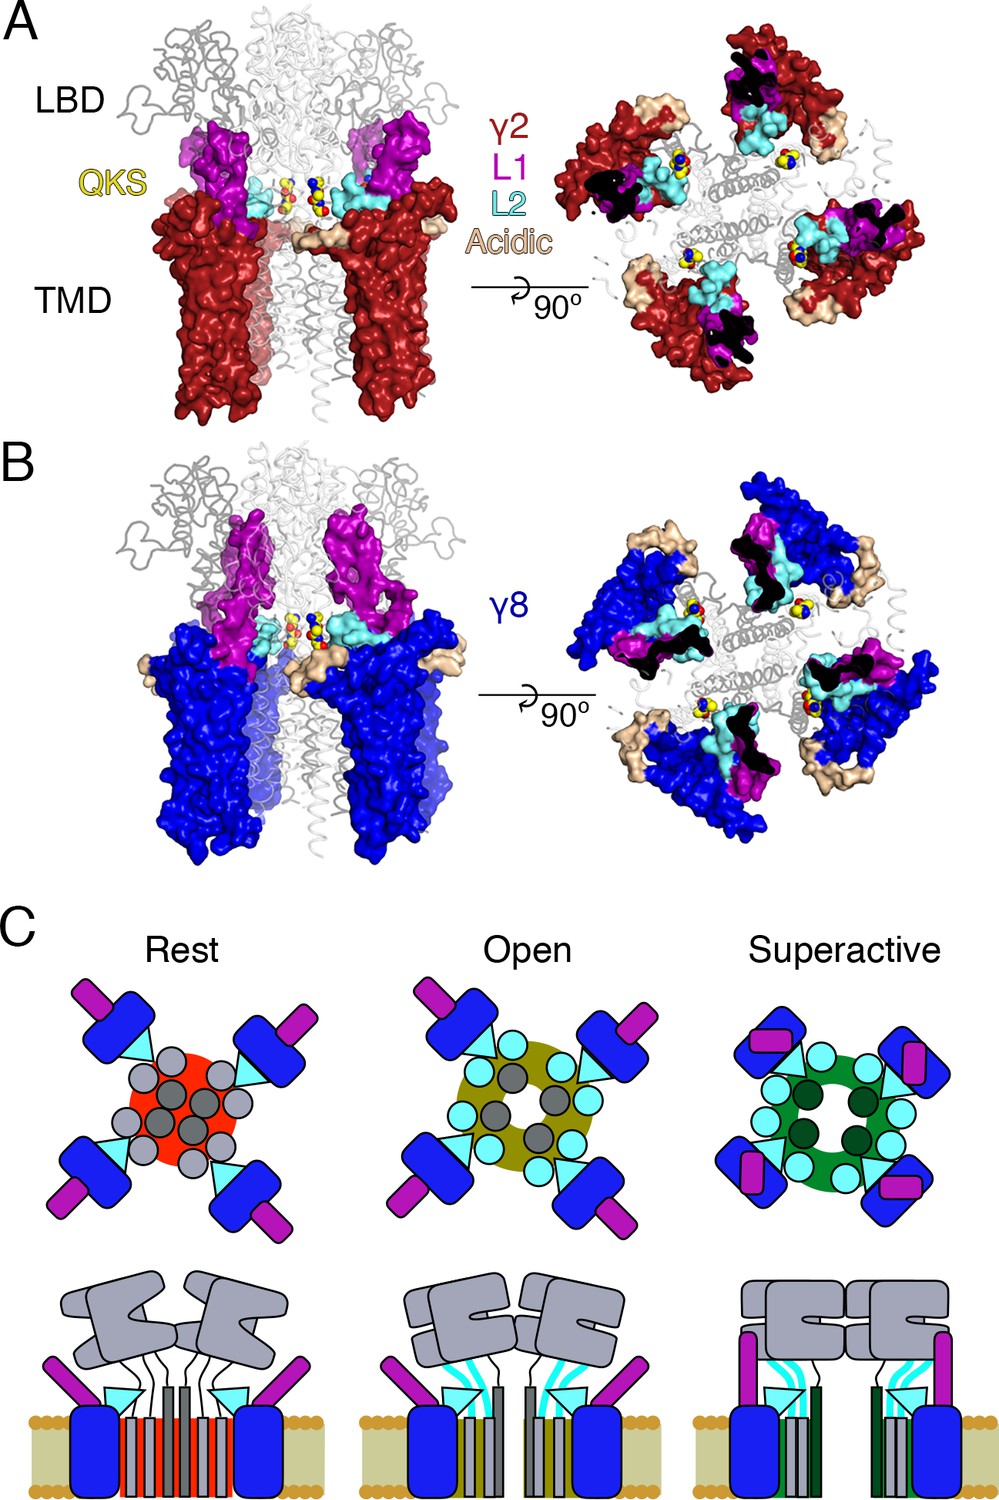
Proposed mechanism of AMPA modulation by TARPs.
(A) Model of a AMPA-γ2 complex in front view (left) and top view (right). Four molecules of γ2 (red) are shown with L1 and L2 colored in magenta and cyan, respectively. L2 is sandwiched between the LBD-TMD connecting linkers of the receptor (grey, amino terminal domains omitted for clarity). The QKS sequence on the S1-M1 linker is shown as yellow atomic spheres. The acidic patch on the β4-TM2 linker is indicated in wheat. (B) The model of γ8 (blue) shows the similar interactions of L2 (cyan). The orientation of the more extensive loop 1 of γ8 is not known, here it is depicted reaching up to the LBD dimer. (C) Cartoon model of the proposed AMPA modulation mechanism, taking the example of γ8. The AMPA-TARP complex is shown from top (upper panel) and in side view (lower panel). The receptor is colored in grey (pore forming M3 domain depicted in dark grey). γ8 is colored as in panel B, with the acidic patch omitted. In the resting state (indicated by a red, closed pore) L2 is positioned in close proximity to the LBD-TMD connecting linkers. Once glutamate binds to the LBD, the resulting conformational change is transduced via the LBD-TMD linkers to open the pore (olive green, open state). During this transition L2 could wedge between the S1-M1 and S2-M4 linkers to modulate the receptor gating. The concerted action of L1 and L2 is necessary for superactivation of the receptor (dark green, high open probability state), most likely via L1 to stabilizing the LBDs layer.
Tables
Table 1
Kinetic properties of wild type and chimeric TARPs and GluA2 linker mutants.
kdes is rate of desensitization, Iss the steady state current expressed as percentage of the peak current and "Superact." the extent of superactivation expressed as the slow increase in steady state current during prolonged exposure to glutamate (see Materials and methods for details). The number of patches recorded for each condition is shown in brackets. Values are shown as mean ± s.e.m. p values (from Student’s t test) are calculated as follows: § against the parent TARP; ∆ against GluA2 WT; # against GluA2 WT + TARP. Currents recorded in the presence of TARPs were held at +50 mV in the presence of 50 µM spermine in the pipette solution. Recordings in the absence of TARPs were done at –60 mV without intracellular polyamines. Source data for Table 1 is found in Table 1–source data 1.
| Construct | kdes (s-1) | P | Iss (%) | P | Superact. (%) | P |
|---|---|---|---|---|---|---|
| A2 wt | 120 ± 15 (9) | 5 ± 1 | − | − | ||
| γ2 | 60 ± 5 (24) | 25 ± 2 | 7 ± 2 (10) | |||
| γ8 | 40 ± 5 (9) | 25 ± 5 | 30 ± 6 (4) | |||
| γ2 β4 TM2 § | 40 ± 5 (7) | 0.004 | 50 ± 5 | 1 × 10⁻⁵ | 17 ± 4 (5) | 0.009 |
| L1 γ8 in γ2 § | 35 ± 5 (30) | 5 × 10⁻⁶ | 50 ± 5 | 7 × 10⁻⁶ | 27 ± 6 (10) | 0.003 |
| L1 γ2 in γ8 § | 45 ± 1 (28) | 0.34 | 25 ± 3 | 0.86 | 16 ± 1 (16) | 0.001 |
| γ2 ΔL1 § | 60 ± 5 (11) | 0.90 | 15 ± 2 | 0.008 | 6 ± 2 (6) | 0.52 |
| γ8 ΔL1 § | 60 ± 5 (15) | 0.002 | 15 ± 3 | 0.03 | 16 ± 3 (6) | 0.02 |
| γ2 L2_GS § | 65 ± 5 (15) | 0.49 | 5 ± 1 | 1 × 10⁻⁶ | 1.3 ± 0.6 (8) | 0.003 |
| γ8 L2_GS § | 25 ± 5 (6) | 0.002 | 40 ± 4 | 0.07 | 12 ± 2 (4) | 0.01 |
| L1 γ8 in γ2 L2_GS § | 10 ± 0.5 (7) | 6 × 10⁻¹⁰ | 45 ± 3 | 6 × 10⁻⁵ | 4 ± 2 (6) | 0.19 |
| L1 γ2 in γ8 L2_GS § | 85 ± 5 (6) | 1 × 10⁻⁵ | 5 ± 1 | 0.001 | 1 ± 0.7 (6) | 9 × 10⁻⁵ |
| γ2 ΔL1 L2_GS § | 80 ± 20 (5) | 0.03 | 2 ± 1 | 4 × 10⁻⁴ | 0 (4) | 0.011 |
| γ8 ΔL1 L2_GS § | 60 ± 10 (5) | 0.02 | 10 ± 5 | 0.02 | 3 ± 1 (4) | 0.02 |
| A2 K509A ∆ | 100 ± 5 (5) | 0.34 | 3 ± 0.5 | 0.71 | − | − |
| A2 508GAG510 ∆ | 145 ± 35 (3) | 0.42 | 1 ± 0.5 | 0.27 | − | − |
| A2 781GSG783 ∆ | 110 ± 15 (3) | 0.76 | 2 ± 1 | 0.46 | − | − |
| A2 GAG/GSG ∆ | 150 ± 20 (5) | 0.20 | 2 ± 1 | 0.44 | − | − |
| A2 K509A + γ2 # | 30 ± 10 (5) | 3 × 10⁻⁴ | 45 ± 3 | 2 × 10⁻⁴ | 5 ± 5 (4) | 0.59 |
| A2 508GAG510 + γ2 # | 70 ± 5 (4) | 0.39 | 10 ± 5 | 0.07 | 0 (3) | 0.03 |
| A2 781GSG783 + γ2 # | 60 ± 5 (9) | 0.60 | 10 ± 1 | 0.001 | 2 ± 0.5 (8) | 0.005 |
| A2 GAG/GSG + γ2 # | 80 ± 5 (8) | 0.01 | 5 ± 1 | 9 × 10⁻⁵ | 0 (4) | 0.01 |
| A2 GAG/GSG + L1 γ8 in γ2 # | 12 ± 0.5 (5) | 4 × 10⁻⁸ | 30 ± 5 | 0.21 | 2 ± 2 (4) | 0.065 |
| A2 GAG/GSG + γ8 # | 45 ± 2 (5) | 0.30 | 12 ± 3 | 0.03 | 25 ± 5 (5) | 0.37 |
| A2 GAG/GSG + L1 γ2 in γ8 # | 72 ± 5 (5) | 8 × 10⁻⁵ | 4 ± 1 | 0.001 | 1 ± 1 (4) | 0.001 |
| A2 GAG/GSG + γ2 L2_GS # | 90 ± 10 (9) | 3 × 10⁻⁴ | 2 ± 1 | 5 × 10⁻⁶ | 0 (4) | 0.01 |
-
Table 1–source data 1
Kinetics and steady state currents from electrophysiological recordings.
- https://doi.org/10.7554/eLife.28680.010
Additional files
-
Transparent reporting form
- https://doi.org/10.7554/eLife.28680.024
Download links
A two-part list of links to download the article, or parts of the article, in various formats.
Downloads (link to download the article as PDF)
Open citations (links to open the citations from this article in various online reference manager services)
Cite this article (links to download the citations from this article in formats compatible with various reference manager tools)
Control of AMPA receptor activity by the extracellular loops of auxiliary proteins
eLife 6:e28680.
https://doi.org/10.7554/eLife.28680


