Spatio-temporal control of mutualism in legumes helps spread symbiotic nitrogen fixation
- Université de Toulouse, INRA, CNRS, France
- Massey University, New Zealand
- Fédération de Recherches Agrobiosciences, Interactions et Biodiversité, Plateforme d’Imagerie TRI, CNRS - UPS, France
- Max Planck Institute for Evolutionary Biology, Germany
Figures
Figure 1 with 1 supplement
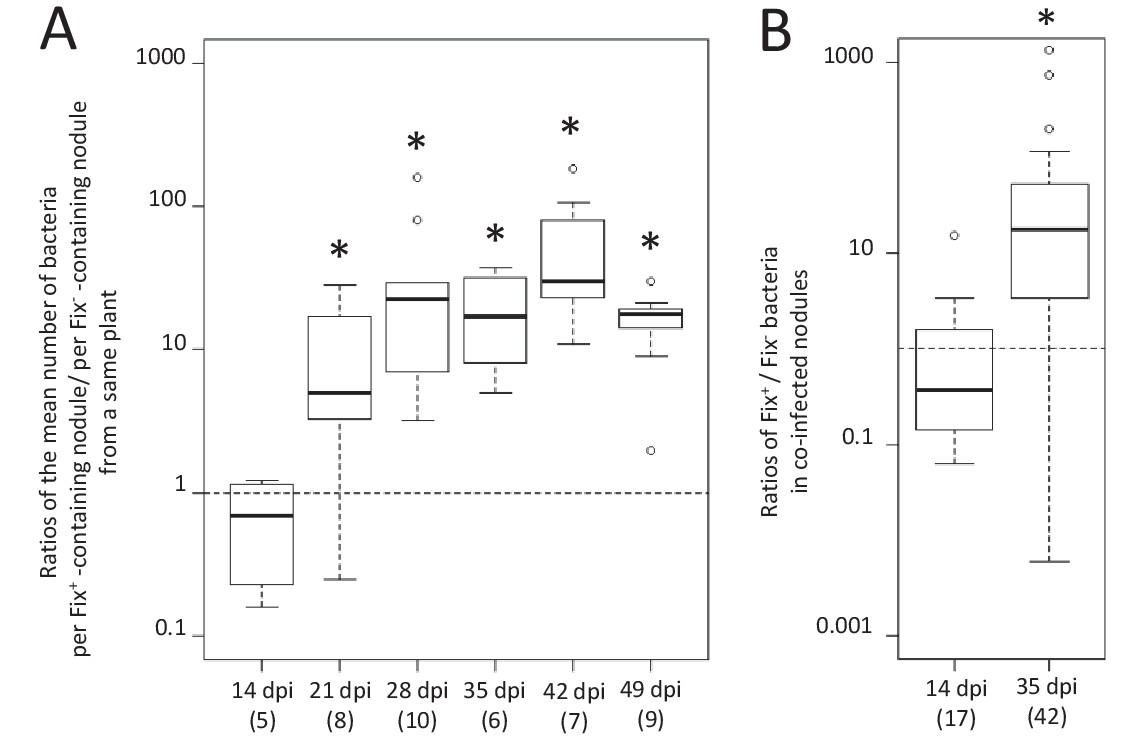
Kinetics of reproductive fitness of Fix+ and Fix- bacteria in nodules following co-inoculation of M. pudica.
M. pudica plants were co-inoculated with a mixture of Fix+ and Fix- strains at a 1/1 ratio, using 106 (A) or 1010 bacteria/plant (B). Nodules were individually analyzed by plating their bacterial population (see Figure 1—figure supplement 1). Co-infected nodules represented ca. 3% (A) or 20% (B) of the nodules. (A) The ratio of the mean number of bacteria per Fix+-containing nodule to the mean number of bacteria per Fix-- containing nodule was calculated for each individual plant at each time point (see Figure 1—figure supplement 1) and box plots represent the distribution of these ratios (Figure 1—source data 1). Only single-infected nodules were taken into account in this graph. (B) Box plots represent the distribution of the ratios of Fix+ bacteria to Fix- bacteria in co-infected nodules (Figure 1—source data 2). Central rectangles span the first quartile to the third quartile (that is, the interquartile range or IQR), bold segments inside rectangles show the median, unfilled circles indicate suspected outliers, whiskers above and below the box show either the locations of the minimum and maximum in the absence of suspected outlying data or 1.5 × IQR if an outlier is present. Horizontal dashed lines correspond to ratios equal to 1. The number of plants (A) or nodules (B) analyzed is indicated in brackets. *Significant differences between the number of Fix+ and Fix- bacteria per nodule (p<0.05, multiple comparison test after Kruskal-Wallis (A); p<0.001, after Student t-test with paired data (B).
-
Figure 1—source data 1
Reproductive fitness of nodule bacteria following co-inoculation with Fix+ (CBM2700) and Fix- (CBM2707) C. taiwanensis.
- https://doi.org/10.7554/eLife.28683.005
-
Figure 1—source data 2
Reproductive fitness of nodule bacteria in nodules co-infected by Fix+ (CBM2700) and Fix- (CBM2707) C. taiwanensis.
- https://doi.org/10.7554/eLife.28683.006
Figure 1—figure supplement 1
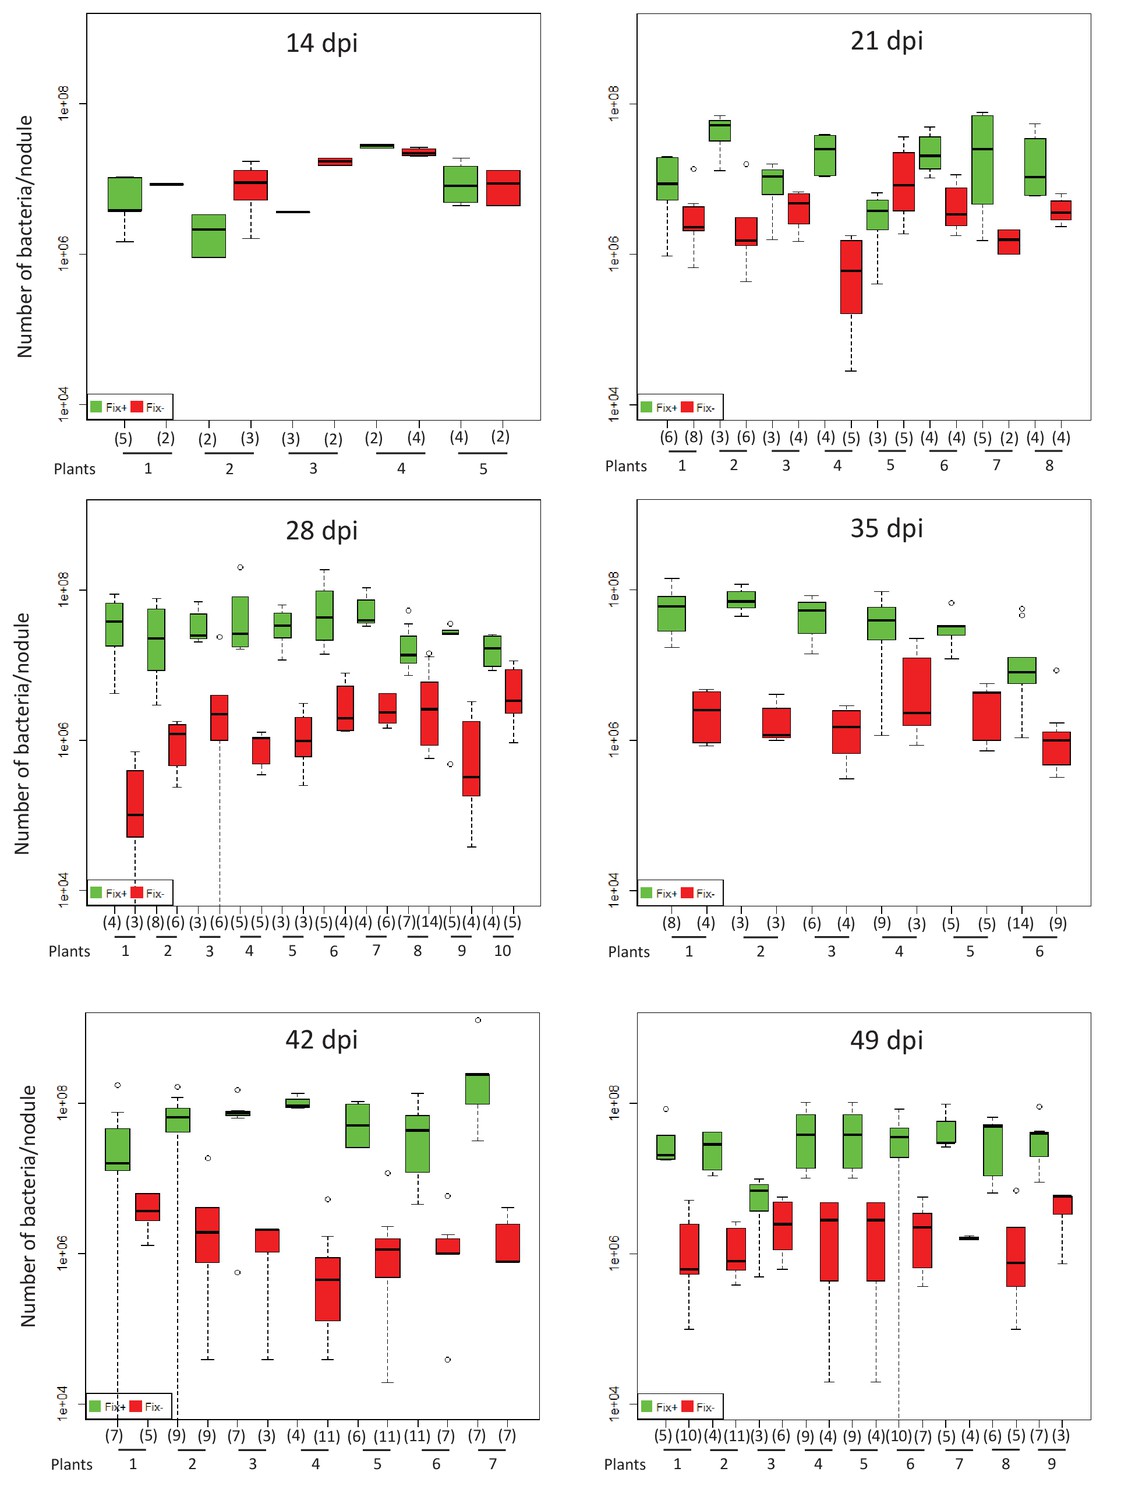
Kinetics of reproductive fitness of nodule bacteria following co-inoculation with Fix+ (CBM2700) and Fix- (CBM2707) C. taiwanensis.
Strains were inoculated in ratio 1/1. M. pudica nodules were individually analyzed. Box plots were constructed as described in Figure 1. All nodules from each plant were analyzed individually (Figure 1—source data 1). The number of nodules analyzed is indicated in brackets.
Figure 2
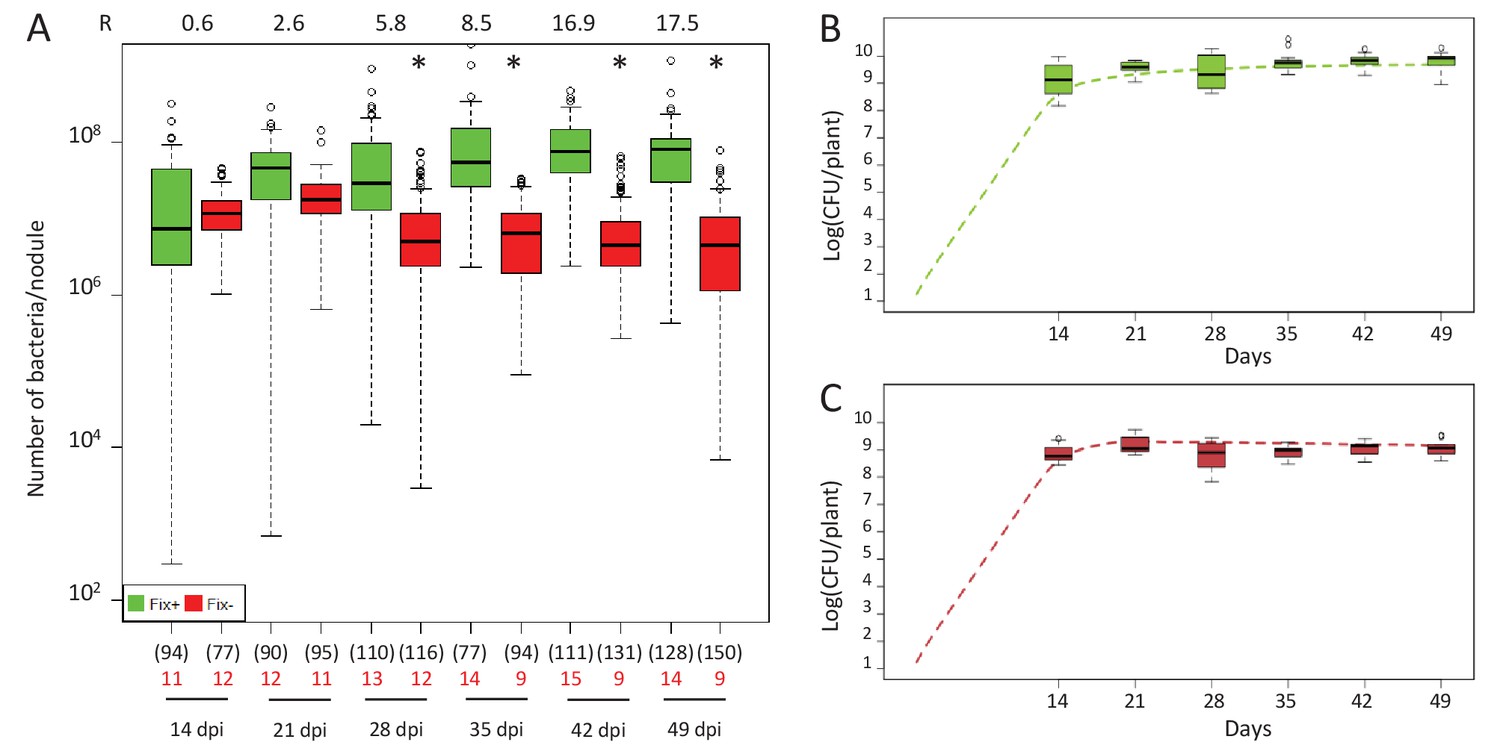
Kinetics of reproductive fitness of Fix+ or Fix- nodule bacteria following single-inoculation of M. pudica.
(A) Fix+ (CBM382) or Fix- (CBM2568) C. taiwanensis were inoculated on M. pudica. Box plots represent the distribution of the number of bacteria recovered per nodule on plates. Box plots were constructed as described in Figure 1. R, ratios of the median number of Fix+ bacteria per nodule on the median number of Fix- bacteria per nodule. The number of nodules analyzed at each time point is indicated in brackets. The number of plants analyzed at each time point is indicated in red. Results are from two independent experiments (Figure 2—source data 1). *Significantly different from the number of Fix+ bacteria per nodule (p<0.05 multiple comparison test after Kruskal-Wallis). (B, C) Theoretical reproductive fitness of Fix+ (B) and Fix- bacteria (C) following single-inoculation of M. pudica as compared to experimental data. Dotted lines represent bacterial populations per plant averaged over 200 replicate simulations (Figure 2—source data 2). Box plots represent the distribution of the number of bacteria experimentally recovered per plant. Experimental data are from (A).
-
Figure 2—source data 1
Reproductive fitness of nodule bacteria following single-inoculations with either Fix+ (CBM382) or Fix- (CBM2568) C. taiwanensis.
- https://doi.org/10.7554/eLife.28683.008
-
Figure 2—source data 2
Simulation data for the reproductive fitness of Fix+ and Fix- bacteria following single inoculations of M. pudica.
- https://doi.org/10.7554/eLife.28683.009
Figure 3
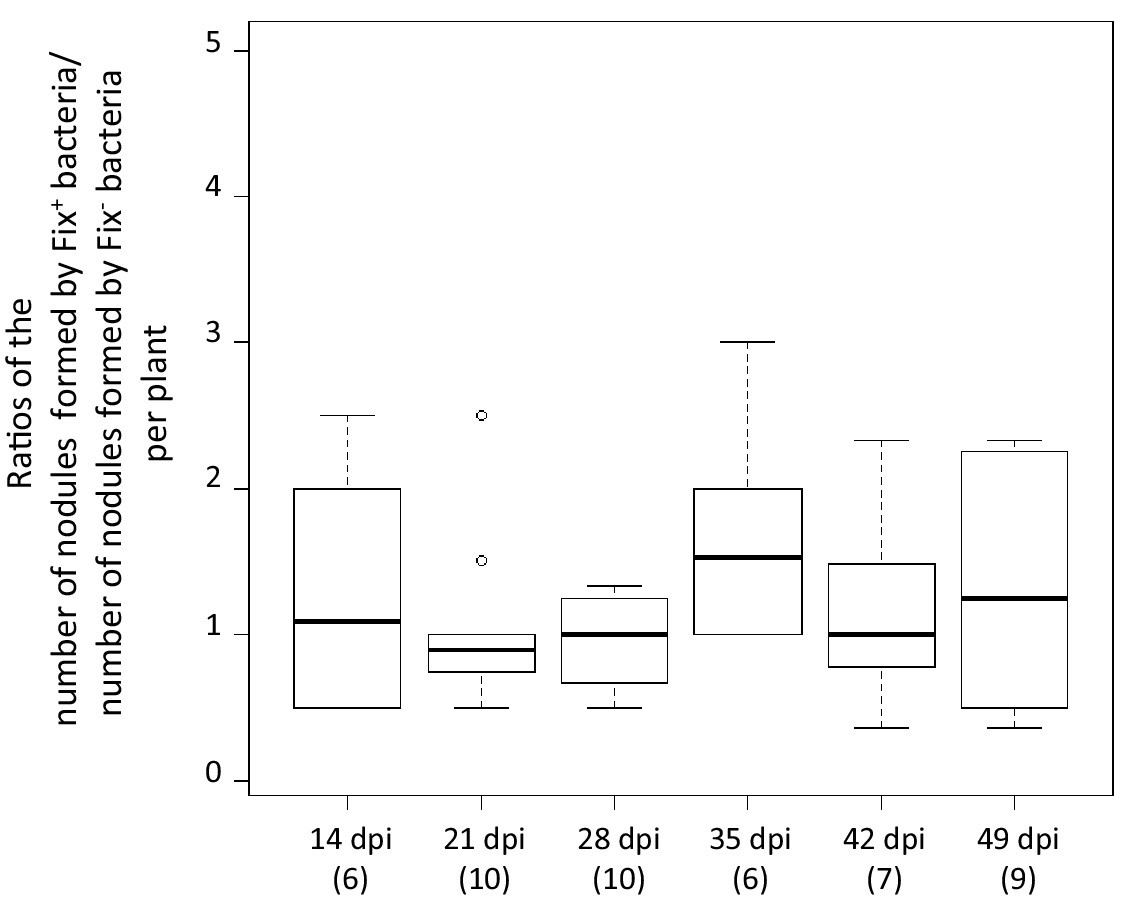
Relative number of nodules formed by Fix+ and Fix- bacteria per plant individual.
M. pudica plants were co-inoculated with the CBM2700 (Fix+, GFP) and CBM2707 (Fix-, mCherry) strains at a 1/1 ratio. The number of plants analyzed for each time point is indicated in brackets. Boxplots were constructed as described in Figure 1. No significant differences were observed between the number of nodules formed by Fix+ bacteria and Fix- bacteria per plant at the different time points (p>0.05, Student t-test with paired data at each time point or multiple comparison test after Kruskal-Wallis on the whole dataset) (Figure 3—source data 1).
-
Figure 3—source data 1
Relative number of nodules formed by Fix+ and Fix- bacteria per plant individual.
- https://doi.org/10.7554/eLife.28683.011
Figure 4
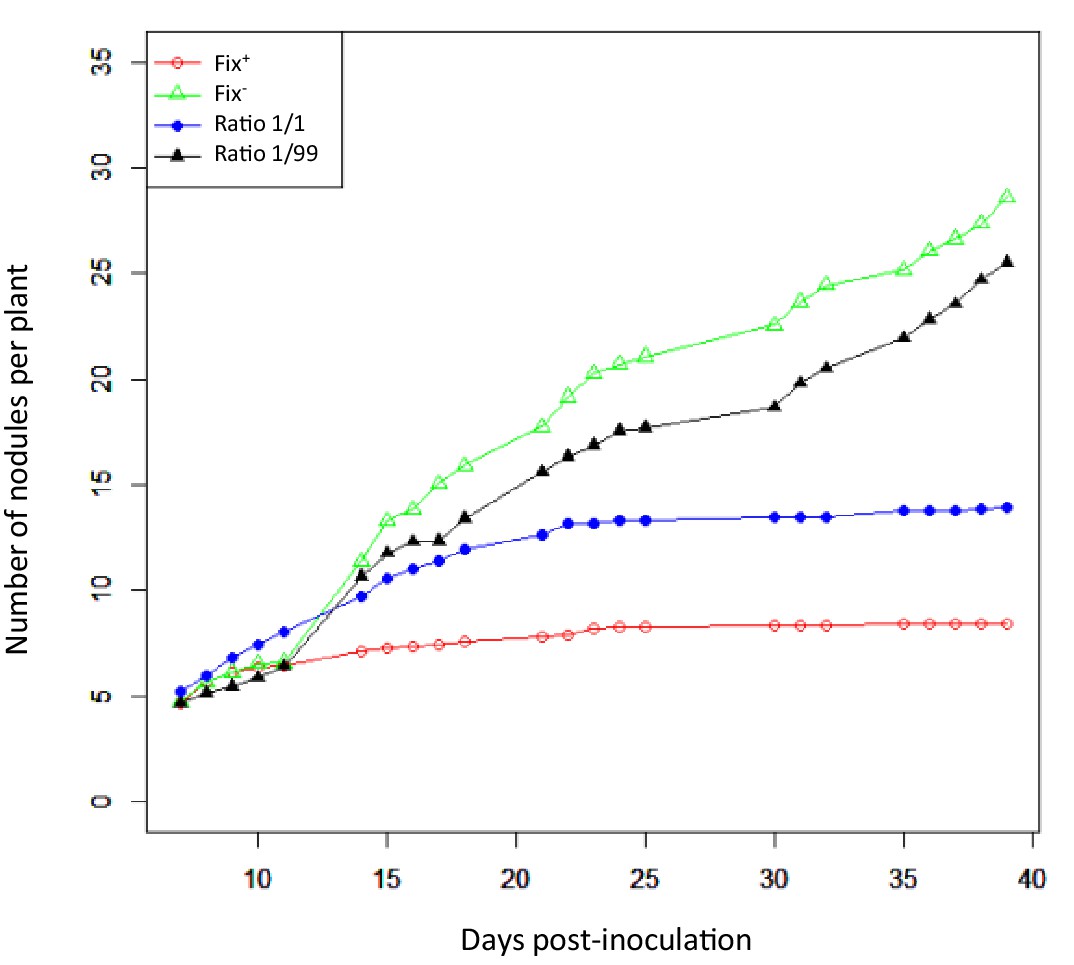
Nodulation kinetics.
M. pudica plants were single-inoculated with either CBM832 (Fix+) or CBM2568 (Fix-) or co-inoculated with a mixture of both strains at a 1/1 or 1/99 ratio. First nodules appeared at 5–7 dpi (Figure 4—source data 1).
-
Figure 4—source data 1
Nodulation kinetics of Fix+ (CBM382) and Fix- (CBM2568) C. taiwanensis following single- or co-inoculation of M. pudica.
- https://doi.org/10.7554/eLife.28683.013
Figure 5
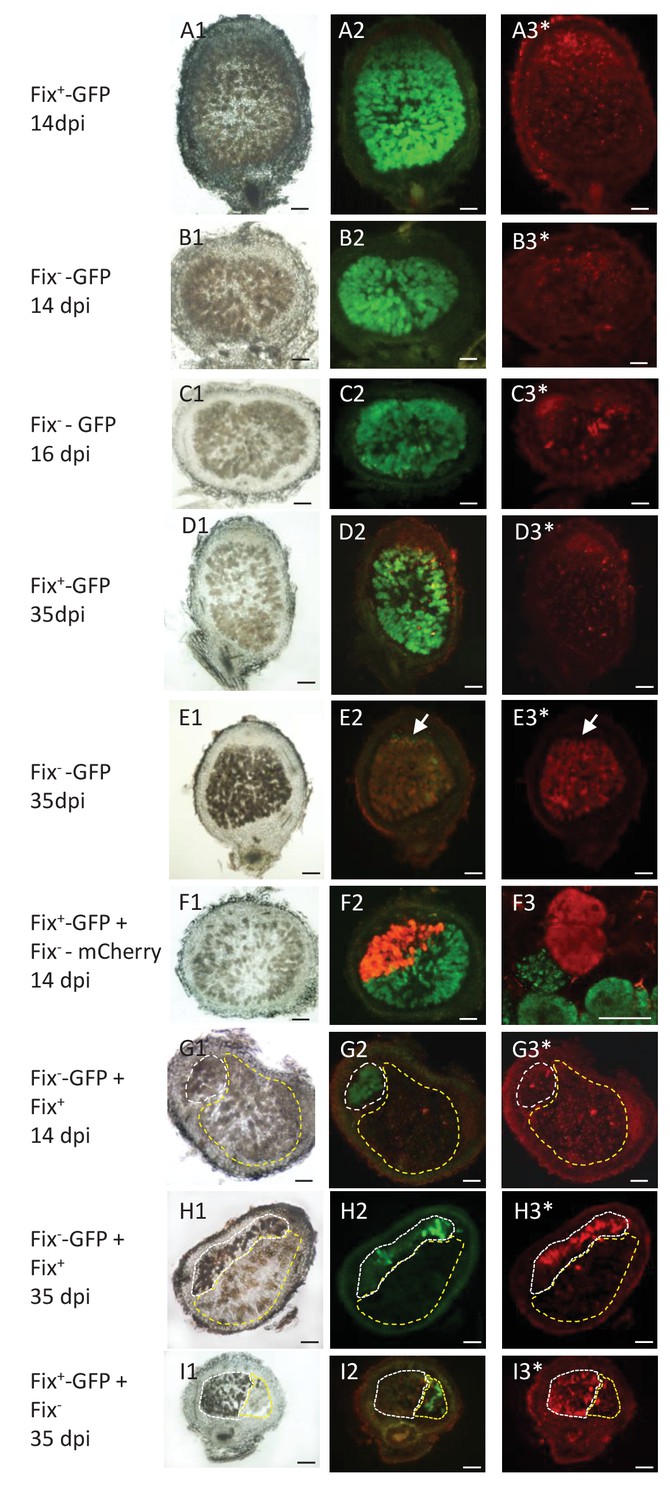
Viability of Fix+ and Fix- bacteroids.
M. pudica were co-inoculated with Fix+ and Fix- C. taiwanensis at a 1/1 ratio and sections of nodules collected at 14 dpi (ABFG), 16 dpi (C) or 35 dpi (DEHI) were observed under bright field (panels 1) or fluorescent microscopy (panels 2 and 3), and after PI staining (panels with an *). Panels with the same letters represent the same nodule section. (F3), magnification of (F2) visualized by confocal microscopy. (A) and (D), sections of nodules infected with a GFP-labeled Fix+ strain. (B) (C) and (E), sections of nodule infected with a GFP-labeled Fix- strain. (F), nodule co-infected with a GFP-labeled Fix+ and a mCherry-labeled Fix- strain. (G) and (H), nodules co-infected with a GFP-labeled Fix- and an unlabeled Fix+ strain. (I), nodules co-infected with a GFP-labeled Fix+ and an unlabeled Fix- strain. The white and yellow dotted lines in (GHI) delimit the areas occupied by the Fix- and Fix+ strains in a co-infected nodule, respectively. Note that neither the Fix+ (D3) nor the Fix- bacteroids (B3G3) are red-labeled by PI staining at 14 dpi whereas a few cells are PI-stained in the Fix--occupied nodule at 16 dpi ([C3], arrows), and Fix- are mostly PI-labeled (dead) at 35 dpi (E3H3I3). Note that bacteria of the infection zone are still alive at 35 dpi (arrow, E2E3). Note that nodule cells filled with Fix- are browner than nodule cells filled with Fix+ (G1H1I1). Scale bars correspond to 100 µm except for F3 (30 µm).
Figure 6

Electron microscopy of Fix+- and Fix--occupied nodules.
M. pudica plants were co-inoculated with Fix+ (CBM2708, mCherry) and Fix- (CBM2568, unlabeled) C. taiwanensis at a 1/1 ratio. Nodules collected at 19 dpi (ABCDE) were sorted for mCherry expression under fluorescence microscopy and used for electron microscopy observation. Degenerated nodule cells (*) were observed in Fix--occupied nodules (BDE) but not in Fix+-occupied nodules (AC). (C) and (D) represent magnification of the zones delimitated by a black dashed rectangle in (A) and (B) respectively. (E) magnification of the white rectangle in (D) showing degenerated bacteria (arrows). Scale bars represent 20 µm (ABC), 10 µm (D) and 2 µm (E).
Figure 7
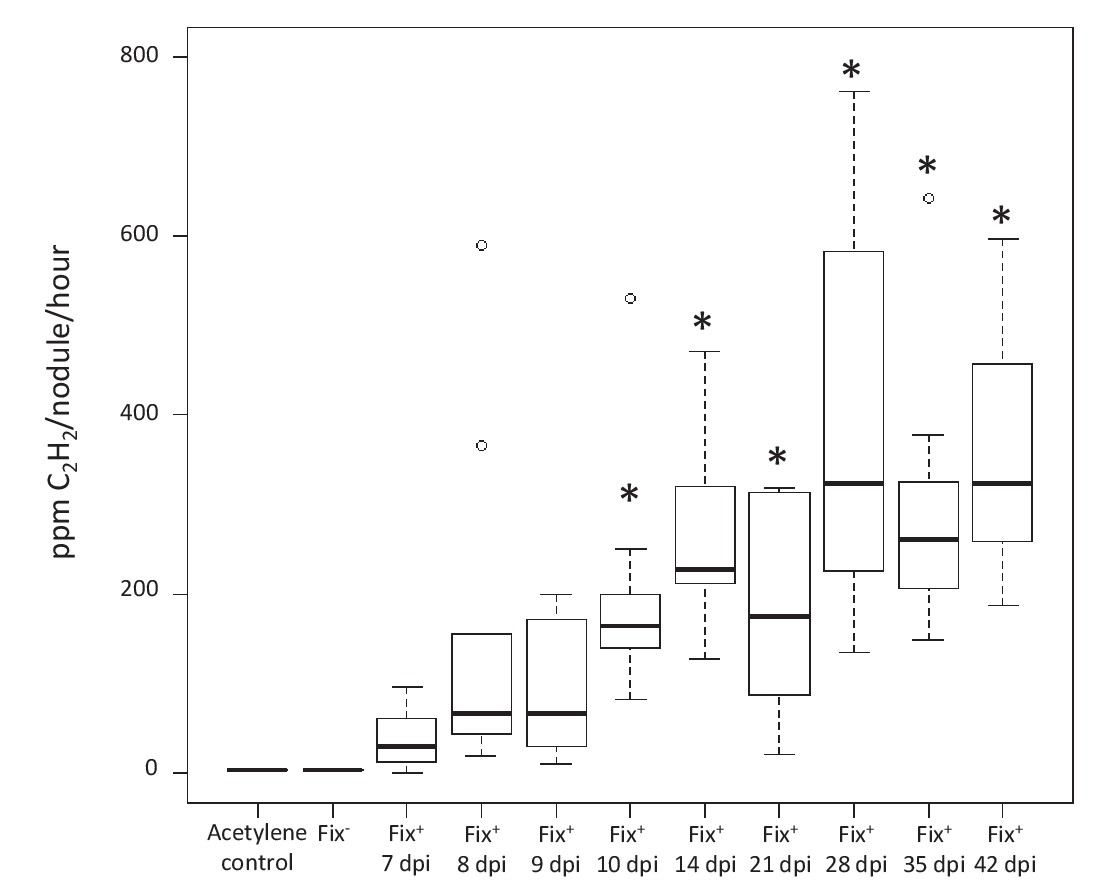
Kinetics of nitrogenase activity in N2-fixing M. pudica nodules.
Plants were inoculated with C. taiwanensis CBM832 (Fix+), and nitrogenase activity measured using the acetylene reduction assay (ARA) (Figure 7—source data 1). Two negative controls, i.e. tubes containing only the acetylene substrate and plants inoculated with C. taiwanensis CBM2568 (Fix-), were included. In these cases, boxplots correspond to data from all time points. *, Significantly different from the negative controls (p<0.05 after multiple comparison test of Kruskal-Wallis).
-
Figure 7—source data 1
Nitrogenase activity of C. taiwanensis Fix+ (CBM832).
- https://doi.org/10.7554/eLife.28683.017
Figure 8
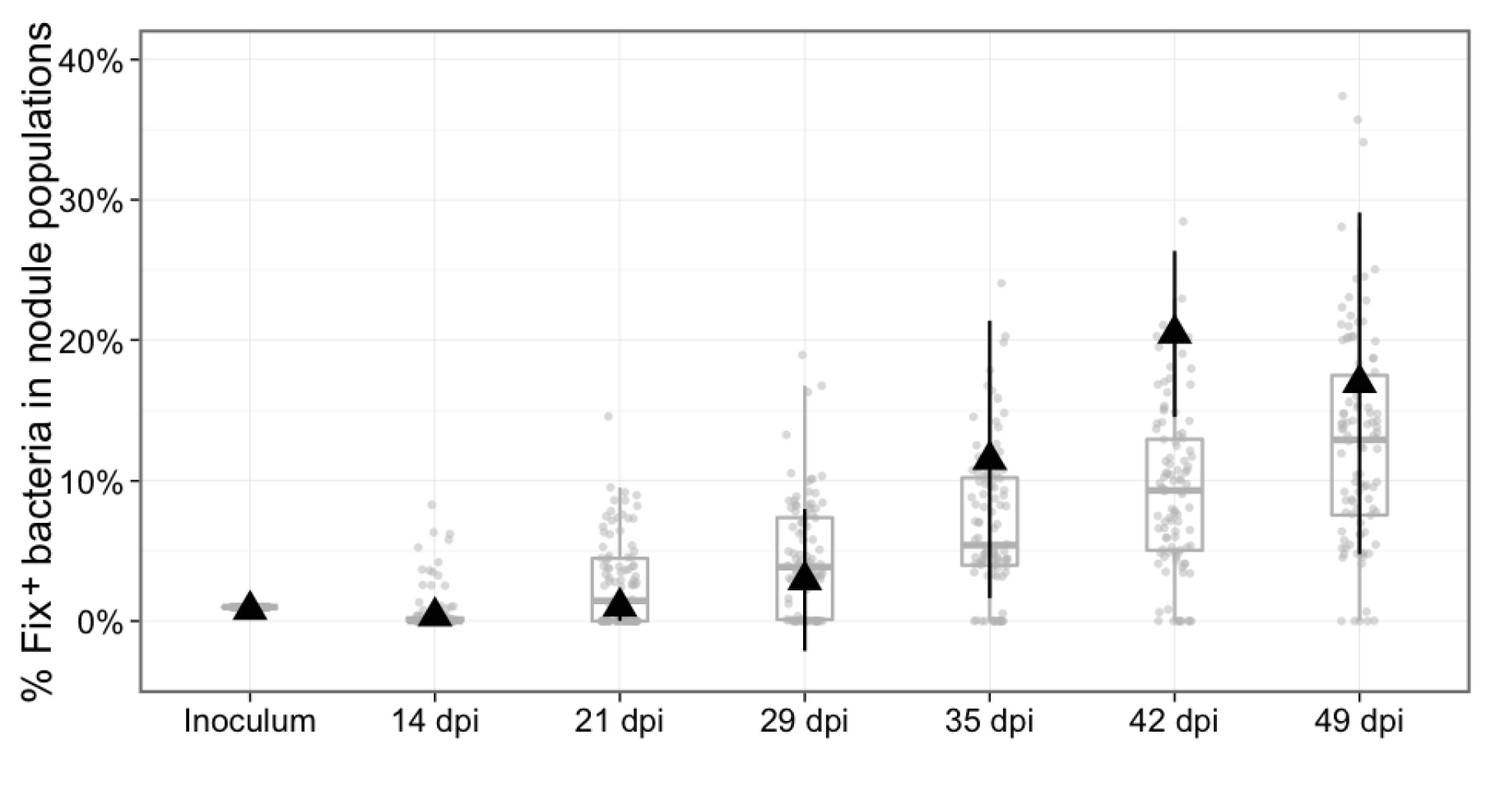
Experimental and theoretical reproductive fitness of Fix+ and Fix- bacteria following co- inoculation of M. pudica (ratio 1/100).
The proportion of Fix+ clones in nodules was experimentally measured and simulated over 49 days, following co-inoculation of 20 plants. Experimental data are shown as black triangles (Figure 8—source data 1). Black error bars represent standard deviation from 2 to 3 replicates. The results from 100 replicate simulations are shown as grey dots and boxplots (Figure 8—source data 2).
-
Figure 8—source data 1
Experimental data for the reproductive fitness of Fix+ and Fix- bacteria following co- inoculation of M. pudica (ratio 1/100) over 49 days.
- https://doi.org/10.7554/eLife.28683.019
-
Figure 8—source data 2
Simulation data for the reproductive fitness of Fix+ and Fix- bacteria following co- inoculation of M. pudica (ratio 1/100) over 49 days.
- https://doi.org/10.7554/eLife.28683.020
Figure 9 with 1 supplement
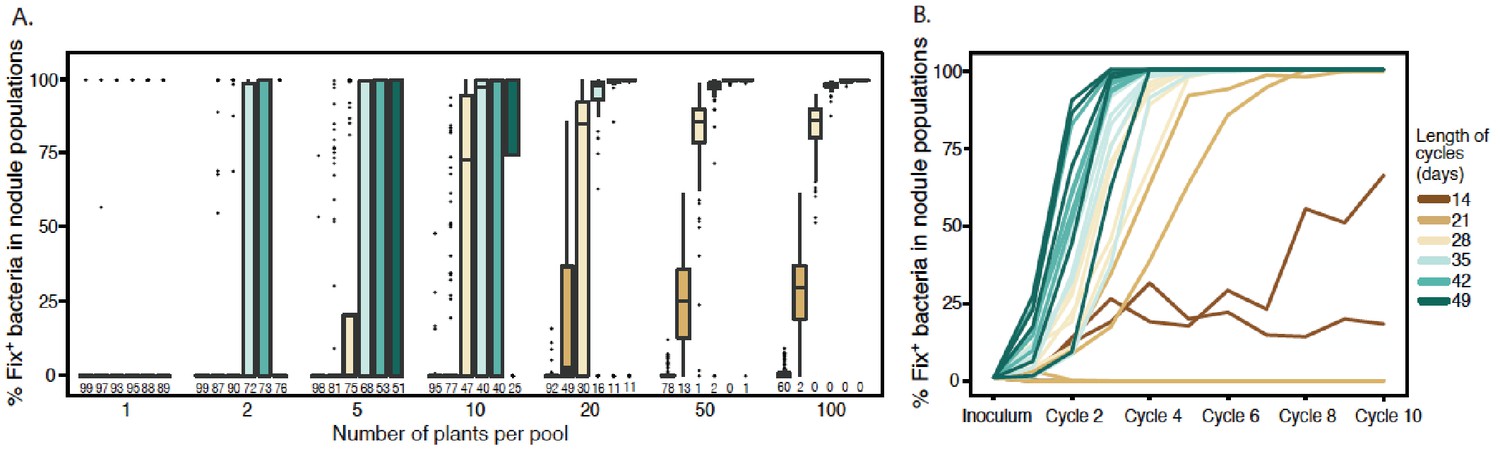
Effect of cycle length and plant numbers on the predicted distributions of Fix+population sizes.
Model simulations were performed with an initial proportion of 1% Fix+ in the bacterial population inoculated to a pool of plants. The length of each cycle and the number of plants per pool varied as indicated in the legend. (A) Final proportion of Fix+ clones after four cycles (Figure 9—source data 1). Boxplots represent the distribution of the final proportion of Fix+ clones from 100 simulations. The length of inoculation cycles ranged from 14 to 49 days and the number of plants per pool from 1 to 100. Numbers underneath each boxplot indicate the number of replicate simulations where Fix+ sub-populations became extinct after four cycles. (B) Increase in the proportion of Fix+ clones along 10 inoculation cycles of 14, 21, 28, 35, 42 or 49 days (Figure 9—source data 2). The number of plants per pool was 20. Representative trajectories of 5 replicate pools are shown in each case.
-
Figure 9—source data 1
Simulation data for the final proportion of Fix+ bacteria after four inoculation cycles.
- https://doi.org/10.7554/eLife.28683.024
-
Figure 9—source data 2
Simulation data for the increase in proportion of Fix+ bacteria along 10 cycles.
- https://doi.org/10.7554/eLife.28683.025
-
Figure 9—source data 3
Simulation data for the effect of cycle length and plant number on the Fix+population sizes after four cycles.
- https://doi.org/10.7554/eLife.28683.026
Figure 9—figure supplement 1
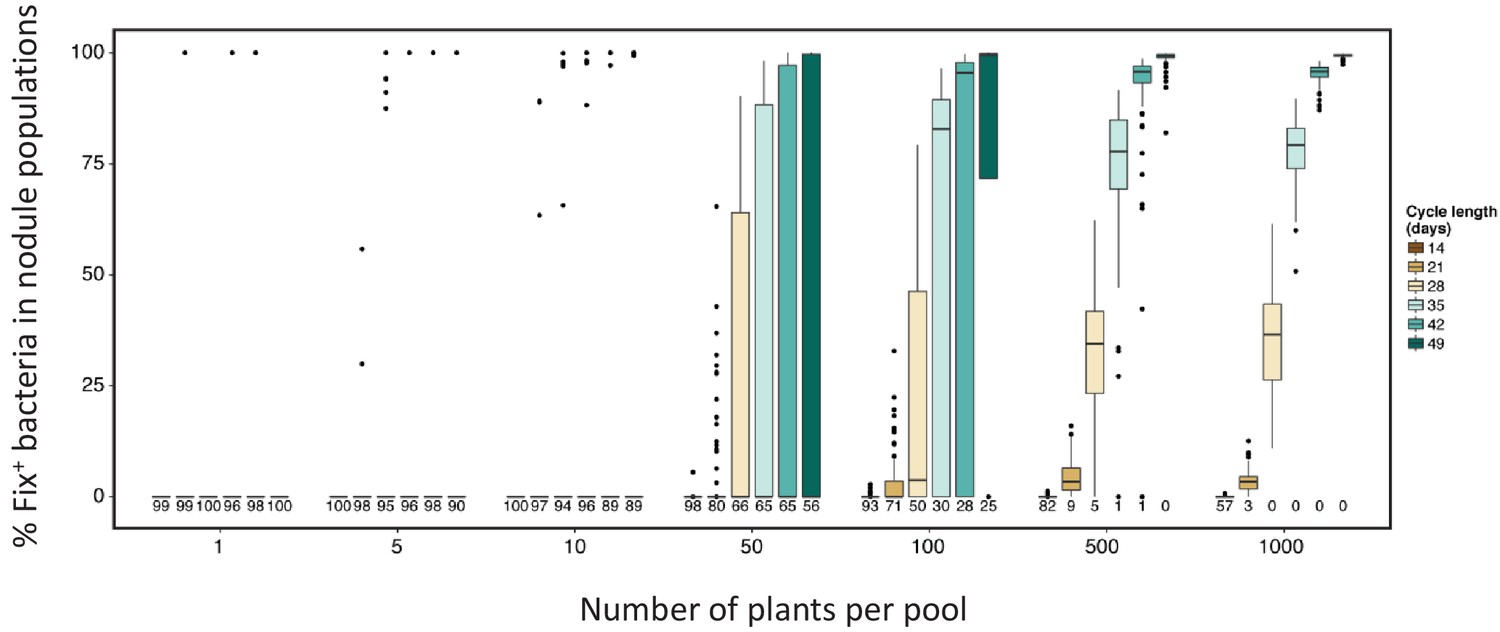
Effect of cycle length and plant numbers on the predicted distribution of Fix+ population sizes.
Model simulations were performed for four cycles with an initial proportion of 0.1% Fix+ in the bacterial population inoculated to a pool of plants of sizes ranging from 1 to 1000 plants. The length of each cycle and the number of plants per pool varied as indicated in the legend. Numbers underneath each boxplot indicate the number of replicates (out of 100) where Fix+ sub-populations became extinct after four cycles (Figure 9—source data 3).
Figure 10
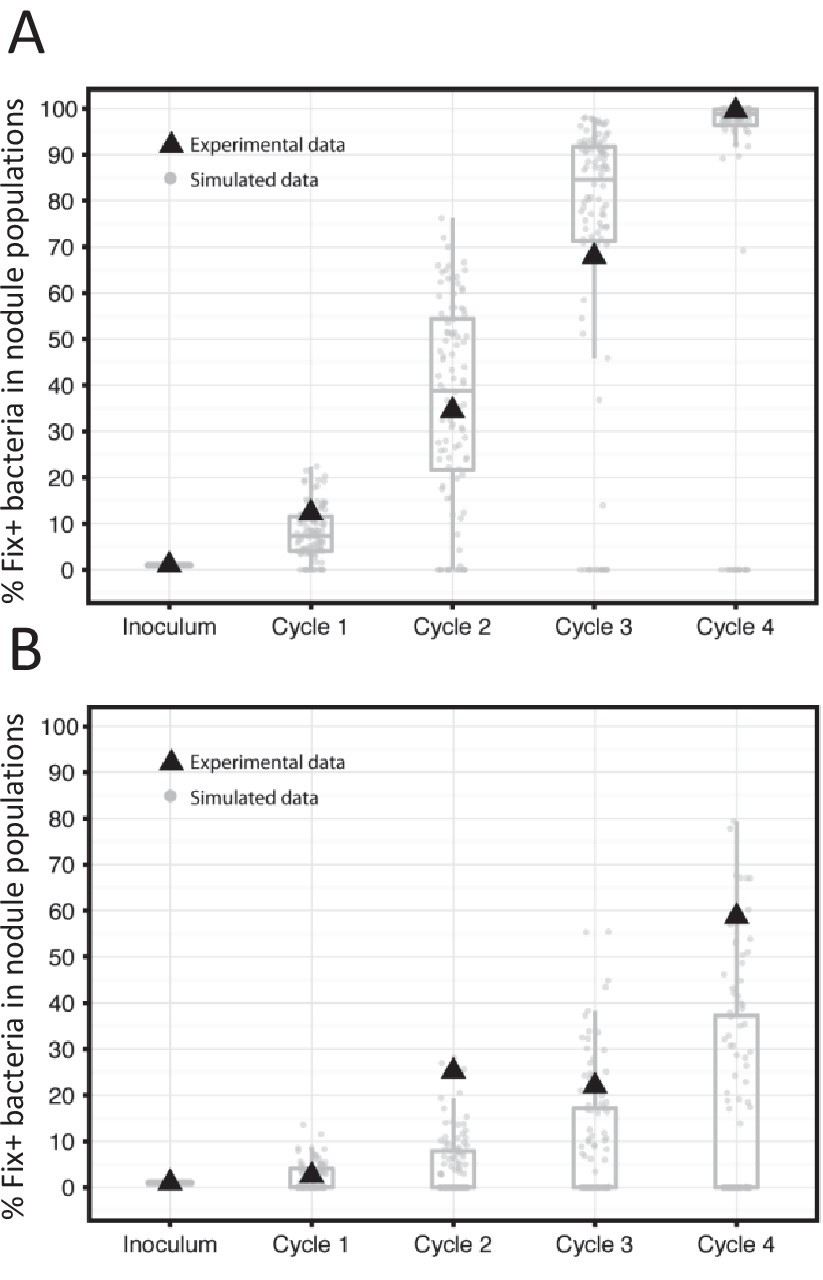
Frequency of Fix+ bacteria over 4 cycles of 35 (A) or 21 (B) days: simulations and experimental validation.
The proportion of Fix+ clones over four inoculation cycles was simulated and measured experimentally. Simulations and experiment were performed with an initial proportion of Fix+ clones of 1% and pools of 20 plants. Experiments were performed with an inoculum of 5 × 10³ Fix+/5 × 105 Fix- C. taiwanensis per plant. The results from 100 replicate simulations are shown as grey dots and boxplots (Figure 10—source data 1). Experimental data are shown as black triangles (Figure 10—source data 2).
-
Figure 10—source data 1
Simulation data for the frequency of Fix+ bacteria over 4 cycles of 35 or 21 days.
- https://doi.org/10.7554/eLife.28683.028
-
Figure 10—source data 2
Experimental data for the frequency of Fix+ and Fix- bacteria over 4 cycles of 35 or 21 days.
- https://doi.org/10.7554/eLife.28683.029
Tables
Table 1
Model parameters
https://doi.org/10.7554/eLife.28683.021| Parameter | Abbreviation | Value |
|---|---|---|
| Size of each pool of plants* | Pool | Variable (1–1000) |
| Number of replicates* | Rep | Variable (5 or 100) |
| Length of each cycle* | Days | Variable (14-49) |
| Number of cycles* | Cyc | Variable (4 or 10) |
| Initial proportion of Fix+ cells* | x | Variable (1 or 0.1) |
| Maximum number of new nodules/plant/day† | λmax | 0.44 |
| Coefficient for the auto-regulation of nodulation in nodulation kinetics† | a1 | 0.03 |
| Coefficient for time-decay in nodulation kinetics† | a2 | 0.006 |
| Lag for time-decay in nodulation kinetics† | a3 | 2 |
| Growth rate of bacteria within nodule† | r | 1.95 |
| Fitness cost of nitrogen fixation‡ | c | 0 |
| Sanctions for Fix-‡ | s | 1.65 |
| Day at which additional sanctions begin‡ | ds | 17 |
| Nodule carrying capacity‡ | K | 1.4 × 10⁸ |
-
*parameters varied in the simulations
† experimentally measured parameters
-
‡parameters inferred from experimental data
Table 2
Strains and plasmids used in this study
https://doi.org/10.7554/eLife.28683.030| Bacterium | Strain | Relevant characteristics | Reference/source |
|---|---|---|---|
| E. coli | DH5α | F recA lacZM15 | Bethesda research laboratory |
| DH5α λpir | F recA lacZM15 λpir | HP Schweizer | |
| C. taiwanensis | LMG19424 | Wild-type strain isolated from Mimosa pudica in Taiwan | (Chen et al., 2001) |
| CBM832 | LMG19424 derivative resistant to Streptomycin, StrR | M. Hynes | |
| CBM2568 | CBM832 deleted in nifH, StrR | This study | |
| CBM2700 | CBM832 carrying a Pps-GFP fusion downstream glmS, StrR | This study | |
| CBM2701 | CBM2568 carrying a Pps-GFP fusion downstream glmS, StrR | This study | |
| CBM2707 | CBM2568 carrying a Pps-mCherry fusion downstream glmS, StrR | This study | |
| CBM2708 | CBM832 carrying a Pps-mCherry fusion downstream glmS, StrR | This study | |
| Plasmids | Name | Relevant characteristics | Reference/source |
| pGPI-SceI | oriR6K, mob+, carries a I-SceI site, TriR | (Flannagan et al., 2008) | |
| pDAI-SceI | oripBBR1, mob+, carries the I-SceI gene, TetR | (Flannagan et al., 2008) | |
| pRCK-Pps-GFP | Plasmid carrying the psbA promoter region fused to GFP, KanR | M. Valls | |
| pRCK-Pps-mCherry | Plasmid carrying the psbA promoter region fused to mCherry, KanR | M. Valls | |
| pCBM156 | pGPI-SceI carrying the nifH 5’ and 3’ regions, TriR | This study | |
| pCBM161 | pGPI-SceI carrying the glmS-Ralta_A0206 intergenic region interrupted by a Pps-GFP fusion, TriR | This study | |
| pCBM162 | pGPI-SceI carrying the glmS-Ralta_A0206 intergenic region interrupted by a Pps-mCherry fusion, TriR | This study | |
| pRK2013 | Helper plasmid, KanR | (Figurski and Helinski, 1979) |
-
Str, spreptomycin; Tri, trimethoprim; Tet, tetracycline; Kan, kanamycin.
Additional files
-
Supplementary file 1
Primers used in this study.
- https://doi.org/10.7554/eLife.28683.031
-
Source code file 1
R code used for simulations.
- https://doi.org/10.7554/eLife.28683.032
-
Transparent reporting form
- https://doi.org/10.7554/eLife.28683.033
Download links
A two-part list of links to download the article, or parts of the article, in various formats.
Downloads (link to download the article as PDF)
Open citations (links to open the citations from this article in various online reference manager services)
Cite this article (links to download the citations from this article in formats compatible with various reference manager tools)
Spatio-temporal control of mutualism in legumes helps spread symbiotic nitrogen fixation
eLife 6:e28683.
https://doi.org/10.7554/eLife.28683


