Stimulation of hair follicle stem cell proliferation through an IL-1 dependent activation of γδT-cells
- University of California, San Diego, United States
- Institute for Stem Cell Biology and Regenerative Medicine, India
- Manipal University, India
- Shanmugha Arts, Science, Technology and Research Academy (SASTRA) University, India
- The Scripps Research Institute, United States
- University of Southern California, United States
Figures
Figure 1 with 7 supplements
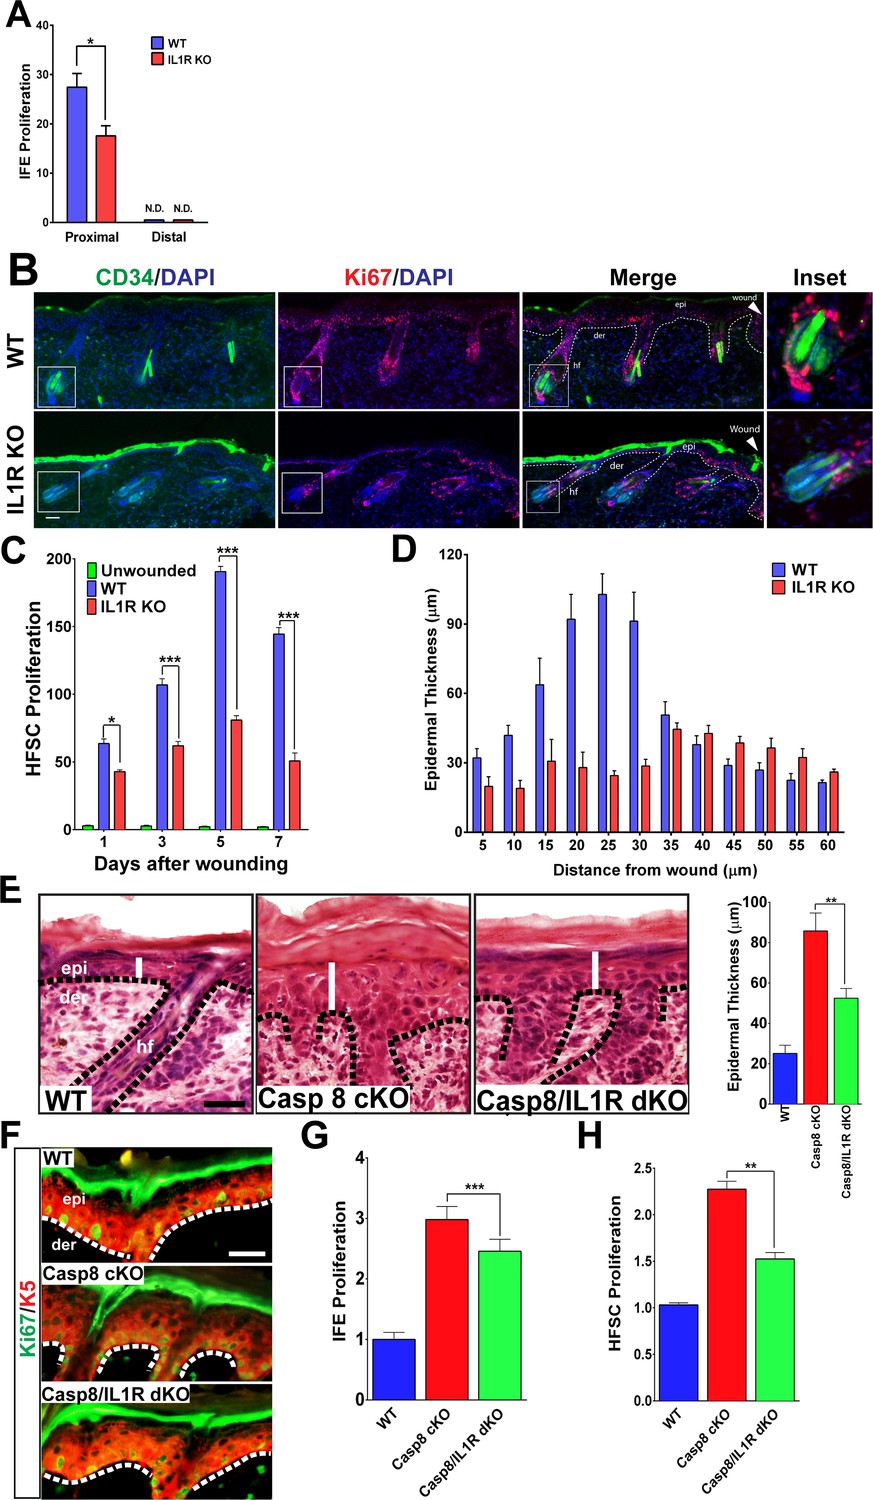
Impact of IL-1 signaling on epidermal stem cell proliferation.
(A) Quantification of proliferating cells in the interfollicular epidermis (IFE) of the skin from WT or IL1R-KO 8-week-old mice 3 days post-wound. The proximal area of measurement was restricted to the first three hair follicles adjacent to the wound edge. The cell count from a region 2 cm away from the wound centre was considered to be distal. (B) Immunostaining of day 3 wound proximal skin sections from 8-week-old WT or IL-1R KO mice for CD34 (green) and Ki67 (red) to mark proliferating hair follicle stem cells (HFSCs). Nuclei were stained with DAPI (blue). Scale bar = 50 μm. The dotted lines represent the epidermal–dermal interface. The inset shows the magnified view of a hair follicle with proliferating cells near the wound. (C) Quantification of proliferating HFSCs present near the wound in WT or IL-1R-deficient mice compared to unwounded mice. (D) The epidermal thickness was quantified by measuring the distance between the keratin-5+ basal layer and the loricrin+ granular layer, starting from the region with keratin-5 expression in the wound. Each bar in the graph is a mean of three data points obtained from 50-μm-wide windows. (E) H&E staining of postnatal day 4 (P4) skin showing epidermal thickness (denoted by white lines) between the various genotypes, WT = wildtype, C8CKO = caspasecKO and C8/IL1R = caspase-8/IL1R dKO. The dotted black lines represent the basement membrane separating the epidermis (epi) and the dermis (der). hf denotes hair follicle. Scale bar = 50 μm. Quantitation of epidermal thickness is represented in the histogram as the average ±SEM. (F) Hyperproliferation of P4 epidermis in the KO skin is revealed by increased expression of Ki67 (green) and is reduced in the caspase-8/IL1R dKO. K5 = keratin 5 (red). (G) Quantitation of proliferating interfollicular epidermal cells is shown as the average ± SEM relative to WT levels. (H) Proliferation of hair follicle stem cells. The data shown are the fold difference in different genotypes relative to WT levels that are set to 1. The data shown in E–H are from six different mice per genotype. **p<0.001, ***p<0.0001.
Figure 1—figure supplement 1
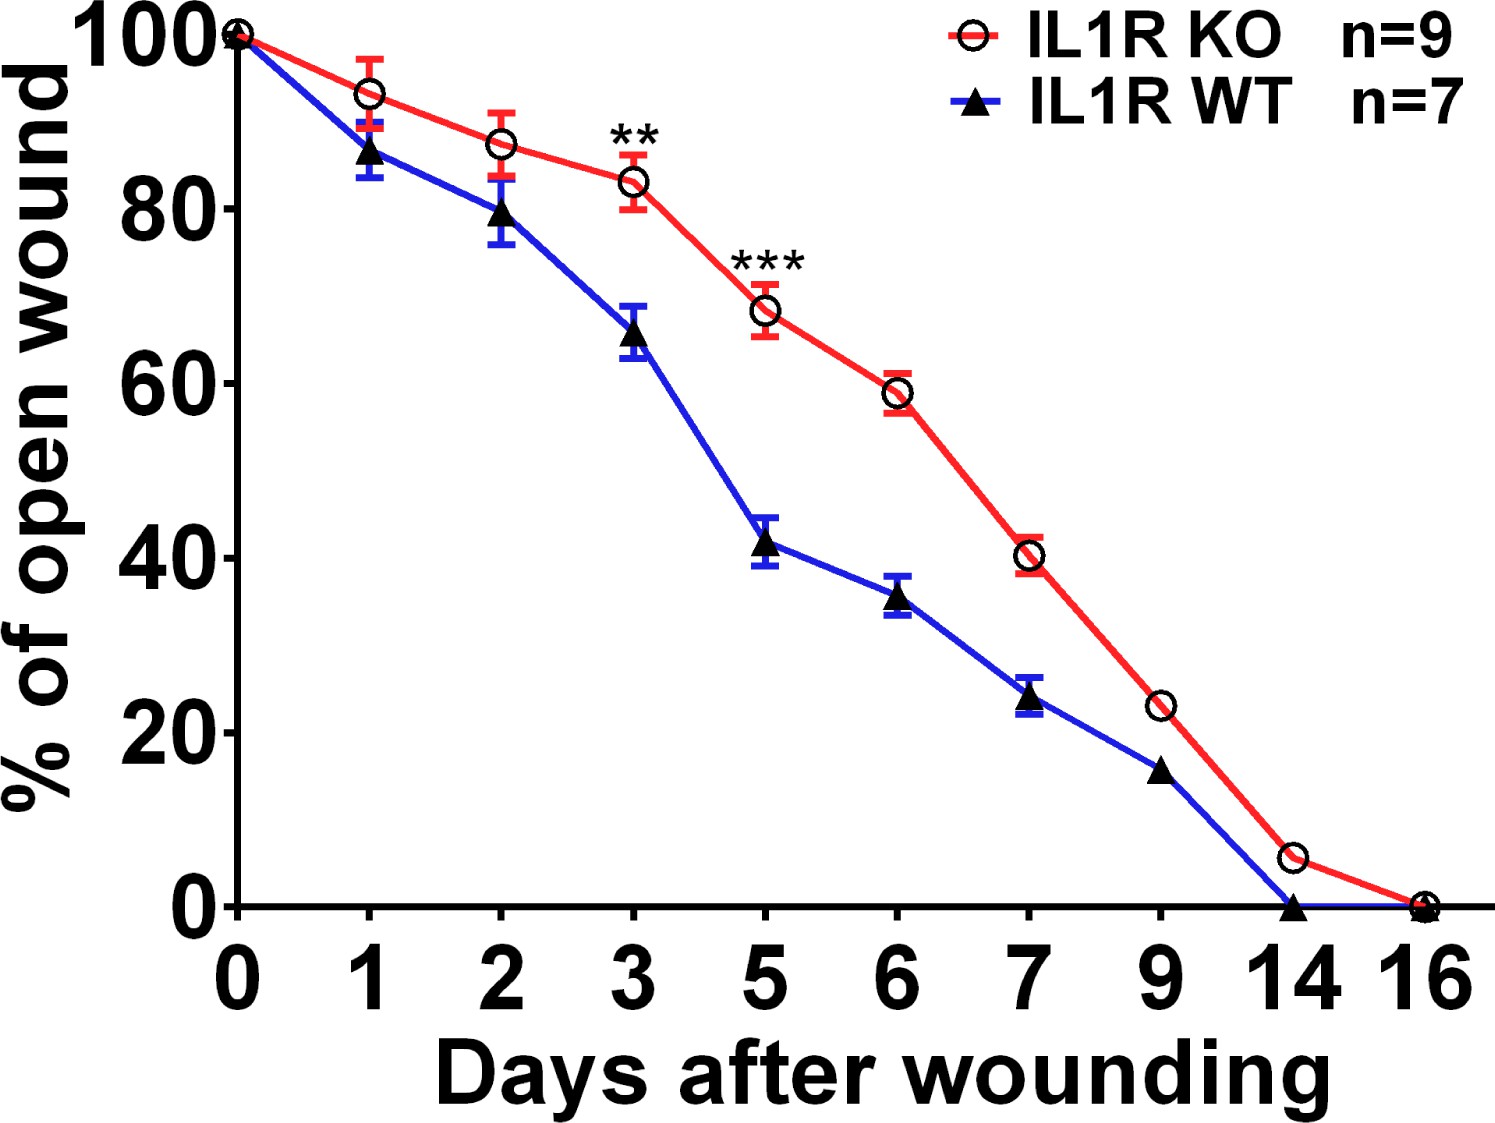
Wound closure rate in the skin of WT and IL1R KO mice.
5 mm excisional wounds were made on 8-week-old IL1R KO and WT control males. Wound closure was determined as the percentage size reduction compared to day 0.
Figure 1—figure supplement 2
Representative image for Figure 1A.
Immunostaining of day 3 wound distal skin sections from 8-week-old WT or IL-1R KO mice for CD34 (green) and Ki67 (red) to mark proliferating HFSCs. Nuclei were stained with DAPI (blue). Scale bar = 50 µm. Boxes are windows taken for quantification of Figure 1A.
Figure 1—figure supplement 3
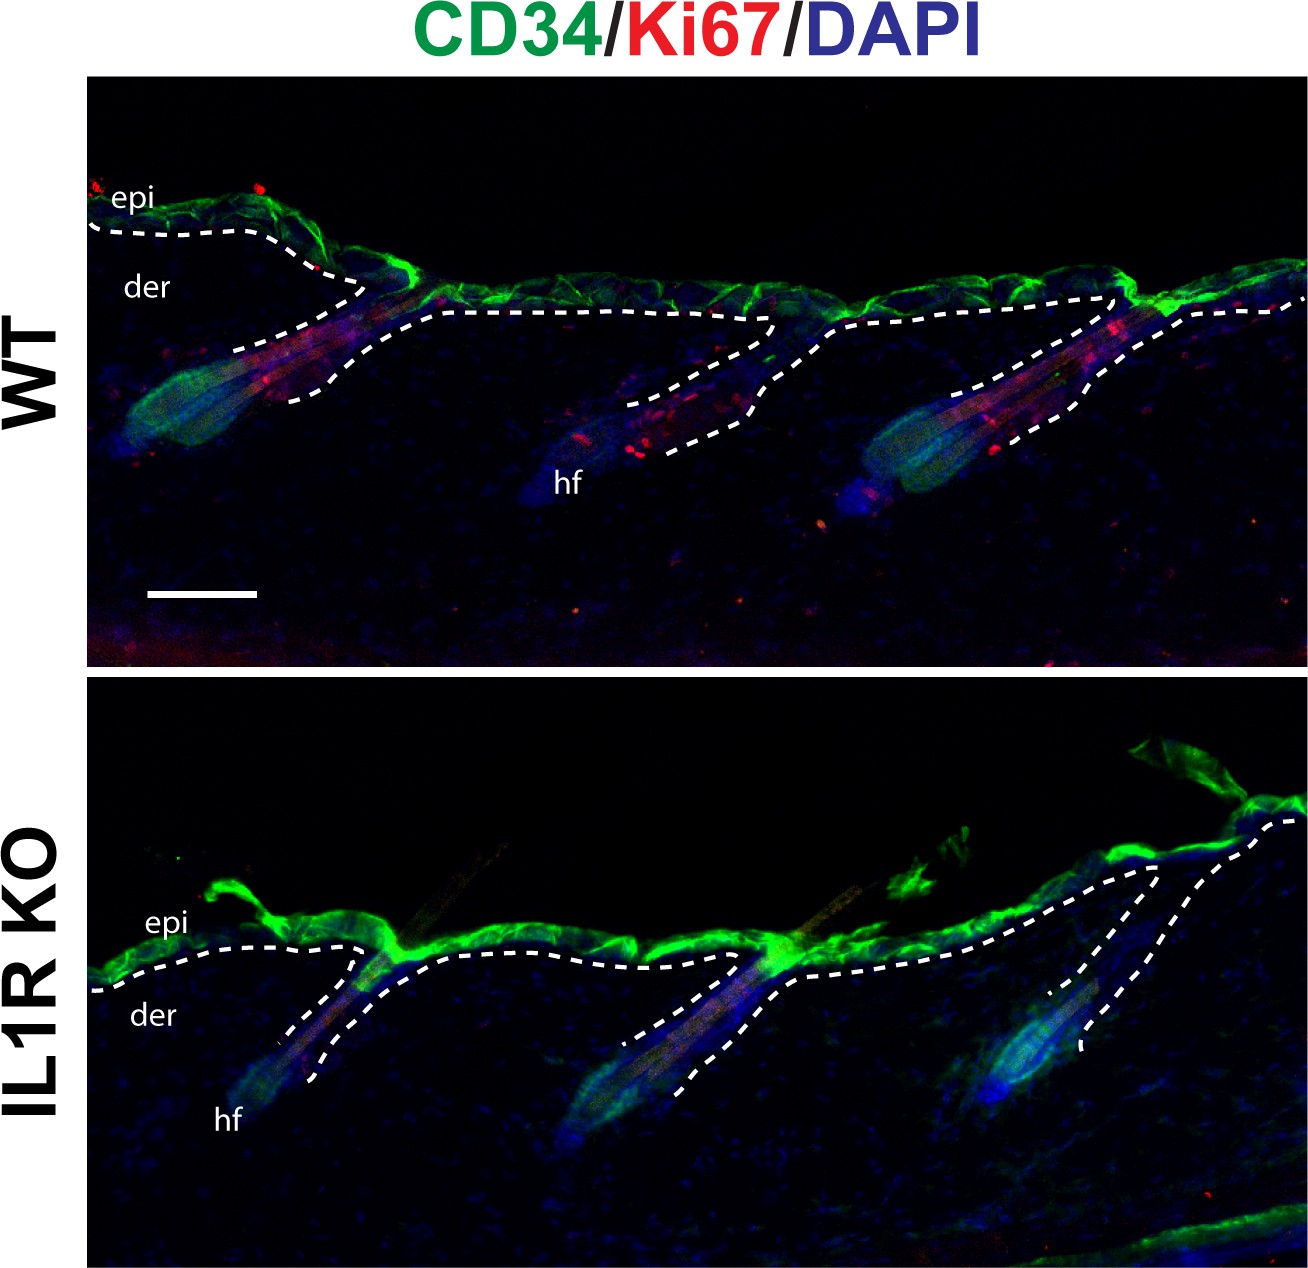
Proliferation of HFSCs in a distal wound region.
Immunostaining of day 3 wound distal skin sections from 8-week-old WT or IL-1R KO mice for CD34 (green) and Ki67 (red) to mark proliferating HFSCs. Nuclei were stained with DAPI (blue). Scale bar = 50 µm. The dotted lines represent the epidermal–dermal interface.
Figure 1—figure supplement 4
Representative image of Figure 1C.
Skin sections from 8-week-old WT and IL1R KO mice were stained for keratin 5 (K5) (green), Ki67 (red) and DAPI (blue), for 1, 3, and 5 days postwounding. White dotted lines represent the basement membrane that separates the epidermis from the underlying dermis. Scale bar = 50 μm.
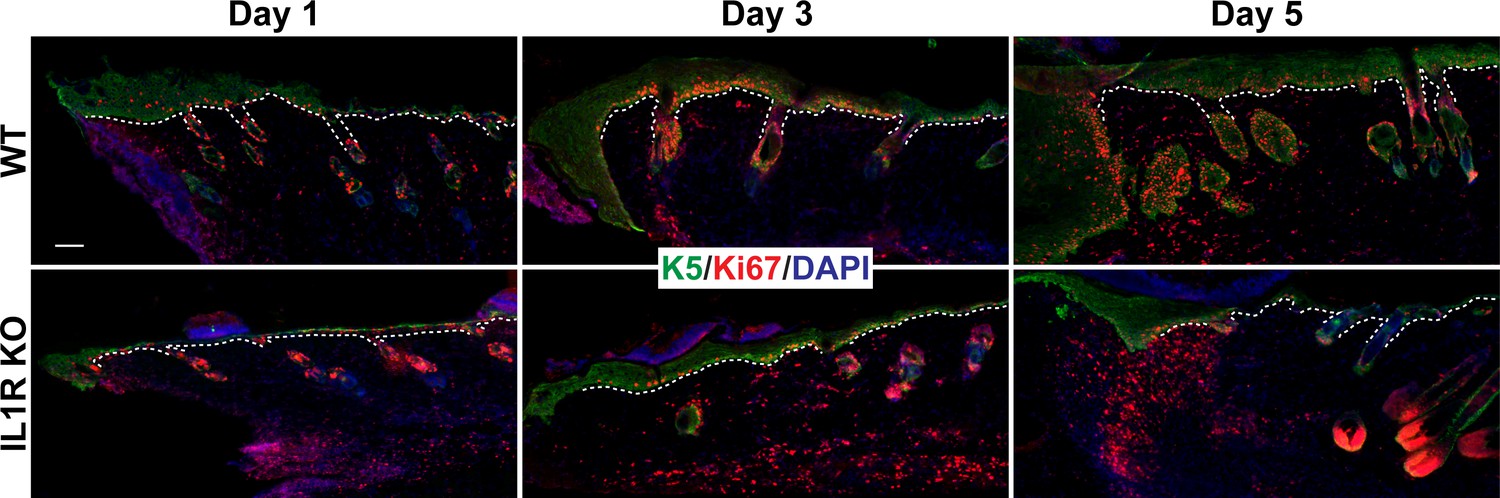
Figure 1—figure supplement 5
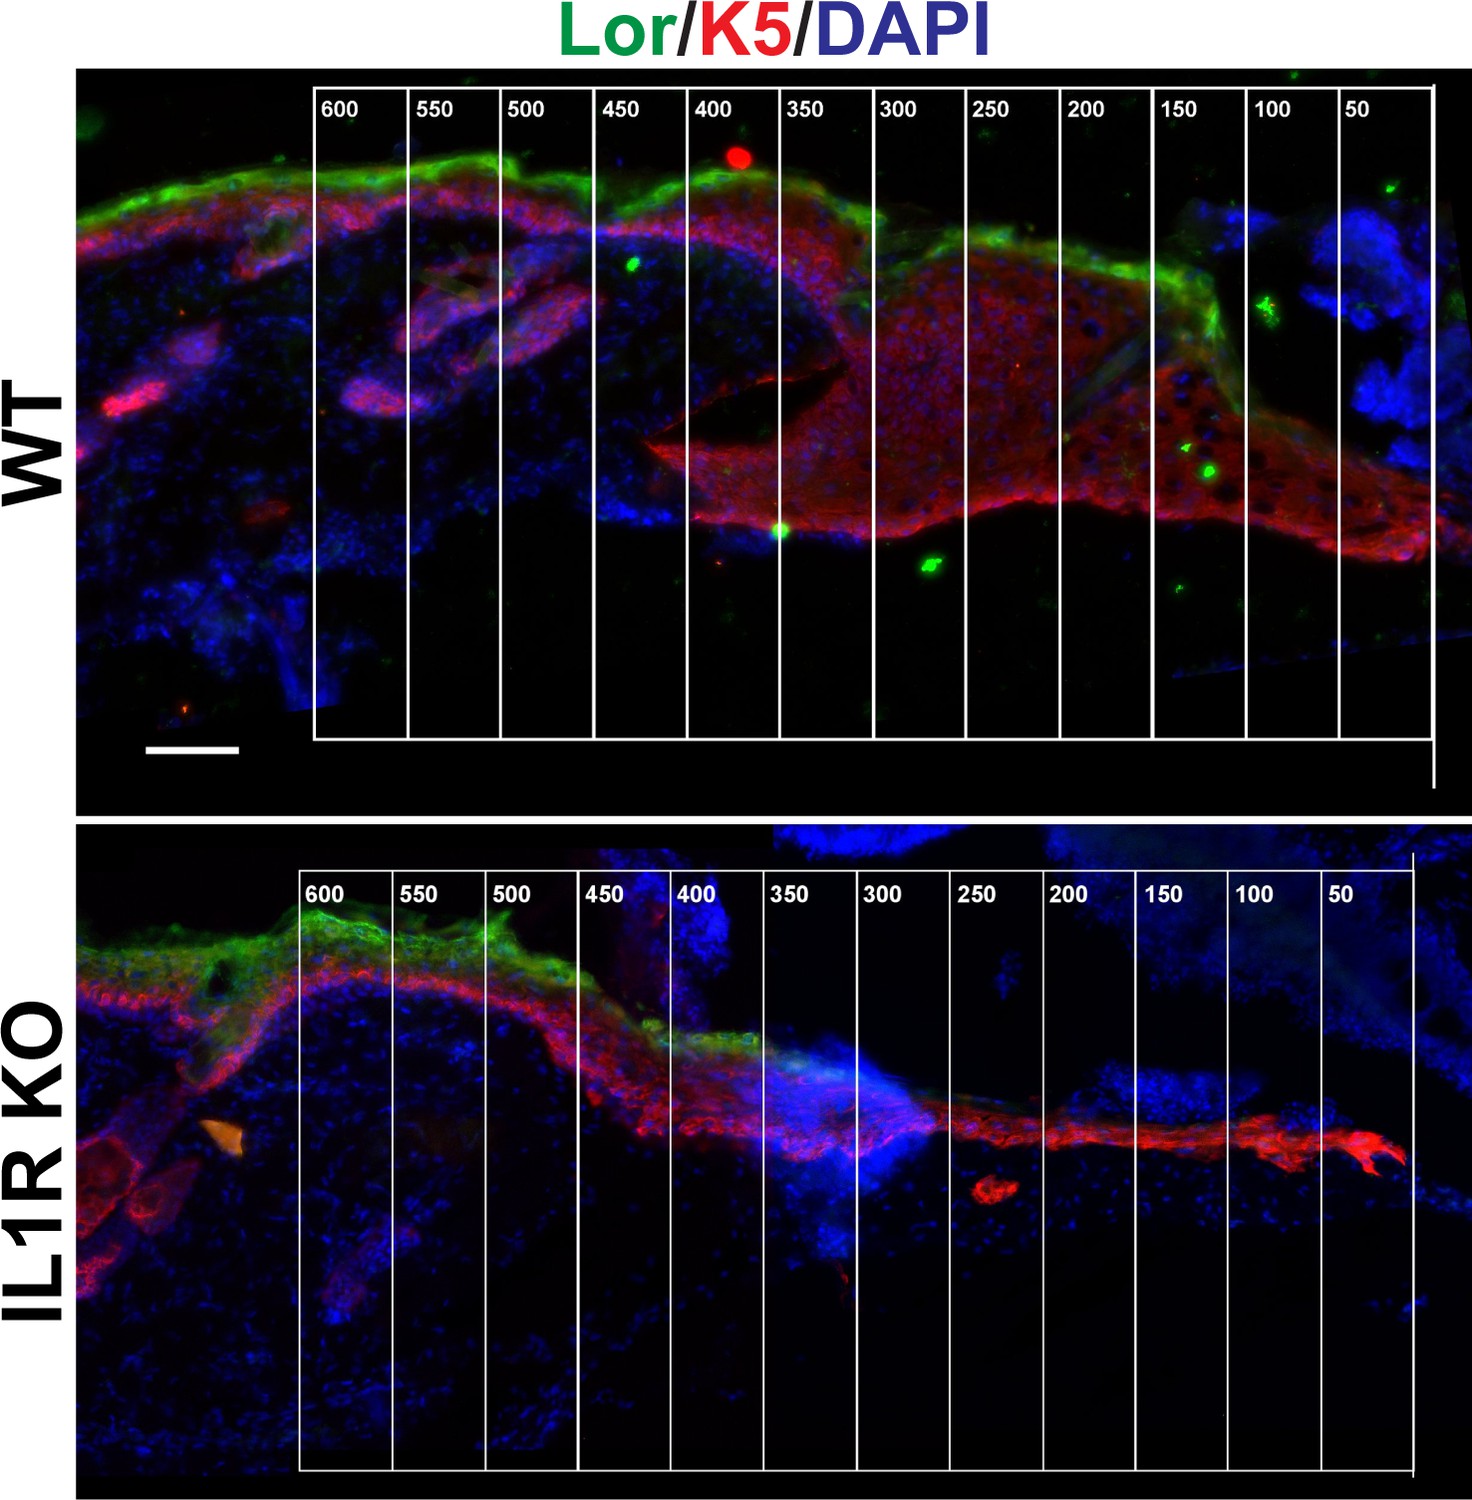
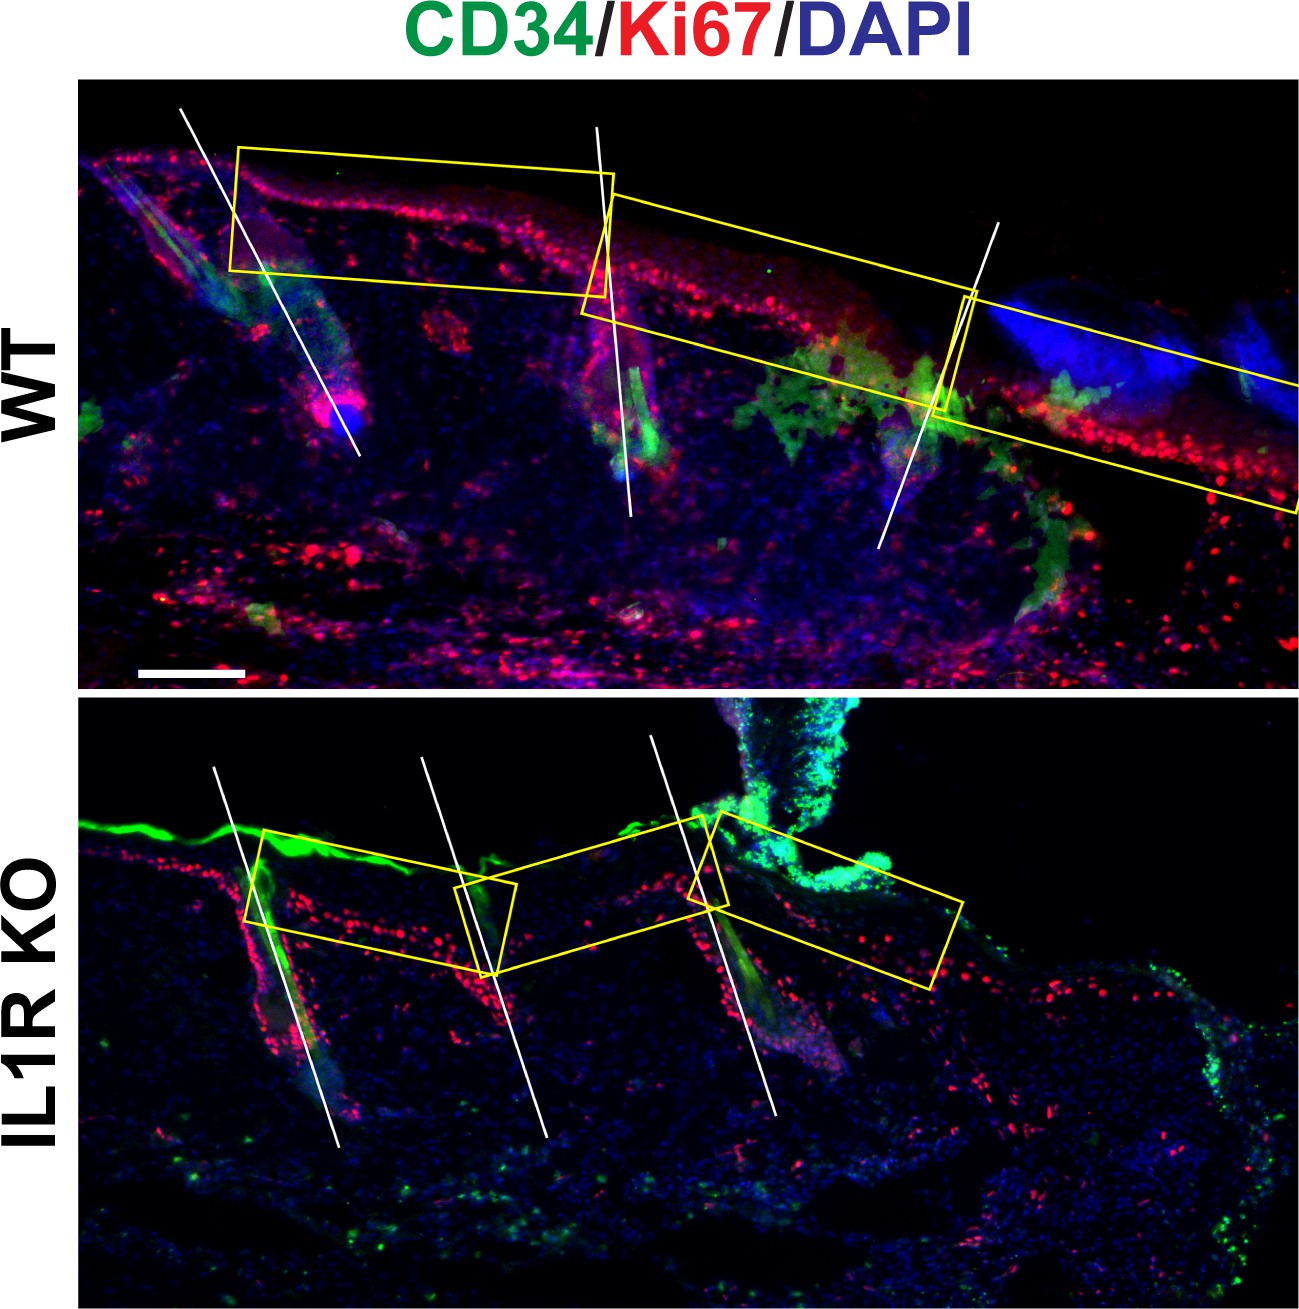
Representative image of Figure 1D.
Skin sections from 8-week-old WT and IL1R KO mice were stained for keratin 5 (K5) (red), loricrin (Lor) (green) and DAPI (blue) 3 days postwounding. Epidermal thickness was calculated by taking 50-μm windows starting from the wound edge (the beginning of K5 staining), and measuring the thickness between the bottom of K5 and the top of Lor.
Figure 1—figure supplement 6
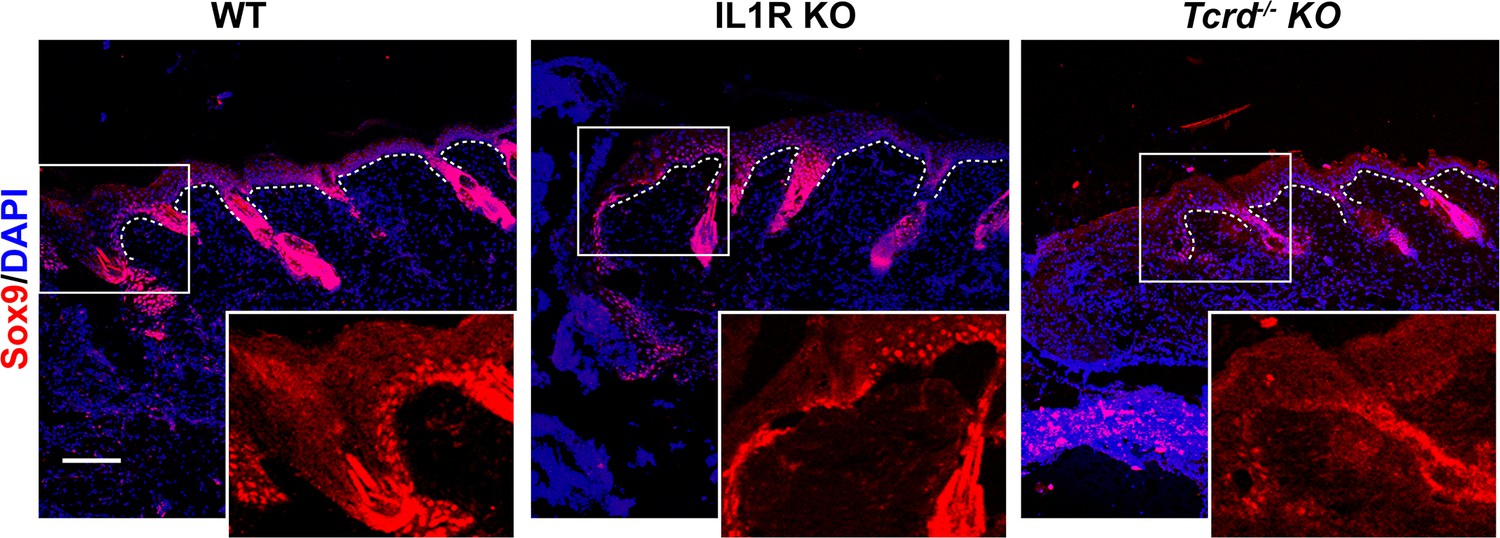
Sox9 expression in wounded skin.
Skin sections from 8-week-old WT, IL1R KO, and γδT-cell KO mice were stained for Sox9 (red) to mark HFSCs and DAPI (blue) 3 days postwounding. White dotted lines denote the basement membrane separating the epidermis from the underlying dermis. Boxed regions are shown as a magnified image in the inset. Scale bar = 50 μm.
Figure 1—figure supplement 7
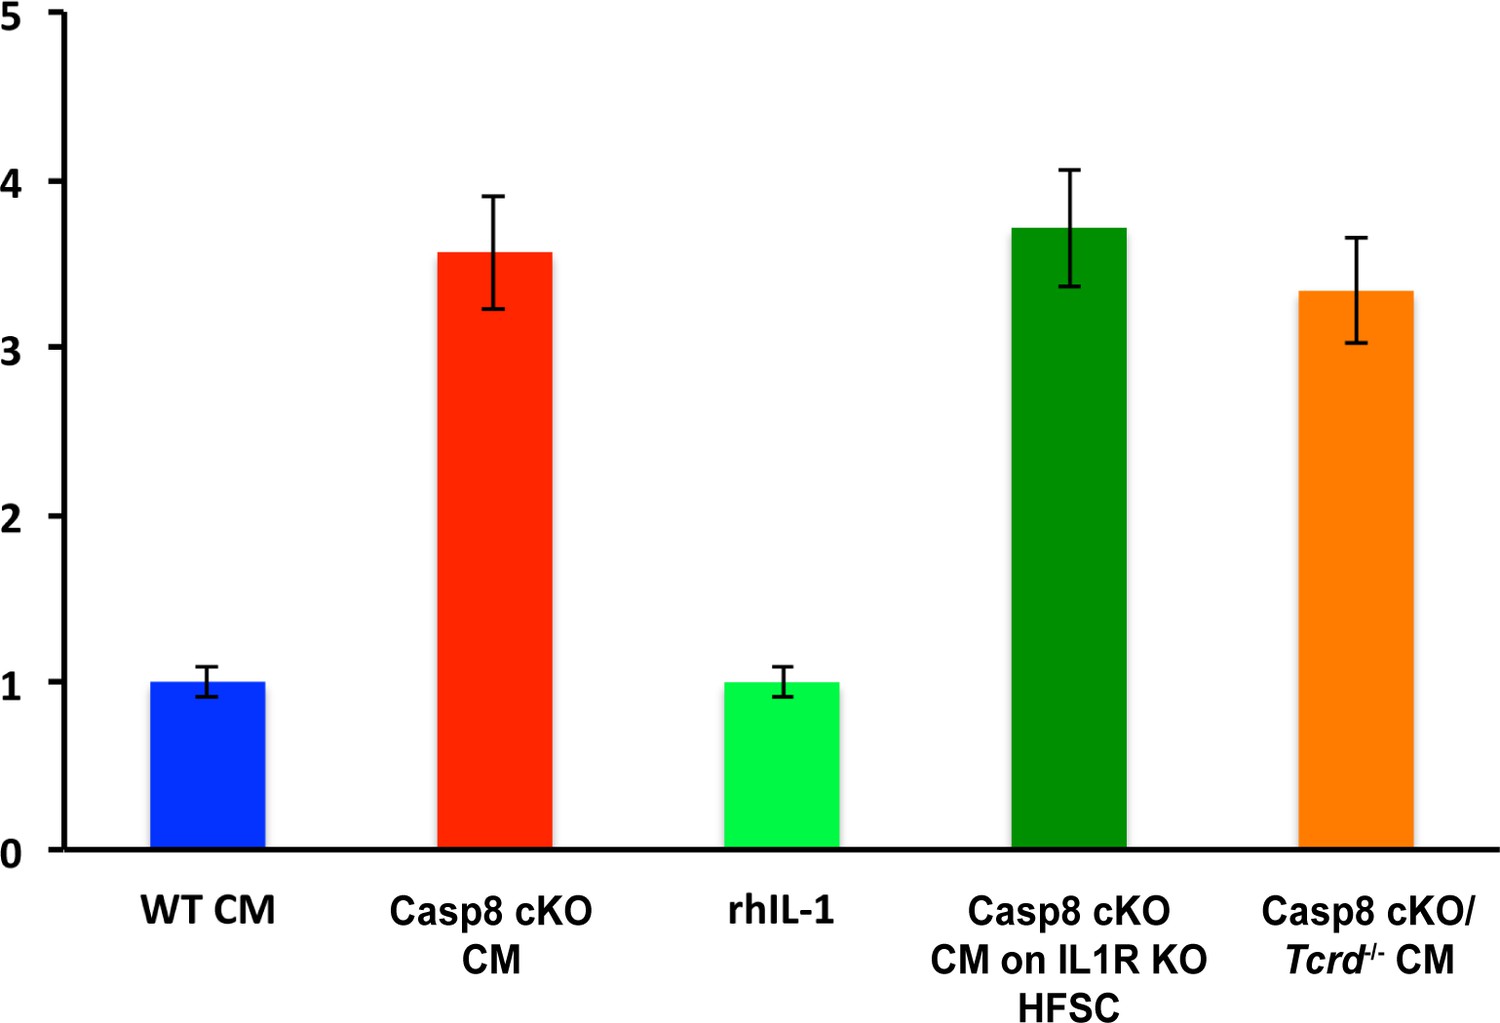
In vitro migration of HFSCs.
WT or IL-1RKO HFSCs were plated on the top of a transwell chamber with conditioned media from WT, caspase-8 conditional KO (Casp8 cKO), caspase-8 conditional KO/gdTCRKO (Casp8 cKO/Tcrd-/-) or with recombinant human IL-1 (rhIL-1) in the lower chamber. HFSC migration to the lower side of the membrane was quantified after 24 hr. Results are presented as fold change relative to WT migration level, which was set at 1.
Figure 2 with 7 supplements
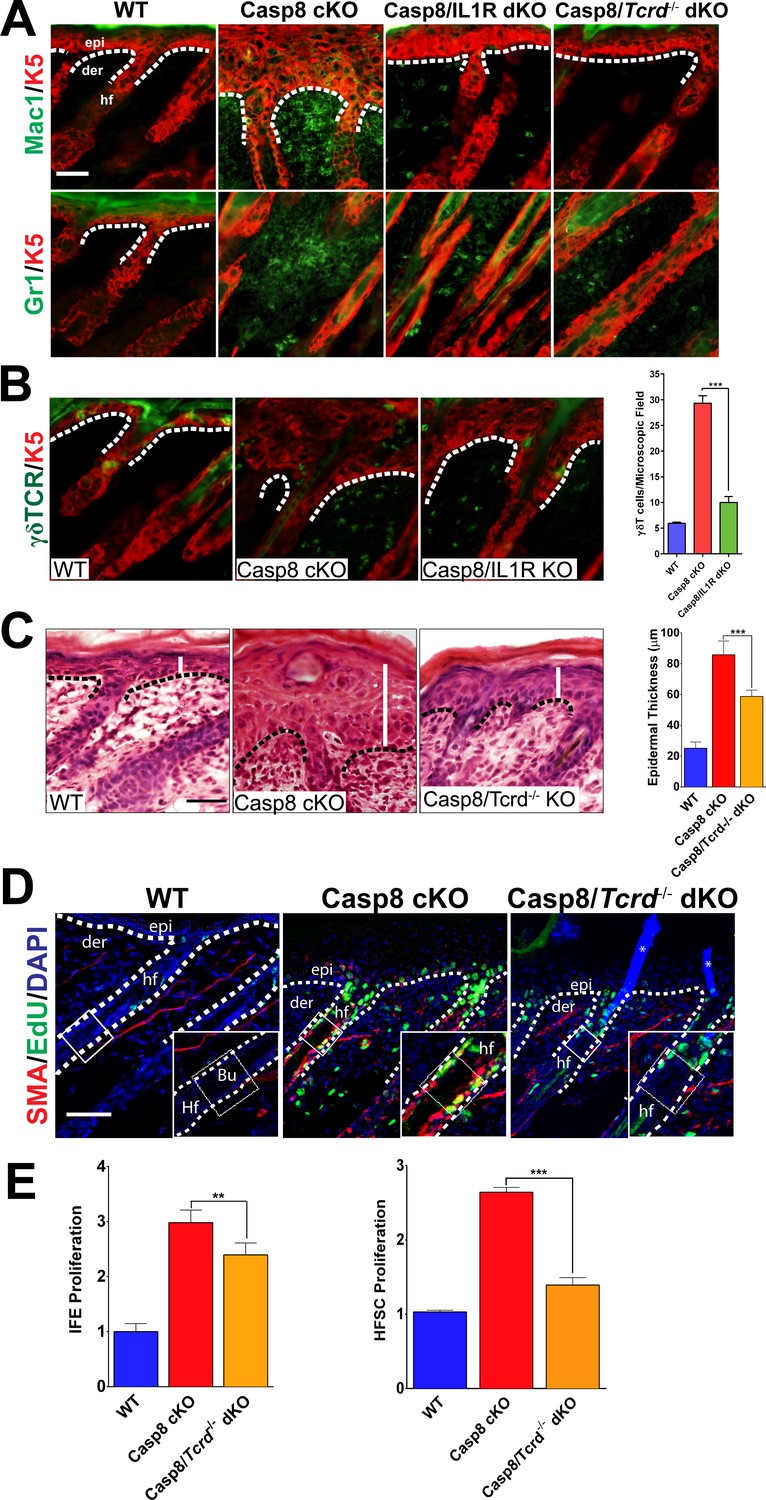
Loss of γδT-cells phenocopies the deficiency of IL-1 signaling in C8- KO epidermis.
(A) Immunofluorescence of mouse skin sections from different genotypes. Staining for keratin 5 (K5, red) and macrophages (Mac1, green) or for granulocytes (Gr-1, green) reveals a reduction in innate immune cell infiltration in the caspase-8 conditional knockout (C8 KO) skin in the absence of IL-1 signaling (C8/IL1R dKO) or γδT-cells (C8/γδTCR dKO). Scale bar = 50 µm, the white dotted lines denote basement membrane. (B) Immunofluorescence of γδT-cells (green) and keratin 5 (K5, red) in the skin of mice from different genotypes identified in the figure. The histogram shows that there is an increase in the amount of γδT-cells in the C8KO skin relative to the wild-type control, and this is reduced in the absence of IL-1 signaling (C8/IL1R dKO). (C) H&E staining of P4 skin showing epidermal thickness differences denoted by the white lines. The dotted line denotes the basement membrane separating epidermis (epi) and dermis (der), hf denotes a hair follicle. Scale bar = 50 μm. The quantified data from three mice per genotype are shown in the histogram. (D) Detection of proliferating cells by EdU labeling (green). The bulge region where HFSCs reside (shown as a box along the hair follicle) was marked by smooth muscle actin staining (red) of the arrectorpilli muscle. Nuclei were stained by DAPI (blue). The dotted line represents the epidermal–dermal interface. The asterisk marks the non-specific immunofluorescence from DAPI channel; the inset shows the magnified view of the hair bulge. (E) Quantification of the proliferating interfollicular epidermal cells (IFE) and hair follicle stem cells (HFSC) from (D). Data shown in B, C, and E are from six different mice per genotype. **p<0.001, ***p<0.0001.
Figure 2—figure supplement 1
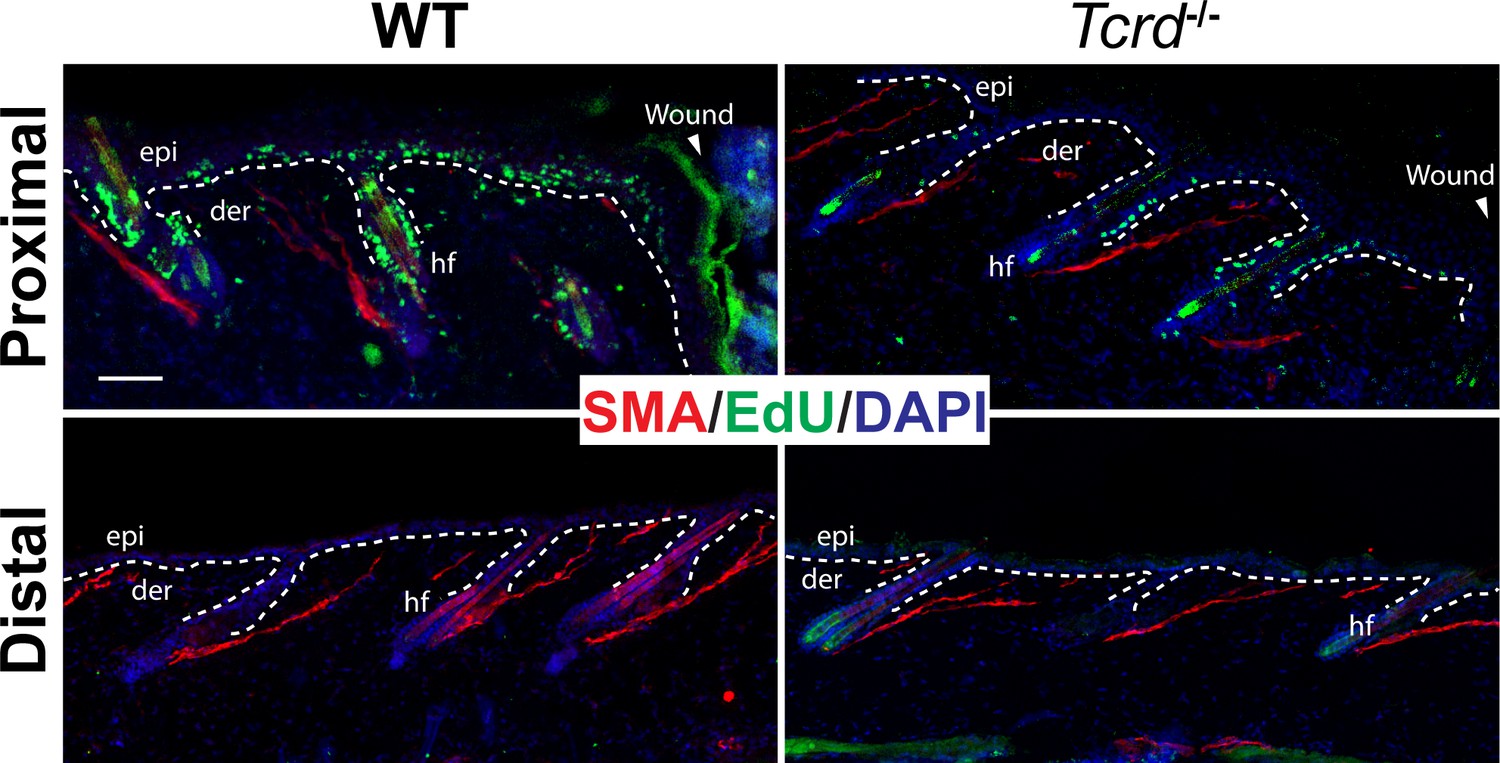
Loss of γδT-cells phenocopies the proliferation deficiency of IL-1 signaling in excisional cutaneous wounds.
Immunofluorescence images of day 3 wound proximal and distal skin sections from 8-week-old WT or γδT-deficient mice. Sections were labelled with anti-SMA antibody to mark the hair-bulge region (red) and with EdU to detect actively proliferating cells. Nuclei were stained with DAPI (blue). Scale bar = 50 µm. The dotted line represents the epidermal–dermal interface.
Figure 2—figure supplement 2
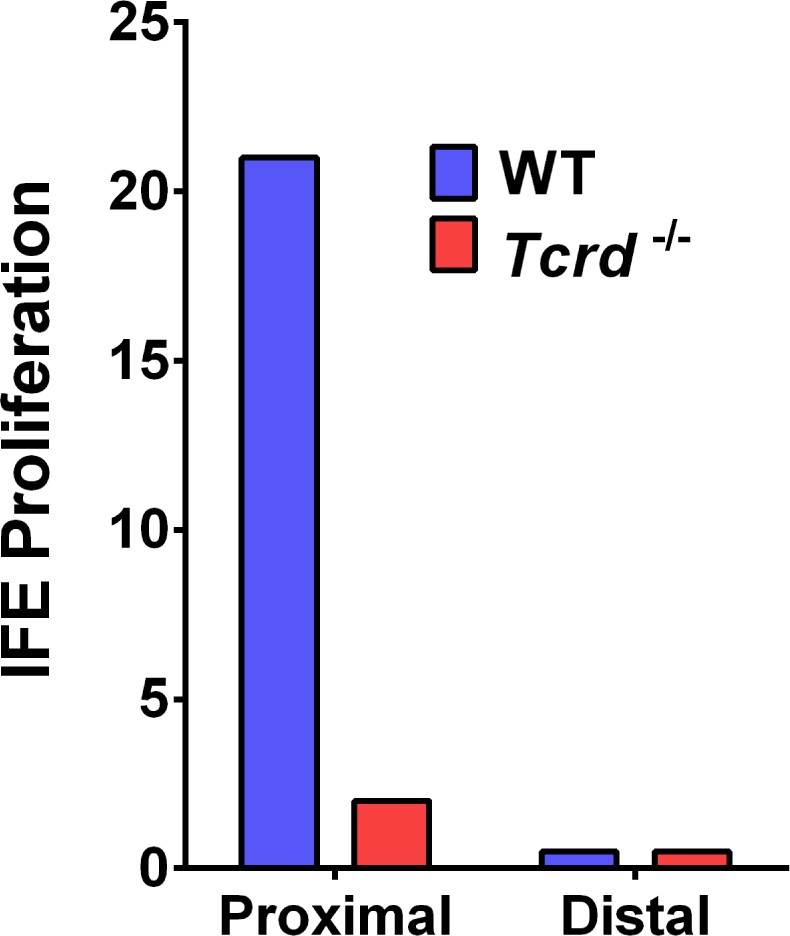
Effect of γδT-cells on IFE proliferation.
The cell counts of Edu+ proliferating interfollicular epidermal (IFE) cells in skin wounds of WT and γδT-cell-deficient mice. The proximal area of measurement was restricted to the first three hair follicles adjacent to the wound edge. The cell counts from a region 2 cm away from wound centre was considered to be distal.
Figure 2—figure supplement 3
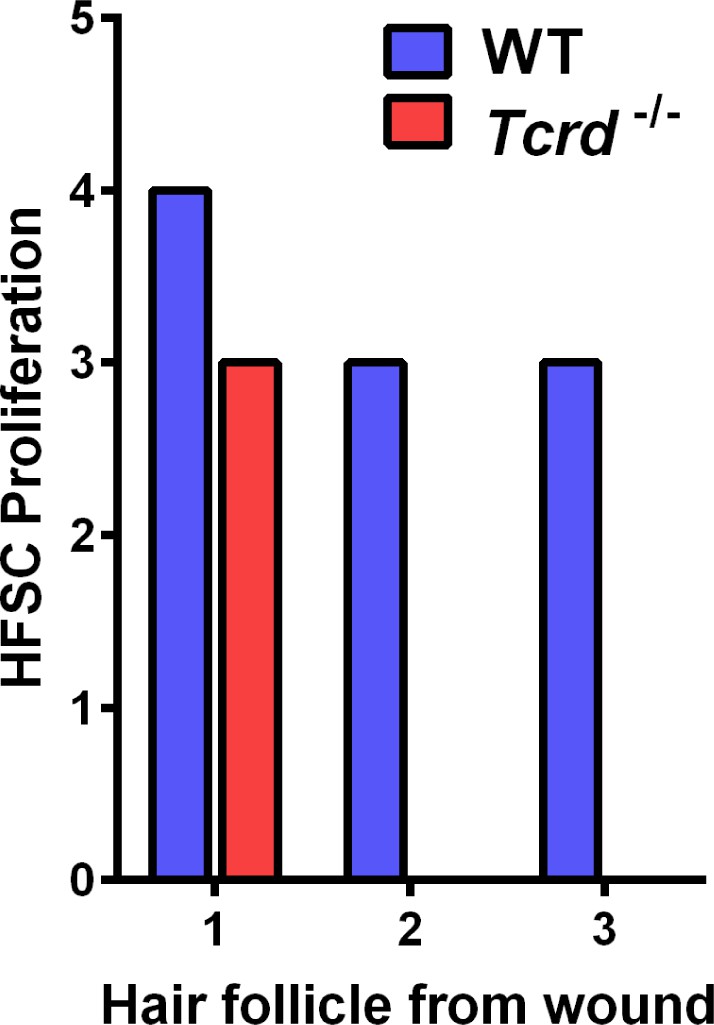
Effect of γδT-cells on HFSC proliferation.
Quantification of EdU+ hair follicle stem cell (HFSC) proliferation in the first three hair follicles adjacent to wounds in mice from the labeled genotypes.
Figure 2—figure supplement 4
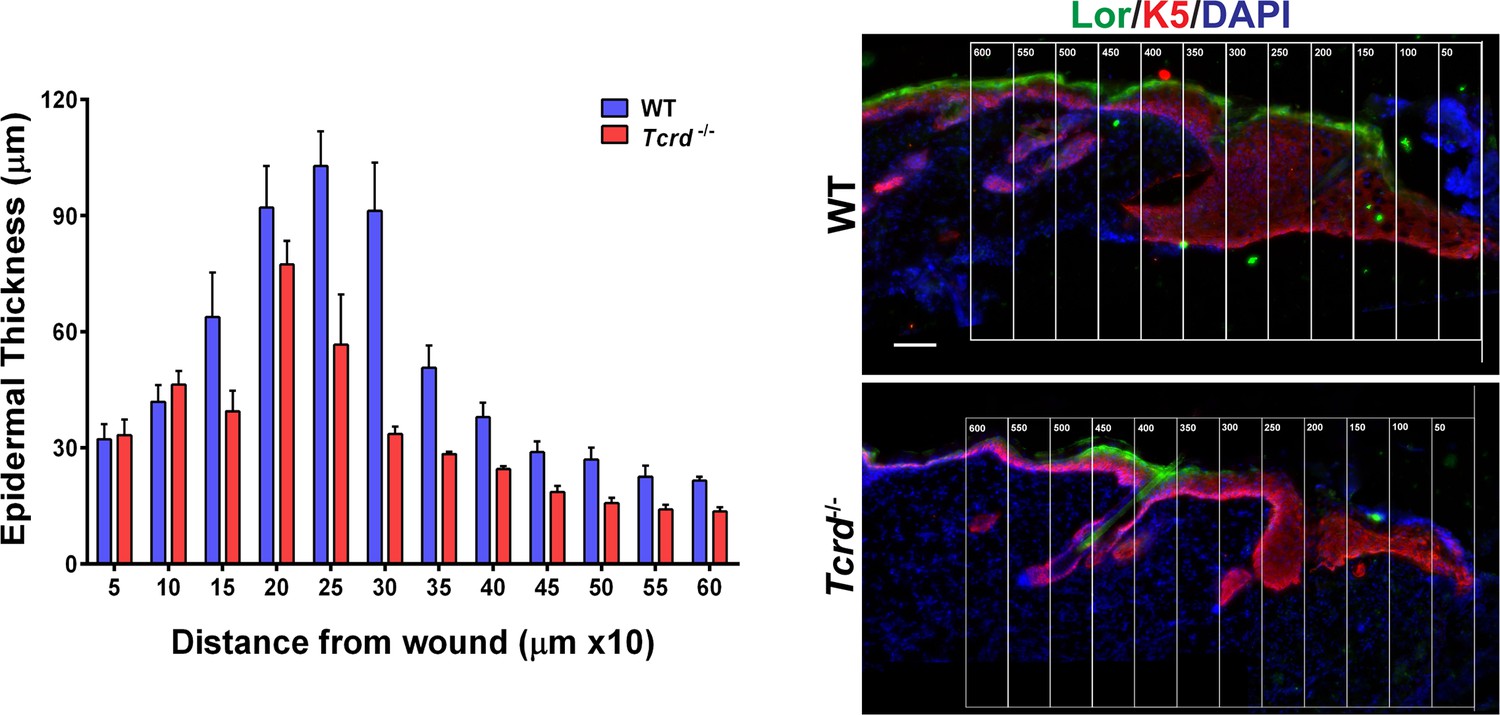
Effect of γδT-cells on epidermal thickness.
The epidermal thickness was quantified by measuring the distance between the Keratin-5+ basal layer and the loricrin+ granular layer, starting from the region with keratin-5 expression in the wound of WT and γδT-deficient mice. Each bar in the graph is a mean of three data points obtained from a 50-μm wide region of interest.
Figure 2—figure supplement 5
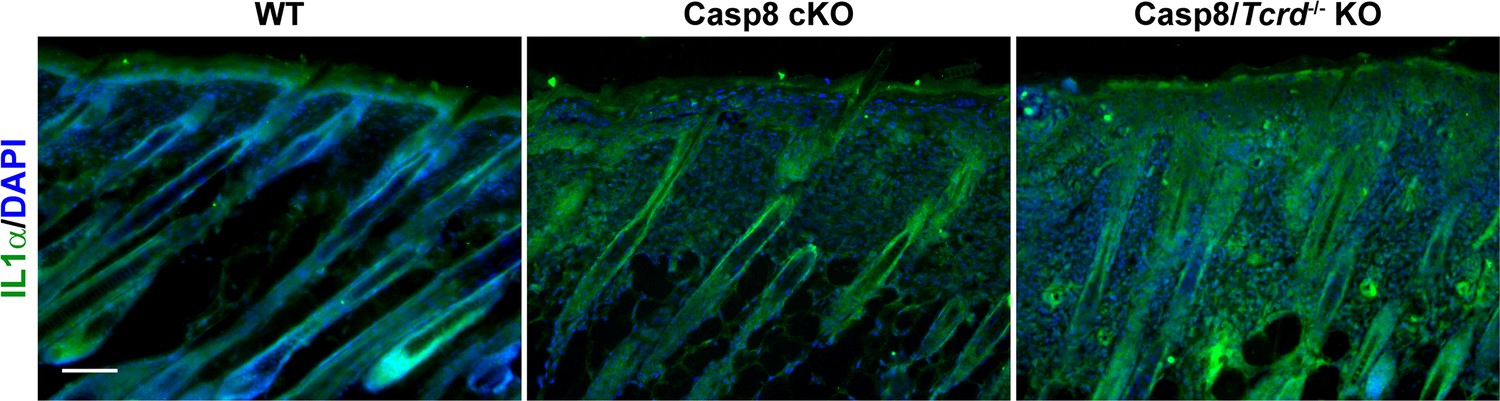
Extracellular IL-1α in the genetic wound-healing model.
Unpermeabilized skin sections from wild type, caspase 8 conditional knockout, and caspase-8 conditional knockout/γδT-cell KO mice were stained for extracellular IL-1α. Scale bar = 50 μm.
Figure 2—figure supplement 6
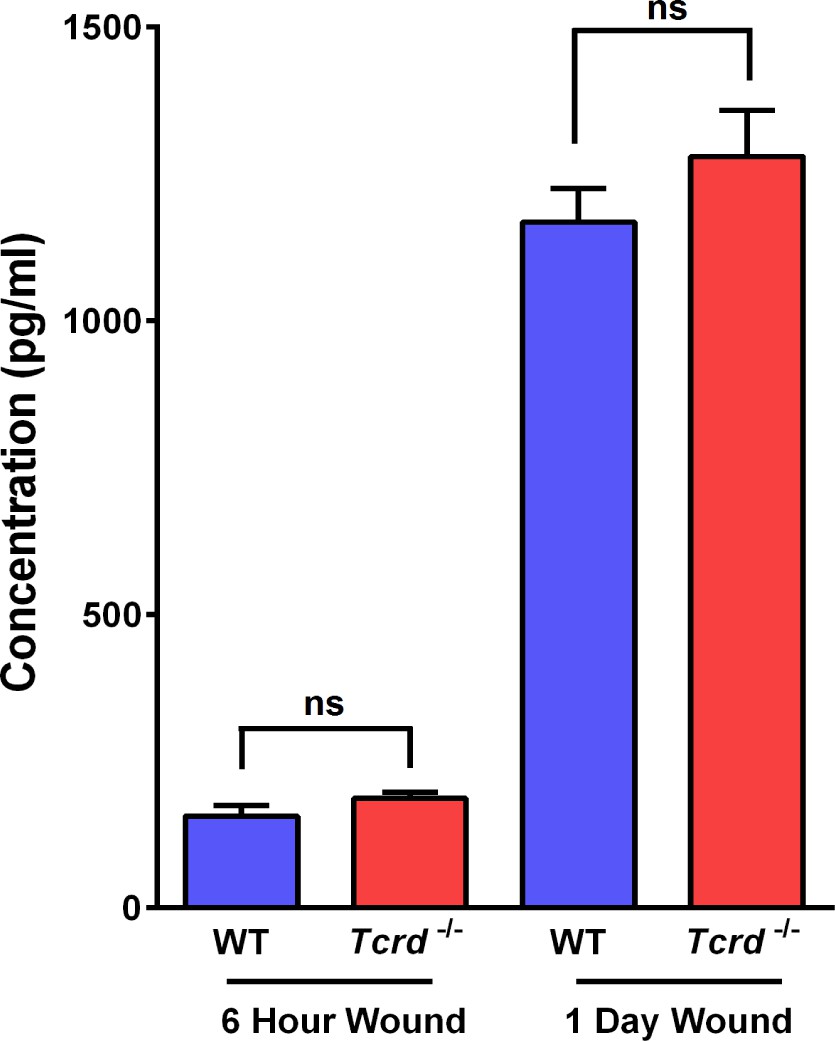
Quantification of secreted IL-1α from excisional wounds.
Wounded 5-mm punch biopsies from WT and γδT-cell KO mice were used to condition media. ELISA for IL1α was performed on the conditioned media. Analysis was performed on 6 hr and 24 hr post-wounding samples. Differences between the secreted IL1α levels were not statistically significant (ns).
Figure 2—figure supplement 7
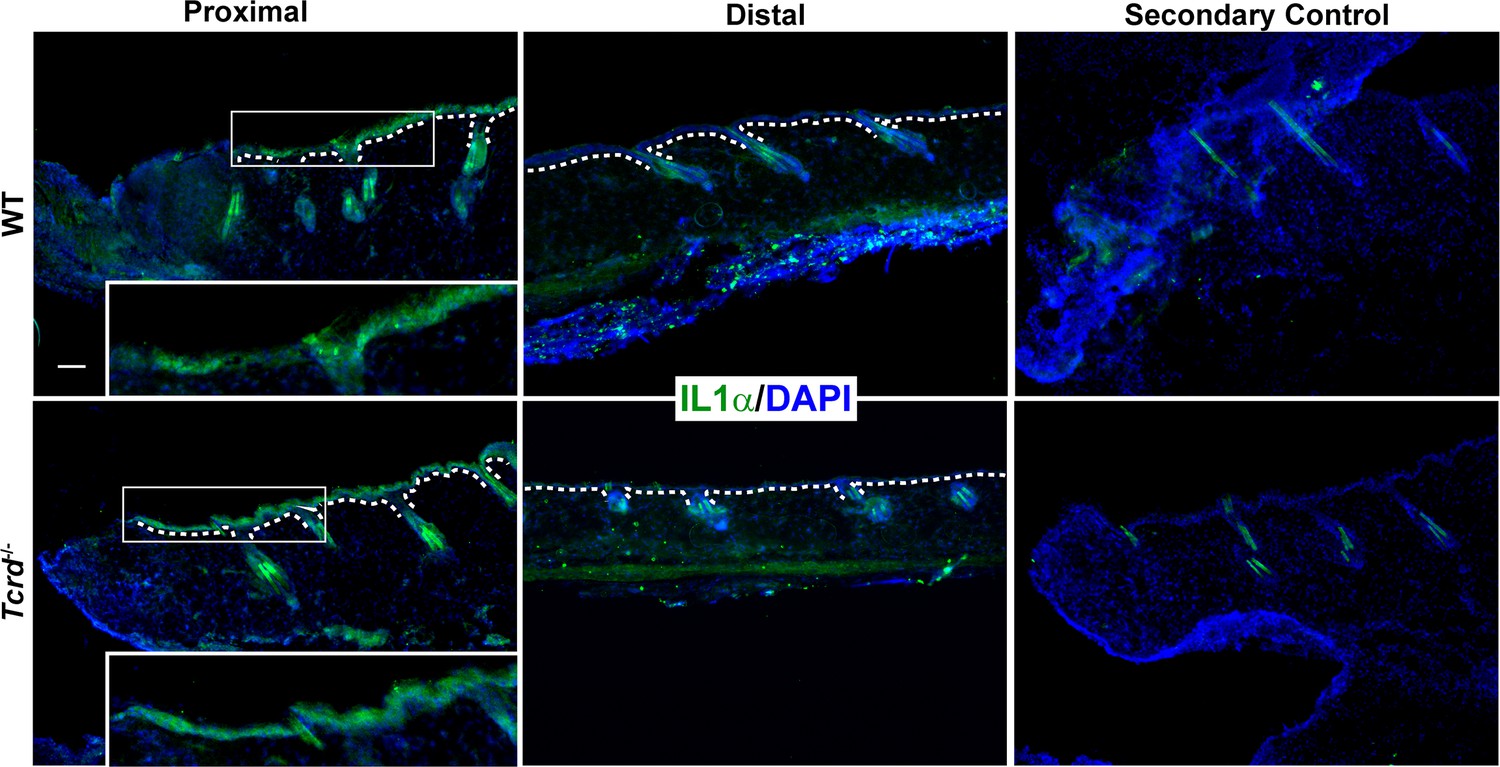
Representative image of day one post-wound in Figure 2—figure supplement 6.
Unpermeabilized skin sections from WT or γδT-cell KO mice were stained for extracellular IL-1α. Regions shown are proximal to the wound and 2 cm distal to the wound site. The secondary control comprises sections stained only with secondary antibody. Boxed regions are shown as magnified images in the inset. White dotted lines denote the basement membrane that separates the epidermis from the underlying dermis. Scale bar = 50 μm.
Figure 3 with 5 supplements

IL-1 signaling contributes to γδT-cell proliferation in the caspase-8 cKO skin.
(A) Quantification of γδT-cell proliferation. The numbers of γδT-cells are reported as the fold difference from WT, which was normalized to 1. **p<0.001. (B) Detection of activated γδT-cells. γδT-cell (green) activation was monitored by expression of TNFα (red) via immunofluorescence. Nuclei (blue) are stained with DAPI. Arrowheads mark some of the activated γδT-cells. (C) Quantification of activated γδT-cells per square millimeter. Scale bar = 50 µm, ***p<0.0001. (D) Recapitulation of γδT-cell proliferation in vitro. Primary γδT-cells were isolated from the skin of either wild type (WT) or IL1R knockout mice (IL1R−/− γδT-cell), primed with anti-CD3 and anti-JAML and treated with conditioned media from WT (WT CM) or caspase-8 conditional knockout (C8 KO CM) skins. Inhibitory antibody against IL-7 or recombinant human IL-1α or IL-7 were added as indicated. The histogram shows the fold difference in γδT-cell numbers relative to numbers of WT CM-treated γδT-cells, which are normalized to 1. Data are representative of at least three independent experiments performed in triplicate. **p<0.001, ***p<0.0001.
Figure 3—figure supplement 1
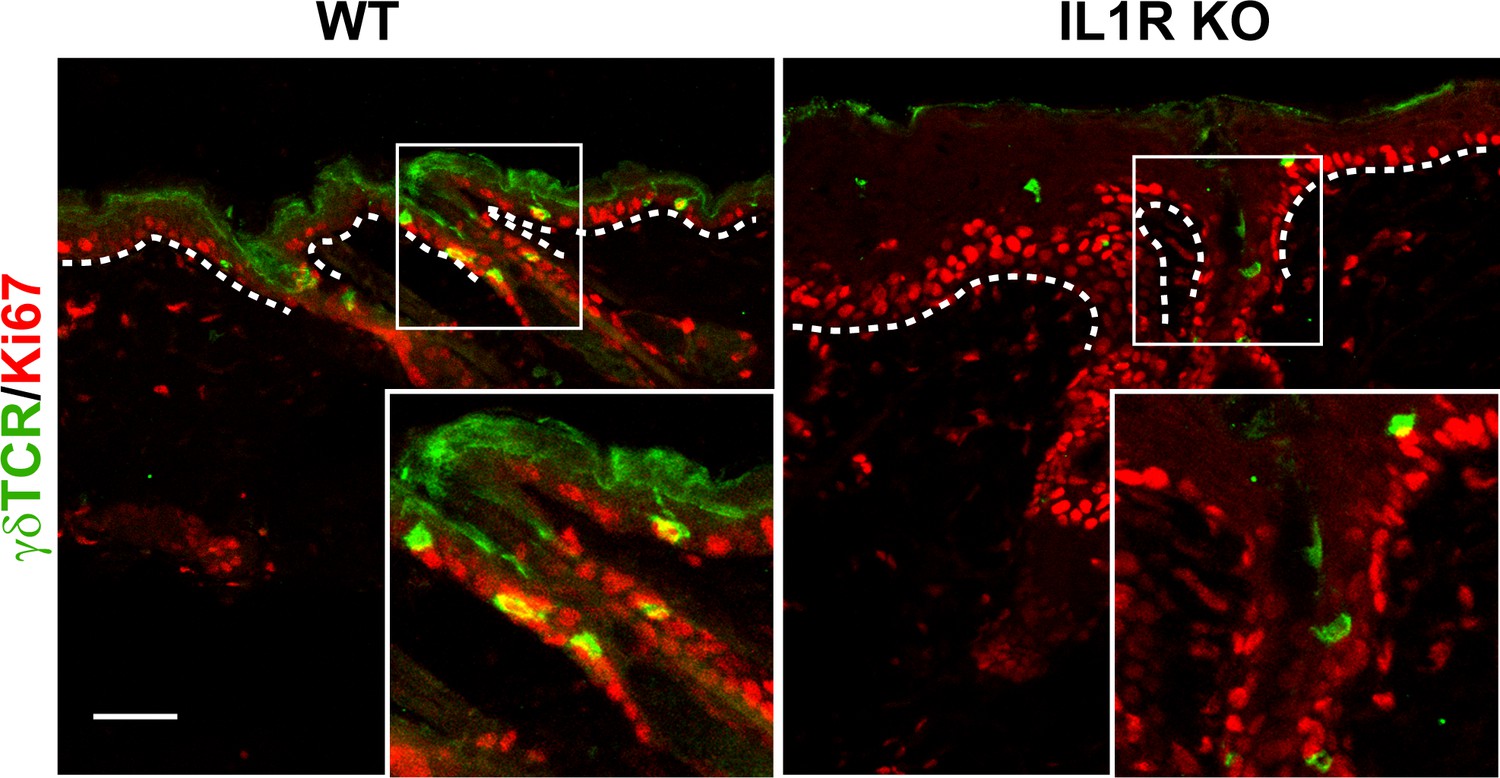
Proliferation of γδT-cells post wounding.
Skin sections from 8-week-old wild-type (WT) or IL1R KO mice were stained for γδT-cells (green) and Ki67 (red) 3 days post wounding. Boxed regions are shown as magnified images in the insets. White dotted lines denote the basement membrane that separates the epidermis from the underlying dermis. Scale bar = 50 μm.
Figure 3—figure supplement 2
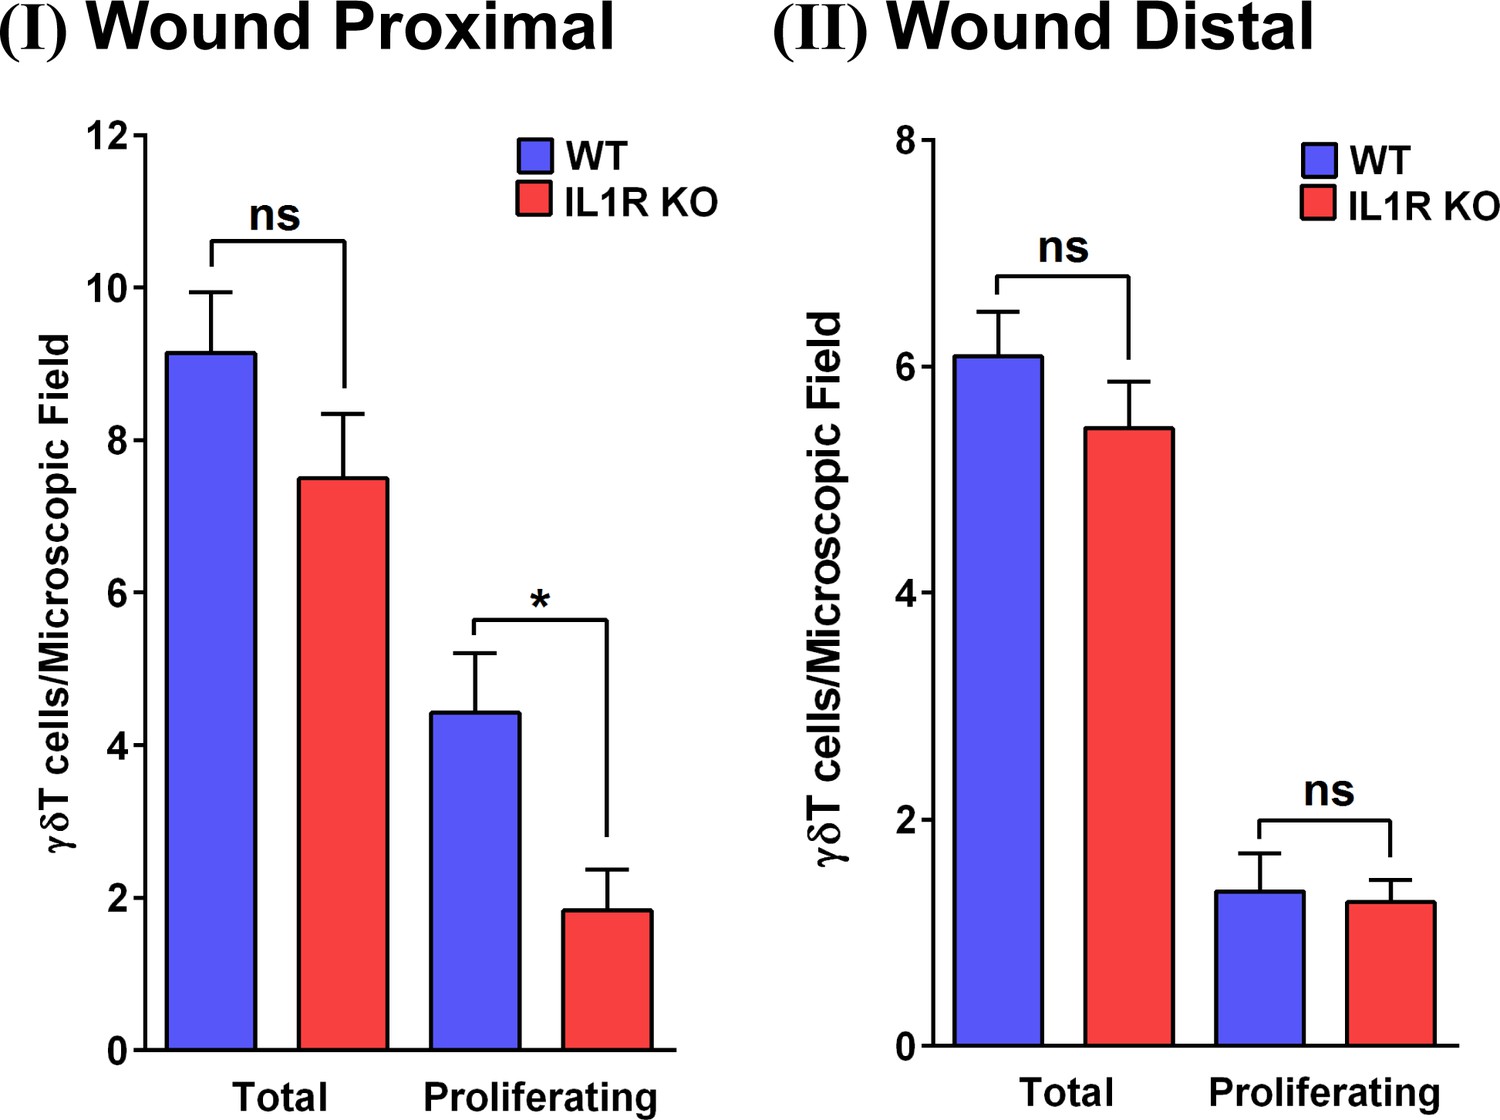
Quantification of proliferating γδT-cells.
The number of total γδT-cells and proliferating γδT-cells based on the images in Figure 3—figure supplement 1. Panel I shows quantitation of a region proximal to the wound bed. Panel II shows quantitation of a region 2 cm distal from the wound bed.
Figure 3—figure supplement 3
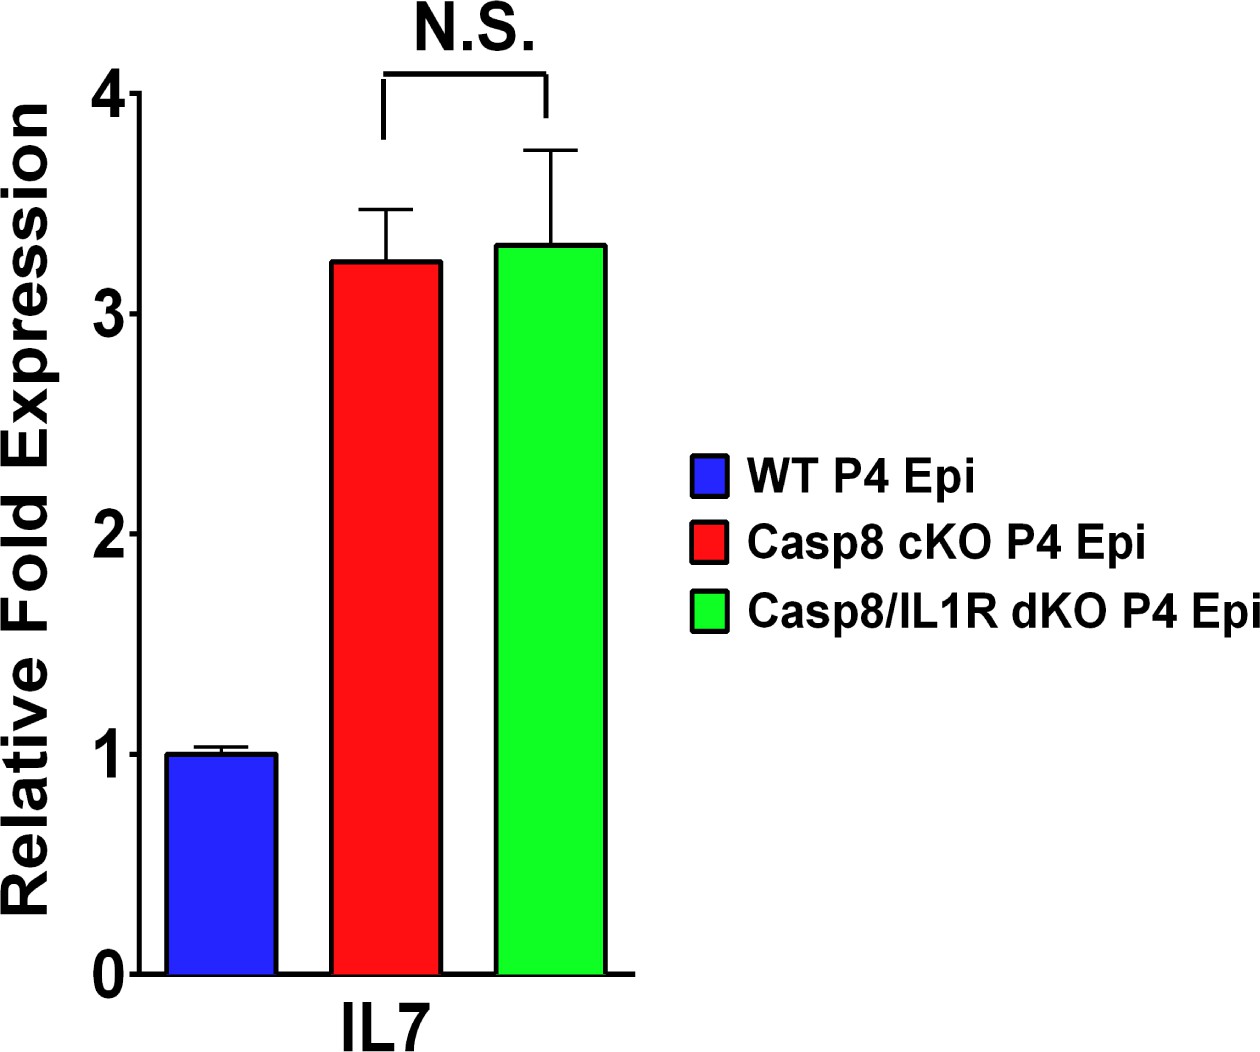
IL7 expression from caspase 8-deficient epidermis is not affected by IL-1α qPCR measurements of levels of IL-7 expression by keratinocytes.
Data are the fold difference ± SEM of three samples per genotype analyzed in triplicate. The p-values comparing C8CKO and C8/IL1R dKO are not statistically significant (N.S.).
Figure 3—figure supplement 4
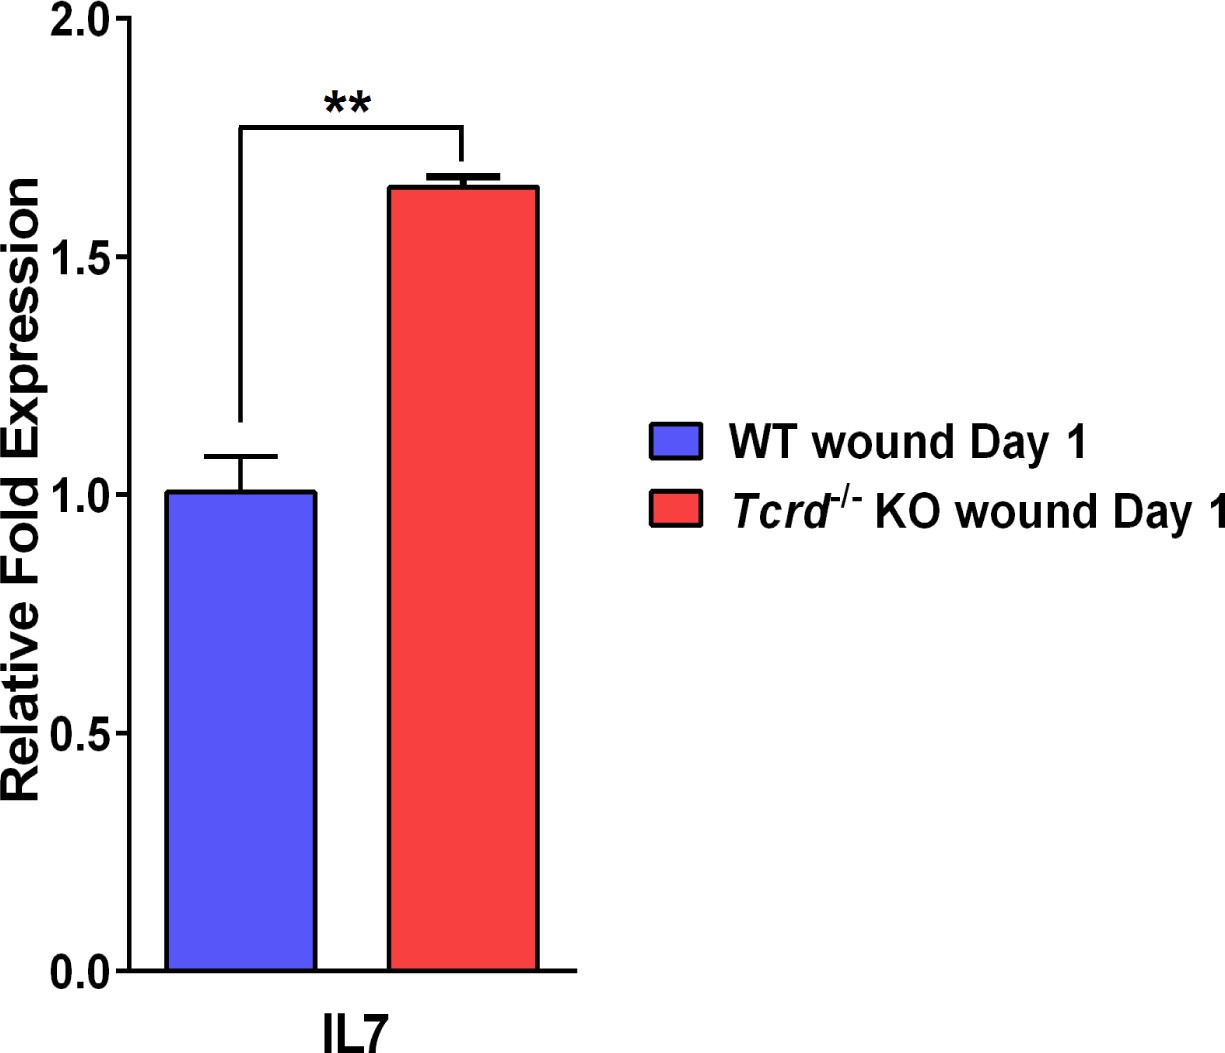
IL-7 expression in excisional wounds.
qPCR measurements of levels of IL-7 expression by keratinocytes. Data are the fold difference ± SEM of three samples per genotype analyzed in triplicate. The levels of IL-7 in the γδT-cell KO wounded skin are higher than those in the wounded wild-type skin. **p<0.001.
Figure 3—figure supplement 5
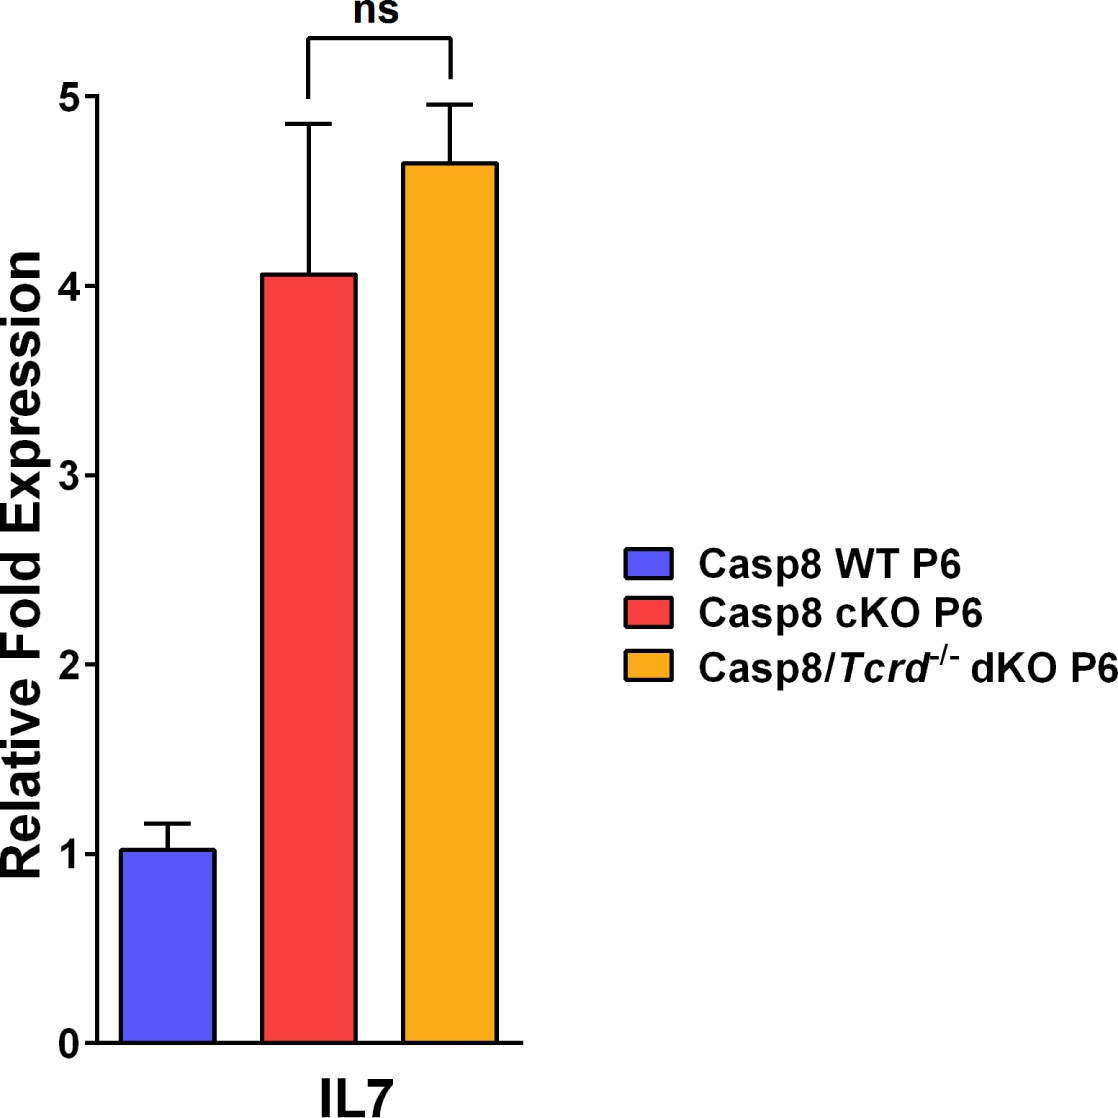
IL-7 expression in a mouse model of wound healing as revealed by qPCR measurements of levels of IL-7 expression by keratinocytes.
Data are the fold difference ± SEM of three samples per genotype analyzed in triplicate. The levels of IL-7 in the caspase-8 cKO and the caspase-8 cKO/γδT-cell KO at postnatal day six skin are not statistically different (ns).
Figure 4 with 3 supplements
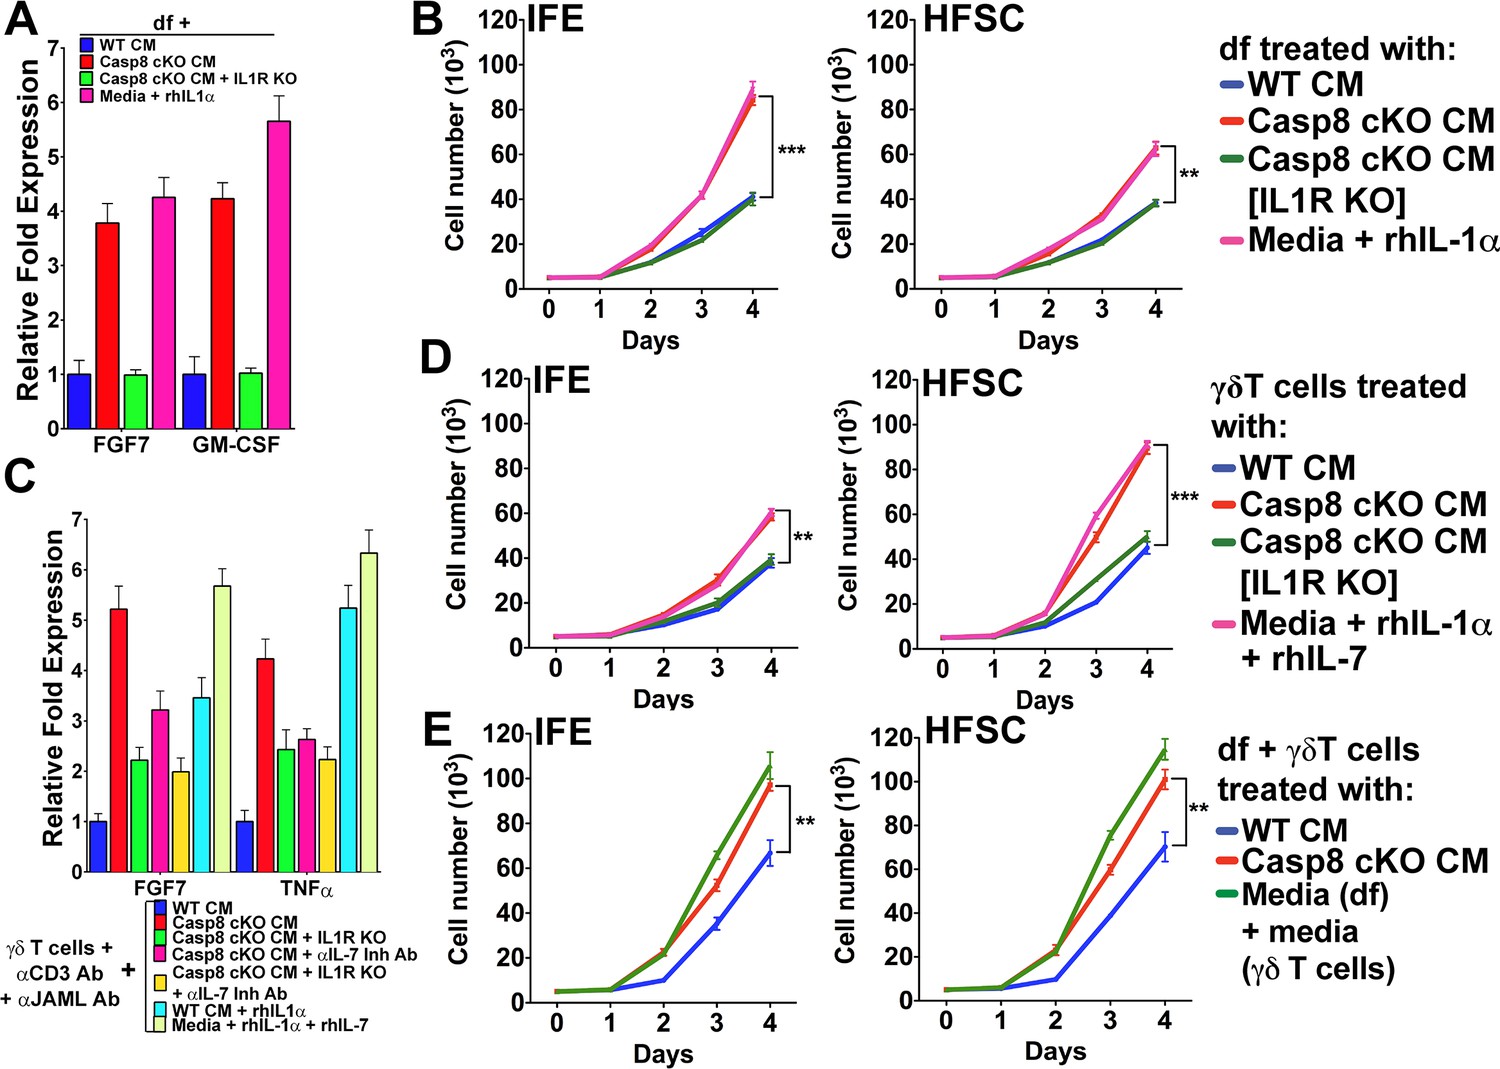
Conditioned media from dermal fibroblasts and activated γδT-cells differentially enhance epithelial stem cell proliferation in distinct niches within the skin.
(A) Activation of dermal fibroblasts (df). df were treated with conditioned media (CM) as noted in the figure and the expression of the growth factors FGF7 and GM-CSF were assessed by qPCR. (B) Effect of activated df on stem cell proliferation. The proliferation rates of isolated interfollicullar epidermal (IFE) and hair follicle stem cells (HFSC) were determined by cell counting with trypan blue exclusion following treatment with the CM from dermal fibroblasts. Dermal fibroblasts were first activated as described in the figure legend prior to conditioning fresh medium with them. Cell numbers were determined daily over four days. (C) Potentiation of γδT-cell activation by CM. WT or IL1R–/– γδT-cells were treated with CM as described in the figure, and the markers for γδT-cell activation, FGF7 and TNFα, were assessed by qPCR. (D) Effect of activated γδT-cells on stem cell proliferation. The proliferation rates of isolated IFE and HFSC were determined by trypan blue exclusion cell counting. IFE and HFSC were incubated for four days with CM from γδT-cells. (E) Combinatorial effect of activated df and γδT-cells on stem cell proliferation. The proliferation rates of isolated IFE and HFSC were determined by trypan blue exclusion cell counting. IFE and HFSC were incubated for four days with CM from df and γδT-cells that were first treated as described in the figure. Data in (A) and (C) were obtained from triplicates of at least three independent experiments and are represented as the fold difference ± SEM. The data shown in (B), (D) and (E) are the averages ± SEM of three independent experiments analyzed in triplicate. **p<0.001, ***p<0.0001.
Figure 4—figure supplement 1
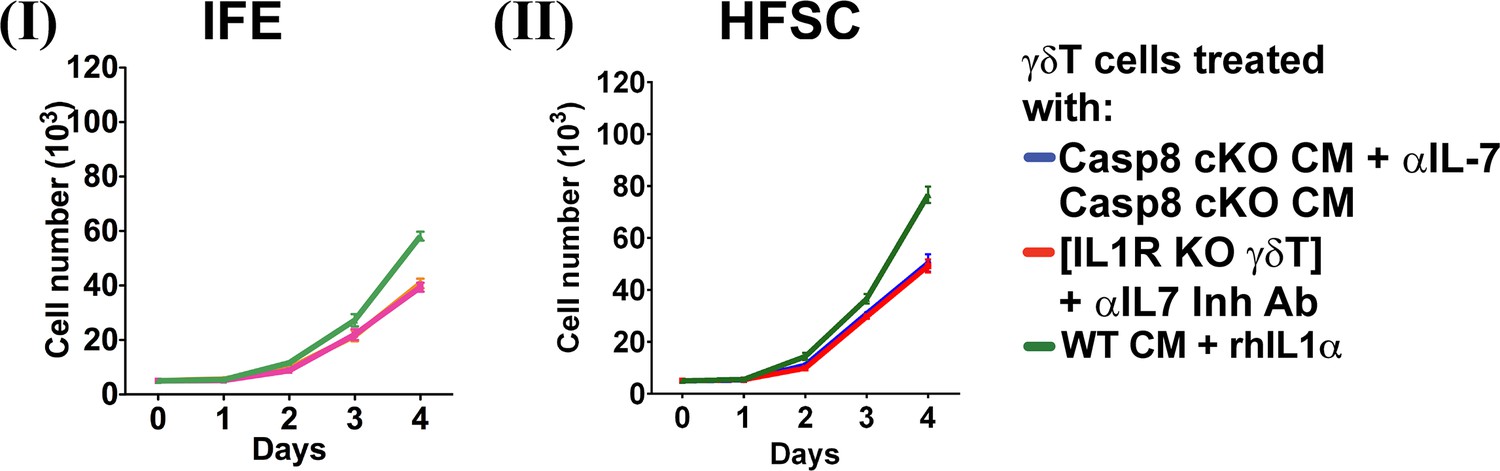
IFE and HFSC proliferation invoked by activated fibroblasts and γδT-cell-conditioned media.
Proliferation rates of IFE (panel I) and HFSC cells (panel II) determined by trypan blue exclusion cell counting after treatment with CM from γδT-cells treated as indicated in the key.
Figure 4—figure supplement 2
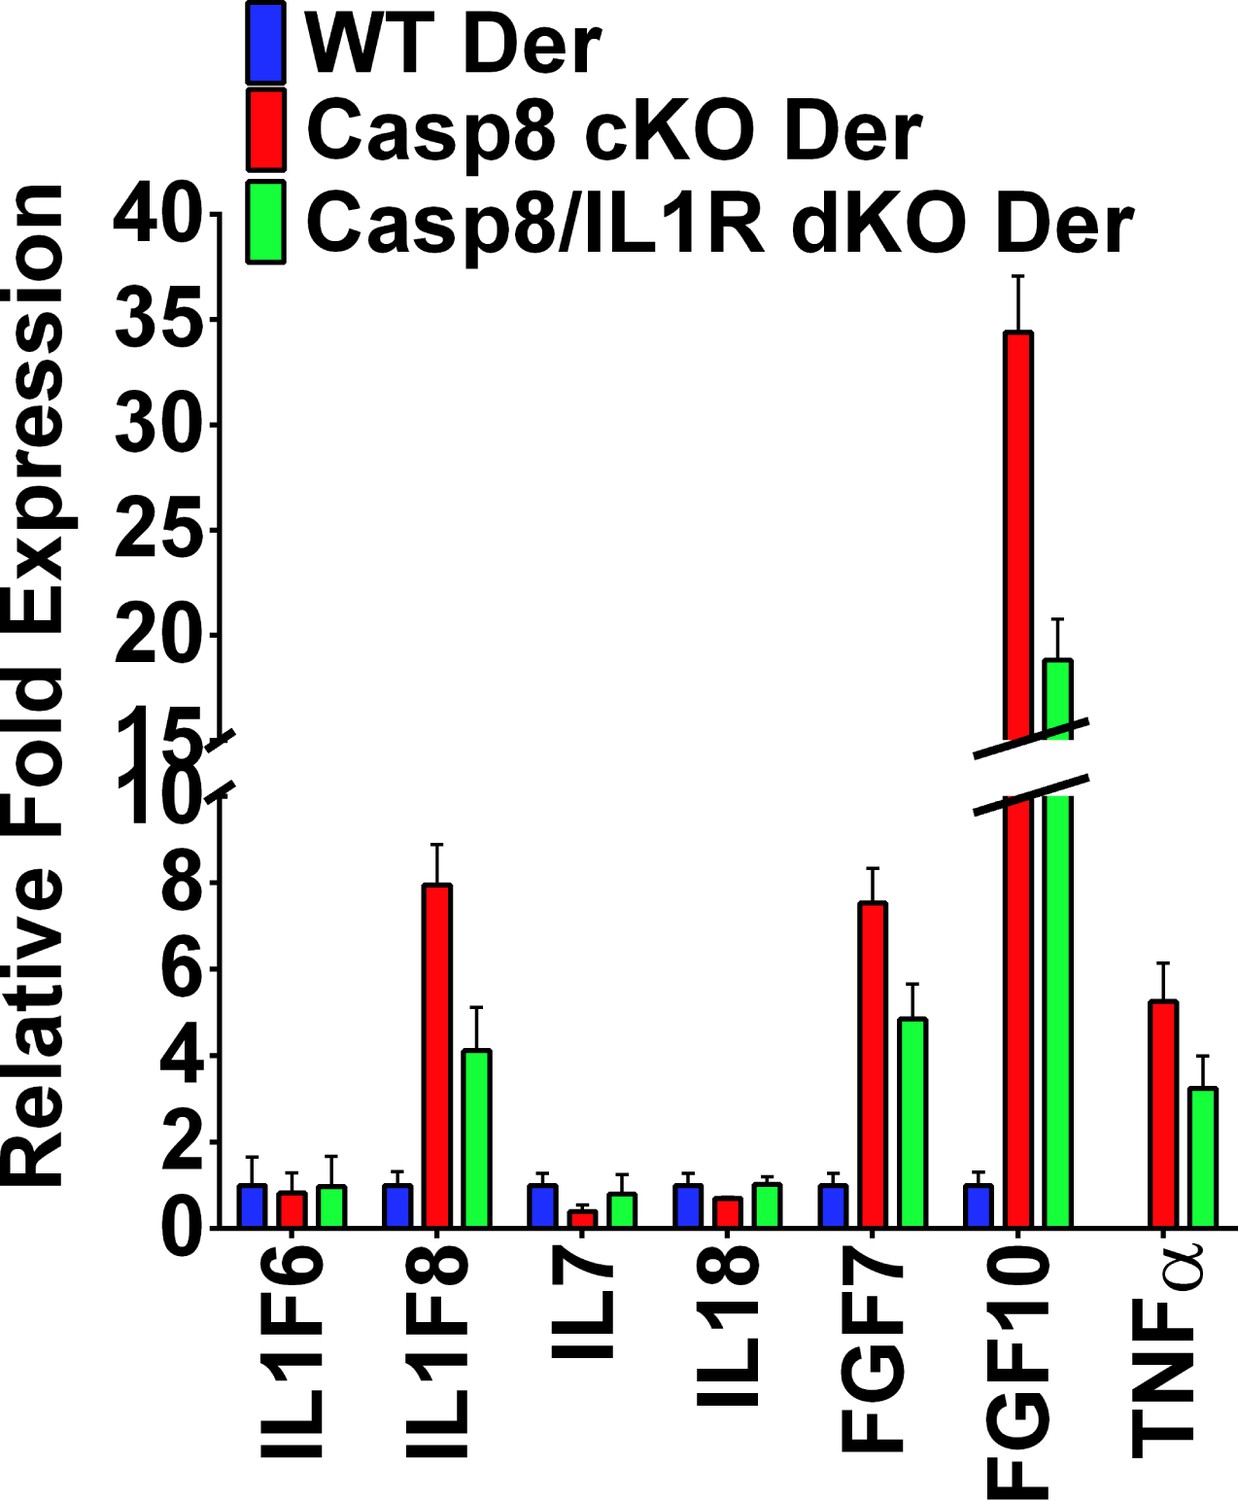
Expression of other IL-1 family members in the dermis.
qPCR of P4 dermis from the different genotypes represented as the fold difference ± SEM. Data were collected from five mice per genotype.
Figure 4—figure supplement 3
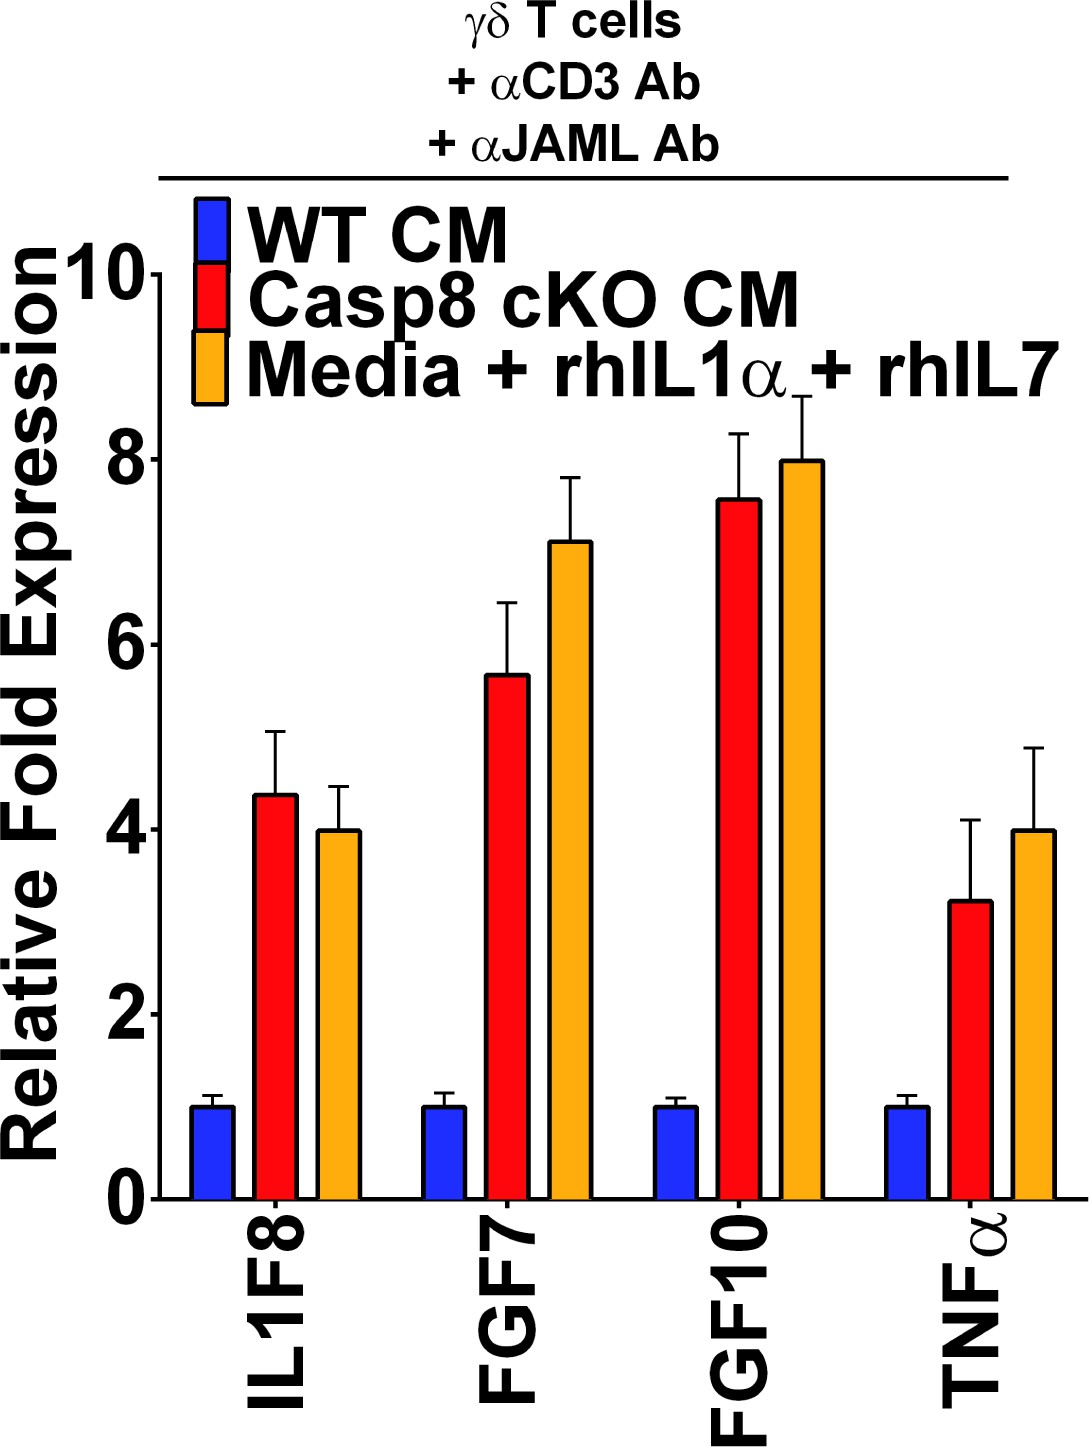
Expression of IL-1 family members by activated γδT-cells.
qPCR of short-term γδT-cell cultures. The data shown are averagesfrom three independent experiments.
Figure 5
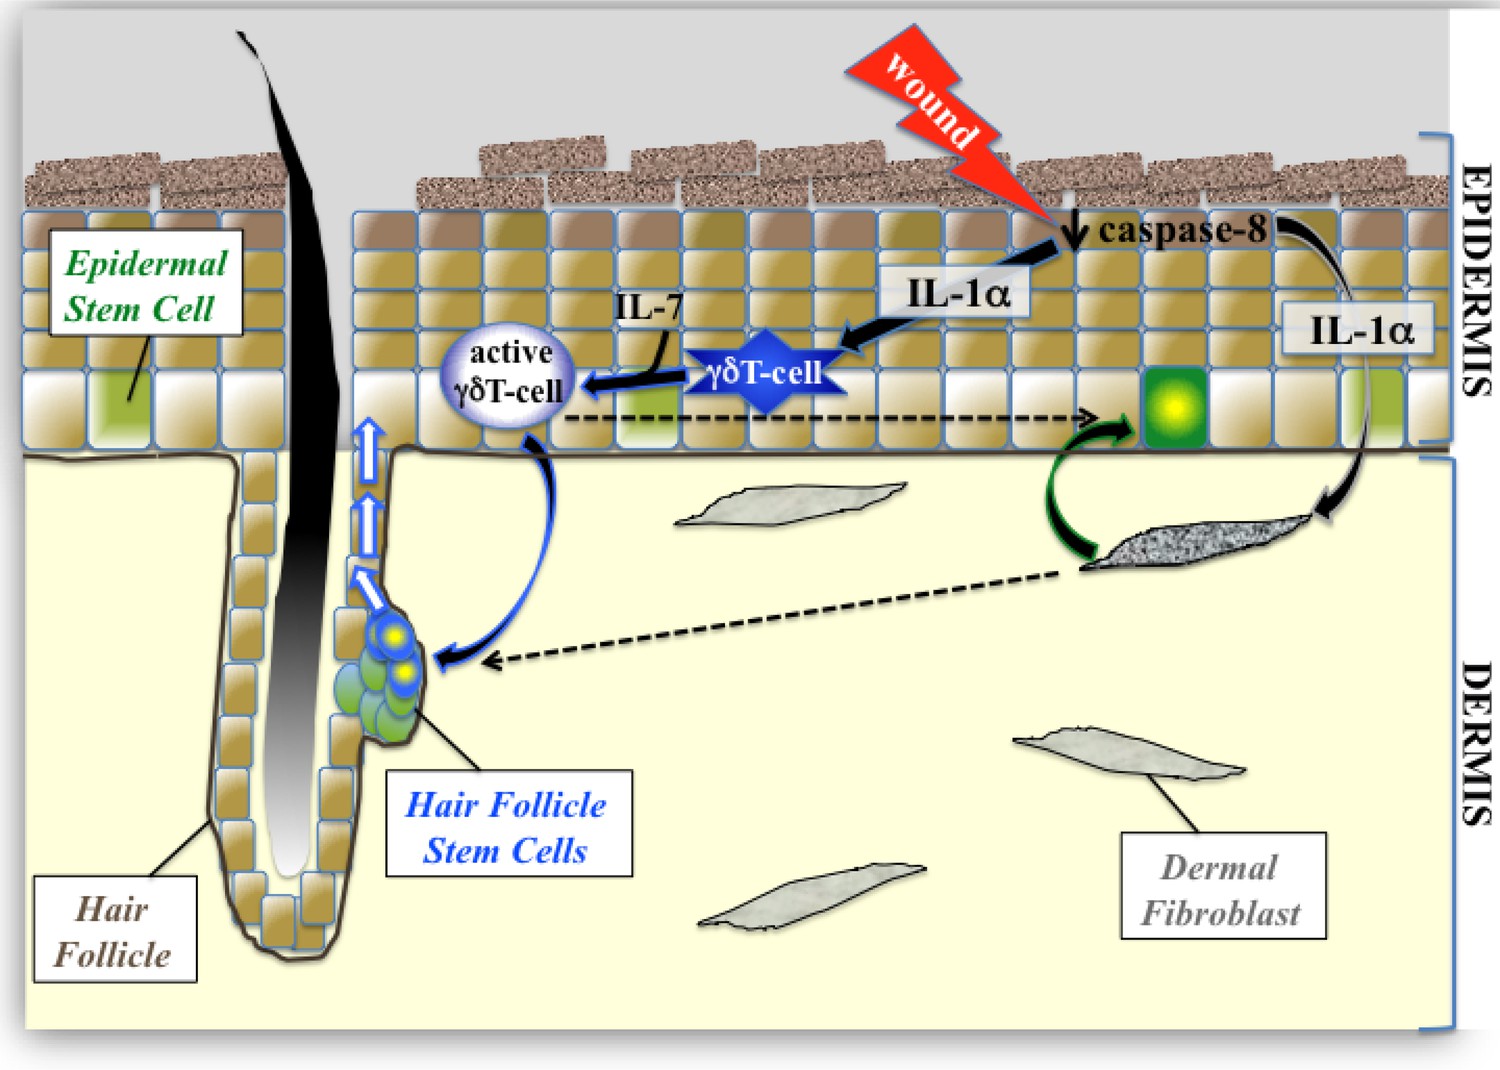
Proposed model of epidermal stem cell proliferation in the caspase-8 conditional knockout model of wound healing.
Upon wounding, caspase 8 levels are downregulated causing the release of IL-1α, which can stimulate the proliferation of interfollicular epidermal stem cells (IFE) through its interactions with dermal fibroblasts. This IL-1αmediated epithelial–mesenchymal crosstalk has a milder effect on hair follicle stem cell (HFSC) proliferation. IL-1α and IL-7 cooperate to enhance the proliferation of activated γδT-cells, which preferentially influences HFSC proliferation.
Tables
Key resources table
| Designation | Source or reference | Identifiers | Additional information |
|---|---|---|---|
| Casp8 fl/fl mice (Casp8 cKO) | Jackson Laboratory | Stock No. 027002 | Animals were originally purchased from Jackson Laboratory but were bred for >5 generations at UCSD and later bred in the NCBS animal facility for >5 generations |
| IL1R KO mice | Jackson Laboratory | Stock No. 028398 | Animals were originally purchased from Jackson Laboratory (Stock No. 000664) but were bred for > 5 generations in the NCBS animal facility |
| Tcrd–/– mice (γδTCR KO) | Jackson Laboratory | Stock No. 003448 | Animals were originally purchased from Jackson Laboratory (Stock No. 000664) but were bred for > 5 generations in the NCBS animal facility |
| Krt14-Cre | Jackson Laboratory | Stock No. 018964 | Animals were originally purchased from Jackson Laboratory (Stock No. 000664) but were bred for > 5 generations in the NCBS animal facility |
| C57Bl6/JNcbs | Jackson Laboratory | Stock No. 000664 | Animals were originally purchased from Jackson Laboratory (Stock No. 000664) but were bred for > 10 generations in the NCBS animal facility |
| anti-CD34 | Ebioscience | 11-0341-82 | (1:100) |
| anti-Ki67 | abcam | ab16667 | (1:100) |
| anti-alpha-smooth muscle actin (a-SMA) | Abcam | ab5694 | (1:100) |
| anti-gamma delta TCR | BD Bioscience | GL3 | (1:100) |
| anti-CD3 | e-biosciences | 14-0032-85 | (1:100) |
| anti-JAML | eBioscience | clone eBio4E10 | (1:100) |
| anti-IL-7 inhibitory antibody (Clone M25) | BioXCell | BE0048 | (1:100) |
| anti-IL-1 alpha | Invitrogen | 14-7011-81 | (1:100) |
| anti-Keratin 5 | Jamora Lab generated | (1:500) | |
| anti-Loricrin | Jamora Lab generated | (1:500) | |
| anti-Sox9 | Abcam | ab185230 | (1:100) |
| anti-Mac1 | Thermo-fisher scientific | MA1-10080 | (1:100) |
| anti-Gr1 | R&D Systems | MAB1037-500 | (1:100) |
| anti-TNFalpha | eBiosciences | 14–7321 | (1:100) |
| Alexa 488- or 555- secondaries | Molecular Probes | (1:400) | |
| DAPI | Molecular Probes | (1:1000) | |
| rhIL-1 alpha | R&D Systems | 200-LA-010 | |
| ELISA kit for IL-1 alpha | eBiosciences | 88501986 | |
| Click-iT EdU Imaging Kit | Thermo-fischer scientific | C10340 | |
| GraphPad | Prism | For statistical analysis |
Additional files
-
Transparent reporting form
- https://doi.org/10.7554/eLife.28875.030
Download links
A two-part list of links to download the article, or parts of the article, in various formats.
Downloads (link to download the article as PDF)
Open citations (links to open the citations from this article in various online reference manager services)
Cite this article (links to download the citations from this article in formats compatible with various reference manager tools)
Stimulation of hair follicle stem cell proliferation through an IL-1 dependent activation of γδT-cells
eLife 6:e28875.
https://doi.org/10.7554/eLife.28875


