Regulatory network structure determines patterns of intermolecular epistasis
- Institute of Science and Technology Austria, Austria
- University of Liverpool, United Kingdom
Figures
Figure 1

Genetic organization of the Lambda phage switch and the experimental system.
(A) The Lambda phage switch consists of two transcription factors - CI and Cro; two promoters - a strong promoter PR and a weak promoter PRM (not shown); and three operator sites - OR1, OR2, and OR3. (B) The experimental synthetic system, where cro was substituted with the fluorescence marker gene (venus-yfp) under control of PR. The PRM promoter was removed by the removal of parts of OR3. Located 500 bp away on the reverse strand and separated by a terminator sequence is the cI gene under control of an inducible PTET promoter. CI, the trans-element, is 714 bp; the cis-element is 84 bp long. (C) CI dimers bind cooperatively to OR1 and OR2, leading to repression of the PR promoter.
Figure 2 with 7 supplements

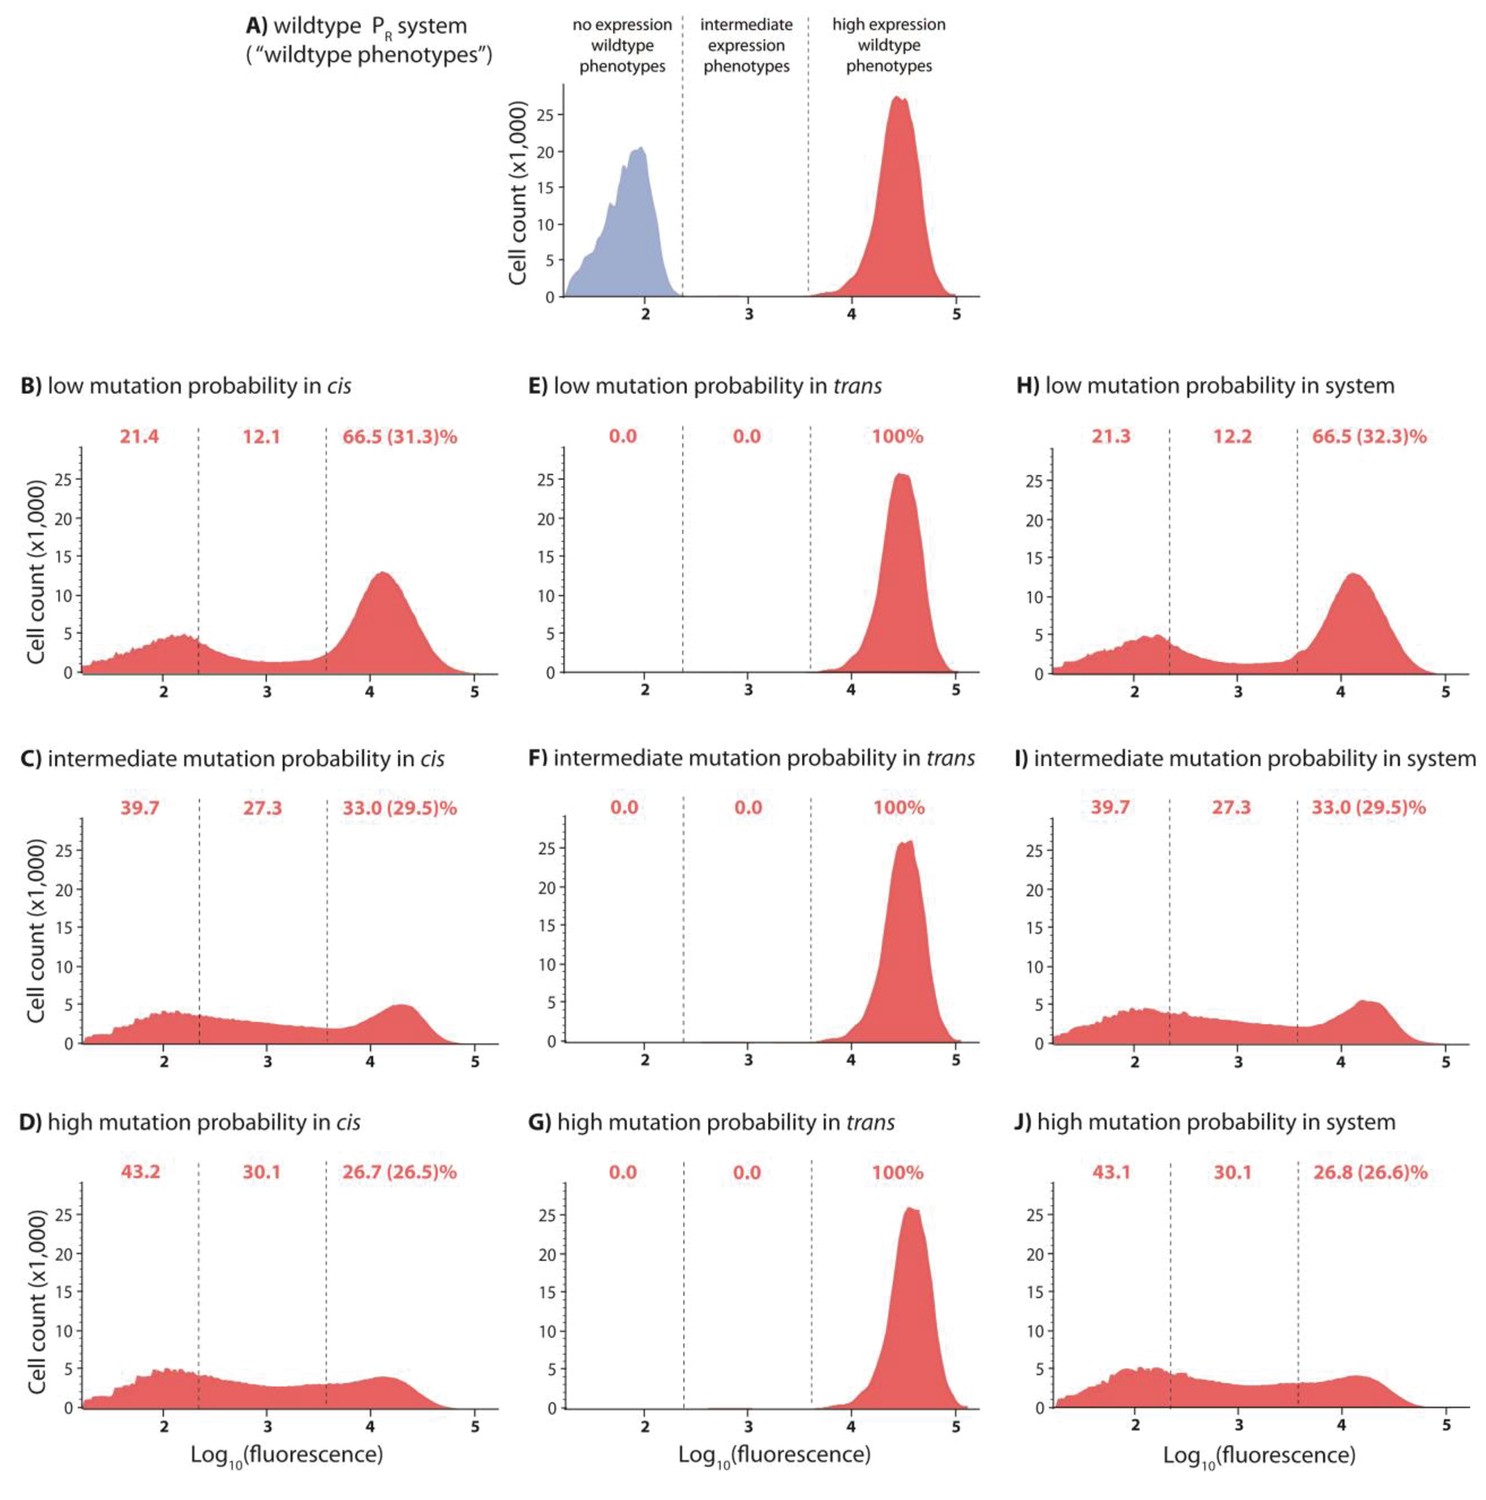
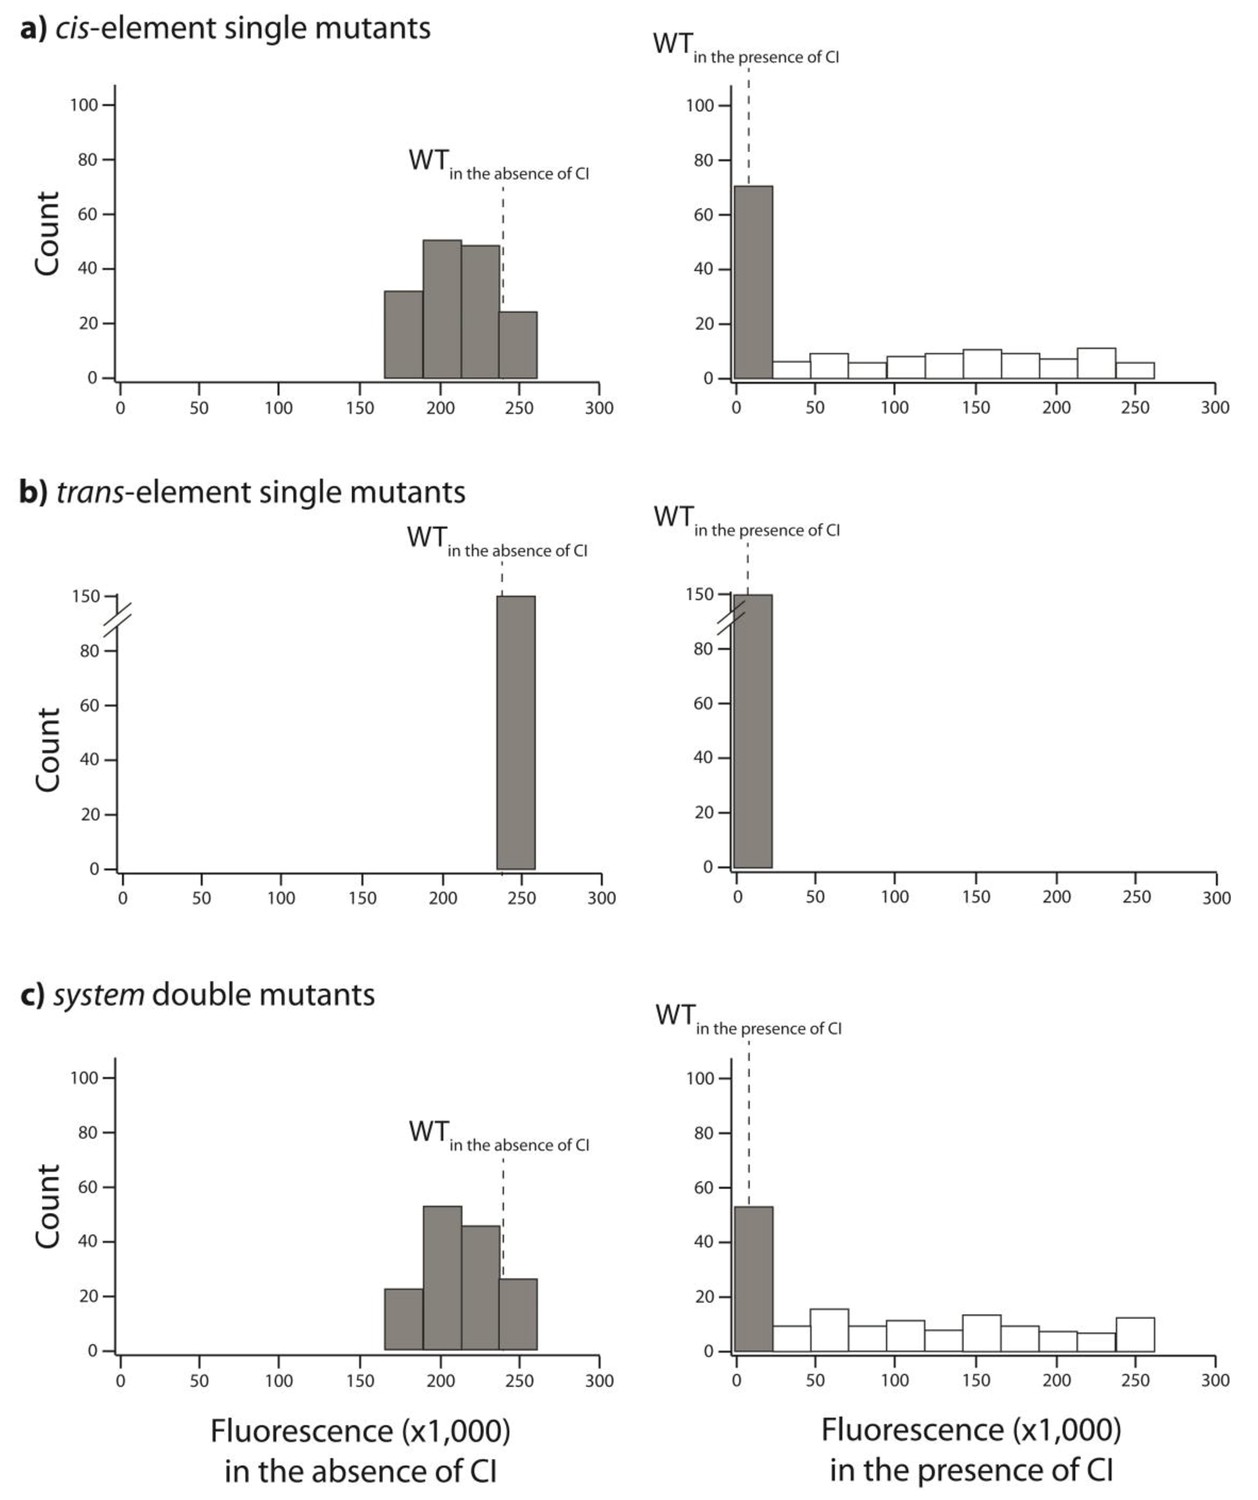
DMEs of the whole system are more evenly distributed than the individual component DMEs.
In the experimental system, CI acts as a tight repressor. The distributions of fluorescence are shown in the absence of CI (red) and in the presence of CI (blue). Each distribution was obtained by measuring fluorescence of two independent measurements of 500,000 cells by flow cytometry, which were then pooled together. The dashed lines separate three categories of phenotypes – ‘no expression’ phenotypes (corresponding to repressed wildtype); ‘high expression’ phenotypes (corresponding to the wildtype in the absence of CI); and ‘intermediate’ phenotypes. No expression and high expression categories are defined to include >99.9% of the wildtype fluorescence distribution in the presence and in the absence of CI, respectively. The Shannon entropy (S) is used to estimate how uniform each distribution is across the entire range of possible expression levels. The associated standard deviation (±) is given for each S value. Blue numbers are percentage of counts in each category in the presence of CI. Numbers in parentheses are percentage of counts excluding the estimated percentages of uniquely transformed individuals carrying the wildtype genotype (see Materials and methods). The naïve additive convolution prediction for each system library and the associated predictions for the frequency of mutants in each category are shown in grey. Pearson’s Chi-squared test was used to assess the difference between the observed and the convolution-predicted frequency of mutants in each category (low: χ2(2)=8.20; p<0.05; intermediate: χ2(2)=32.26; p<0.0001; and high mutation frequency library: χ2(2)=74.51; p<0.0001). The distributions of the effects of mutations for the cis-element, the trans-element, and the whole system in the absence of CI are shown in Figure 2—figure supplement 1. Figure 2—figure supplement 2 shows distributions of the effects of 150 single point mutations in the cis- and the trans-elements. Statistical significance of the differences in entropy values between the mutant libraries is shown in Figure 2—source data 3. Flow cytometry measurements of 20 individual isolates from each library are shown in Figure 2—figure supplements 3, 4 and 5, the analysis of which was used to demonstrate that gene expression noise is constant (Figure 2—source data 1). Convolutions for each mutation probability performed with the knowledge of the genetic regulatory structure of the system are shown in Figure 2—figure supplement 6, while Figure 2—figure supplement 7 provides an explanation of how convolutions were performed. The outcome of the test for how sensitive the shapes of distributions are to the number of sampled individuals is shown in Figure 2—source data 4, while the confirmation that the mutagenesis protocol resulted in expected distributions of the number of mutations are shown in Figure 2—source data 2.
-
Figure 2—source data 1
Gene expression noise is constant.
The flow cytometry data obtained for 20 cis, trans, and system mutant isolates from each mutation probability library was used to quantify gene expression noise. The data provided here are shown in Figure 2—figure supplements 3, 4 and 5.
- https://doi.org/10.7554/eLife.28921.011
-
Figure 2—source data 2
Sequencing 40 isolates from each cis- and trans-element library confirms the predicted distribution of the number of mutations.
This data also allowed us to estimate the frequency of ‘back’ cloning (wildtype re-ligating instead of the desired insert), and of the frequency of ‘failed’ cloning (no insert of any type).
- https://doi.org/10.7554/eLife.28921.012
-
Figure 2—source data 3
Differences between calculated entropy estimates are statistically significant.
P values of the differences in entropies of mutant libraries were calculated using a nonparametric permutation test.
- https://doi.org/10.7554/eLife.28921.013
-
Figure 2—source data 4
Observed distributions accurately describe phenotypic distributions of possible mutations.
Comparison of random subsamples of each dataset to the full dataset using K-S test shows that observed distributions are not sensitive to reductions in sample size or mutant library diversity. We take 50 random subsamples for each subsample size of each cis- and trans-element mutant library in each relevant environment (both absence and presence of CI for cis-element libraries, only presence of CI for trans -element libraries). D-statistic from the K-S test is used to estimate significance (p value).
- https://doi.org/10.7554/eLife.28921.014
Figure 2—figure supplement 1
DMEs for cis-element, trans-element, and system libraries in the absence of CI.
In the experimental system, CI acts as a tight repressor. Each distribution was obtained by measuring fluorescence of two independent measurements of 500,000 cells by flow cytometry, which were then pooled together. The dashed lines separate three categories of phenotypes. ‘No expression’ and ‘high expression’ categories are defined to include >99.9% of the wildtype fluorescence distribution in the presence and in the absence of CI, respectively. Red numbers are percentage of counts in each category in the absence of CI. Numbers in brackets are percentage of counts excluding the estimated percentage of uniquely transformed individuals carrying the wildtype genotype. DMEs of the trans-element library in the absence of CI are the same as the wildtype. DMEs of the cis-element and system libraries with equivalent mutation probability are not different from each other in the absence of CI.
Figure 2—figure supplement 2
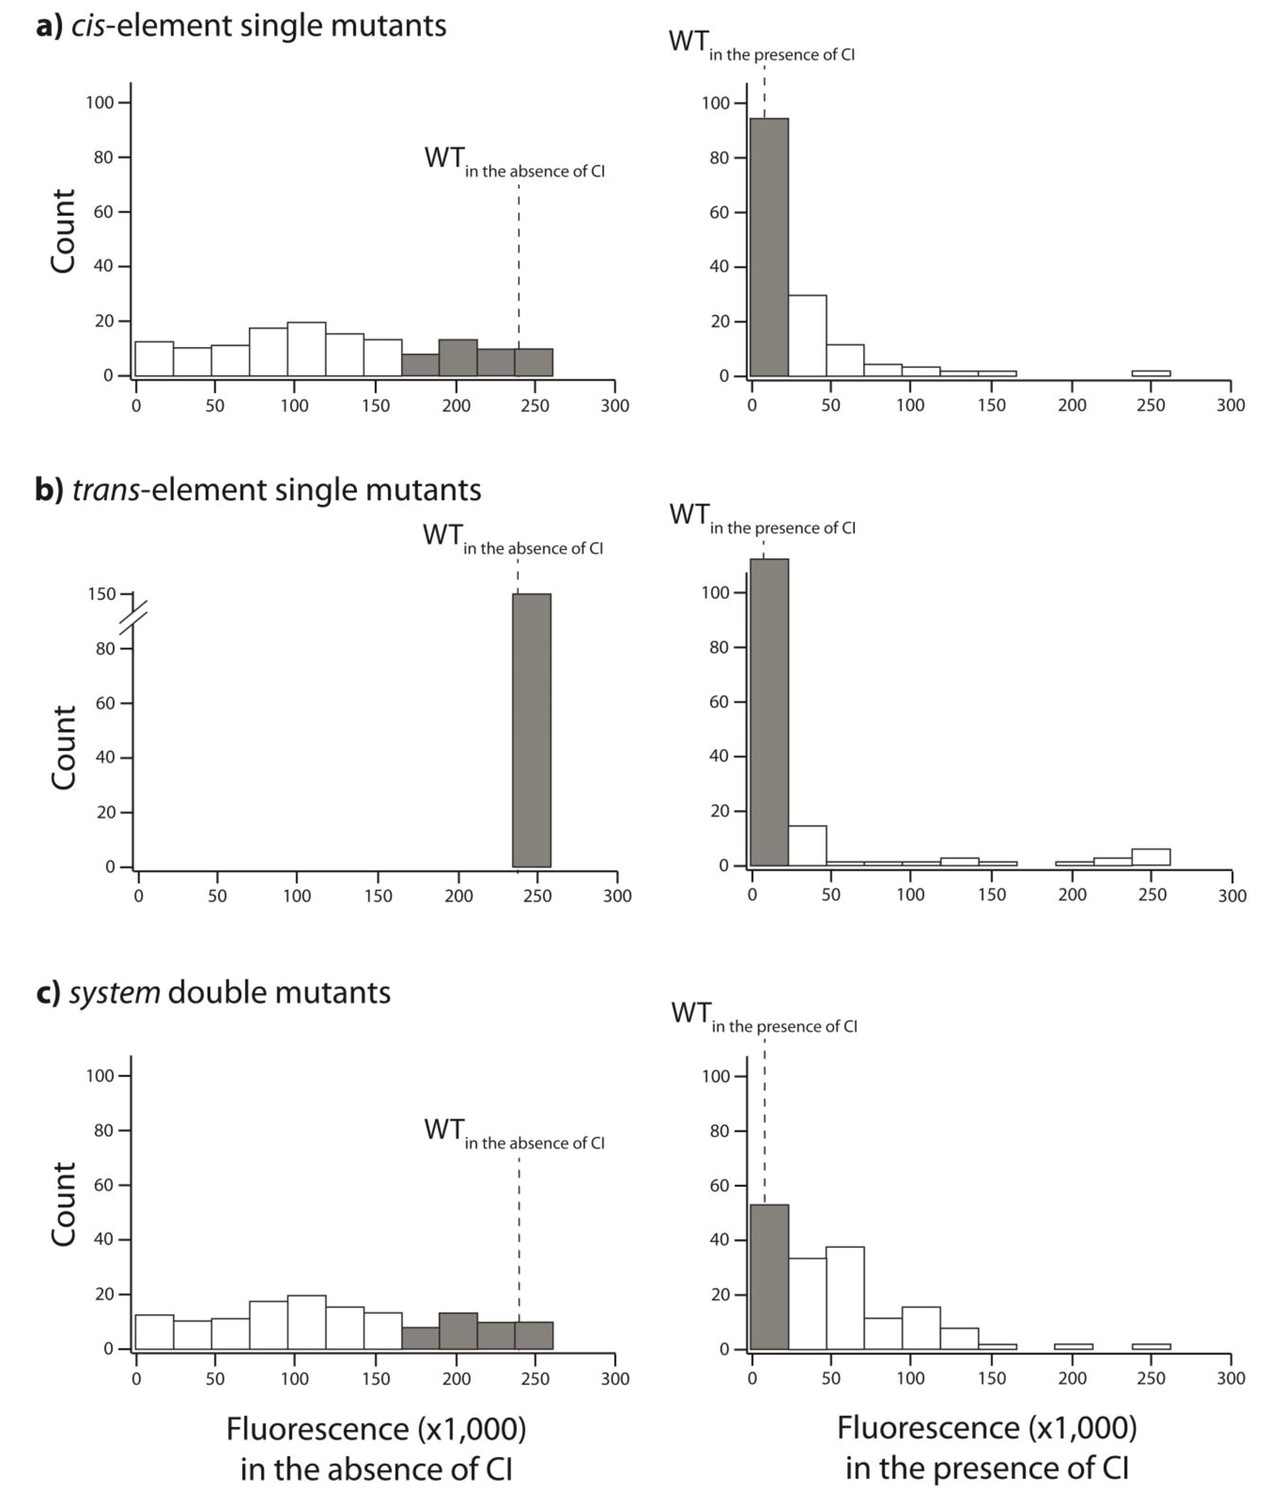
Distribution of single mutation effects in 150 random system double mutants and their corresponding single mutants.
We created 150 random unique double mutants, with one point mutation in the cis- and the other in the trans-element. We measured gene expression of each mutant at a population level in a plate reader. Histogram of expression levels in the absence and in the presence of CI are shown for: (A) point mutations in cis; (B) point mutations in trans; (C) double mutants in the system. Dotted line represents mean wildtype fluorescence in the corresponding environment. Six replicates of each mutant were measured. Grey bars indicate mutants that were not significantly different from the wildtype. The data underlying this figure are shown in Figure 3—source data 2. The data from this library are used to calculate epistasis shown in Figure 3.
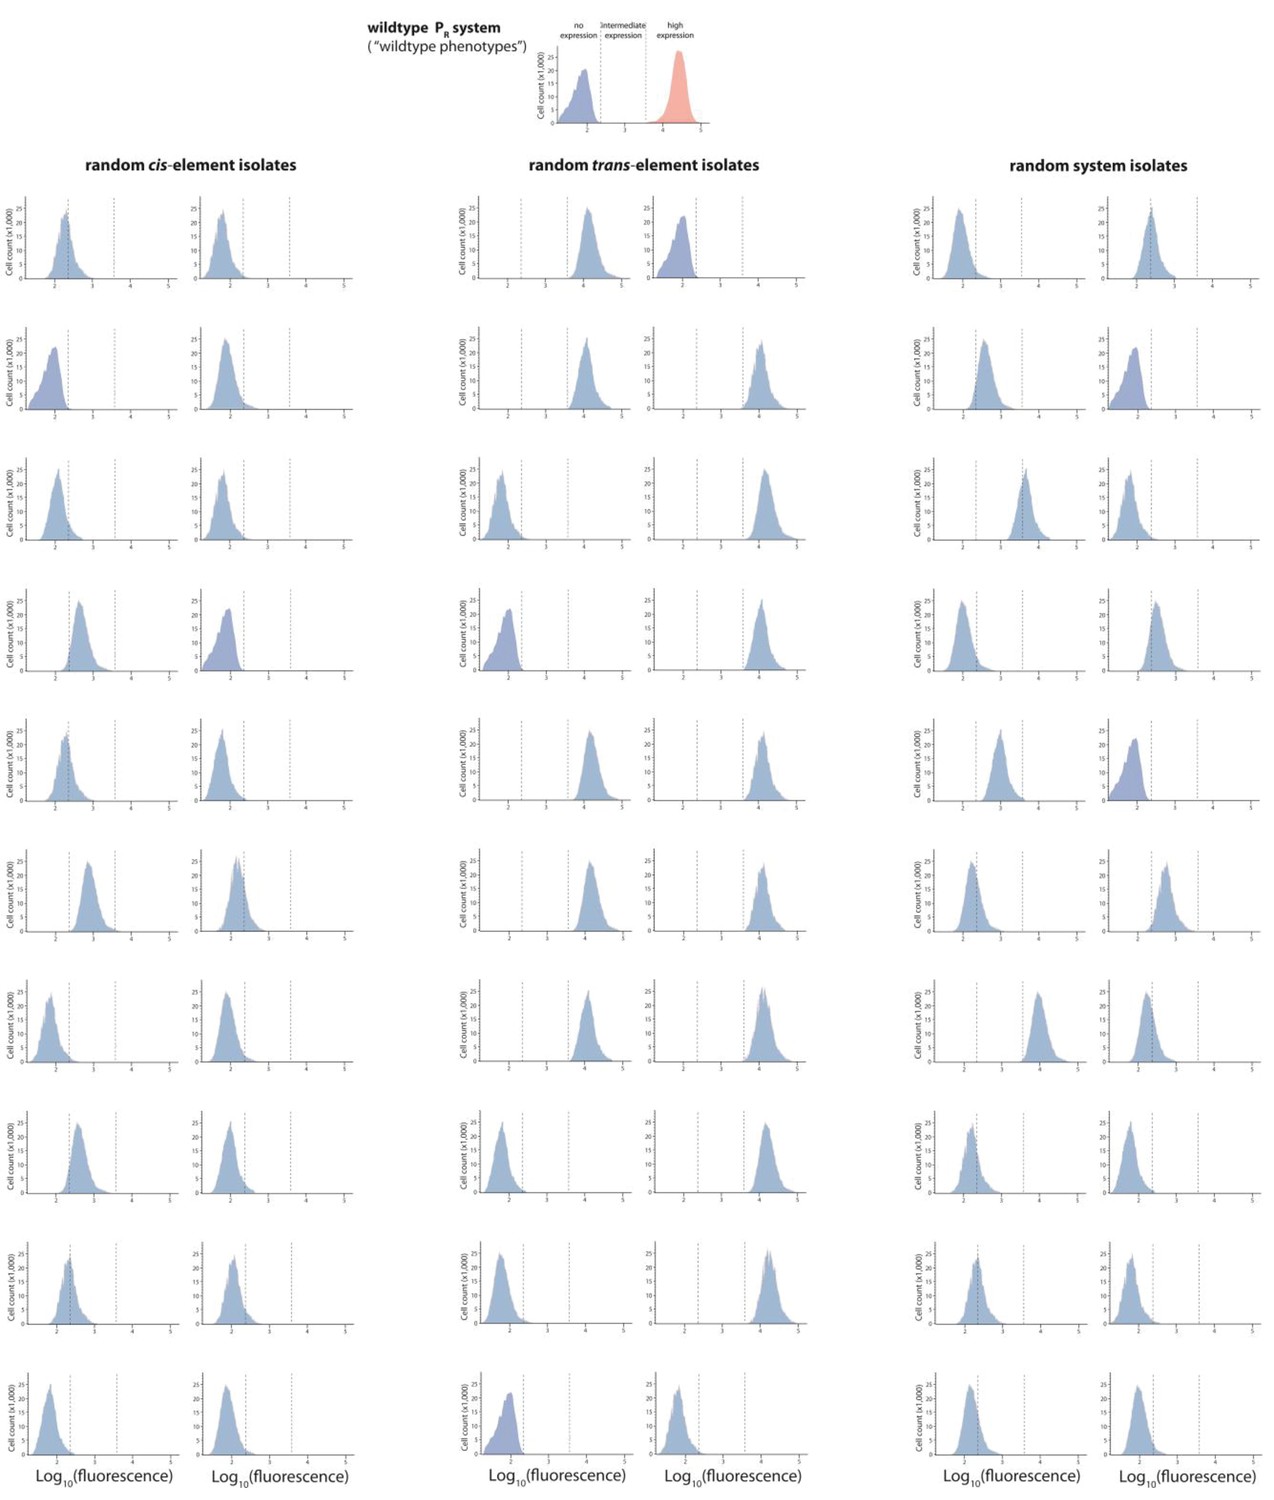
Figure 2—figure supplement 3
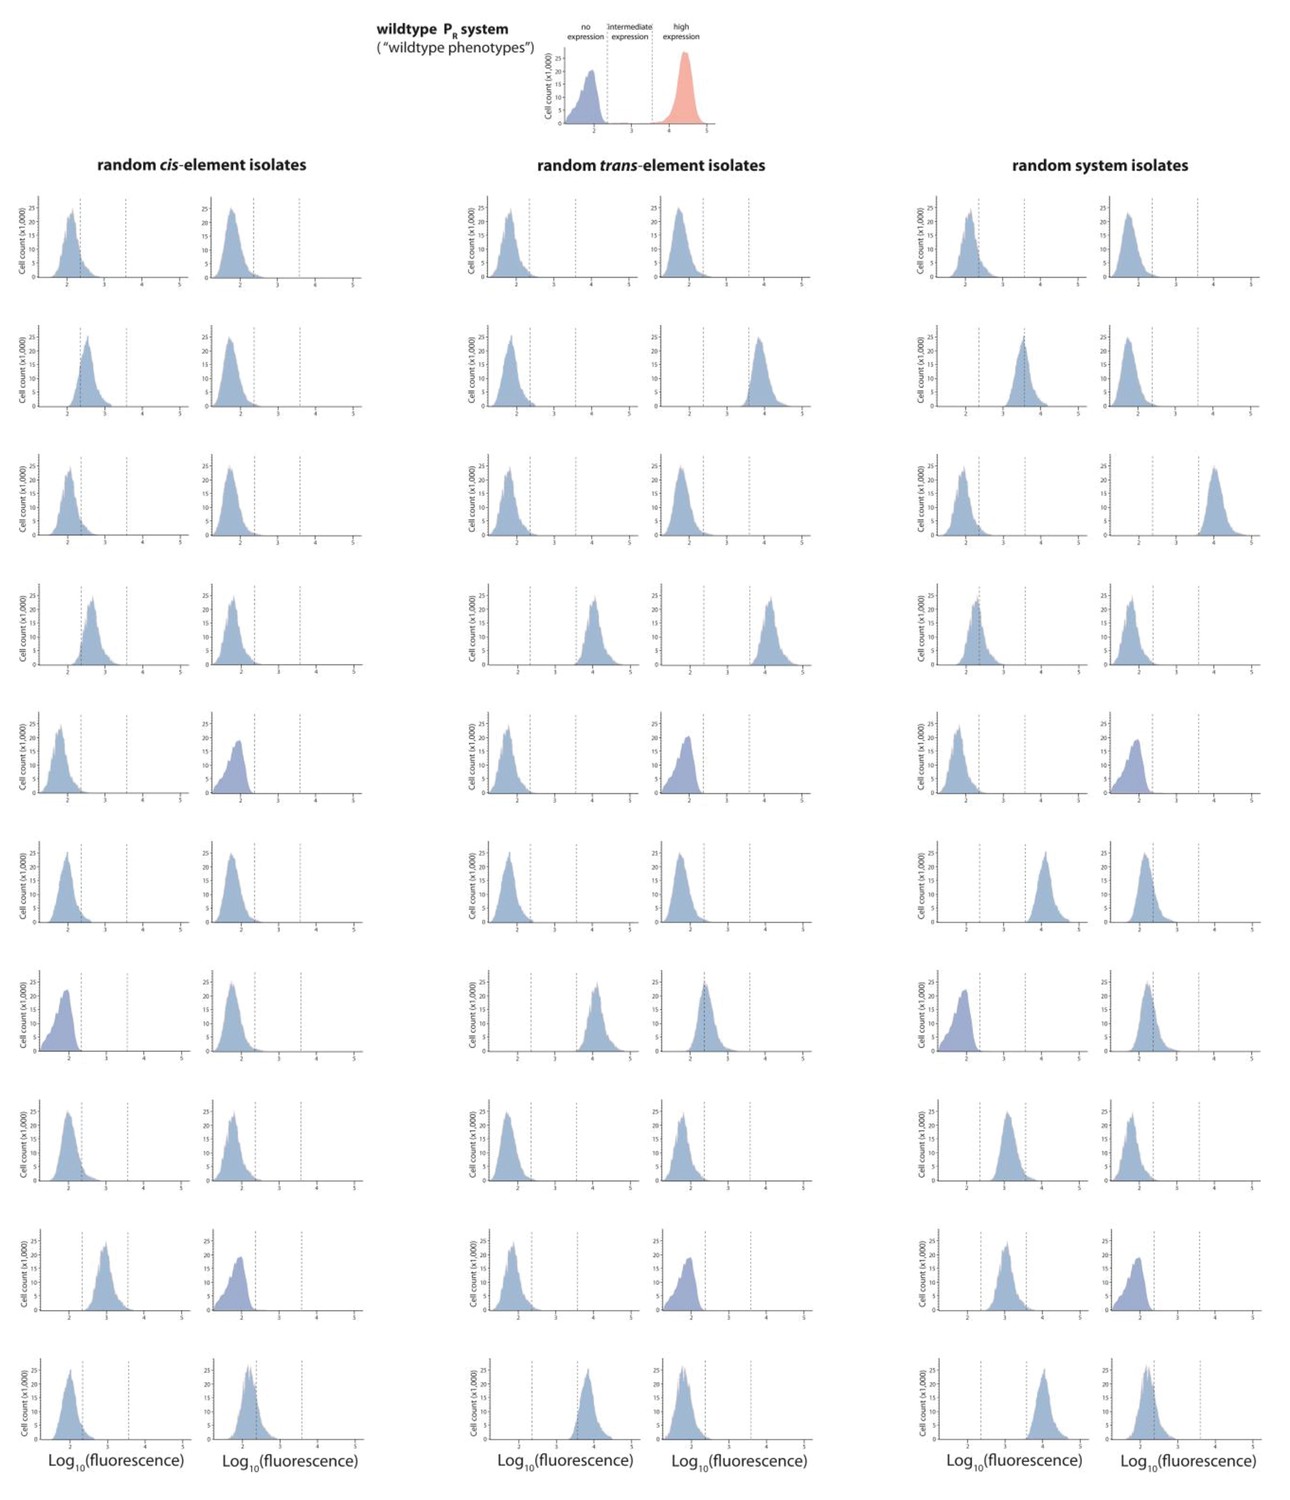
Mutant isolates from the low mutation probability libraries.
Twenty mutants were arbitrarily isolated from the cis, the trans, and the system library, and the expression of two replicates of each isolate in the presence of CI was measured for 100,000 individuals in the flow cytometer. From these measurements, we calculated the gene expression noise for each isolate (Figure 2—source data 1). Each histogram shows the combined distribution based on two replicate measurements, for each mutant isolate. The top histogram shows the monoclonal wildtype distribution in the absence (red) and in the presence (blue) of CI.
Figure 2—figure supplement 4
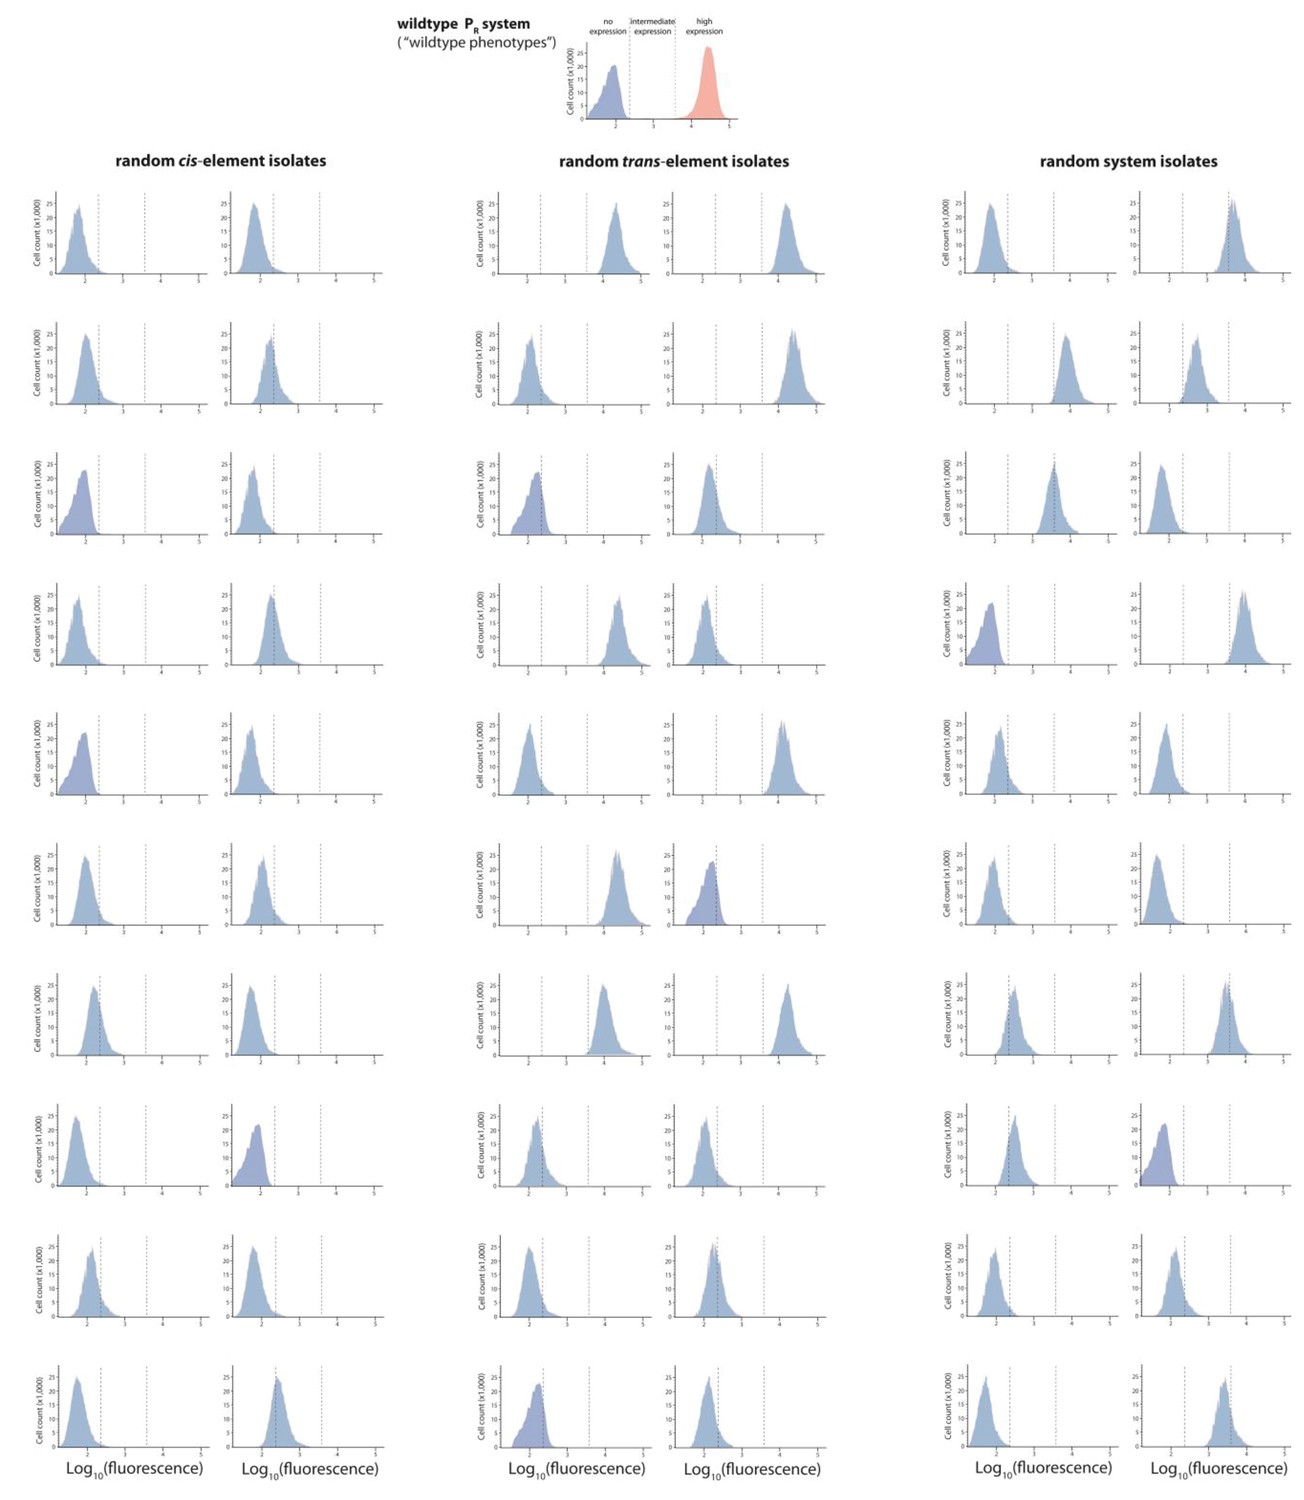
Mutant isolates from the intermediate mutation probability libraries.
Twenty mutants were arbitrarily isolated from the cis, the trans, and the system library, and the expression of two replicates of each isolate in the presence of CI was measured for 100,000 individuals in the flow cytometer. From these measurements, we calculated the gene expression noise for each isolate (Figure 2—source data 1). Each histogram shows the combined distribution based on two replicate measurements, for each mutant isolate. The top histogram shows the monoclonal wildtype distribution in the absence (red) and in the presence (blue) of CI.
Figure 2—figure supplement 5
Mutant isolates from the high mutation probability libraries.
Twenty mutants were arbitrarily isolated from the cis, the trans, and the system library, and the expression of two replicates of each isolate in the presence of CI was measured for 100,000 individuals in the flow cytometer. From these measurements, we calculated the gene expression noise for each isolate (Figure 2—source data 1). Each histogram shows the combined distribution based on two replicate measurements, for each mutant isolate. The top histogram shows the monoclonal wildtype distribution in the absence (red) and in the presence (blue) of CI.
Figure 2—figure supplement 6
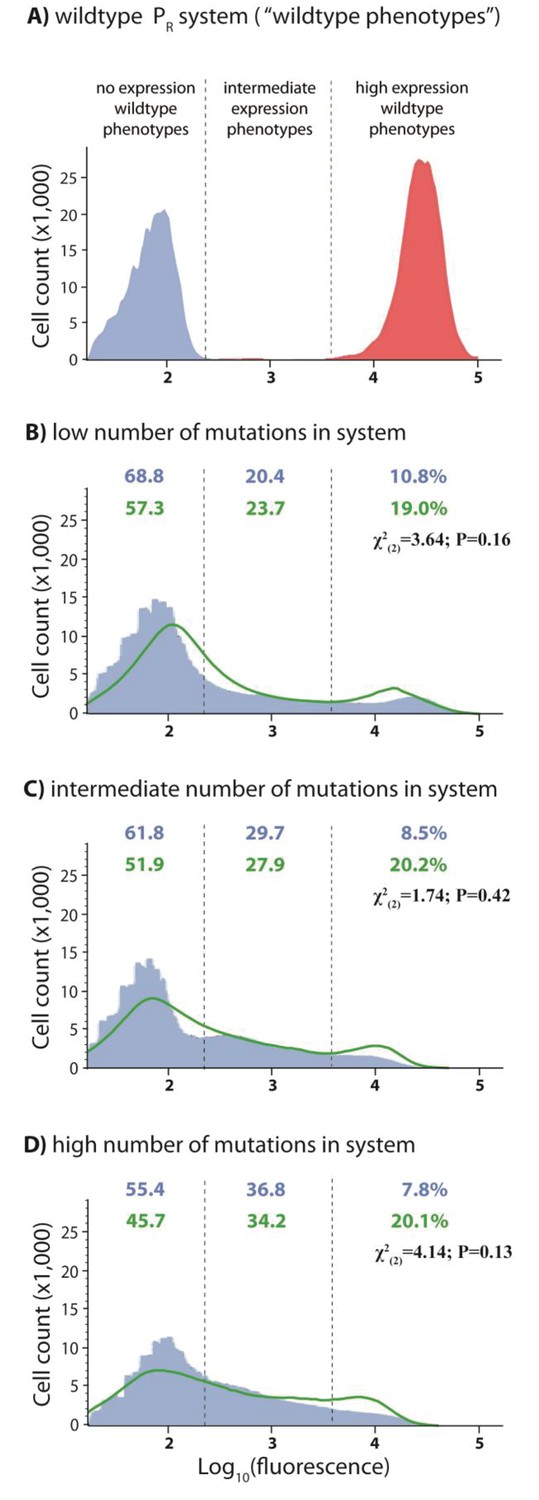
Mathematical predictions that account for the genetic regulatory structure accurately describe the system DME.
(A) Distribution of the monoclonal wildtype population in the absence (red) and in the presence of CI (blue). (B) Low, (C) Intermediate, and (D) High mutation probability system mutant libraries. Shown in green are the convolutions that accounted for the effects of cis mutations in the absence of CI (Figure 2—figure supplement 1). Frequencies of mutants in the three categories (‘no’, ‘intermediate’, and ‘high’ expression phenotypes) for the observed system DME are shown in blue, while those from the convolution are shown in green. Pearson’s Chi-squared statistic and the associated p value used to test for the differences between the observed and the predicted frequencies of mutants in the three categories are shown for each mutations probability.
Figure 2—figure supplement 7
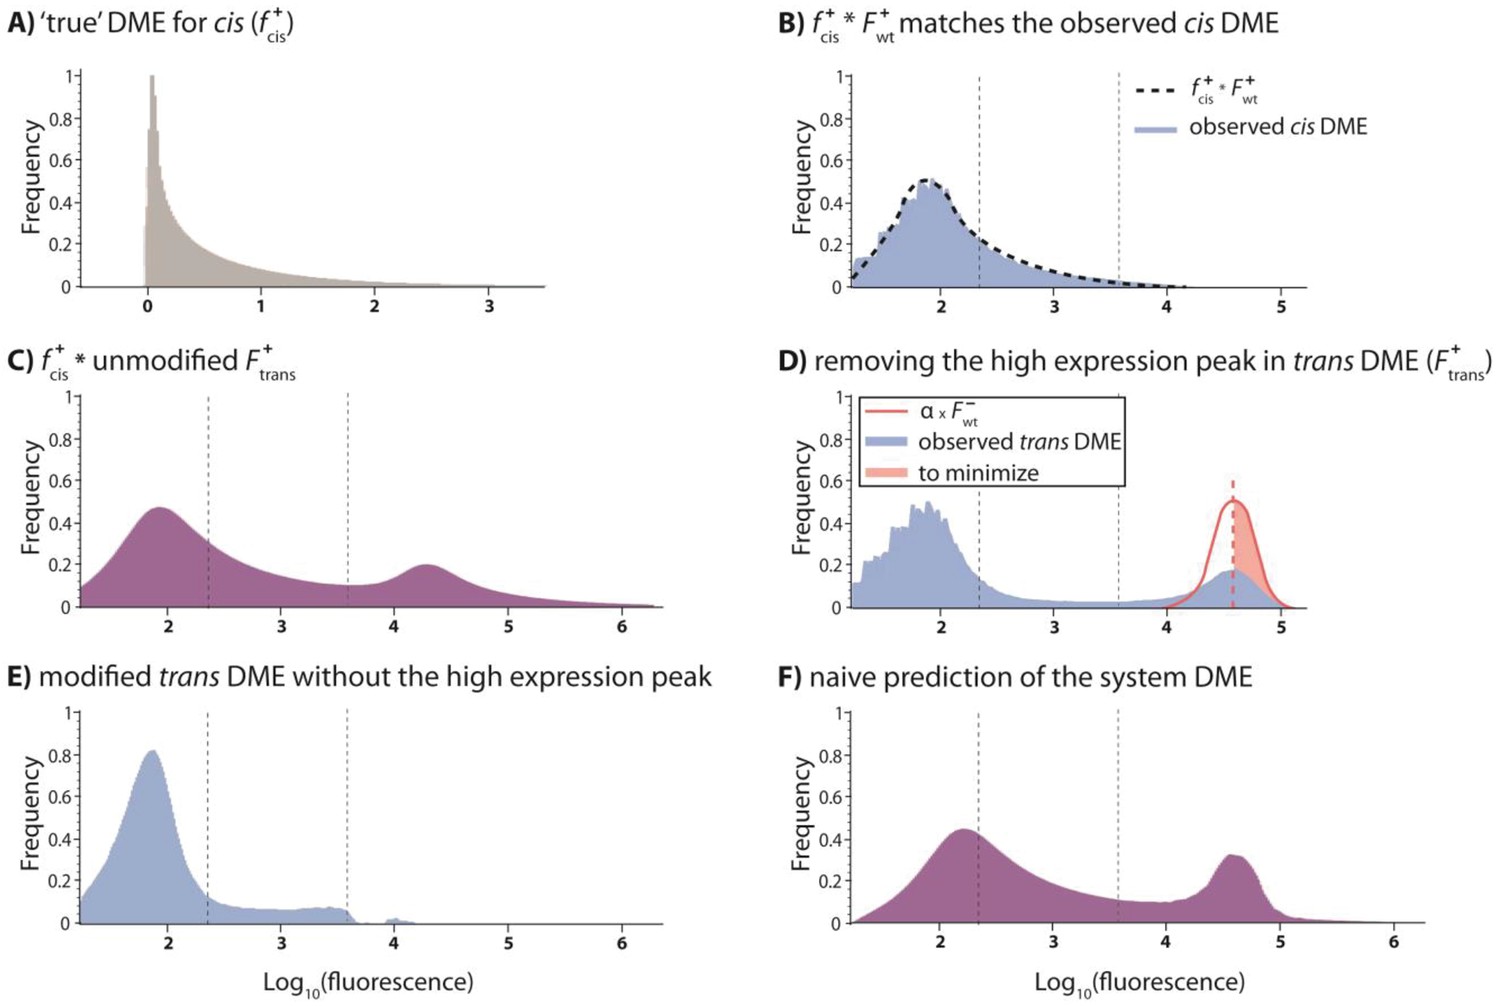
Predicting the system DME based on convolving component DMEs.
We attempted to predict the DME for the system by convolving the corresponding DMEs of cis and trans components. To do this, we convolved the ‘true’ cis distribution (fcis) with the observed trans distribution (Ftrans). Here, we use low mutation probability trans and high mutation probability cis libraries to illustrate the procedure. (A) The ‘reverse engineered’ true cis distribution (fcis), shows how the mutations in the cis-element alter wildtype expression levels. (B) The specific fcis was chosen so to minimize the difference between the observed cis-element DME and the convolution between fcis and the observed wildtype distribution in the presence of CI (F+wt). (C) Convolving fcis with unmodified Ftrans gives a predicted system DME with values outside the biologically meaningful range. (D) In order to impose a biological limit to high expression, which is given by the wildtype expression in the absence of CI, we removed the high expression peak in the observed trans DME. This was done by fitting a fraction of the wildtype distribution in the absence of CI (α) to minimize its (square) difference to the right-hand part of the high-expression trans peak (red shaded area). (E) Modified trans DME after removing high expression phenotypes. (F) The naïve convolution prediction for the system DME is obtained by convolving fcis with the modified trans DME, and then adding back a corresponding amount of the high-expression wildtype distribution in the absence of CI. When convolving with the knowledge of the underlying genetic regulatory structure, we add back the cis DME in the absence of CI (modified by the scaling factor α). Here, the ‘naïve’ prediction is shown.
Figure 3 with 6 supplements
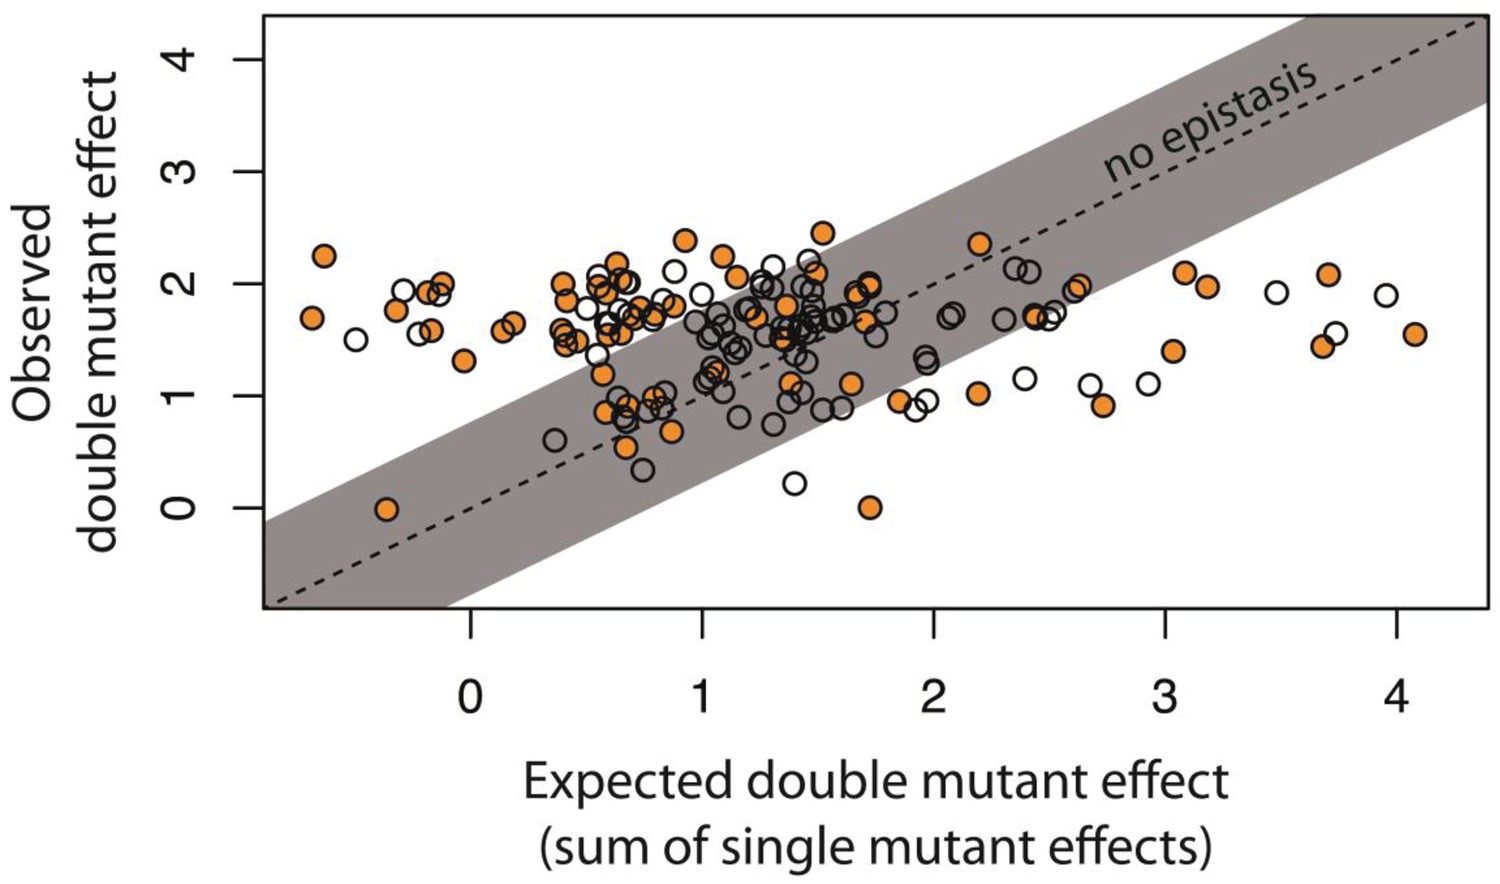
Epistasis in 150 random system double mutants.
We created 150 double mutants with one unique random point mutation in the cis- and the other in the trans-element (Figure 3—figure supplement 1; Figure 3—source data 1). In a plate reader, we measured expression levels of monoclonal populations of each double mutant and its constitutive single mutants in the presence of CI. Epistasis was estimated as the deviation of the observed double mutant effect from the additive expectation based on single mutant effects (shown for each double mutant in Figure 3—figure supplement 2). The grey bar indicates measurements that are not in significant epistasis. Double mutants above the ‘no epistasis’ line are in positive epistasis (observed double mutant effect is greater than the additive expectation), and those below are in negative epistasis. Distributions of mutational effects for single cis and trans mutants, as well as for the double system mutants are shown in Figure 2—figure supplement 2, while the data for epistasis calculations are shown in Figure 3—source data 2. By measuring expression levels of 60 random double mutants (shown in orange) and their constitutive single mutants in the flow cytometer, we confirmed that estimates of epistasis using the plate reader correspond to those based on flow cytometry measurements (Figure 3—figure supplement 6; Source Data 3), and that the noise of expression is constant for all mutants (Figure 3—figure supplements 3, 4 and 5; Source Data 4).
-
Figure 3—source data 1
Identity and location of mutations in the 150 random double mutant library.
- https://doi.org/10.7554/eLife.28921.023
-
Figure 3—source data 2
Calculating epistasis from the effects of 150 random double mutants and their corresponding single point mutations, measured in plate reader.
The data provided here are shown in Figure 3, Figure 2—figure supplement 2, and Figure 3—figure supplement 1.
- https://doi.org/10.7554/eLife.28921.024
-
Figure 3—source data 3
Gene expression noise in single and double mutants is constant.
Flow cytometry data obtained for 60 double mutants and their corresponding single mutants, in the absence and in the presence of CI, was used to quantify gene expression noise. The data provided here are shown in Figure 3—figure supplements 2, 3 and 4.
- https://doi.org/10.7554/eLife.28921.025
-
Figure 3—source data 4
Calculating epistasis from the effects of 60 random double mutants and their corresponding single point mutations, measured in flow cytometer.
The data provided here are shown in Figure 3—figure supplement 1.
- https://doi.org/10.7554/eLife.28921.026
Figure 3—figure supplement 1

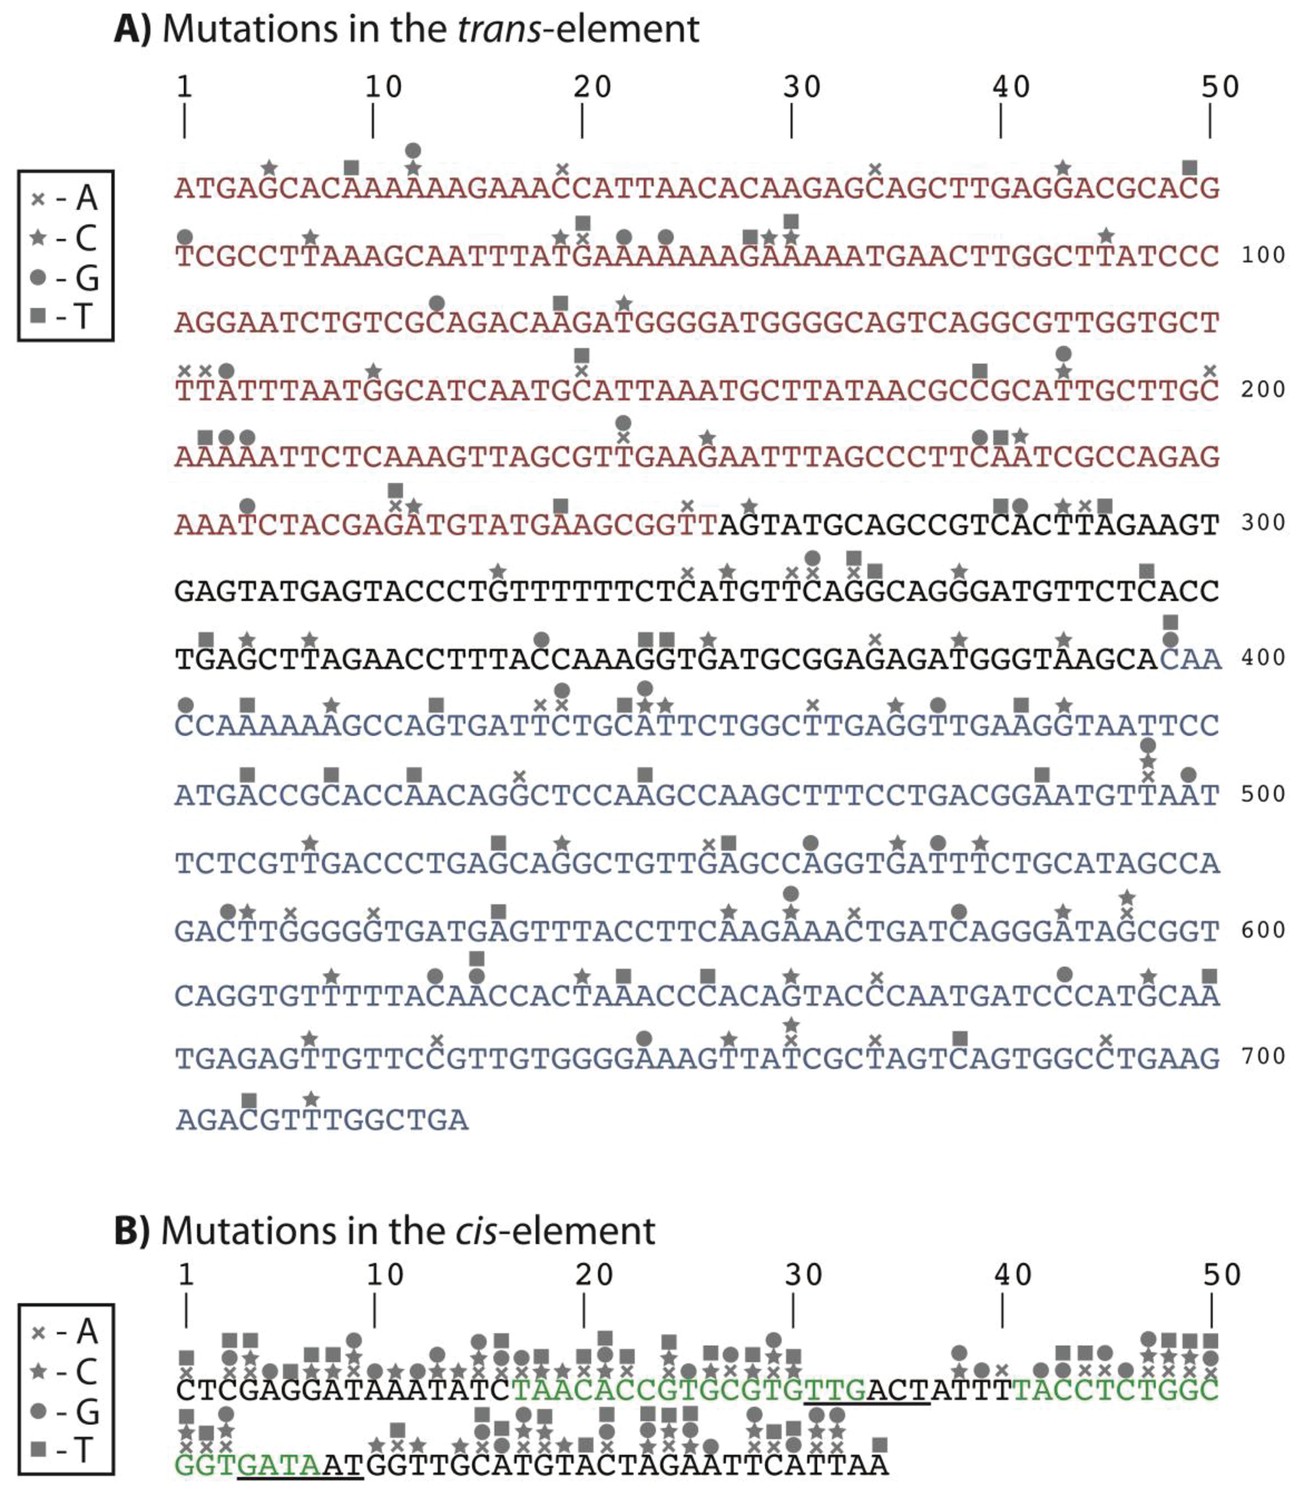
Identity and location of mutations in the 150 random double mutant library.
(A) DNA sequence of the trans-element showing the N-Terminal Domain (red), C-Terminal Domain (blue), and the linker region connecting the two domains (black). (B) DNA sequence of the cis-element showing the −35 and −10 RNAP recognition sites (from left to right, underlined), and the two CI repressor operators (green). Every point mutation in cis was randomly paired with each mutation in trans, to give rise to 150 unique double mutants.
Figure 3—figure supplement 2
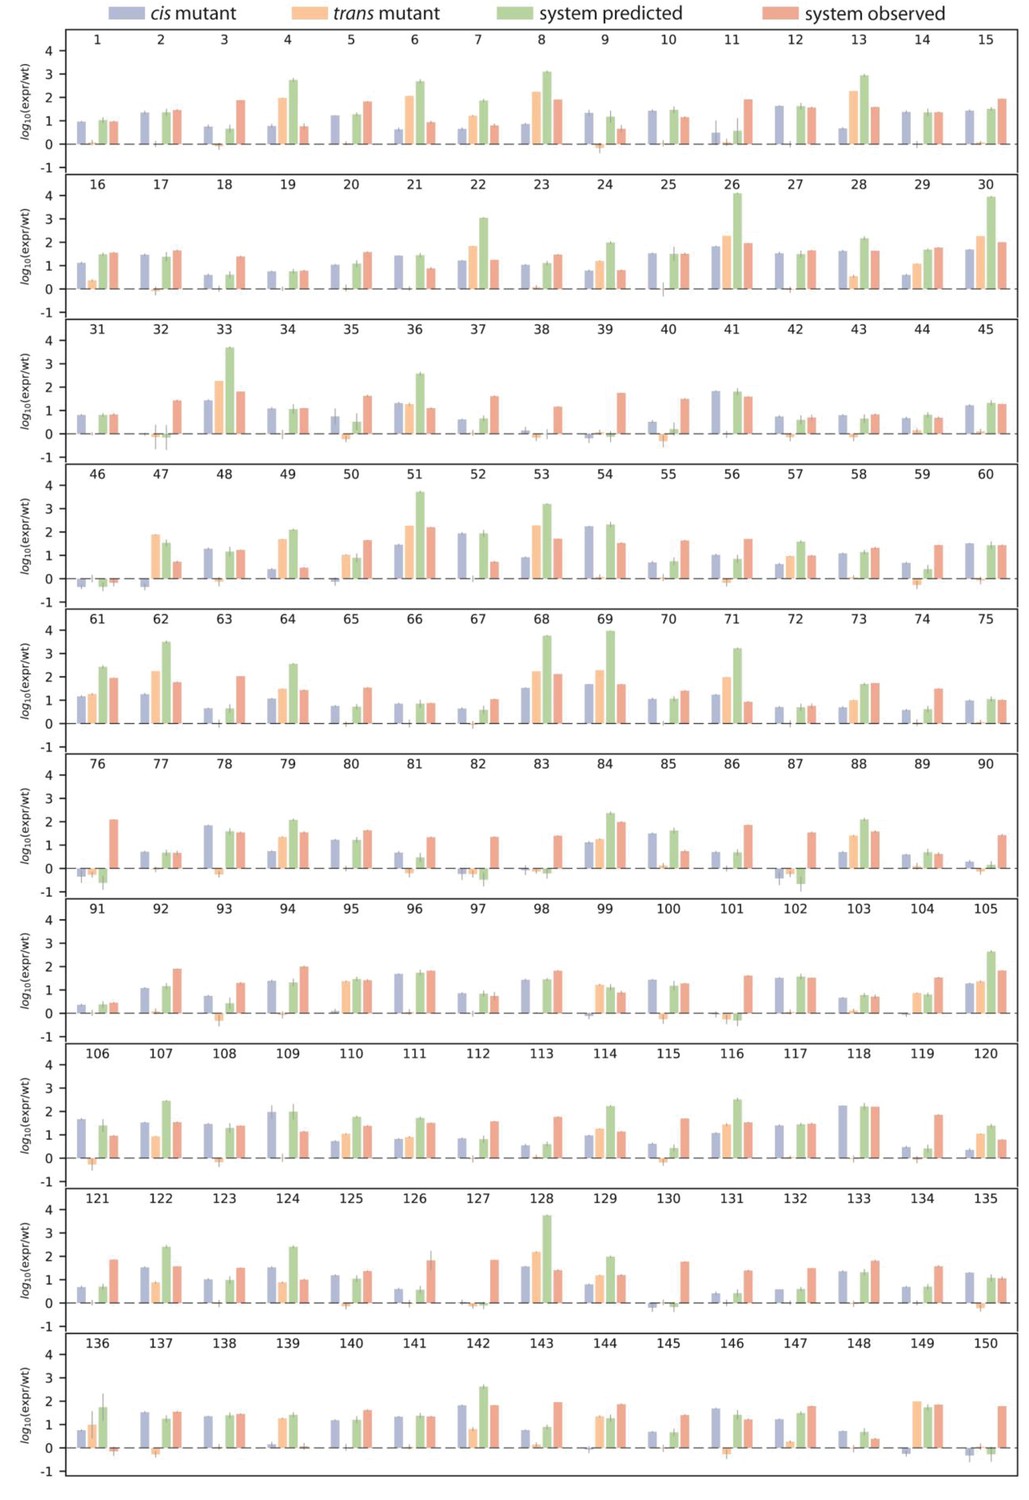
Single mutant effects, as well as predicted and observed double mutant effects.
Bar charts show log10 of wildtype-normalized expression levels for (i) measured single mutant effect in the cis- (blue) and (ii) the trans-element (orange); (iii) predicted double system mutant expression based on single mutant effects (green), and (iv) observed double system mutant effect, for each double mutant. Numbers above the bar charts indicate double mutant identity, which correspond to Figure 3—source data 1. Dashed line indicates same expression as the wildtype.
Figure 3—figure supplement 3
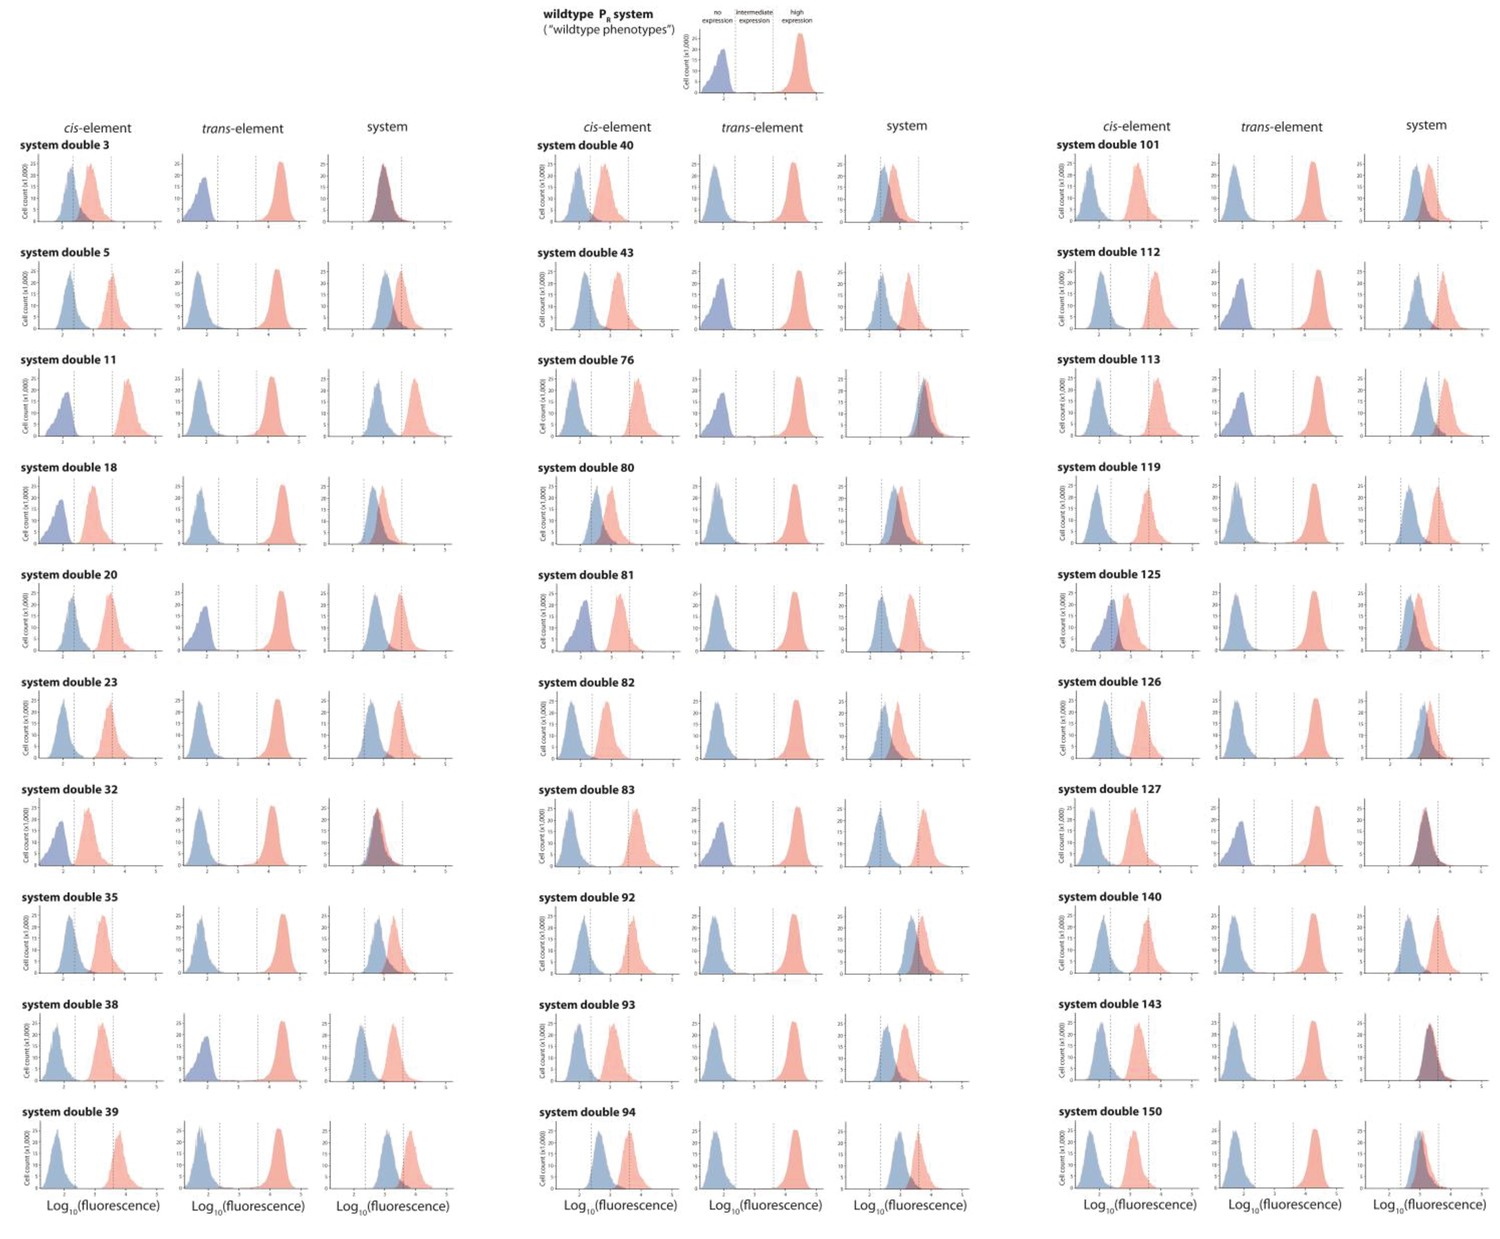
30 double mutants with their corresponding single mutants, which are in significant positive epistasis.
From the library of 150 mutants shown in Figures 3 and 30 double mutants that were in significant positive epistasis were randomly selected. Expression levels of two replicates of each double mutant, as well as its corresponding single mutants, in the absence and in the presence of CI were measured for 100,000 individuals in the flow cytometer. Each panel shows the combined distribution based on two replicate measurements, for each mutant, in the absence (red) and in the presence (blue) of CI. From these measurements, we calculated gene expression noise for each isolate (Figure 3—source data 3), as well as epistasis (Figure 3—figure supplement 2; Figure 3—source data 4). The top histogram shows the monoclonal wildtype distribution in the absence (red) and in the presence (blue) of CI.
Figure 3—figure supplement 4
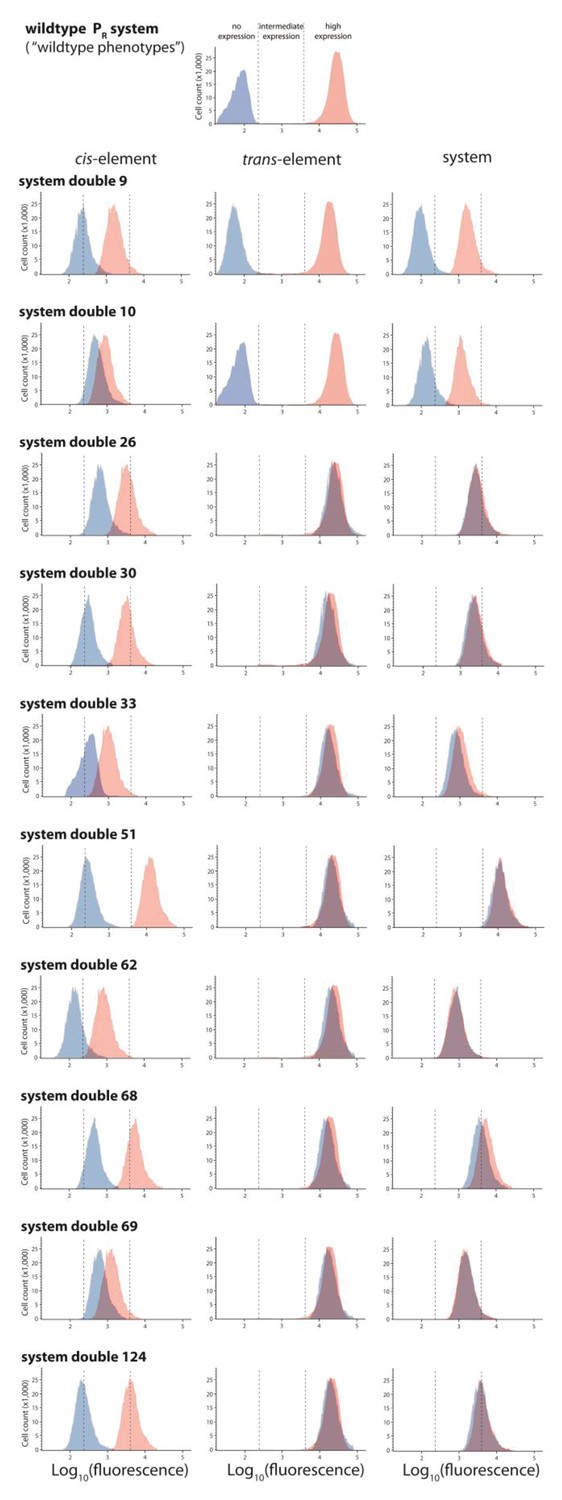
Ten double mutants with their corresponding single mutants, which are in significant negative epistasis.
From the library of 150 mutants shown in Figures 3 and 10 double mutants that were in significant negative epistasis were randomly selected. Expression levels of two replicates of each double mutant, as well as its corresponding single mutants, in the absence and in the presence of CI were measured for 100,000 individuals in the flow cytometer. Each panel shows the combined distribution based on two replicate measurements, for each mutant, in the absence (red) and in the presence (blue) of CI. From these measurements, we calculated gene expression noise for each isolate (Figure 3—source data 3), as well as epistasis (Figure 3—figure supplement 2; Figure 3—source data 4). The top histogram shows the monoclonal wildtype distribution in the absence (red) and in the presence (blue) of CI.
Figure 3—figure supplement 5
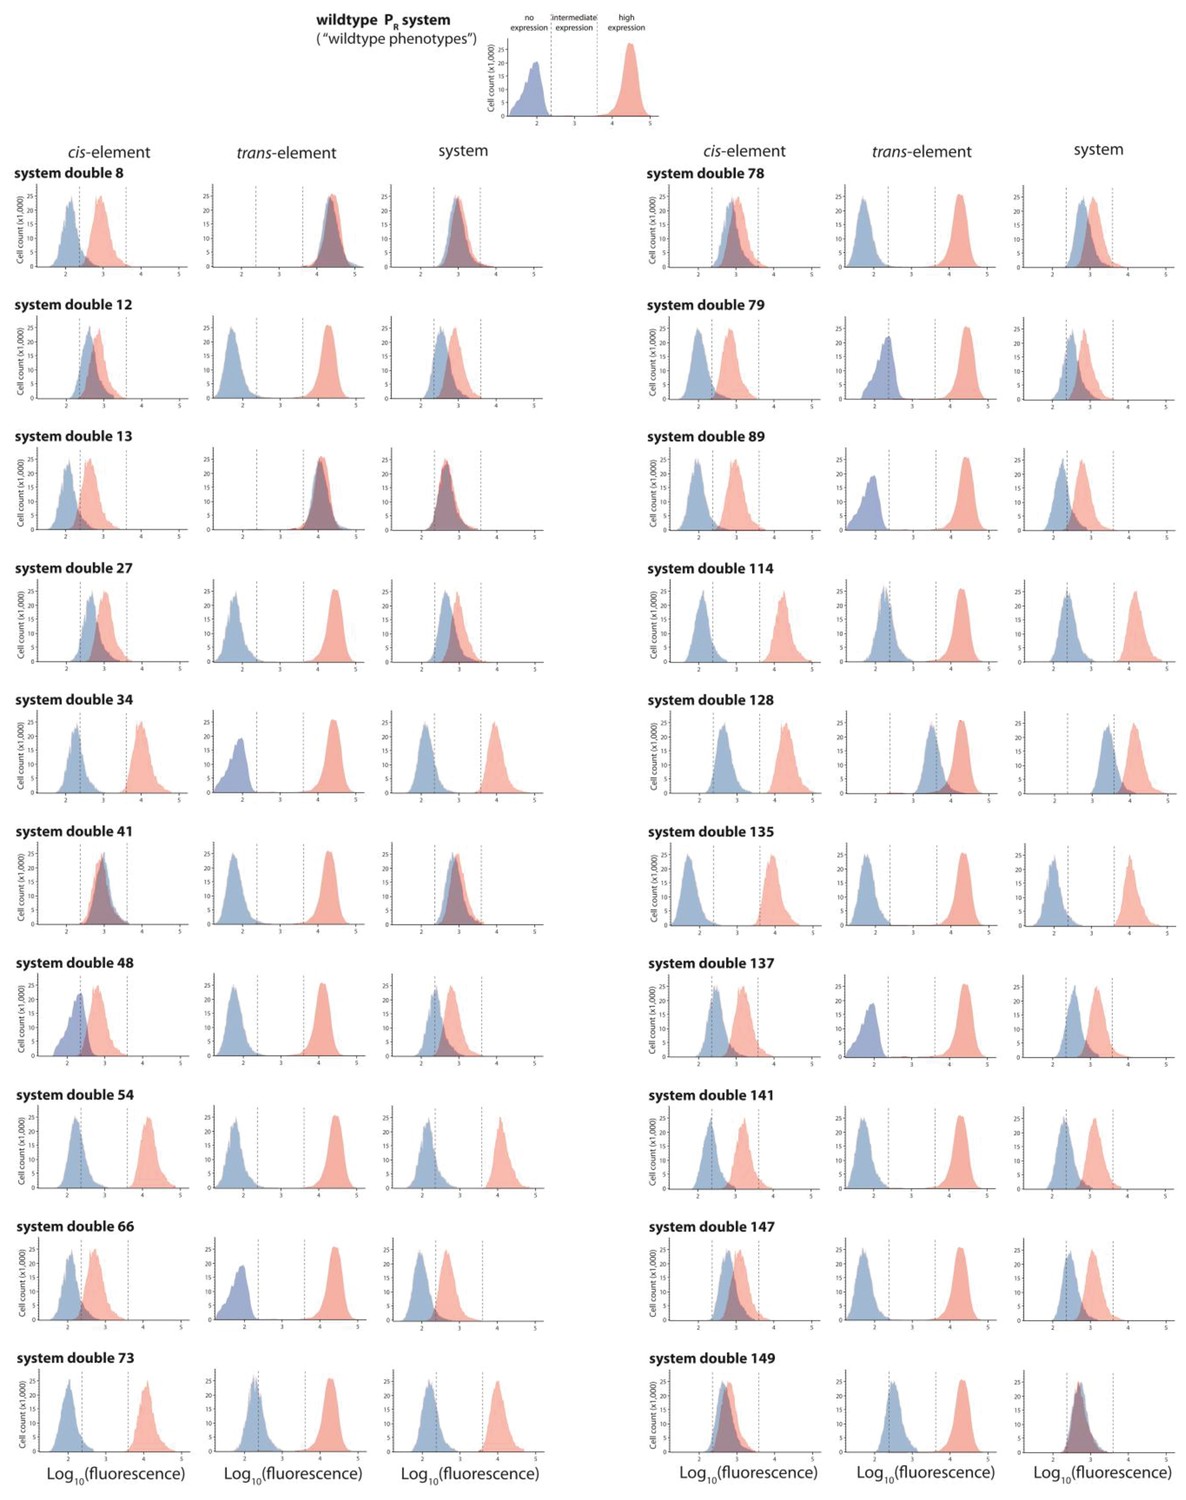
Twenty double mutants with their corresponding single mutants, which are not in significant epistasis.
From the library of 150 mutants shown in Figures 3 and 20 double mutants that were not in significant epistasis were randomly selected. Expression levels of two replicates of each double mutant, as well as its corresponding single mutants, in the absence and in the presence of CI were measured for 100,000 individuals in the flow cytometer. Each panel shows the combined distribution based on two replicate measurements, for each mutant, in the absence (red) and in the presence (blue) of CI. From these measurements, we calculated gene expression noise for each isolate (Figure 3—source data 3), as well as epistasis (Figure 3—figure supplement 2; Figure 3—source data 4). The top histogram shows the monoclonal wildtype distribution in the absence (red) and in the presence (blue) of CI.
Figure 3—figure supplement 6
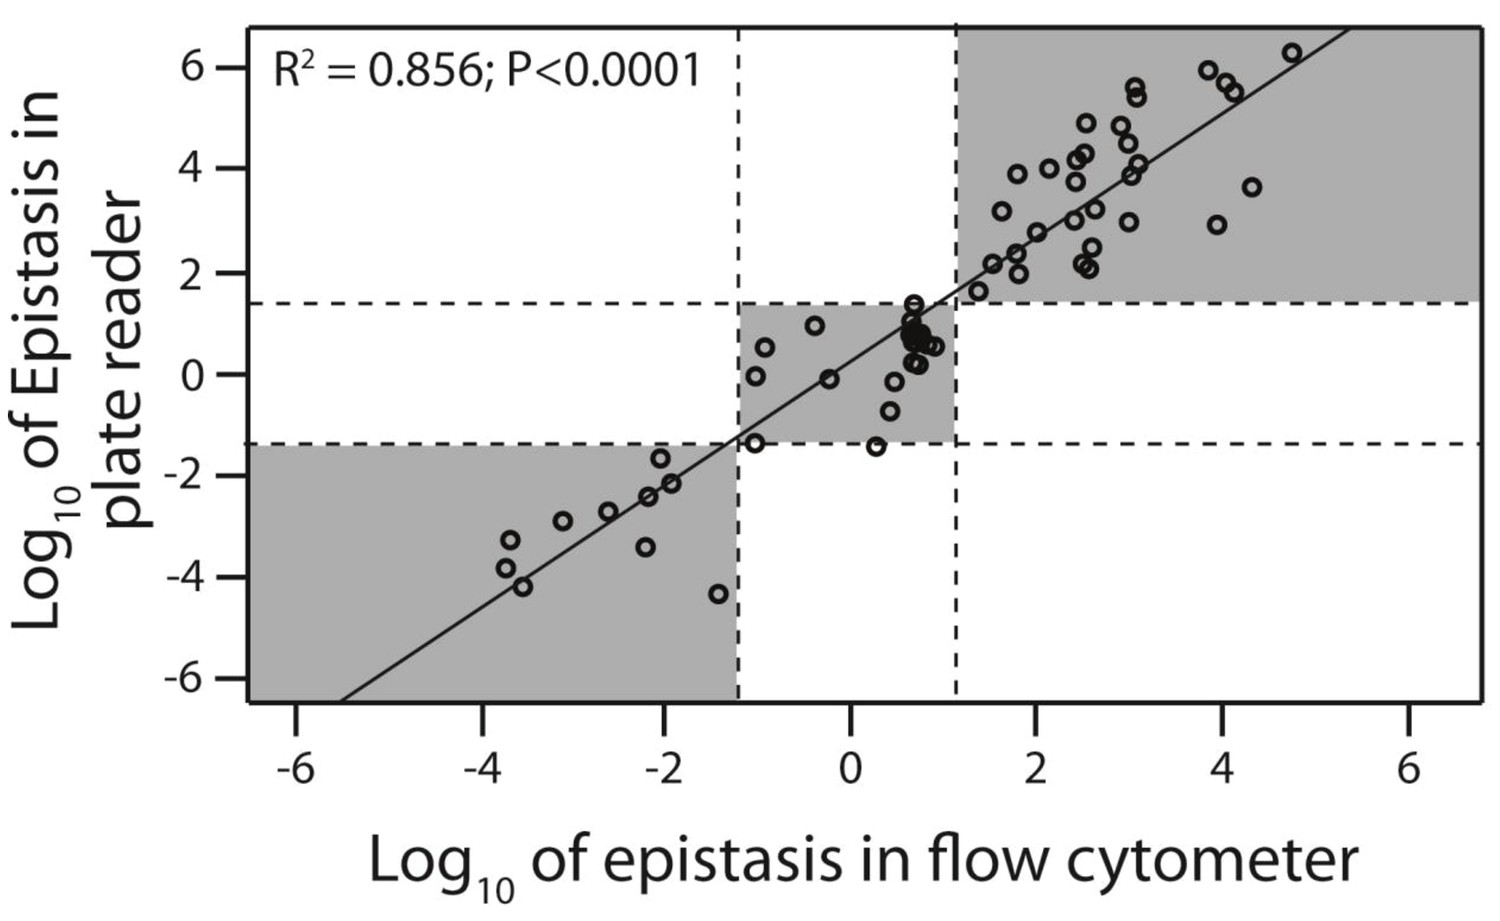
Flow cytometer and plate reader measurements give equivalent estimates of epistasis.
Epistasis was calculated as the deviation of the double mutant effect from the additive prediction based on single mutant effects. From the original 150 double mutants measured in the plate reader, 30 that were in significant positive, 10 in significant negative, and 20 that were not in significant epistasis were selected (shown in orange in Figure 3). Epistasis for these 60 mutants was calculated based on mean fluorescence and standard deviation (gene expression noise) obtained through flow cytometry measurements of 200,000 individuals (Figure 3—figure supplement 3;4;5). Linear regression was performed to test for correlation between two experimental approaches to calculating epistasis. Dotted lines are the 95% confidence intervals around the no-epistasis null model (Log10(epistasis) = 0). Grey areas indicate that the two experimental methods give the same qualitative description of epistasis (positive, negative, or no significant epistasis). The data underlying this figure are shown in Figure 3—source data 2;4.
Figure 4
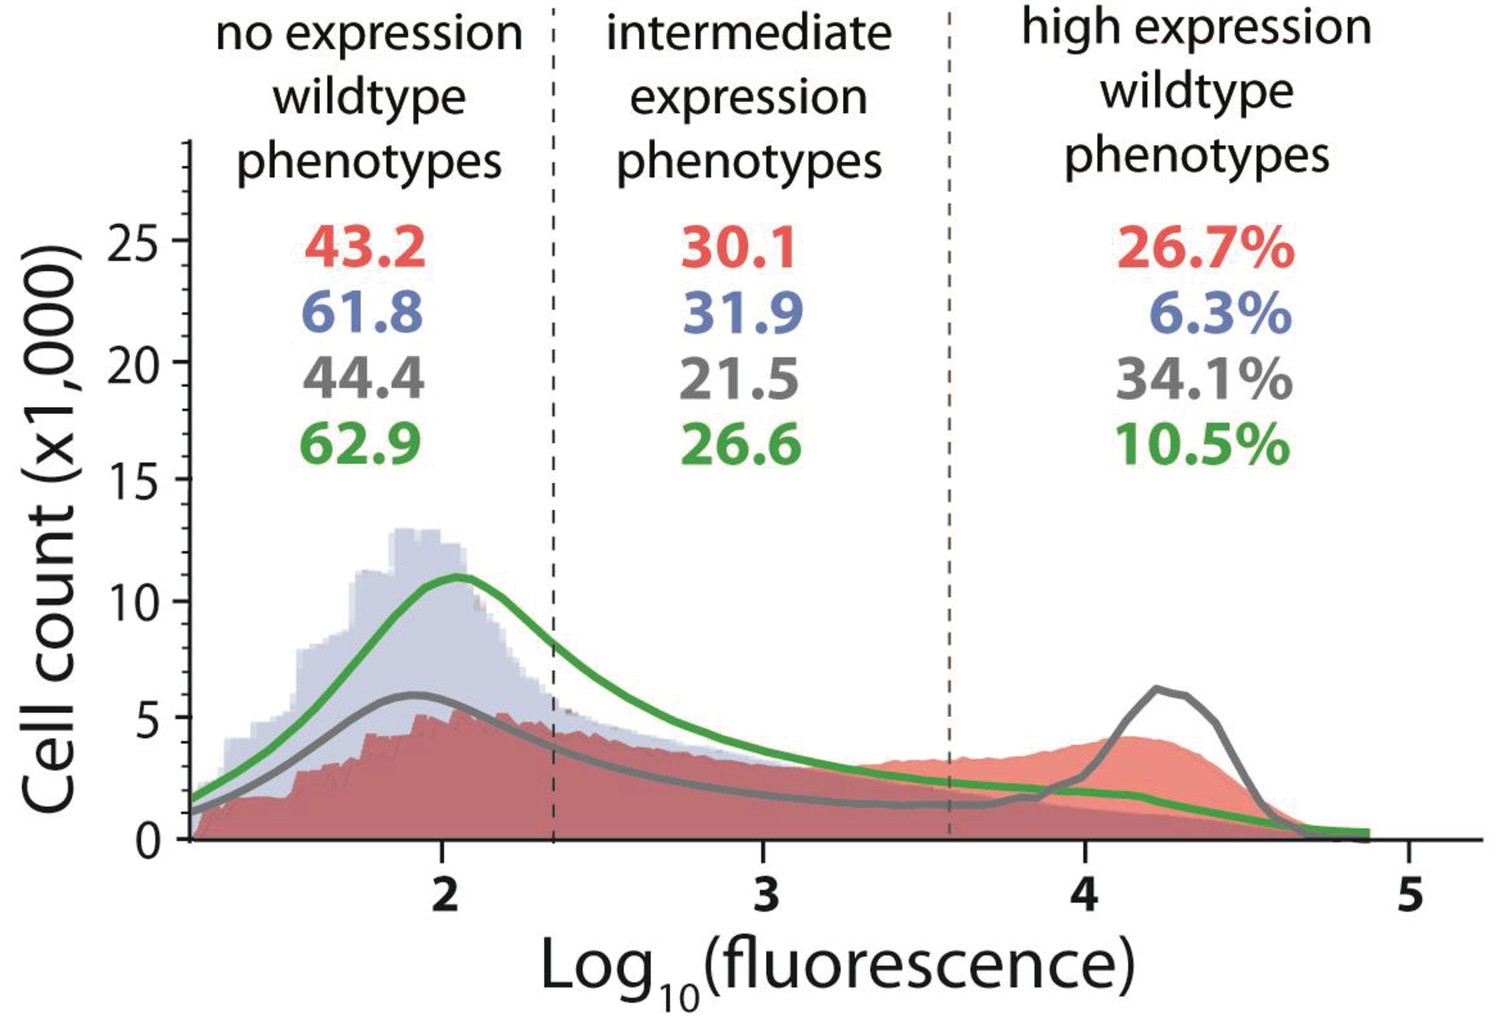
Distribution of expression phenotypes for the system with high mutation probability in the cis-element and low mutation probability in the trans-element.
The distributions of fluorescence are shown in the absence of CI (shown in red) and in the presence of CI (shown in blue). Each distribution was obtained by pooling two independent measurements of 500,000 cells. The dashed lines separate three categories of phenotypes – no expression phenotypes (corresponding to repressed wildtype); intermediate expression phenotypes; and high expression phenotypes (corresponding to the wildtype in the absence of CI). Numbers are percentage of counts in each category, in the absence (red) and in the presence (blue) of CI. The naïve convolution-predicted DME in the presence of CI, performed in the absence of any knowledge of the genetic regulatory structure of the system, is shown in grey, together with the corresponding frequencies of mutants in each category. The convolution prediction that accounted for the regulatory structure is shown in dark green. Results of the Pearson’s Chi-squared test for the differences between the observed and both types of convolution-predicted DMEs in the presence of CI are shown in Table 2.
Figure 5
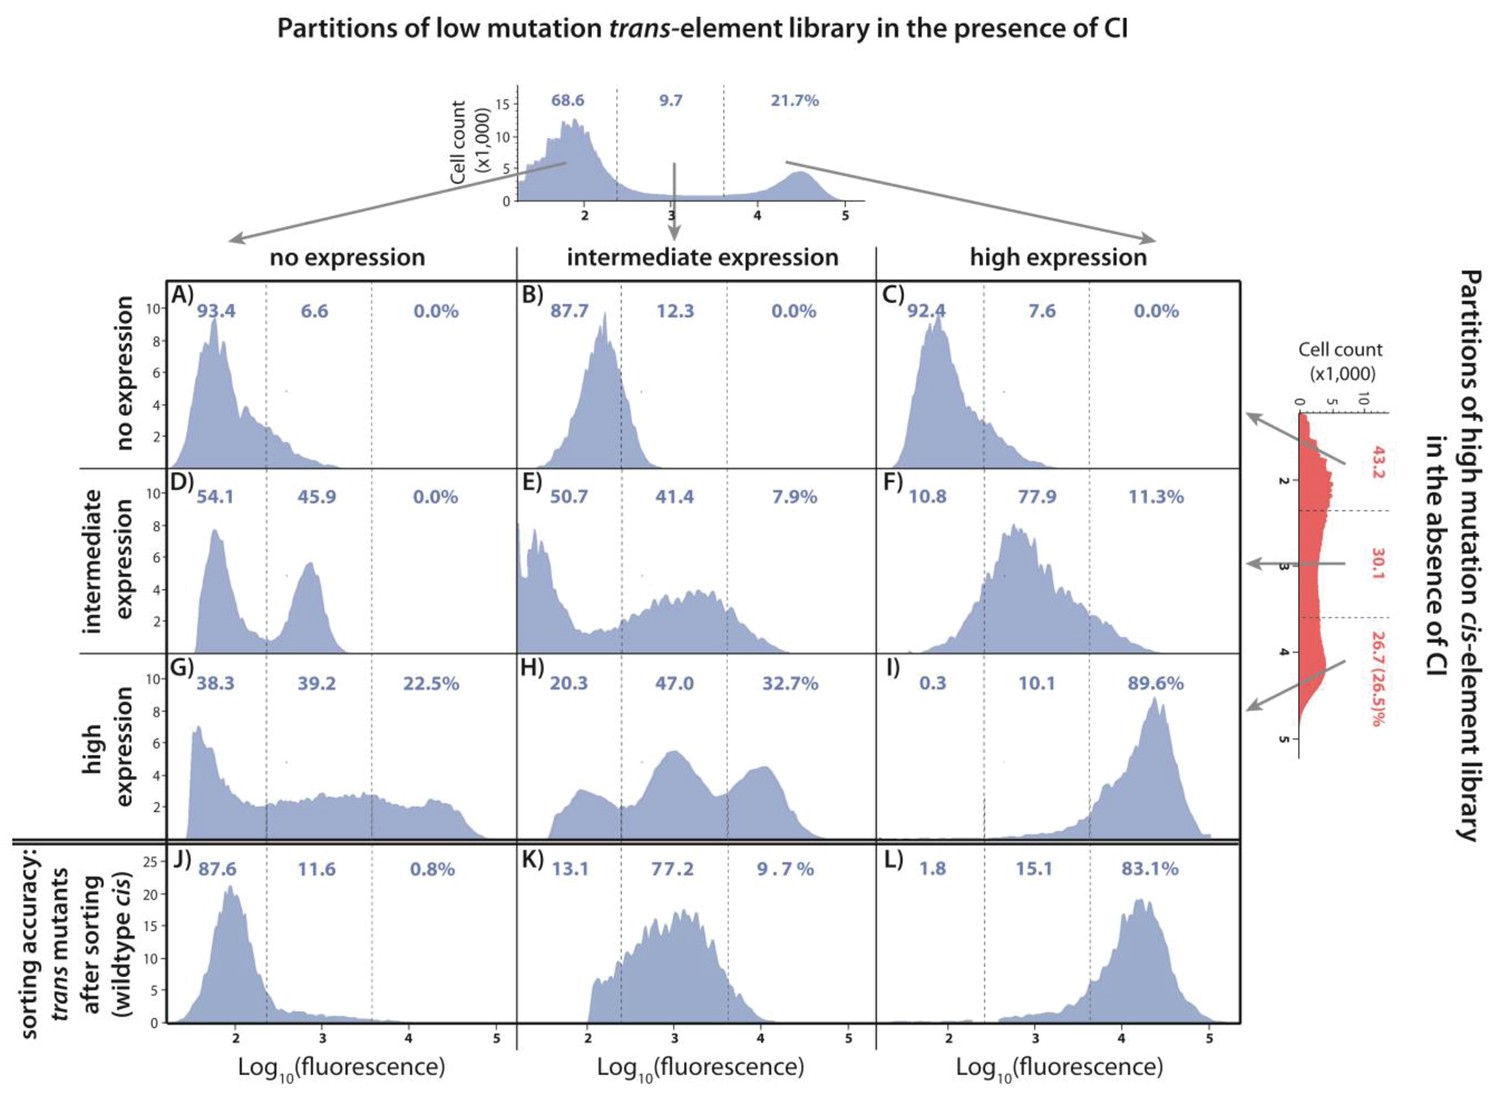
Understanding the interactions between mutations in cis and trans by accounting for the genetic regulatory structure of the system.
Three partitions, obtained by FACS, of the low mutation probability trans-element library (corresponding to no expression, intermediate, and high expression phenotypes) were combined with the three equivalent partitions of the high mutation probability cis-element library in the absence of CI. The cis-element library in the absence of CI shows only the effect of mutations on RNAP binding. The DME of the original trans-element library, corresponding to Figure 2E, is shown on top. The DME of the original cis-element library, corresponding to Figure 2—figure supplement 1D, is shown on the right. The arrows illustrate from which category of the original DME (either trans or cis) were the sorted mutants used to make the particular combined library. DMEs of all nine partition-combination libraries were estimated using flow cytometry, with each distribution obtained by pooling two independent measurements of 500,000 cells. Also shown is the sorting accuracy, obtained as the repeated DME measurement of each trans partition following the original FACS sorting (panels J,K,L). The distributions of fluorescence are shown in the presence of CI. The dashed lines separate three categories of phenotypes – ‘no expression’, ‘intermediate’, and ‘high expression’ phenotypes. Numbers are percentage of counts in each category. At least in part, intermolecular epistasis can be qualitatively explained by considering the genetic regulatory structure of the system, as follows. Panels A), (B), and C): no expression cis-element mutants do not bind RNAP sufficiently to lead to expression, so that system mutants containing them remain in the ‘no expression’ bin irrespective of the effect of mutations in trans. (D) No expression trans-element mutants fully repress on wildtype cis. When cis-element mutations of intermediate expression are introduced, some still bind the functional CI mutants leading to repression, while others carry mutations that prevent CI binding, resulting in intermediate expression system mutants. (E) Intermediate expression CI mutants only partially repress on wildtype cis, but fully repress some cis-element mutants that have lowered RNAP binding. Other intermediate expression CI mutants do not bind a mutated cis-element background. (F) High expression CI mutants cannot bind wildtype cis. Similarly, they do not bind intermediate expression cis-element mutants, resulting in intermediate expression in the system. (G), (H): Some high expression cis-element mutants can fully bind mutated but functional CI mutants, others can only partially bind them, while some maintain full RNAP binding while losing all CI binding. (I) non-functional CI mutants do not repress on wildtype cis, hence also not on mutated cis-element backgrounds.
Figure 6 with 2 supplements
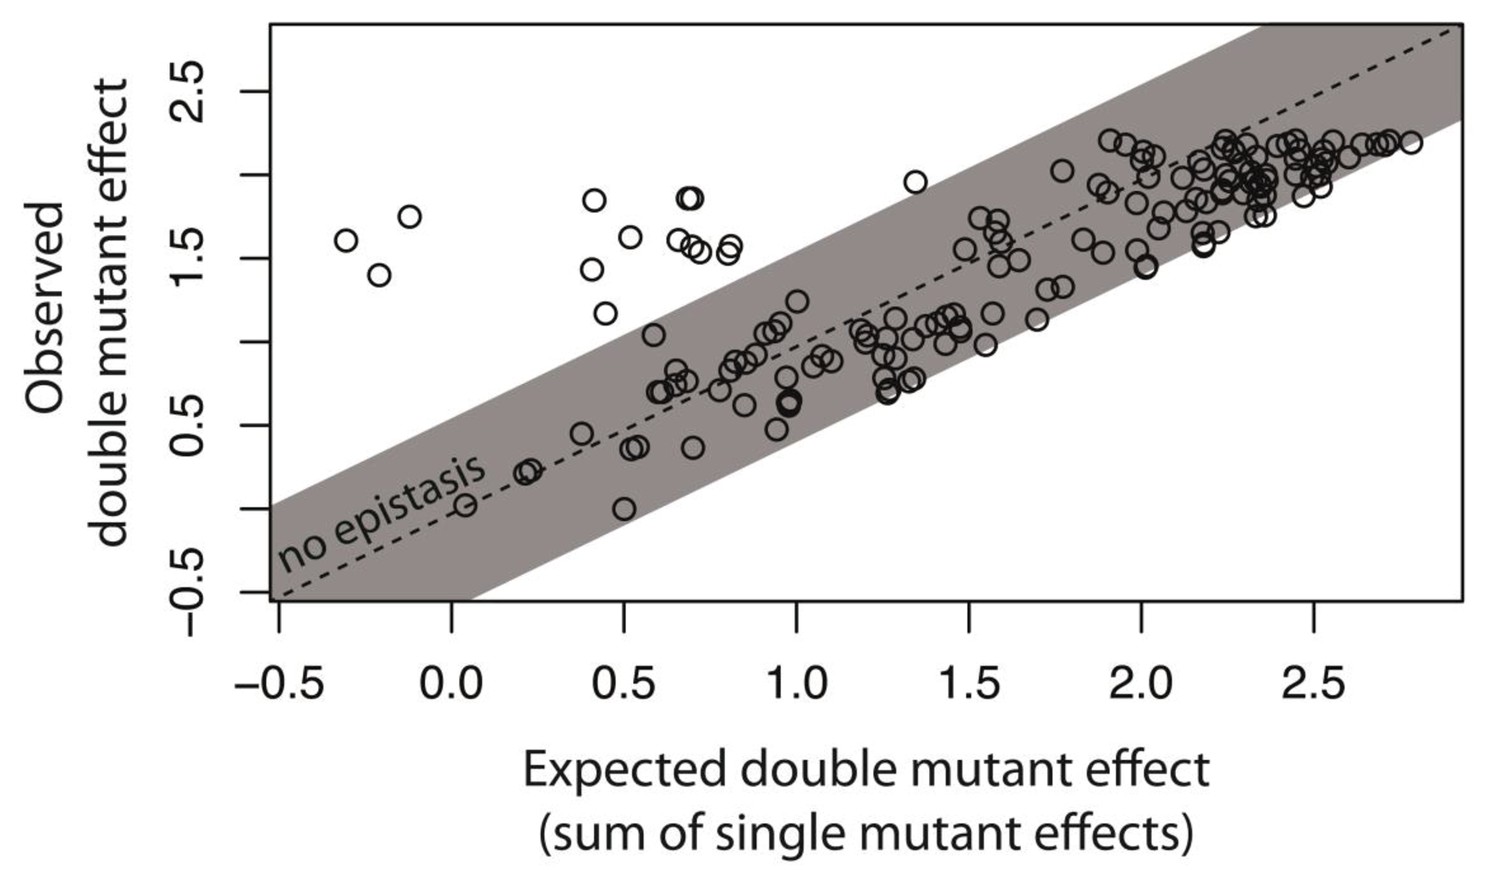
Not all intermolecular epistasis can be explained by accounting for the underlying genetic regulatory structure of the system.
We created 150 double mutants with single mutation combinations corresponding to Figure 5G. A double mutant in this library would not be in epistasis unless a mutation in trans binds the cis mutant differently than the wildtype trans does. In a plate reader, we measured expression levels of monoclonal populations of each double mutant and its constitutive single mutants in the presence of CI. Epistasis was estimated as the deviation of the observed double mutant effect from the additive expectation based on single mutant effects. The grey bar indicates measurements that are not in significant epistasis. The effects of single mutations in cis and in trans, as well as the double mutant effects, are shown in Figure 6—figure supplement 1, while the underlying data are shown in Figure 6—source data 1. The location of point mutations is shown in Figure 6—figure supplement 2 and Figure 6—source data 2.
-
Figure 6—source data 1
Calculating epistasis from the effects of 150 double mutants and their corresponding single point mutations, measured in plate reader.
This library consists only of point mutants in cis that lead to high expression in the absence of CI, and point mutants in trans that result in no expression in the presence of CI. The data provided here are shown in Figure 6, and Figure 6—figure supplement 1.
- https://doi.org/10.7554/eLife.28921.033
-
Figure 6—source data 2
Identity and location of mutations in the library of 150 double mutant, with a point mutation in cis that leads to high expression in the absence of CI, and a point mutation in trans that leads to no expression in the presence of CI.
- https://doi.org/10.7554/eLife.28921.034
Figure 6—figure supplement 1
Distribution of single mutation effects in 150 system double mutants and their corresponding single mutants.
We created 150 unique double mutants, with one point mutation in cis that had high expression in the absence of CI, and the other in trans that exhibited no expression in the presence of CI. We measured gene expression of each mutant at a population level in a plate reader. Histograms of expression levels in the absence and in the presence of CI are shown for: (A) point mutations in cis; (B) point mutations in trans; (C) double mutants in the system. Dotted line represents mean wildtype fluorescence in the corresponding environment. Six replicates of each mutant were measured. Grey bars indicate mutants that were not significantly different from the wildtype. The data underlying this figure are shown in Figure 6—source data 1.
Figure 6—figure supplement 2
Identity and location of mutations in the double mutant library with a trans mutation that has no expression in the presence of CI, and a cis mutation with high expression in the absence of CI.
(A) DNA sequence of the trans-element showing the N-terminal domain (red), C-terminal domain (blue), and the linker region connecting the two domains (black). (B) DNA sequence of the cis-element showing the −35 and −10 RNAP recognition sites (from left to right, underlined), and the two CI repressor operators (green). Unlike the double mutant library shown in Figure 3, where each double mutant had a unique mutation in cis and trans, in this library some cis mutations had to be repeated, as we could not identify 150 mutations in cis that had high expression in the absence of CI.
Tables
Table 1
Additive null predictions for interactions between mutations.
Most interactions result in high expression phenotypes because the wildtype in the presence of CI has no expression, meaning that mutations are either neutral or increase wildtype expression. If an effect of a mutation is positive, the additive model states that the effect remains positive (and the same), independent of the genetic background. As such, these predictions are true only for a system that is tightly repressed, where the wildtype has no expression. ‘High +’ indicates predictions that result in expression levels above the biologically meaningful limit, which is defined by the unrepressed PR promoter (shown in Figure 2A). We treat these predictions as high expression phenotypes. We consider three categorical single component effects (‘no expression’, ‘intermediate expression’, and ‘high expression’), and show the categorical effect predicted by the additive null model for the system. We use categorical effects only to provide an intuition for what the additive model predicts - to obtain actual predictions of system DMEs, we use convolution (as explained in detail in Materials and methods section Naïve convolution of component distributions as the null model for additivity between mutations).
| Effects of mutations in trans | ||||
|---|---|---|---|---|
| No expression | Intermediate expression | High expression | ||
| Effects of mutations in cis | No expression | No | Intermediate | High |
| Intermediate expression | Intermediate | Intermediate +high | High + | |
| High expression | High | High + | High + | |
Table 2
Predicting the system DME is possible only when accounting for epistasis between components.
Four different predictions for the frequency of mutants in each partition (no expression, intermediate, and high expression phenotypes) were compared to the actual system distribution, measured in the presence of CI, and consisting of the high probability cis +low probability trans libraries (Figure 4). The experimental prediction based on distributions of nine partition-combination DMEs (Figure 5) was obtained by weighting the nine DMEs with the relative frequency of the original trans partition they were derived from (from Figure 2E - no expression partitions were weighted by 0.686; novel phenotype partitions by 0.097; high expression partitions by 0.217). One convolution of cis- and trans-element DMEs was performed in the absence of any knowledge of the genetic regulatory structure of the system (naïve convolution), and the other by accounting for the effects of cis mutations in the absence of CI (Figure 2—figure supplement 7). The null prediction tested if the observed distributions could arise only from the imprecise sorting of the original trans library partitions (Figure 4J,K,L). Only the experimental prediction based on partition-combination libraries and the convolution that accounted for the genetic regulatory structure could explain the epistatic interactions between mutants in cis- and trans-elements (shown in orange).
| Actual system (mutations in cis and trans) | Experimental prediction (based on partition libraries) | Convolution (no knowledge of genetic structure) | Convolution (accounting for cis effects in the absence of CI) | Null prediction (based on sorting accuracy) | |
|---|---|---|---|---|---|
| No expression phenotypes (%) | 61.8 | 55.1 | 44.4 | 62.9 | 68.6 |
| Intermediate phenotypes (%) | 31.9 | 31.1 | 21.5 | 26.6 | 9.7 |
| High expression phenotypes (%) | 6.3 | 13.8 | 34.1 | 10.5 | 21.7 |
| χ2 compared to actual distribution | 5.49 | 24.7 | 1.89 | 59.8 | |
| p value | 0.064 | 10−6 | 0.388 | 10−13 |
Additional files
-
Transparent reporting form
- https://doi.org/10.7554/eLife.28921.035
Download links
A two-part list of links to download the article, or parts of the article, in various formats.
Downloads (link to download the article as PDF)
Open citations (links to open the citations from this article in various online reference manager services)
Cite this article (links to download the citations from this article in formats compatible with various reference manager tools)
Regulatory network structure determines patterns of intermolecular epistasis
eLife 6:e28921.
https://doi.org/10.7554/eLife.28921


