Direct modulation of aberrant brain network connectivity through real-time NeuroFeedback
- National Institute of Mental Health, National Institutes of Health, United States
Figures
Figure 1
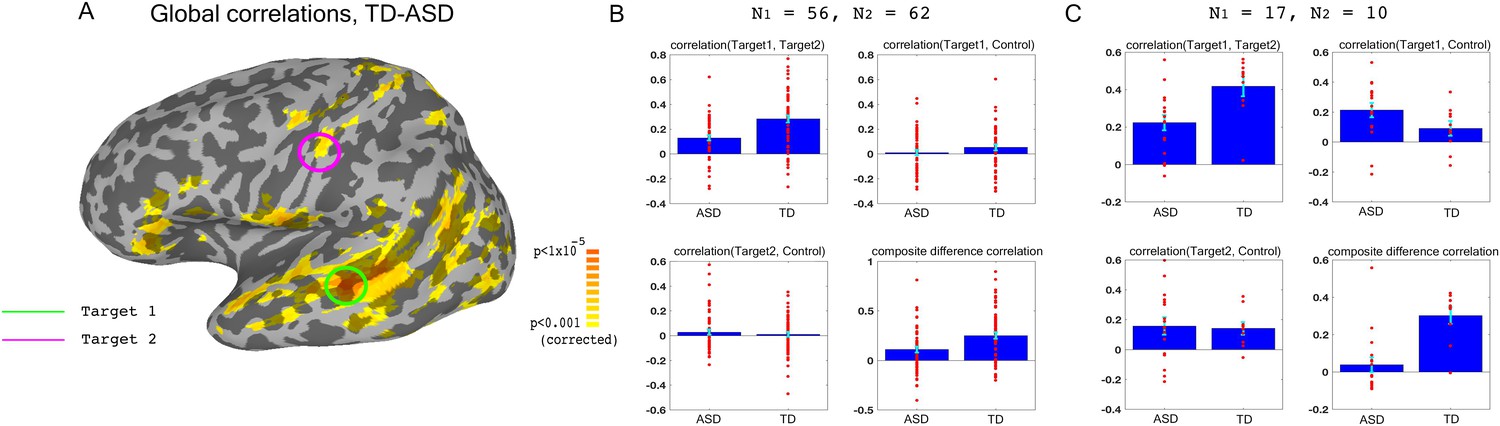
Choosing ROIs.
(A) Group differences between TD (N = 62) and ASD participants (N = 56), matched for motion, age and IQ. Difference maps calculated on the average correlation of each voxel with all other grey matter voxels in the brain. Target1 was chosen as the region with the greatest between-group difference, and Target2 was chosen as the region in which the difference in connectivity to Target1 was greatest between groups, while also being in a physically distant, distinct network based on (Gotts et al., 2012). (B) Pairwise correlations for the dataset shown in (A), between the two targets (top left), target1 and control (top right), target2 and control (bottom left), and the composite difference measure, based on the difference in correlations between the two targets and the target-control pairs (see Materials and methods). Difference between the ASD and TD groups is significant for target1-target2 correlations (p=4.3×10⁻⁵), and the composite difference measure (p=0.001). (C) Same as (B), but for the current cohort of participants who took part in the neurofeedback study. Correlations are averaged across the first two rest scans of the first day, before training. Between group difference is significant for target1-target2 correlations (p=0.002), target1-control correlations (p=0.04), and the composite difference measure (p<1×10⁻⁴). Blue bars represent the subject mean, cyan error bars mark ± SEM. Red dots represent each individual subject.
Figure 2 with 3 supplements
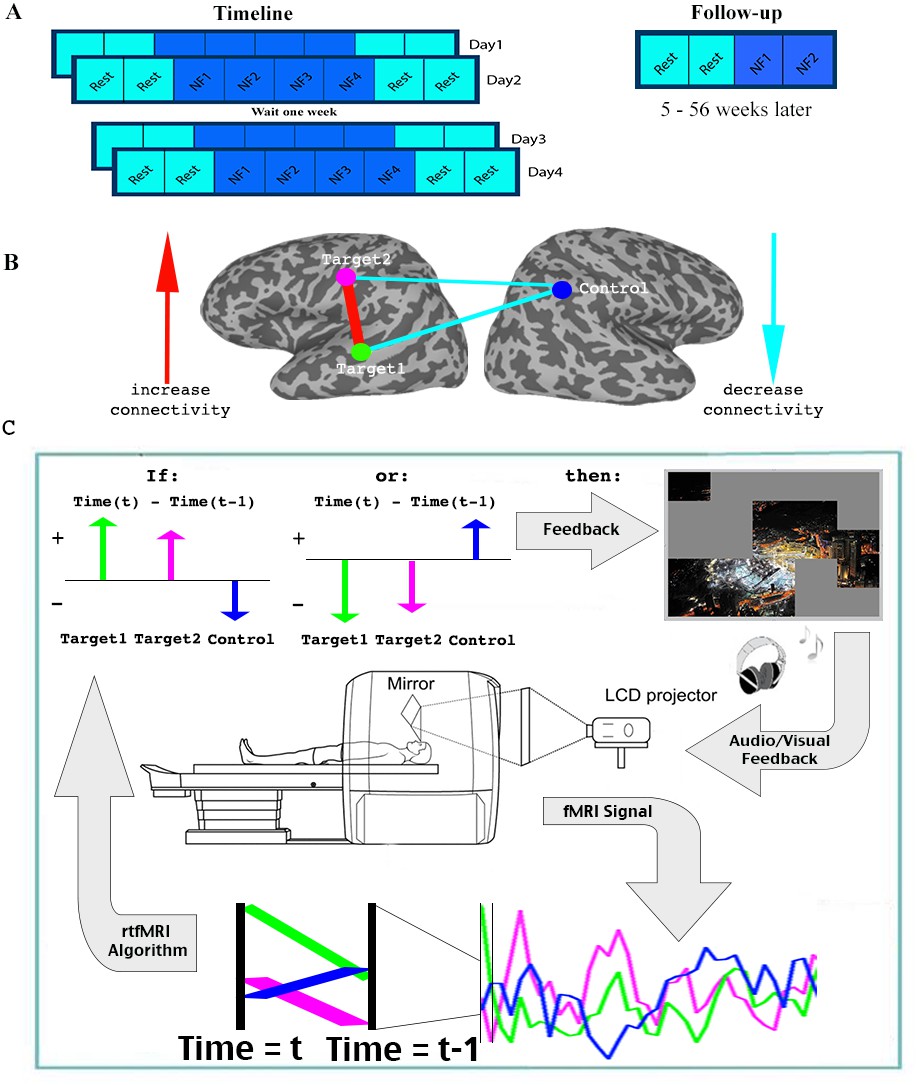
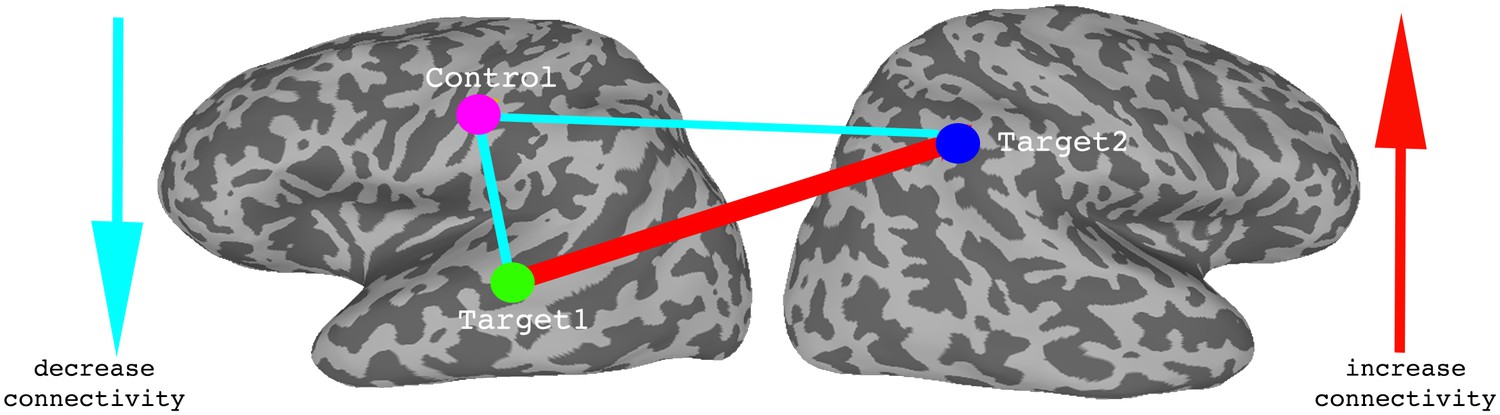
Experimental paradigm.
(A) Timeline. (B) Location of ROIs, and network being trained. (C) Feedback session. Data was collected and analyzed in real-time, and a decision whether to present feedback (reveal a square of the picture +positive sound) was made based on the change in signal from one time (t-1) to the next (t) in the three ROIs. Feedback was given if the direction of change in the two targets was the same, and opposite from the direction of change in the control ROI. See.
Figure 2—figure supplement 1
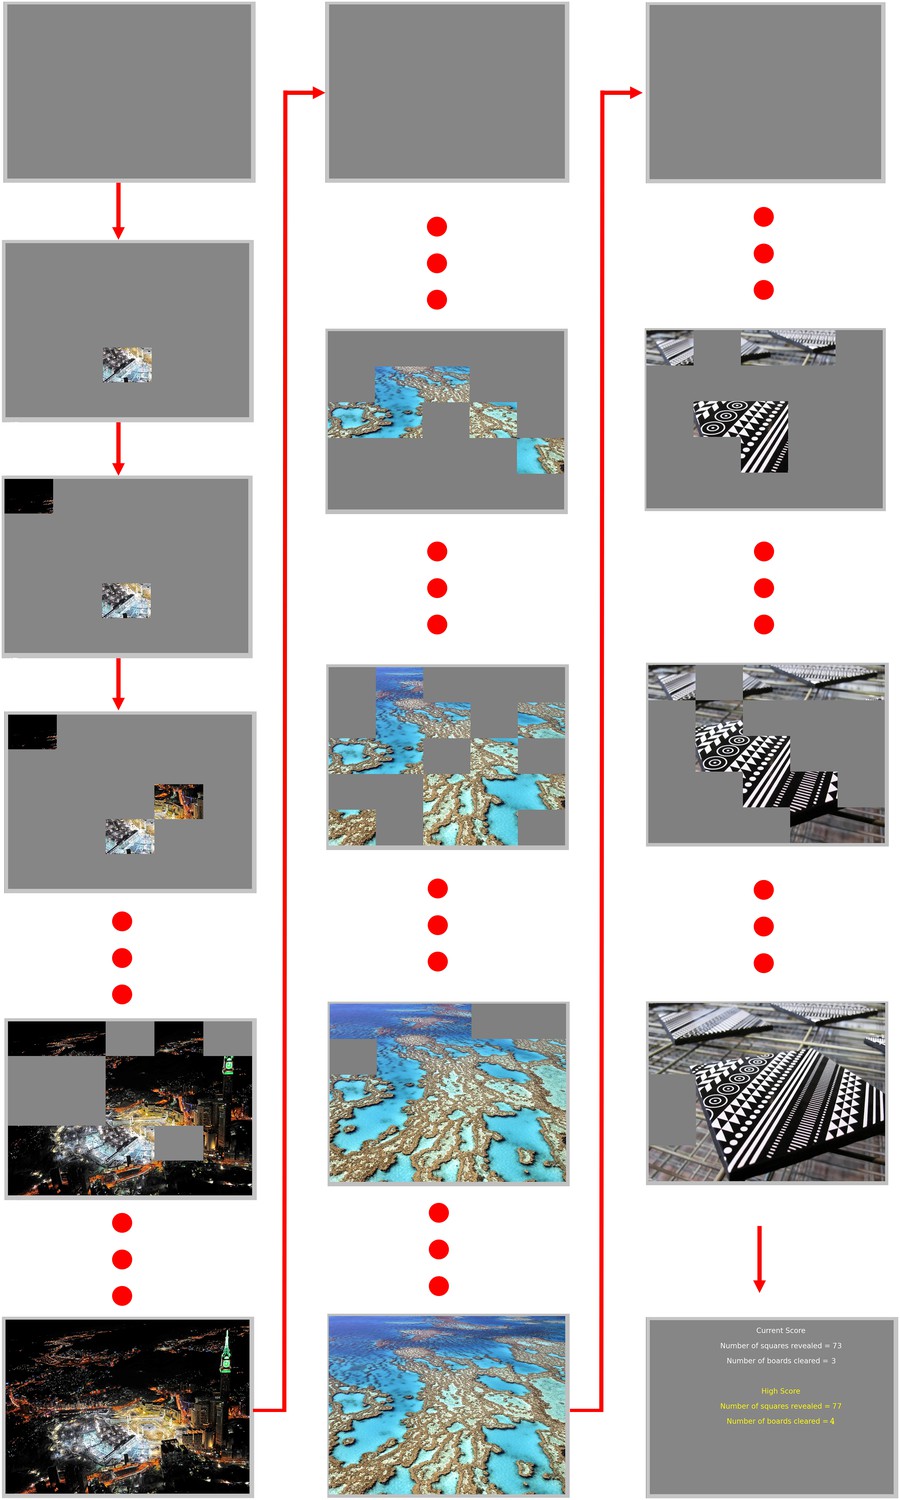
Puzzle task examples.
Participants were asked to attempt to reveal the picture, and feedback was presented in the form of a picture square becoming visible, coupled with a positive tone. There were 25 squares per ‘puzzle’, and a new puzzle began as soon as the previous one had been completed, until the end of the scan when the current and high score for that day were presented.
Figure 2—figure supplement 2
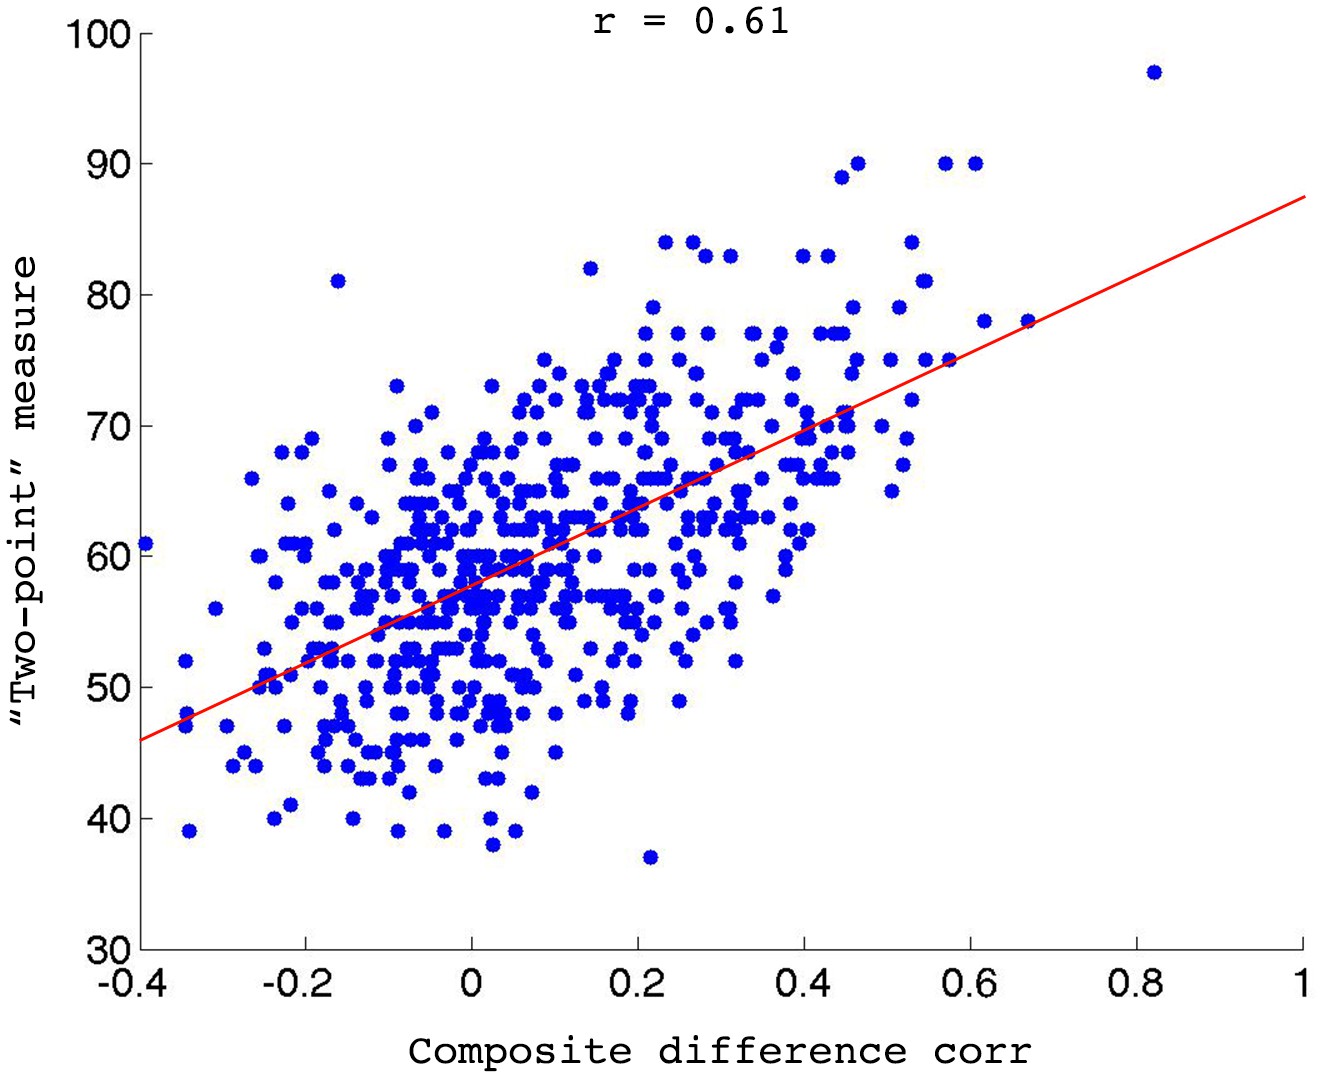
Validating the feedback method.
Overall composite difference correlation measure for each scan, plotted against the number of feedback responses when the same data is run through the real-time algorithm.
Figure 2—figure supplement 3
TD control group training.
The diagram shows the direction of training in the TD control group. As with the ASD group, participants were rewarded for the ‘correct’ network configuration by revelation of a piece of the puzzle, coupled with a short upbeat auditory sound. The three network nodes also remained the same, the only difference was in their designation as ‘targets’ or ‘control’. While the STS node remained a target, the somatosensory node became the control, and the IPL was the second target. Participants were therefore trained to increase connectivity between STS and IPL, while reducing their connectivity with the somatosensory node.
Figure 3 with 2 supplements
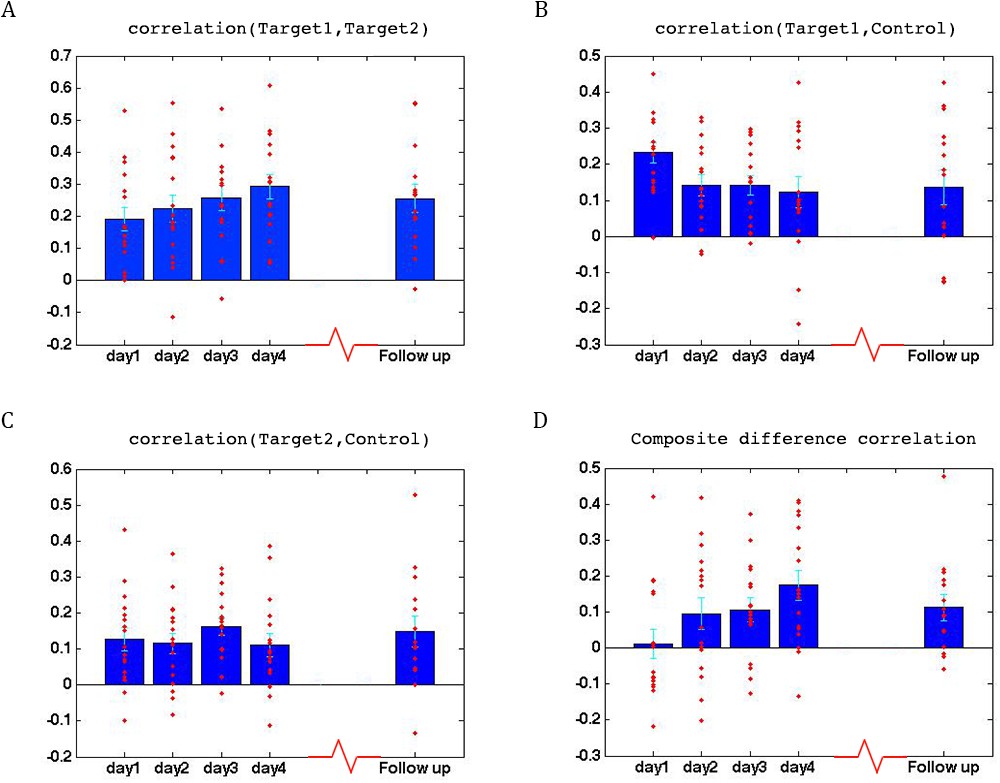
Learning across days, ASD group.
(A) Correlations between the two target regions per day, averaged across all four neurofeedback scans per day. Blue bars represent the subject mean, cyan error bars mark ± SEM. Red dots represent each individual subject. The difference in correlations between day1 and days 3 and 4 and the follow up is significant (p=0.05, p=4×10⁻⁴, p=0.05 respectively), as is the difference between day2 and day4 (p=0.016). (B) Correlations between Target1 and Control. There is a significant change between day1 and all other days (p=0.005, p=5×10⁻⁴, p=8×10⁻⁴ for days 2, 3 and 4, p=0.015 for the follow up). (C) Correlations between Target2 and Control. (D) Composite difference measure, showing the difference between target-target and target-control correlation pairs (see Materials and methods). Day1 correlations are significantly different from all other days (p=0.003, p=0.01, and p=2×10⁻⁴, p=0.007 respectively), and day2 is significant different from day4 (p=0.0017). In all panels N = 17 for days 1–4, N = 15 for the follow up. All p-values for differences between days were determined by permutation tests.
Figure 3—figure supplement 1
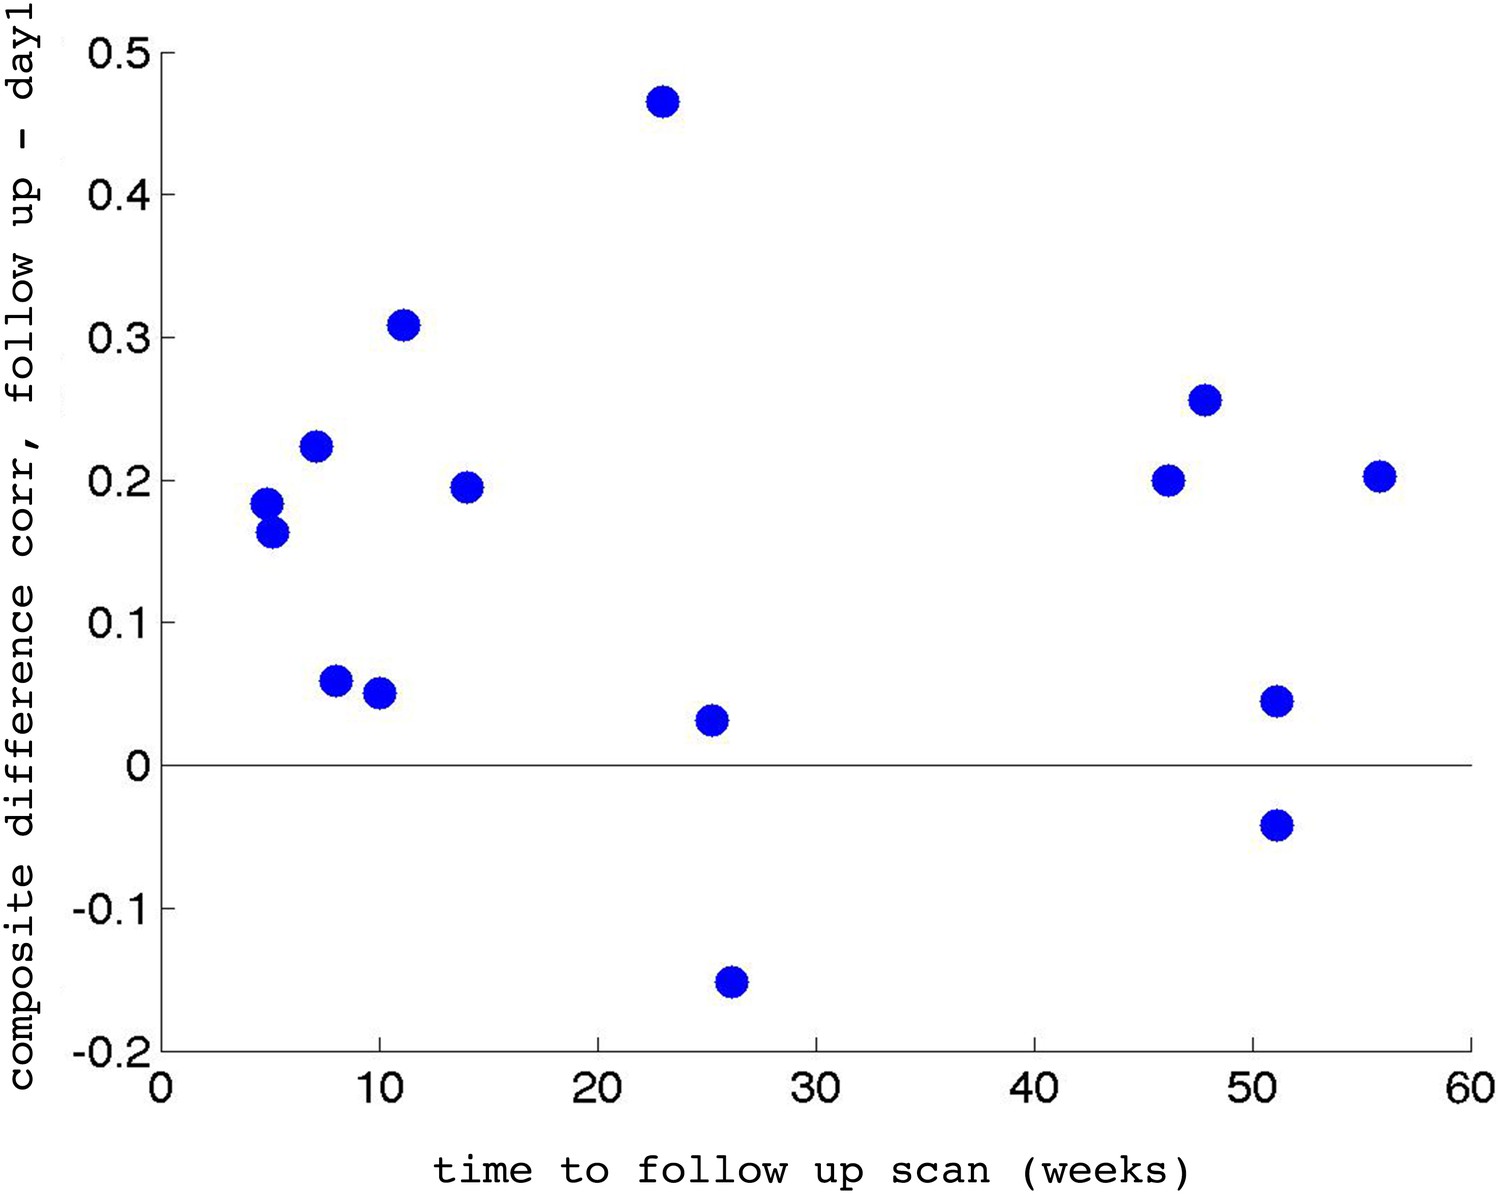
Retention of learning.
Change in the composite difference measure averaged across the two neurofeedback runs during the follow up experiment and the same measure on day1 of the training, vs. time from the original experiment to the follow up, in weeks. No significant correlation was found between the two (r = −0.12) suggesting that our neurofeedback procedure induced a stable change that did not dissipate over time. N = 15, the number of participants who returned for the follow up scan.
Figure 3—figure supplement 2
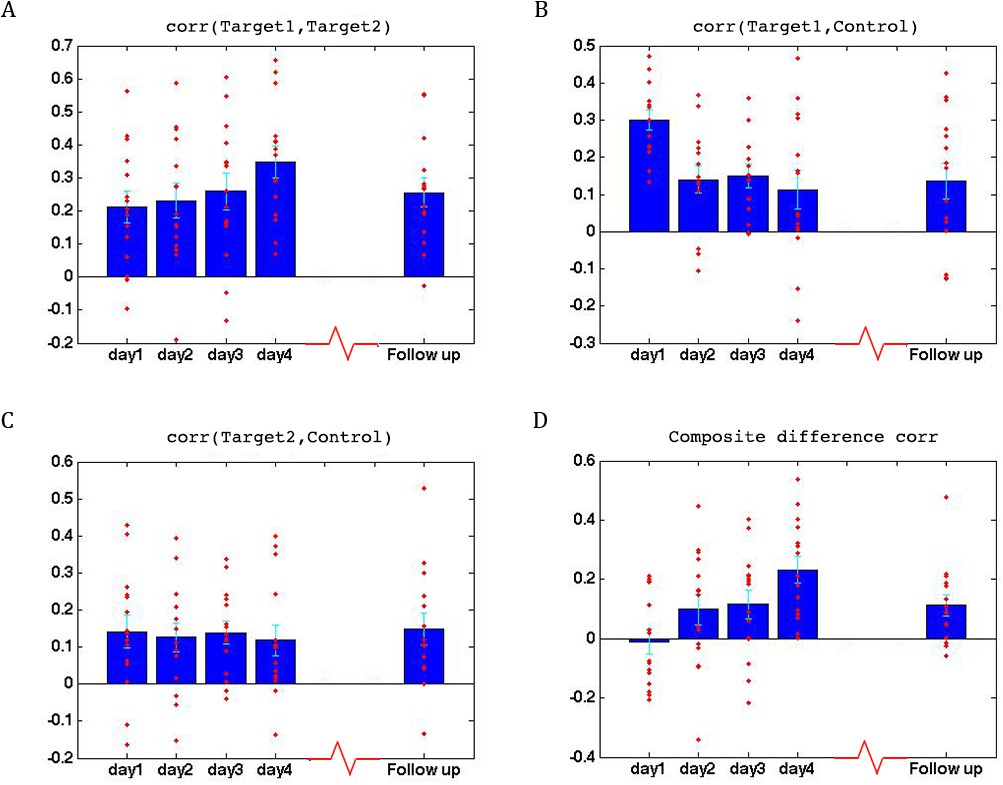
Data from first two neurofeedback scans only.
As the follow up experiment had only two neurofeedback runs as opposed to the four neurofeedback runs in the original experiment (all 9 min), and only 15/17 participants, we repeated the same analysis shown in Figure 3 using just the first two neurofeedback runs for the original 4 days, and the 15 participants that were included in the follow up. This did not impact the results, and significant changes between days stayed the same as before.
Figure 4 with 1 supplement
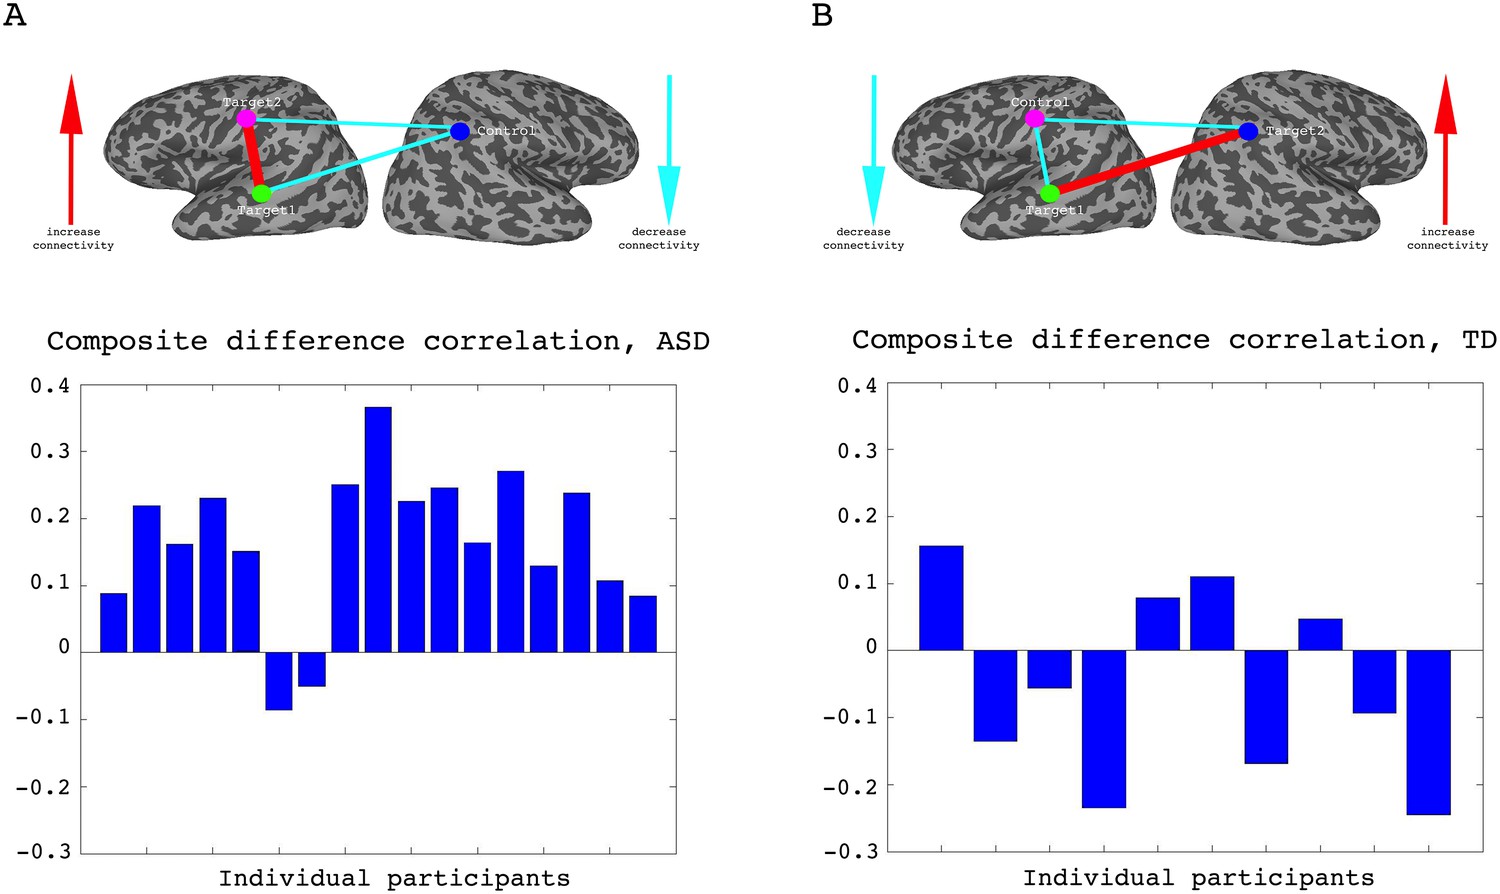
Individual participant data.
(A) Difference in the composite difference correlation from day1 to day4, for each of the 17 individual ASD participants averaged across all four neurofeedback scans per day, presented chronologically in order of scanning. (B) Same analysis for each of the 10 TD participants, presented chronologically. Note that the composite difference measure is comprised of target-target correlations minus the target-control pairs, and that the definition of targets and control differed between the two groups.
Figure 4—figure supplement 1
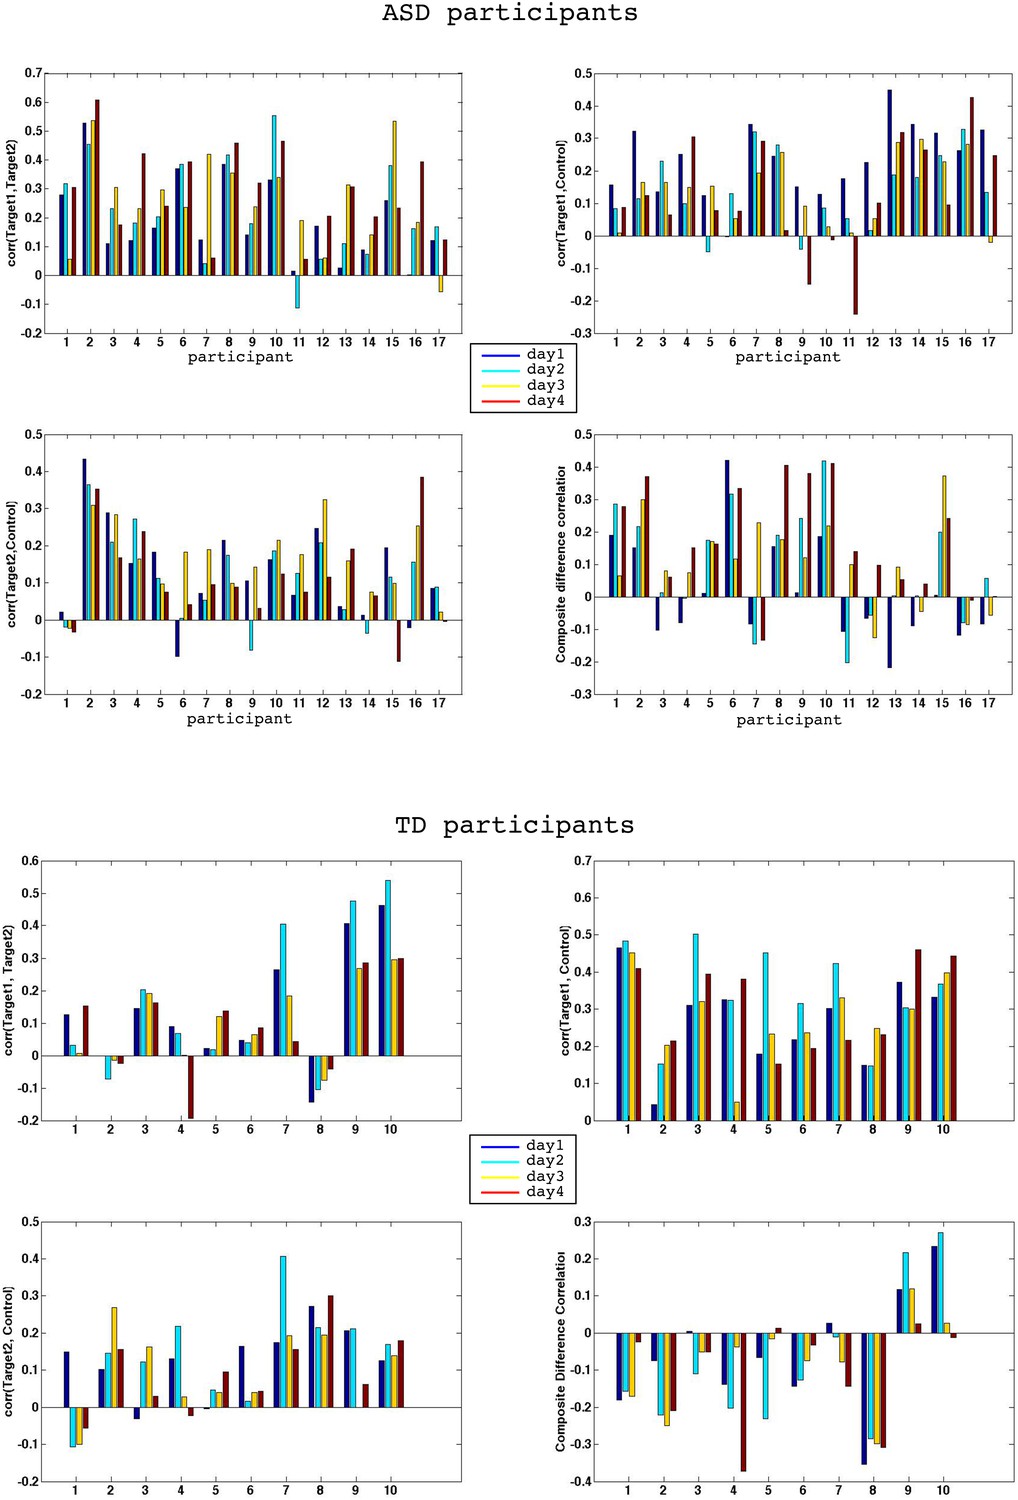
Individual participants.
Full correlation data for all four days for each individual participant. Top half shows ASD data, bottom half TD control group data. Blue bars denote day1, cyan day2, yellow day3 and red day4. Note that 15/17 ASD participants show an increase in the composite difference score from day1 to day4, 14/17 show an increase in Target1, Target2 correlations, and 14/17 show a decrease in the correlation between Target1 and Control. In contrasts, 5/10 TDs show an increase in Target1, Target2 correlations, 4/10 show a decrease in correlations between Target1 and Control, and 5/10 show a decrease in correlations between Target2 and Control, exactly at chance level.
Figure 5
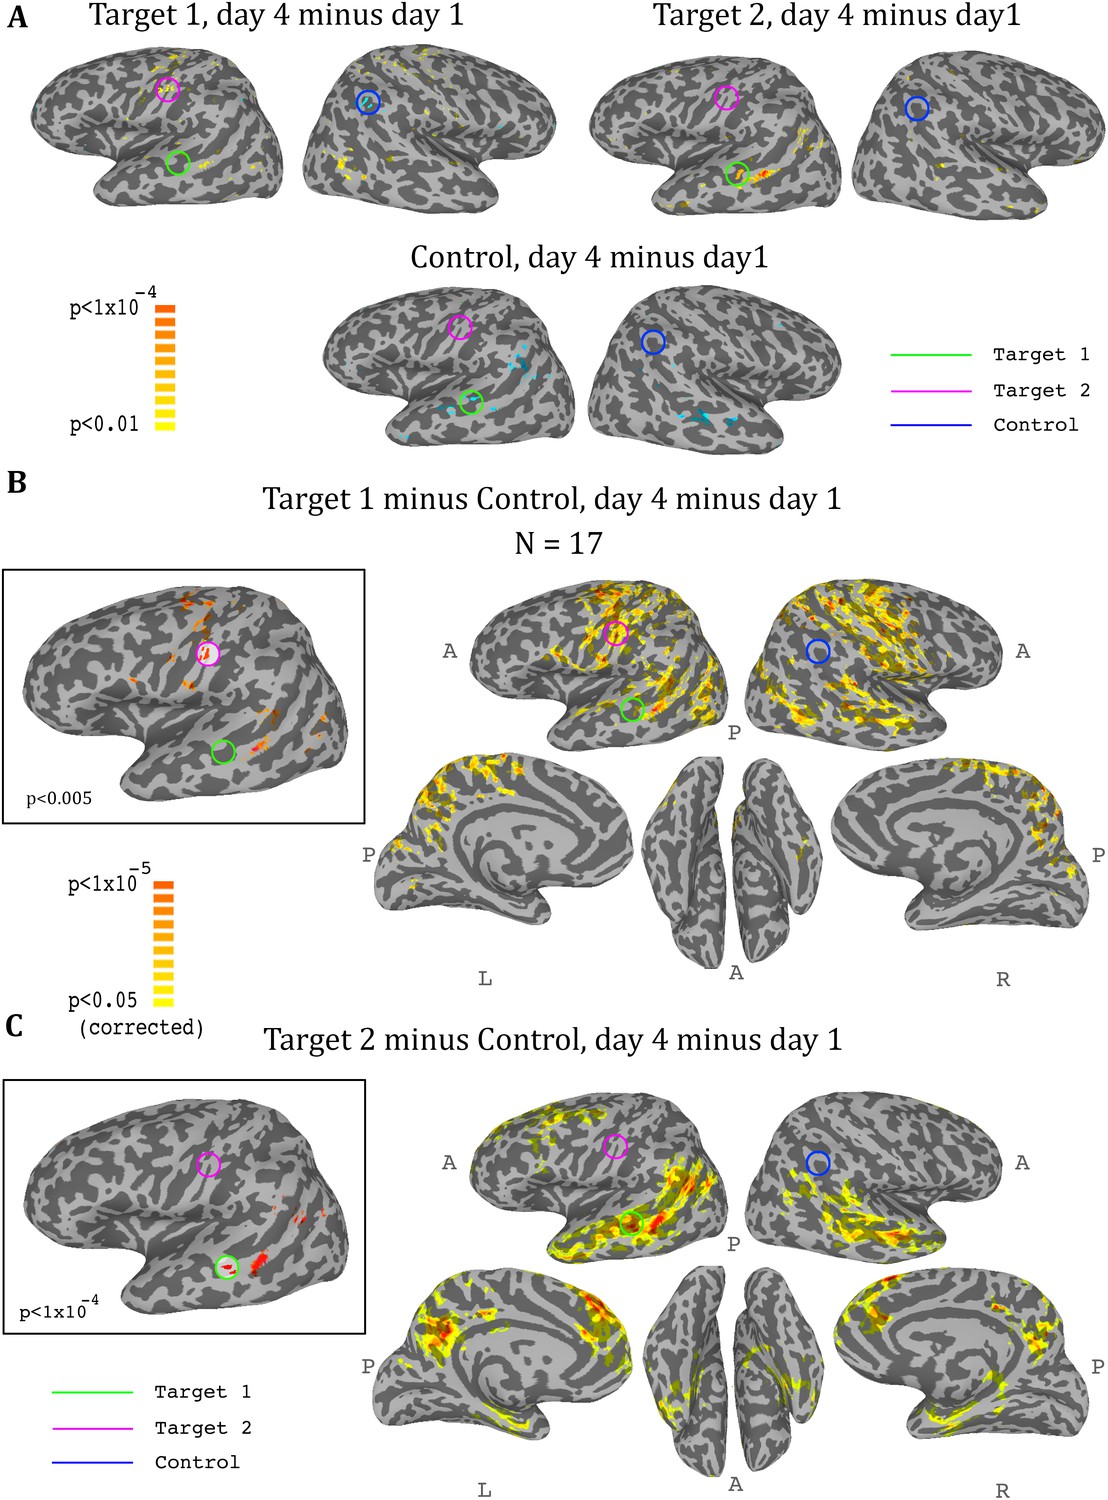
Whole-brain analysis during neurofeedback, ASD group.
(A) Top left: change in correlations to target1, between day1 and day4, t-test across participants. High values represent voxels that showed a consistent change between day1 and day4, such that on day4 they were more correlated to target1 than they were on day1. Note the positive peak in target2, and the negative peak in the control region. Top right: change in correlations to target2, between day1 and day4, t-test across participants. Note the positive peak in target1. Bottom: change in correlations to the control region, between day1 and day4, t-test across participants. Note the negative peak in target1 and bilateral STS. (B) Change in differential correlation to the target1 and control ROIs, between day1 and day4, t-test across participants. High values represent voxels that showed a consistent change between day1 and day4, such that on day4 they were more correlated to target1 and less correlated to control than they were on day1. Inset shows the same analysis at a higher threshold. (C) Same as (B), for target2 and control. Note that for both maps, the other target, which was not included in the analysis, emerges as the area of greatest change across training days. Maps corrected through permutation tests (see Materials and methods).
Figure 6
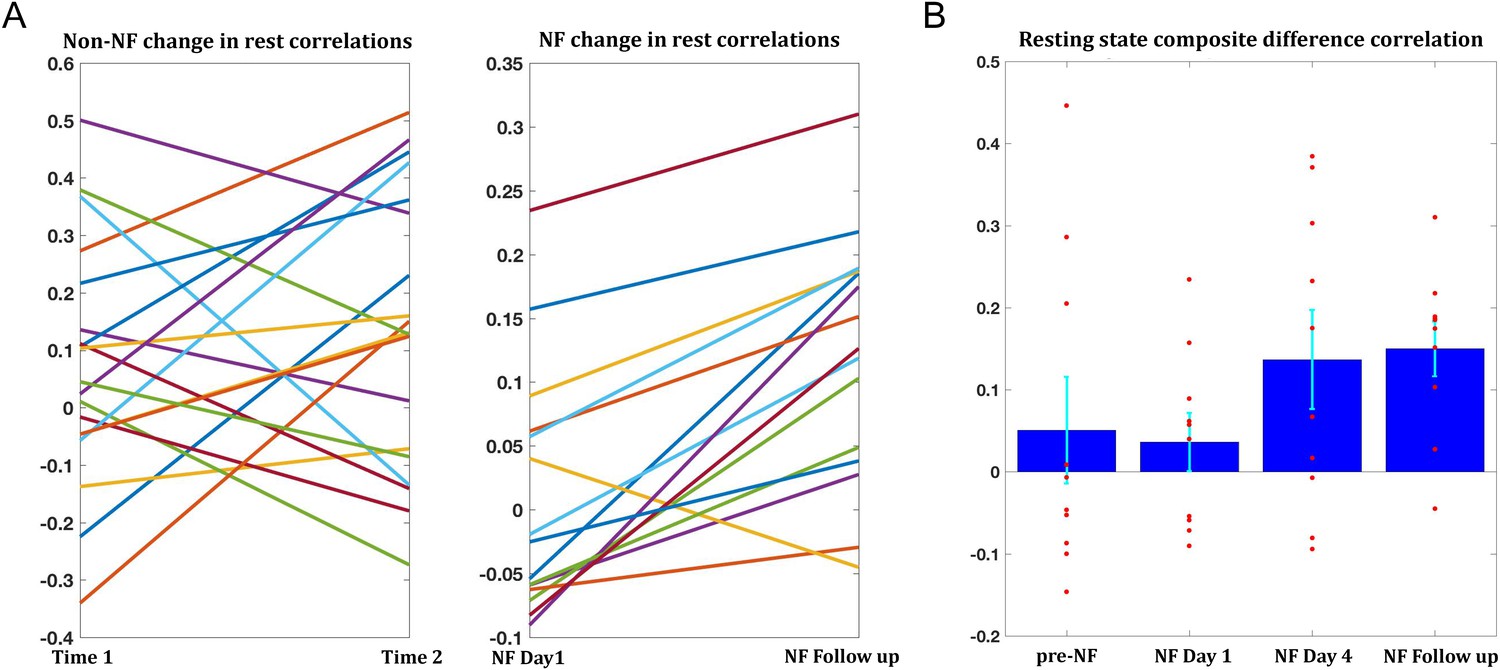
Changes in resting state correlations.
(A) Left panel shows the changes in resting state composite difference correlations for the 19 participants for which two previous data points were available from a previous study, prior to neurofeedback (average time between sessions 13.2 months). The right panel shows the change in resting state composite difference correlations from the very first pre-training rest sessions on the first day of neurofeedback, to the rest sessions collected in the follow up session (also before the neurofeedback training sessions that day), for the 15 participants who took part in the follow up session. Average time between sessions for this group was 6.2 months. (B) Changes in resting state composite difference correlations for the 10 participants who had data from both the previous study, and the follow up session. Change between neurofeedback day1 and neurofeedback day4 as well as neurofeedback follow up, are significant (p=0.019, p=0.003 respectively). All correlations are taken from the resting state scans at the beginning of the relevant session. NF = neurofeedback.
Figure 7
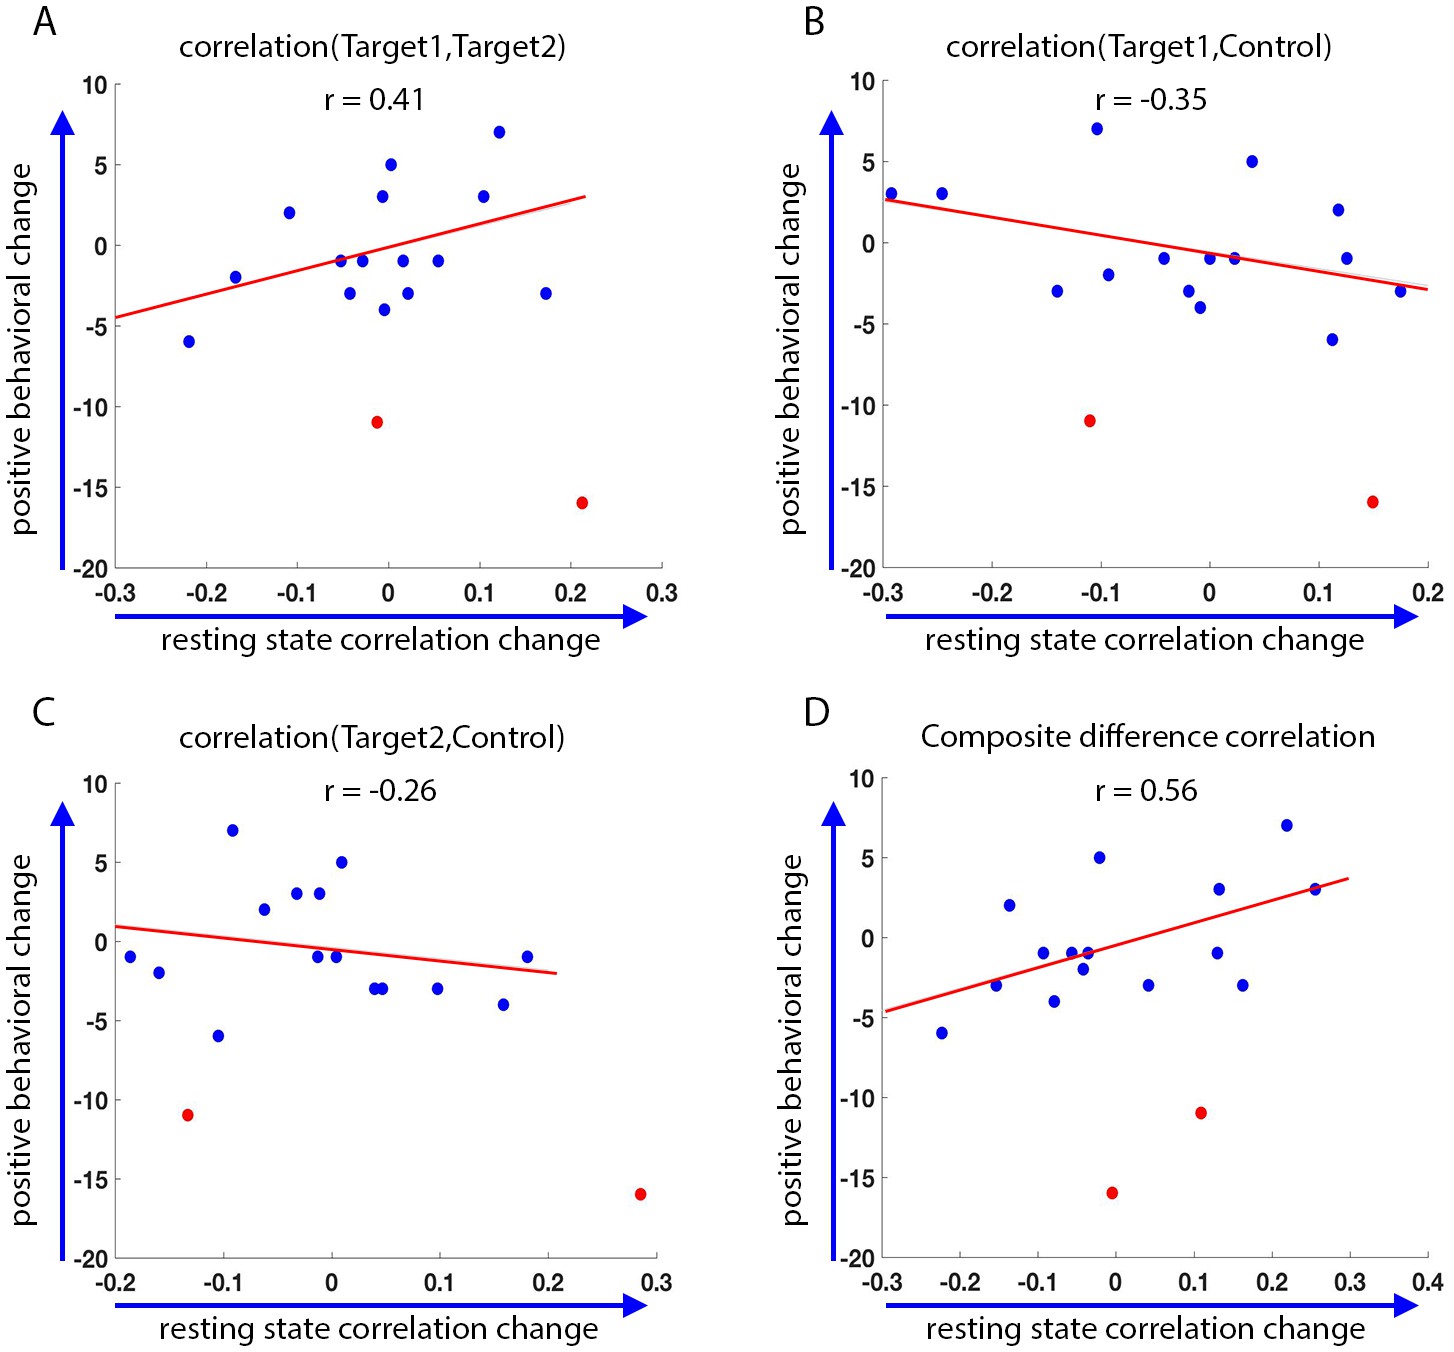
Behavioral changes.
Correlation between the change in the behavioral measure (SRS) score before and after training, and the change in resting state connectivity from the post-training rest scans on day4 to the rest scans on day1 (day4 correlations minus day1 correlations, positive change corresponds to higher correlations on day4). Behavioral change on the y-axis calculated as pre-training overall SRS t-score minus post-training SRS t-score. Positive behavioral change corresponds to a reduction in SRS score after training. Statistical outliers marked in red. (A) Behavioral change vs. change in Target1-Target2 correlations. (B) Behavior vs. Target1-Control. (C) Behavior vs. Target2-Control. (D) Behavior vs. composite difference corr. R values represent Pearson’s correlation. Regression lines and R values do not include the outliers. Correlations between Target1-Target2 and Target1-Control changes and behavior are in the expected direction but are not significant (p=0.07, p=0.08). Behavior vs. composite difference change is significant (p=0.016).
Tables
Table 1
Exit questionnaires
https://doi.org/10.7554/eLife.28974.008| 1. what did you think the study was about? | 2. what were you doing during the scans? (Ask about each day if applicable) | 3. how hard were you trying to solve the puzzles, on a scale of 1–10, for each day? | |
|---|---|---|---|
| 1 | Really don’t know. Figure out how long it takes my brain to figure out where all the pieces go. | Laying back, relaxing, thinking about random things. Same all days. | 5, 5, 5, 5 |
| 2 | MRIs, puzzle study | Day1: just think, Day 2: just think, Day 3: stay awake, Day4: stay awake | 9, 9, 9, 9 |
| 3 | Pictures and the emotional responses they elicit. Definitely tied to emotions. Thought he had to be less excited for pieces to come up | Thinking about memories, things to pass the time | 10, 10, 9, 8 |
| 4 | Measuring the thought processes of where certain processes take place in the game. Stress test | Day1: eye movement, control heart rate, close eyes; Day2: nothing, relaxed; day3: relax, day4: nothing | 5, 1, 1, 2 |
| 5 | About focus | Trying to focus on certain areas of the screen | 5, 8, 10, 2 |
| 6 | What exactly is autism and how the brain is related to it? The puzzles can show how fast different people's brains work. | Nothing different really. Today was thinking about an English assignment. Was really just looking at them, wanted to see the picture. Didn't think ‘oh I have to do this now’. Wasn’t trying hard to solve at all. Either it comes or it doesn’t. You can't really rush your brain | 1, 1, 1, 1 |
| 7 | I don’t know | Breathing in patterns, blinking, gave up | 7, 4, 5, 10 |
| 8 | About first level visual processing? | Most math, computation | 5, 2, 2, 2 |
| 9 | Multitasking, and being able to keep still and look in the same place for a consistent period. | Tried different ways to solve more pieces. Today, for example, tried to keep still and look at a similar spot consistently. Yesterday, tried multitasking, breathing and blinking on different rhythmic scales (helped the most). Last week, kept looking around in various directions, mostly at squares that werent filled in yet. | 6, 6, 7, 8 |
| 10 | How humans see stuff and how the brain reacts. Ie sight | Staring at whatever space he could to put the puzzle together | Same each day |
| 11 | Don’t know, detecting how hard my brain works on puzzles | Trial and error, look at different parts of screen, try different techniques | 9, 7, 9, 8 |
Additional files
-
Transparent reporting form
- https://doi.org/10.7554/eLife.28974.017
Download links
A two-part list of links to download the article, or parts of the article, in various formats.
Downloads (link to download the article as PDF)
Open citations (links to open the citations from this article in various online reference manager services)
Cite this article (links to download the citations from this article in formats compatible with various reference manager tools)
Direct modulation of aberrant brain network connectivity through real-time NeuroFeedback
eLife 6:e28974.
https://doi.org/10.7554/eLife.28974


