A Histidine pH sensor regulates activation of the Ras-specific guanine nucleotide exchange factor RasGRP1
- University of California, San Francisco, United States
- UMC Utrecht, Utrecht University, Netherlands
- University of California, United States
- Lawrence Berkeley National Laboratory, United States
Figures
Figure 1

Altered basal RasGRP1 signaling by a human His 212 Tyr SNV.
(A) The REM, Cdc25, EF hands, C1 and coiled-coil are known protein domains of RasGRP1. Indicated are residues in different domains that have been shown to impact RasGRP1 activity (Thr 184, Arg 271, Arg 519). (B) Schematic of an autoinhibited RasGRP1 homodimer. (C) Alignment of SNVs (missense variants) are in the coding regions of RasGRP1 collected from online repositories dbSNP, COSMIC, NCBI in 2012 and 2014. (D) Assay to determine RasGRP1 activity in cells. RasGRP1−/−RasGRP3−/− DT40 cells are transfected with EGFP-RasGRP1 wildtype or mutant plasmid. Intracellular phosphorylated-ERK (P-ERK) and phosphorylated ribosomal protein S6 (P–S6) are detected by flow cytometry that allows for analysis of cells expressing different levels of RasGRP1-EGFP. (E) Analysis of basal S6- and ERK- phosphorylation as a function of RasGRP1 expression levels (N = 7, unTFX = untransfected). (F) Effect of SNVs on basal S6- and ERK- phosphorylation. Graphs display RasGRP1-EGFP low expressing cells (N = 2). (E,F) Y-axes show the average ratios of median fluorescent phospho-protein signals/median fluorescent phospho-protein signals from untransfected cells (baseline). Shown are means ±SD.
Figure 2 with 1 supplement
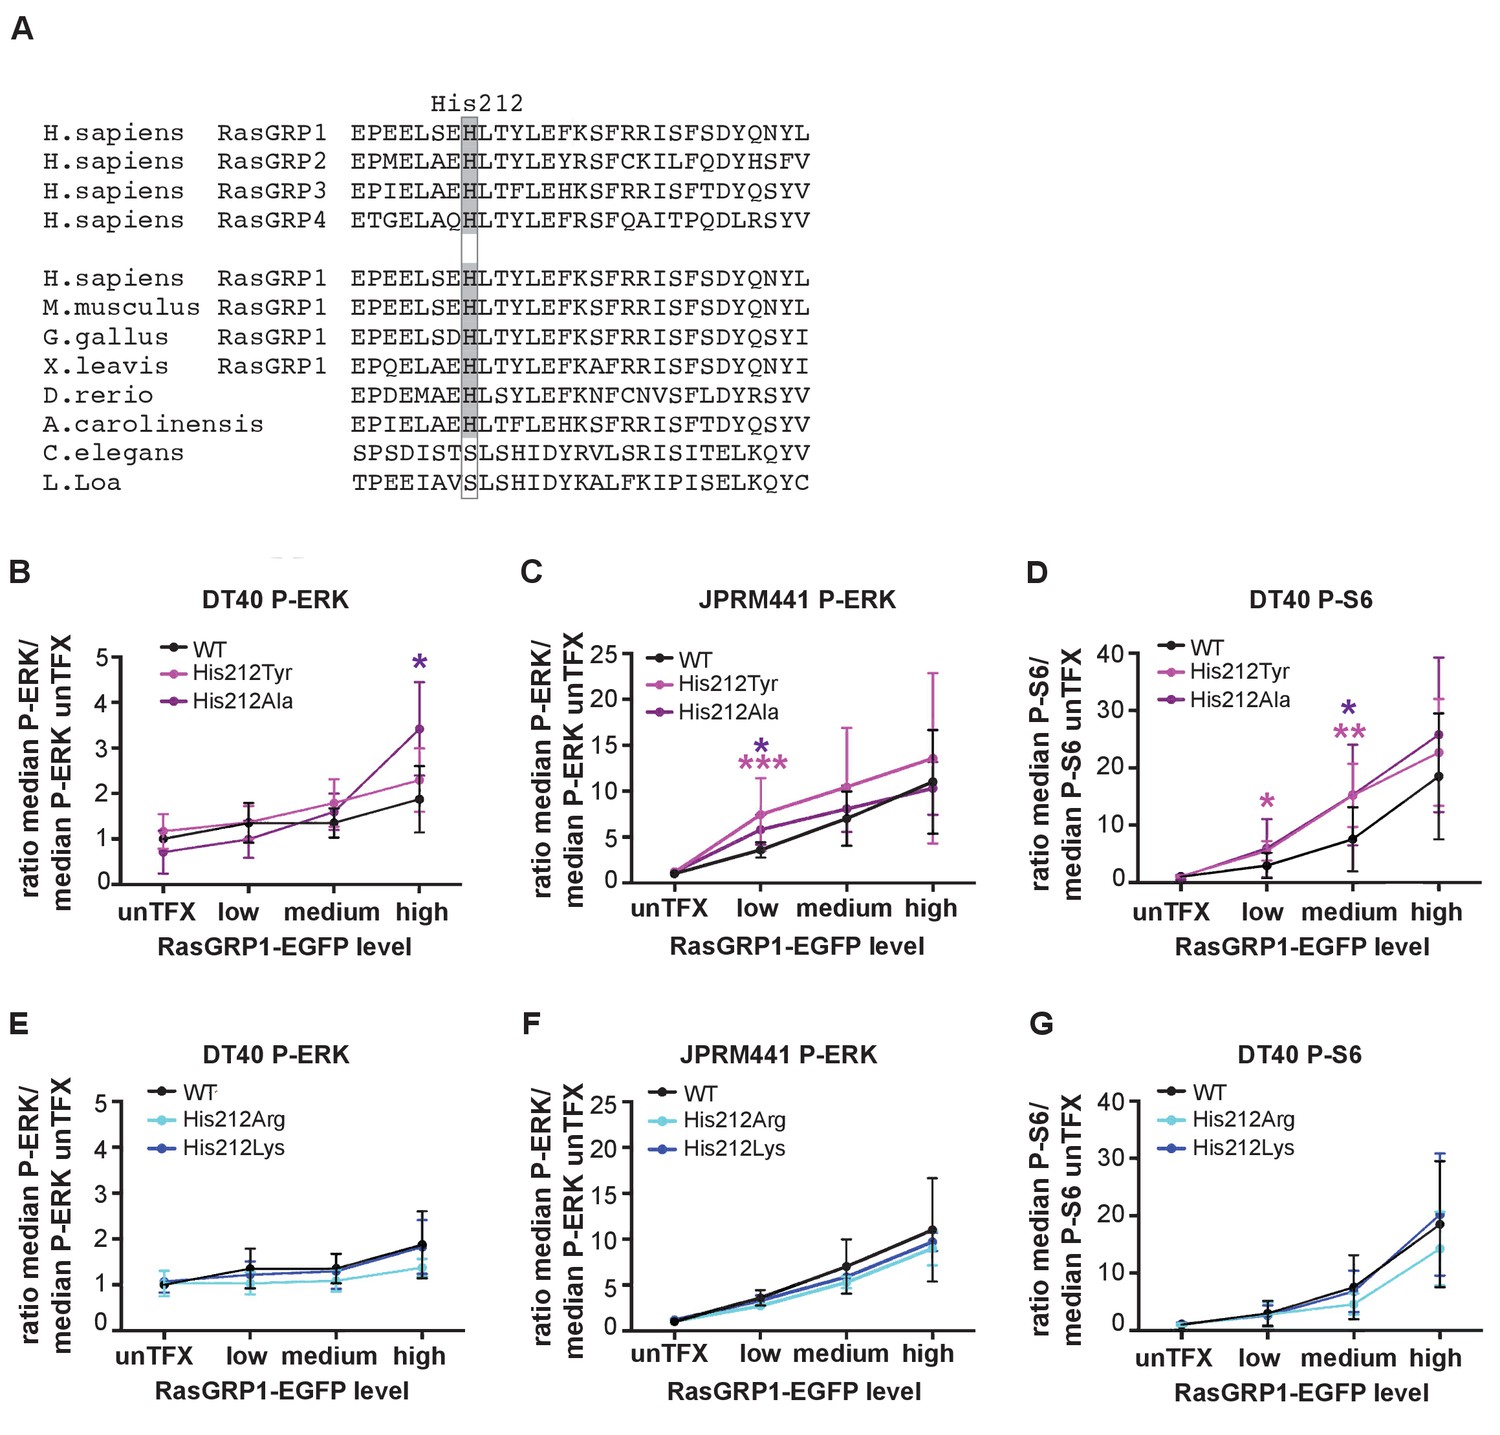
A neutral charge on Histidine 212 in RasGRP1 enhanced basal activity.
(A) Alignment of RasGRP isoforms and RasGRP1 sequences in different species to determine conserved residues. His 212 conservation is indicated by grey color. (B–G) Low RasGRP1-expressing Jurkat cells (JPRM441), or RasGRP1−/−RasGRP3−/− DT40 cells were transfected with wildtype- or variants of EGFP-RasGRP1. (B–D) His 212 was mutated into neutrally charged residues (His 212 Ala, His 212 Tyr), or (E–G) into positively charged residues (His 212 Arg, His 212 Lys). RasGRP1 signaling was determined by levels of phosphorylated ERK (P-ERK) and S6 (P–S6). Shown are average median levels of P-ERK and P-S6, corrected for untransfected cells for each experiment, to prevent experimental fluctuation in fluorescent signal. (Figure 2B and E: WT N = 8, His 212 Tyr N = 8, His 212 Ala N = 6, His 212 Arg N = 3, His 212 Lys N = 3, Figure 2C and F: WT N = 10, His 212 Tyr N = 7, His 212 Ala N = 7, Figure 2D and G: WT, His 212 Arg, His 212 Lys, all N = 6). Kruskal-wallis test was used, with post-test Dunn's multiple comparisons, comparing each mutant to WT (*p<0.05), **p<0.01, ***p<0.001).
Figure 2—figure supplement 1
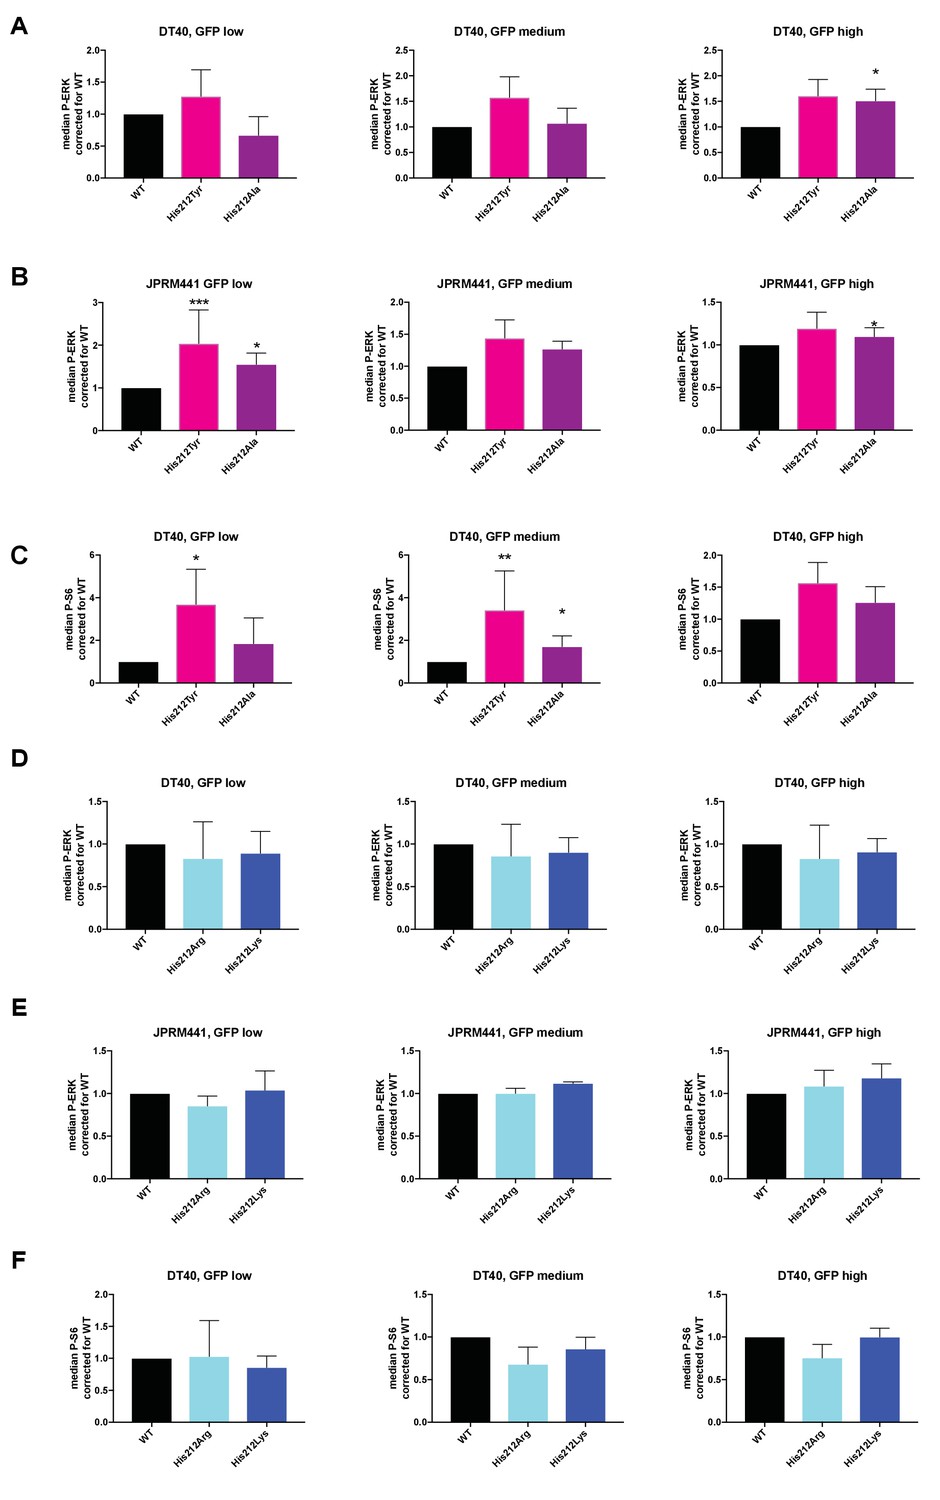
Analyses of RasGRP1 level-dependent effects on ERK- and S6-kinase pathway activation.
(A–F) His 212 was mutated into neutrally charged residues (His 212 Ala, His 212 Tyr), or into positively charged residues (His 212 Arg, His 212 Lys). RasGRP1 signaling was determined by levels of phosphorylated ERK (P-ERK) and S6 (P–S6). Graphs depict fold changes of P-ERK or P-S6 relative to Wildtype for the different expression levels (low, medium, or high) of RasGRP1-EGFP. (A and D: WT N = 8, His 212 Tyr N = 8, His 212 Ala N = 6, His 212 Arg N = 3, His 212 Lys N = 3, B and E: WT N = 10, His 212 Tyr N = 7, His 212 Ala N = 7, C and F: WT, His 212 Arg, His 212 Lys, all N = 6). Kruskal-wallis test was used, with post-test Dunn's multiple comparisons, comparing each mutant to WT(*p<0.05), **p<0.01, ***p<0.001).
Figure 3 with 1 supplement
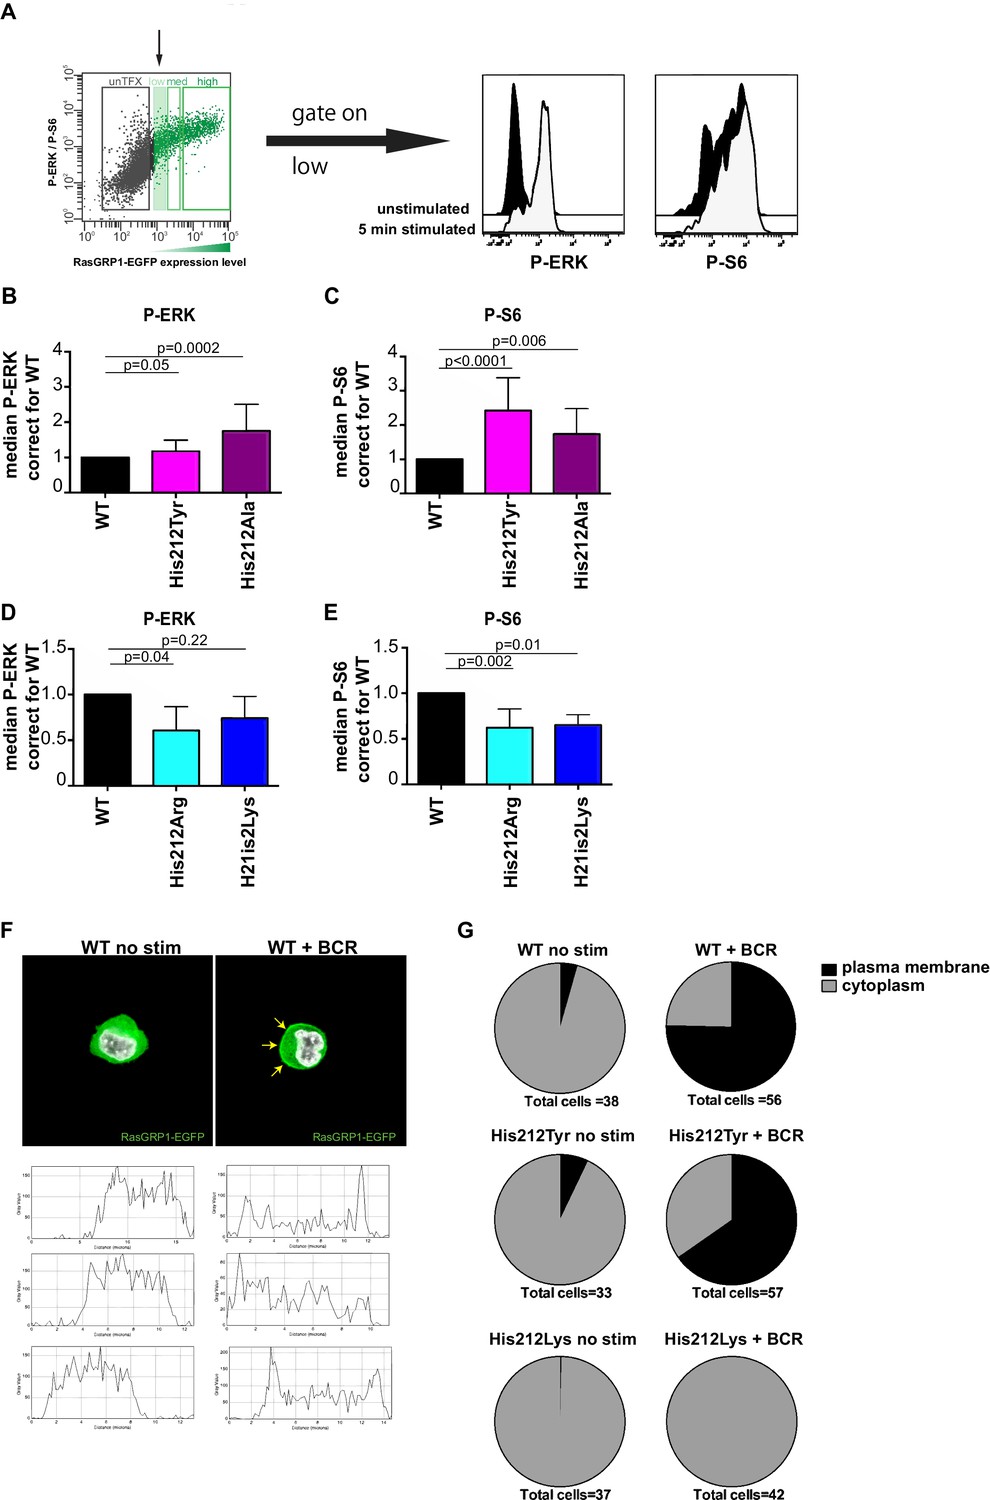
A constitutive positive charge on His 212 in RasGRP1 reduces kinase signaling and prevents RasGRP1 plasma membrane recruitment.
(A) Assay to determine RasGRP1 activity in receptor stimulated cells using RasGRP1-/-RasGRP3-/- DT40 cells, BCR stimulation, and gating on low levels of transfected RasGRP1-EGFP. (B–E) Effects of H212 mutations on RasGRP1 activity were tested upon B cell receptor (BCR) stimulation. Shown are average median levels of P-ERK and P-S6 in EGFP-low expressing cells, corrected for wildtype stimulated cells. WT was set on 1.0. Kruskal-wallis test (Figure 3C and D; WT N = 10, His 212 Tyr/Ala N = 7, Figure 3D and E; all N = 6) was used, with post-test Dunn's multiple comparisons, comparing each mutant to WT. P-values are shown. All graphs show mean ±SD. (F) Localization of full length expressed RasGRP1-EGFP in DT40 RasGRP1−/− RasGRP3−/− cells, showing basal state (no stim, cytoplasmic), and upon B cell receptor stimulation (+BCR, arrows indicate plasma membrane localization). Below, representative profiles of expression are shown, peaks on the left and/or right side indicate membrane localization. (G) Membrane localization of WT, and mutants His 212 Tyr, His 212 Lys RasGRP1 was determined by microscopy analysis of unstimulated and BCR stimulated cells. Pie charts depict average individual cell counts analyzed in 3 separate experiments. Total number of cells analyzed under each condition are listed below charts.
Figure 3—figure supplement 1
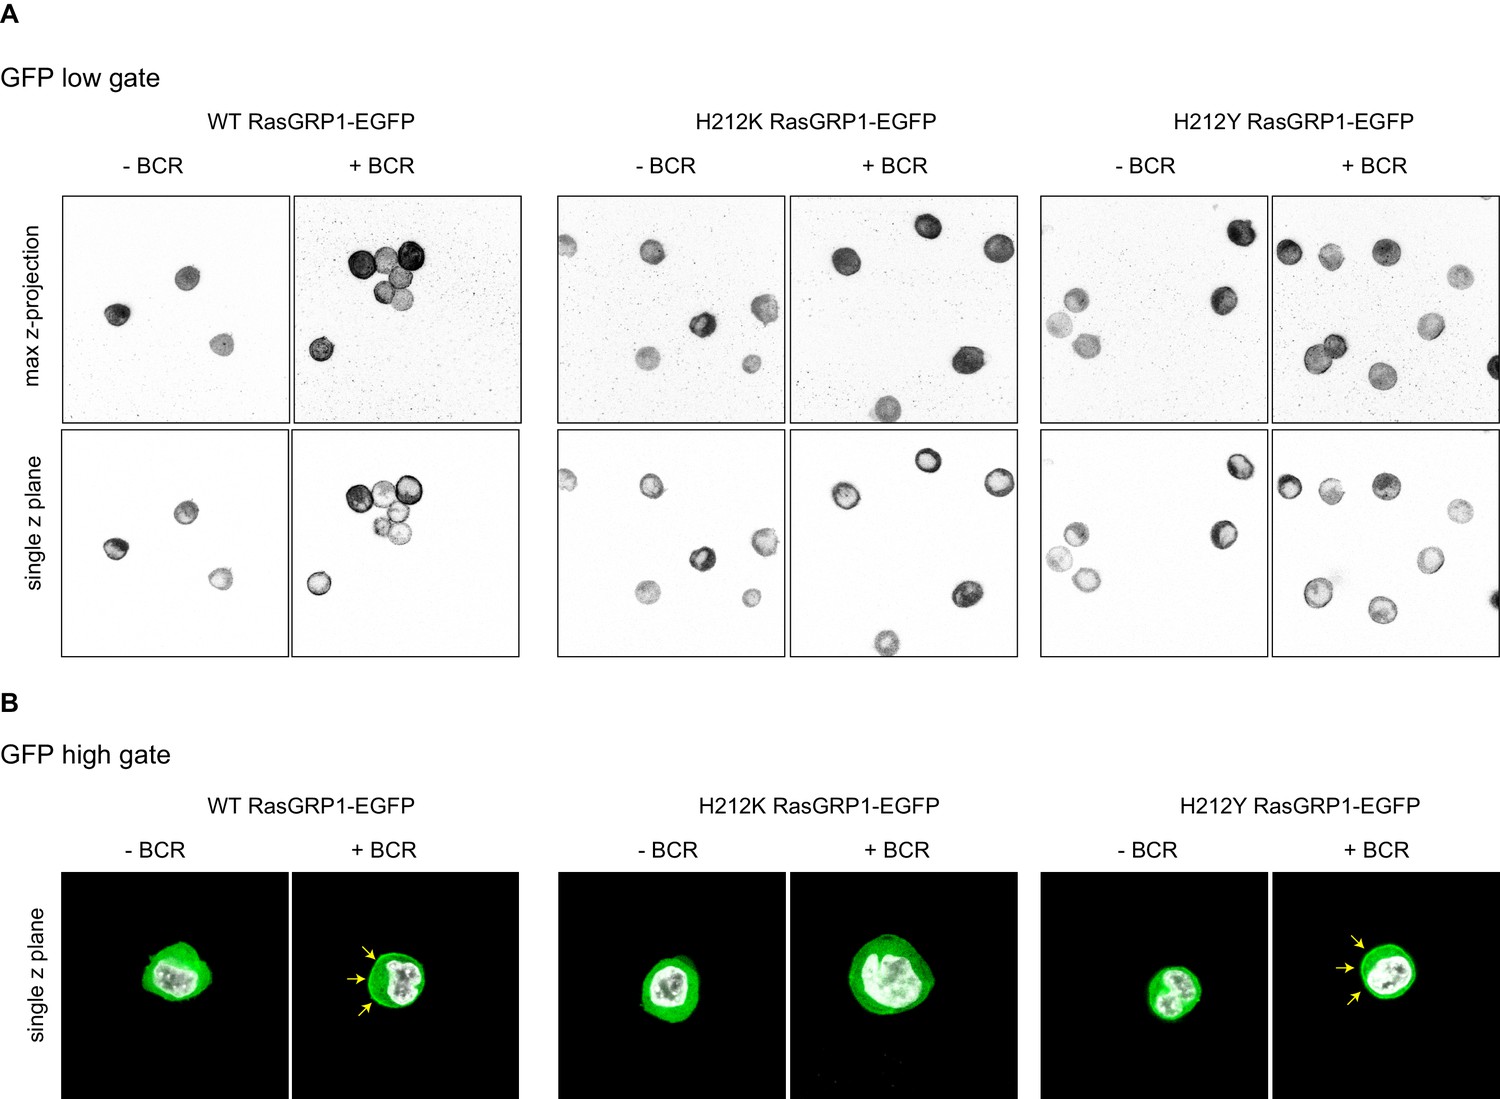
Analyses of cellular RasGRP1 localization as a function of His 212 variation.
(A) Shown are representative examples of microscopy analyses of RasGRP1-EGFP low expressing DT40 RasGRP1−/− RasGRP3−/− cells without and with B cell receptor (BCR) stimulation. The top row shows the total maximum Z-projection, and the bottom row shows a single z-plane, which was used for counting. (B) Shown are representative examples of microscopy analysis of high RasGRP1-EGFP expressing cells. The signal shows localization of full length expressed RasGRP1-EGFP wildtype (WT) and mutants (His212Lys, His212Tyr), showing basal state (no stim, cytoplasmic), and upon B cell receptor stimulation (+BCR, arrows indicate plasma membrane localization).
Figure 4
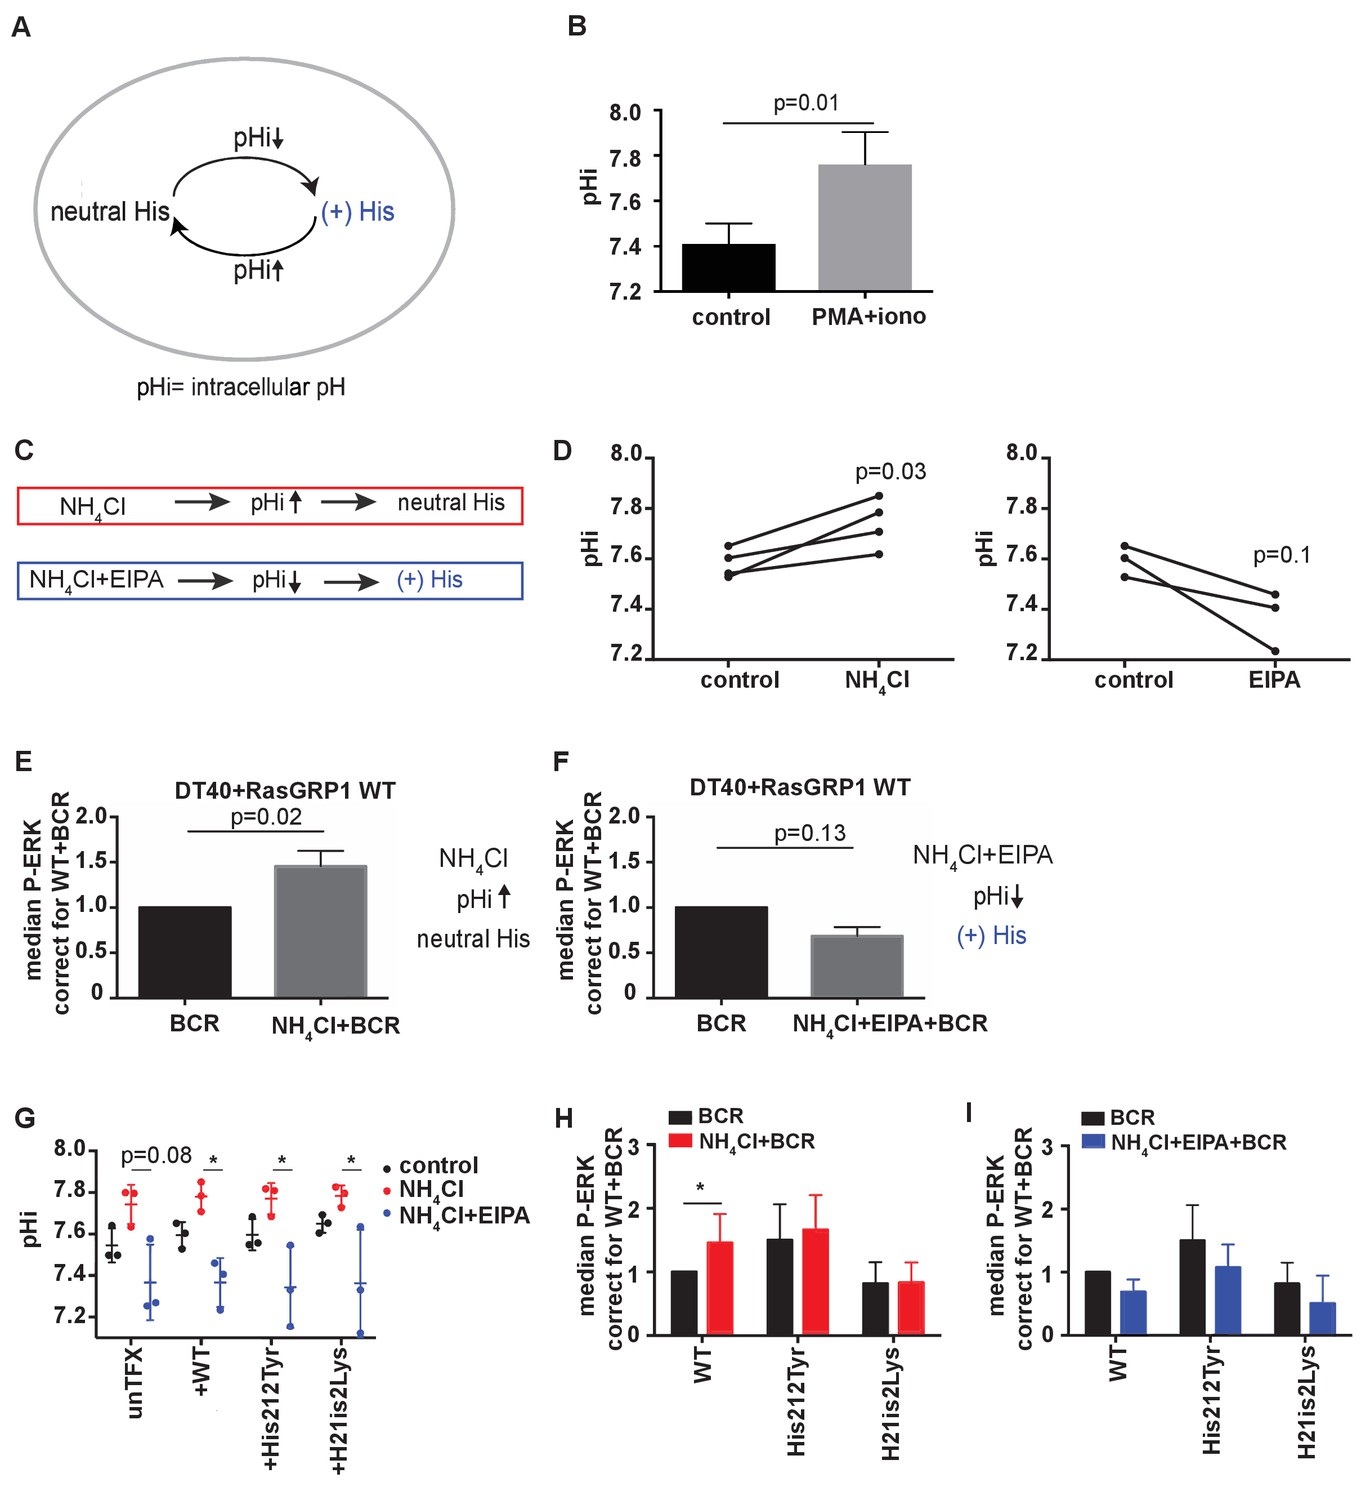
His 212 in RasGRP1 is a pH sensor.
(A) Intracellular pH (pHi) influences the charge of histidines (His). Low pHi shifts equilibrium towards protonated histidine (His+), while in high pHi conditions equilibrium shifts towards deprotonated histidine (His neutral). (B) Intracellular pH (pHi) was measured upon PMA +ionomycin stimulation in DT40 cells. Shown are means ±SD (N = 3). Paired T-test was performed, p-value is shown. (C) NH4Cl (NH4Cl) increases pHi, resulting in a neutral Histidine, while NH4Cl loading and washing, followed by EIPA (NH4Cl + EIPA) decreases pHi leading to a protonated Histidine. H212Y mimics neutrally charged histidine, and H212K mimics protonated histidine. (D) DT40 RasGRP1−/−RasGRP3−/− cells transfected with wildtype (WT) RasGRP1-EGFP were treated with NH4Cl (N = 4) or with NH4Cl + EIPA (N = 3). pHi was determined in triplicates of controls and treated cells. Individual experiments are shown. Paired T-test was performed. (E, F) NH4Cl, NH4Cl + EIPA, and control treatment was followed by B cell receptor (BCR) stimulation. Shown are average median levels ± SD of P-ERK in EGFP-low expressing cells, corrected for wildtype BCR stimulated cells. WT was set on 1.0. (BCR, NH4Cl: N = 7, NH4ClL + EIPA: N = 4). Wilcoxon test was performed. (G) pHi was determined in untransfected and cells transfected with WT or mutant RasGRP1-EGFP. Shown are means ±SD (N = 3). Kruskal-Wallis tests were performed with post-test Dunn's multiple comparisons between control, NH4Cl and NH4Cl + EIPA for each unTFX, or transfected RasGRP1 WT or mutant. P-values are depicted for p<0.2. All other P-values showed no significance and are not indicated. (H, I) RasGRP1-EGFP His 212 variant and WT transfected cells were treated with control, NH4Cl, followed by B cell receptor (BCR) stimulation. Shown are average median levels of P-ERK in EGFP-low expressing cells, corrected for wildtype BCR stimulated cells. WT +BCR was set on 1.0. Shown are means ±SD (BCR, NH4Cl: N = 7, NH4CL + EIPA: N = 4). Wilcoxon test was performed to test differences.
Figure 5 with 1 supplement
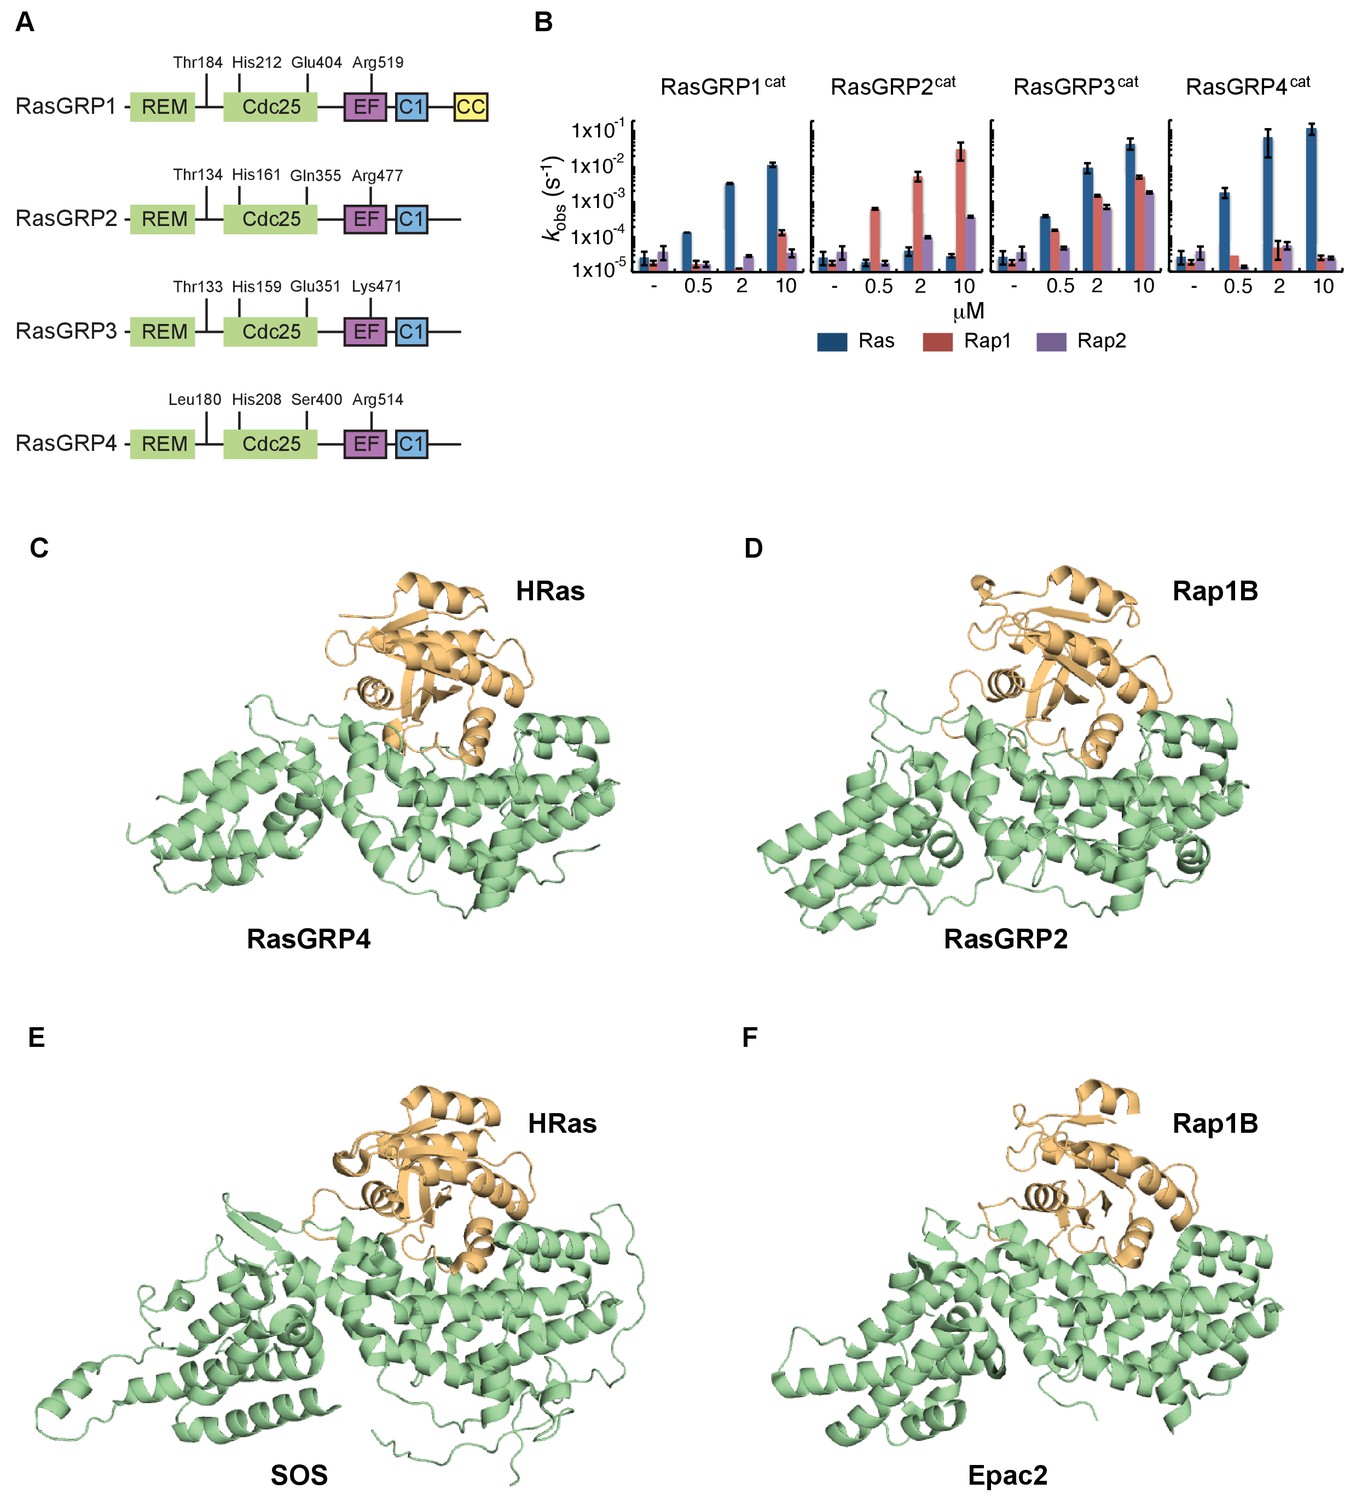
RasGRP substrate specificity and active GEF structures.
(A) Cartoon showing the four RasGRP isoforms, with key conserved regulatory residues indicated. (B) RasGRP isoform specificity for GTPases HRas, Rap1B, and Rap2A was tested by in vitro nucleotide exchange assays. Shown are the GDP-GTP exchange rates in time for RasGRP-1, -2, -3, and -4 catalytic domains (RasGRPcat, consisting of the REM and Cdc25 domains), in different concentrations (x-axis), for Ras (blue) Rap1B (red), Rap2A (purple). (C–F) Structures of RasGEF (green) – GTPase (orange) complexes are shown with cartoon representation for comparison. RasGRP4:HRas (C) and RasGRP2:Rap1B (D) complex structures were determined by this study. (E) HRas bound to the catalytic site of SOS and SOScat domain of the SOScat:HRas complex is extracted from PDB ID:1NVV (Margarit et al., 2003). (F) The structures of REM-cdc25 domain of Epac2 and Rap1B in Epac2:Rap1B complex are extracted from PDB ID:3CF6 (Rehmann et al., 2008).
-
Figure 5—source data 1
Crystallographic table (RasGRP).
- https://doi.org/10.7554/eLife.29002.011
Figure 5—figure supplement 1
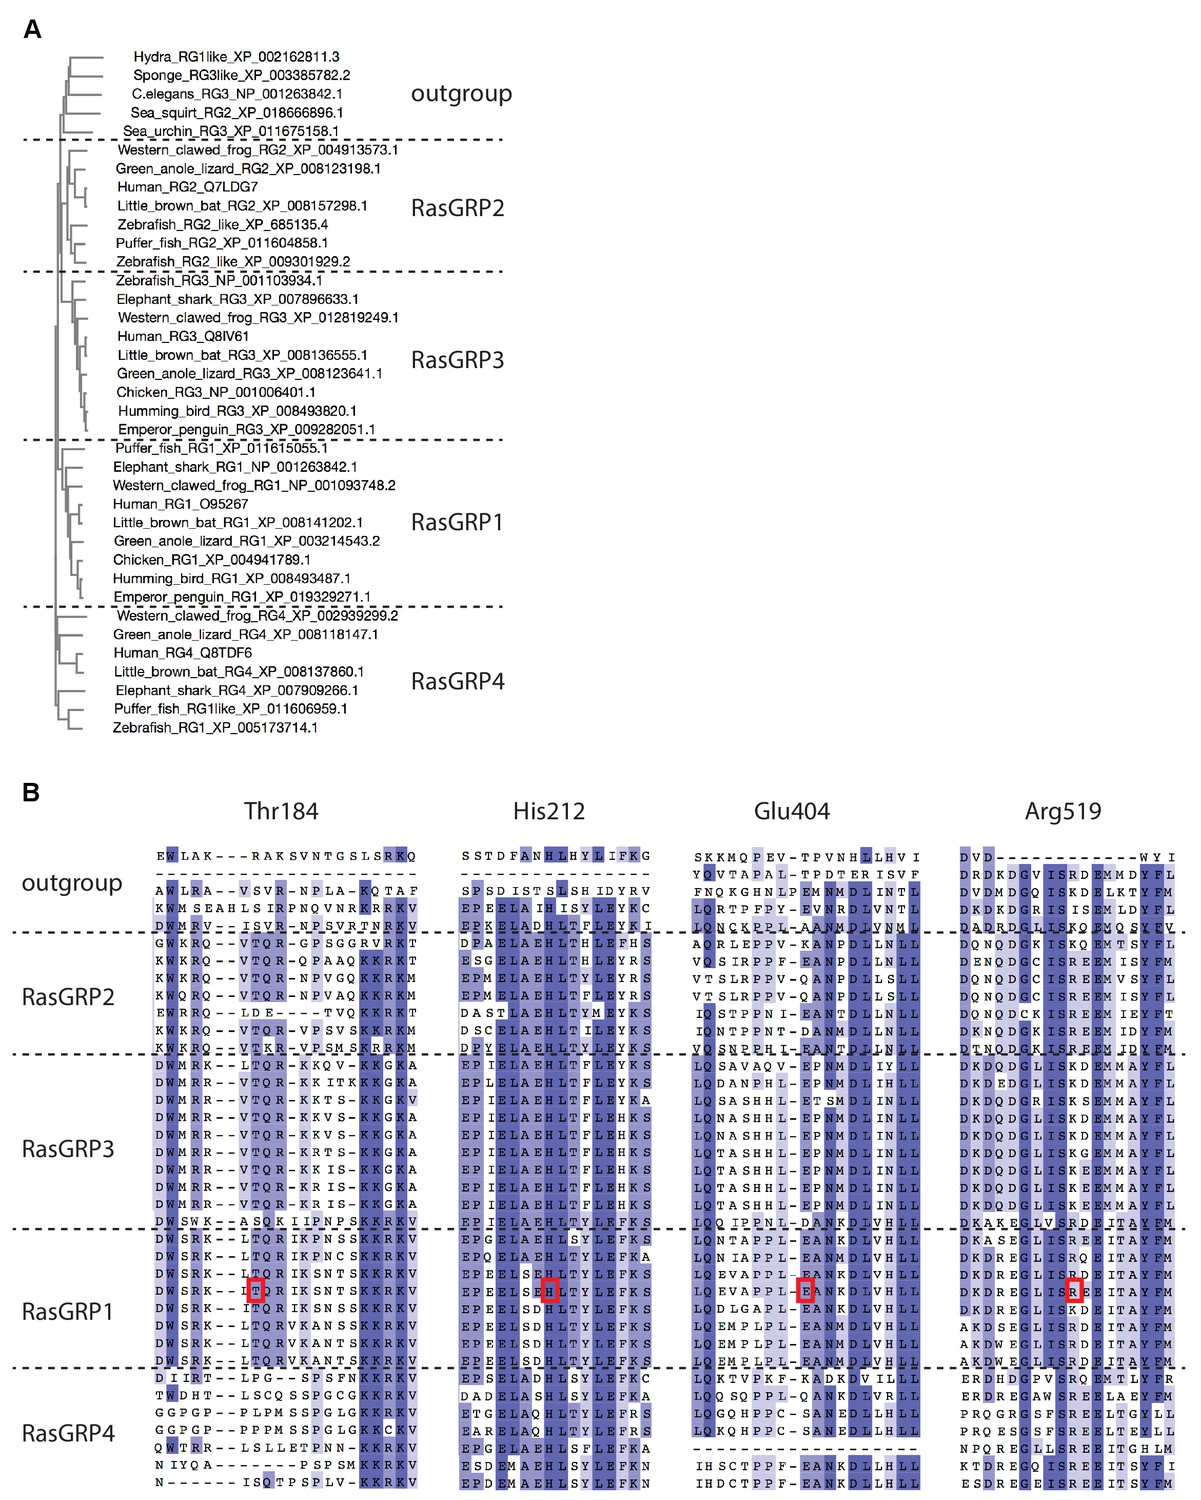
Sequence comparison of RasGRP homologs.
(A) The phylogenetic tree of RasGRP homologs was generated by MUSCLE (Please cite Li et al. 2015, Nucleic Acids Research, 43, W580-4.). Each gene is annotated by the organism common name followed by NCBI gene name and sequence ID. RasGRP homologs from lower organisms form a distinct outgroup. (B) Sequence alignment of the RasGRP isoforms was generated by MUSCLE. The human RasGRP1 residues shown in Figure 5A are highlighted with red boxes.
Figure 6
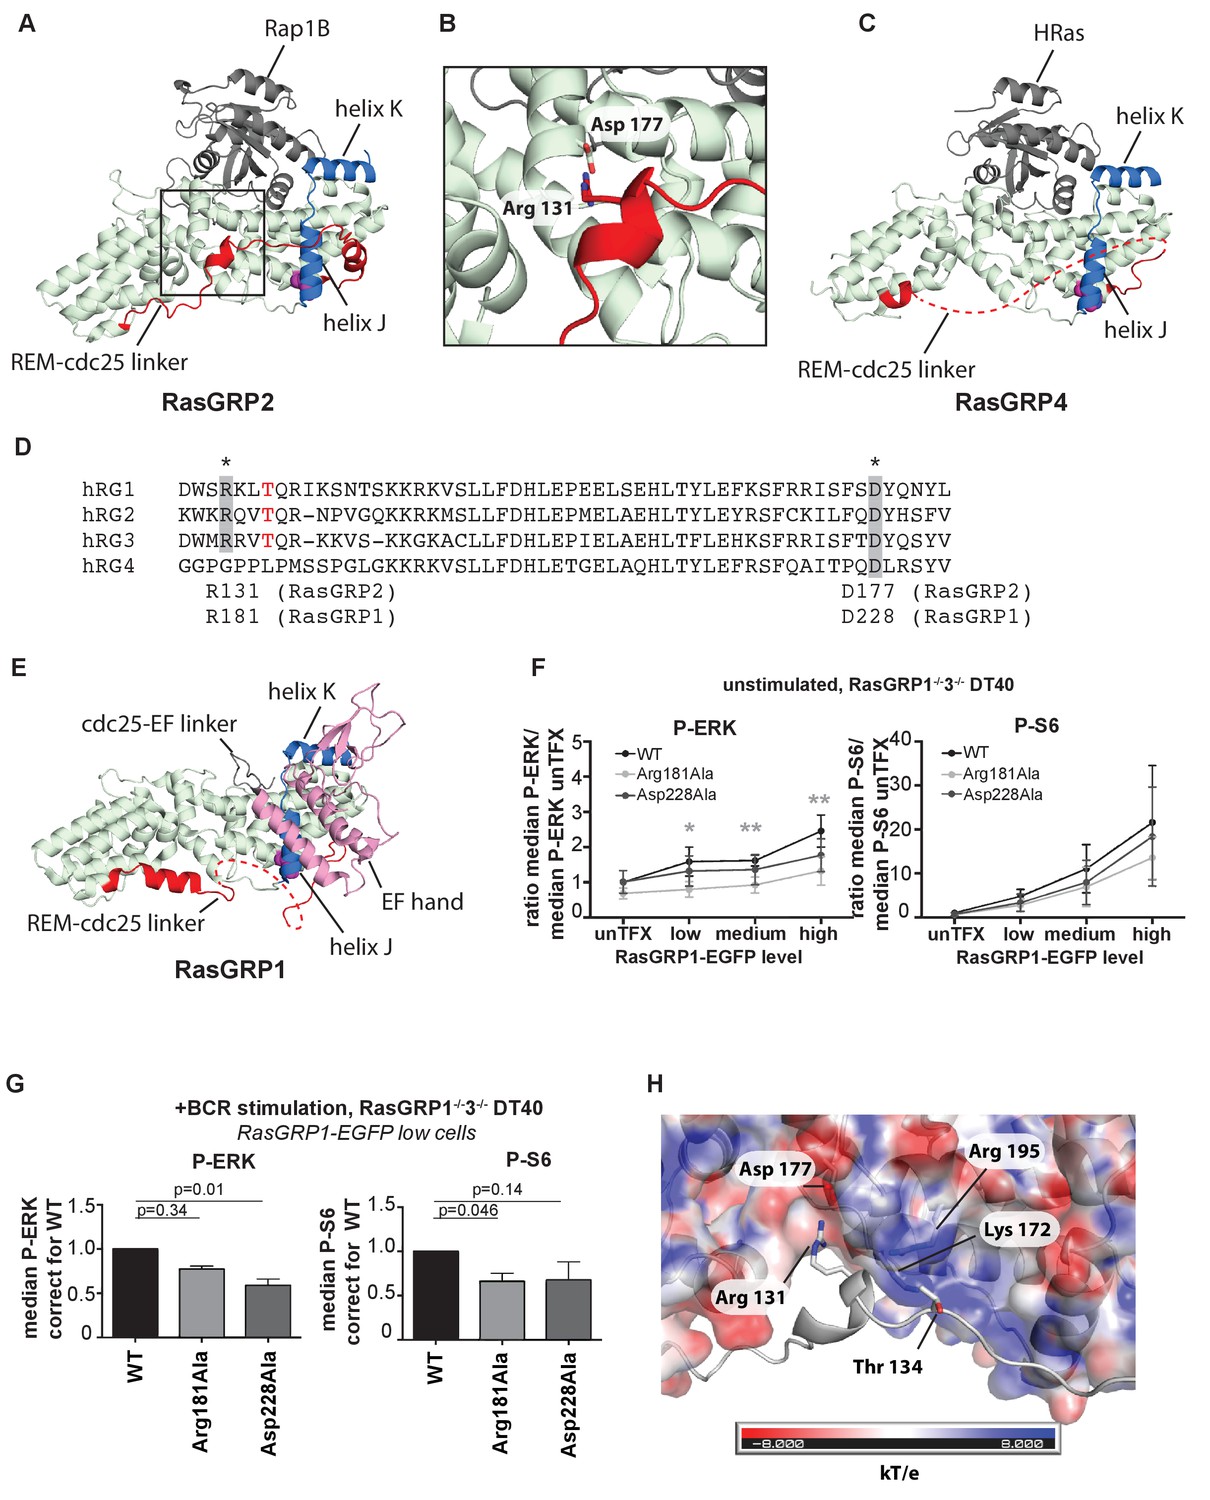
A conserved, stabilizing salt-bridge maintains RasGRP1 activity.
(A) The RasGRP2:Rap1B complex structure is shown with the same orientation as Figure 5D. Important structural elements surrounding His 161 are highlighted (REM-cdc25 linker; red, helix J and K; blue, His 161; magenta). (B) Close-up view of the area highlighted by a box in Figure 6A is shown, and an ion-pair formed by Arg 131 and Asp 177 is shown. (C) The RasGRP4:HRas complex structure is shown with the same orientation as Figure 5C. The dashed line indicates the disordered Rem-cdc25 linker. His 208 and other structural elements are highlighted as Figure 6A. (D) Alignment of RasGRP isoforms, highlighting RasGRP2's Arg 131 and Asp 177 in grey as conserved residues corresponding to Arg 181 and Asp 228 in RasGRP1. The RasGRP1 phosphorylation site Thr 184 is in red. (E) The RasGRP1 structure (PDB ID: 4L9M [Iwig et al., 2013];) is shown with the same orientation as Figure 6A. and Figure 6C. The structural elements are colored as Figure 6A and C with additional elements (cdc25-EF linker; gray, EF hand and C1 domains; pink). (F) DT40 RasGRP1−/−RasGRP3−/− cells were transfected with RasGRP1-EGFP WT or variants Arg 181 Ala, Asp 228 Ala. The basal signaling activity of RasGRP1 WT and variants was determined. Shown are average median basal levels of P-ERK and P-S6, corrected for untransfected cells. Kruskal-wallis test was used, with post-test Dunn's multiple comparisons, comparing each mutant to WT. All graphs show mean ±SD (N = 5). *p<0.05, **p<0.01. (G) Cells were unstimulated, or stimulated for 5 min with anti-B cell receptor antibody (clone M4). Only RasGRP1-EGFP low expressing cells were analyzed. Shown are average median levels of P-ERK and P-S6 in EGFP-low expressing cells, corrected for wildtype (WT). WT is set on 1.0. Kruskal-Wallis test was used with post-test Dunn's multiple comparisons, comparing each variant to WT. All graphs show mean ±SD (N = 3), P-values are shown. (H) Electrostatic surface potential of RasGRP2 except the REM-Cdc25 linker, calculated by APBS (Baker et al., 2001), is shown. The REM-Cdc25 linker is shown with cartoon model.
Figure 7 with 1 supplement
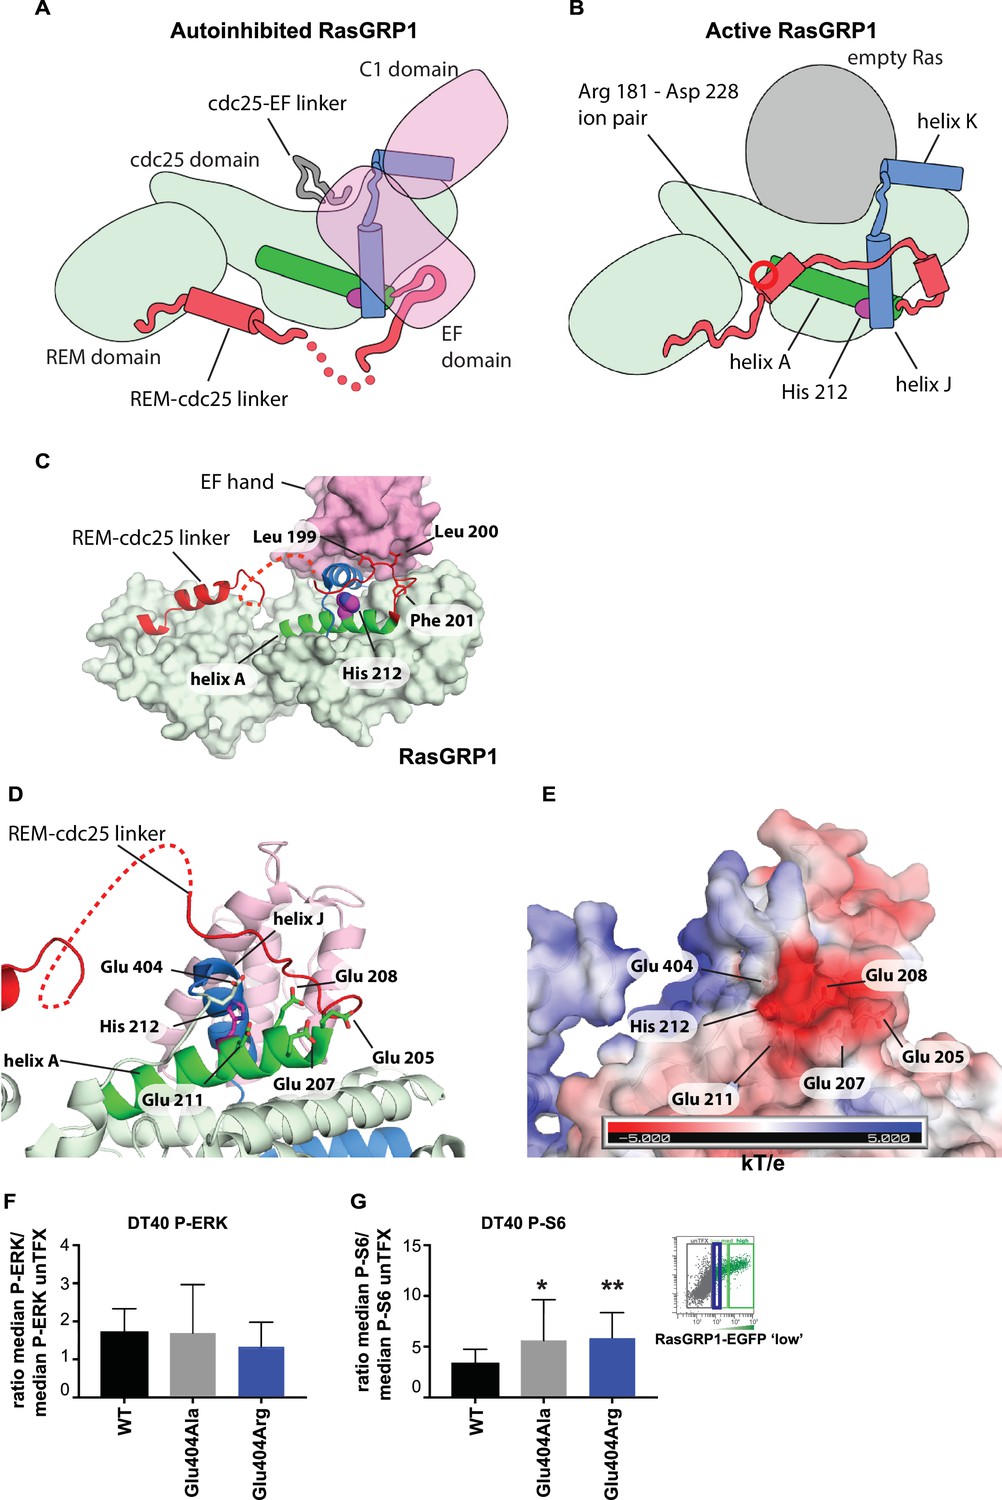
His 212 – Glu 404 pair and transition from inactive to active RasGRP1.
(A, B) Schematic diagram of RasGRP1 conformations. Color scheme is the same as Figure 6A,C and E. In the autoinhibited form (A), the cdc25-EF linker sits in the Ras binding site and the EF domain docks on the cdc25 domain. The active form of RasGRP1 (B) is extrapolated from the active RasGRP2-Rap1B structure. The Rem-cdc25 linker is stabilized by an ion-pair formed by Arg 181 and Asp 228. (C) The interaction between the REM-cdc25 linker and the EF hand is shown. Leu 199 and Leu 200 are stacked on the EF hand domain, while Phe 201 is inserted into a hydrophobic pocket in the cdc25 domain. (D) His 212 and surrounding acidic residues in RasGRP1 are shown. (E) Electrostatic surface potential of RasGRP1 is shown with the same view as Figure 7D. (F, G) Basal signaling activity of RasGRP1 WT and Glu 404 variants in RasGRP1-/-RasGRP3-/- DT40 cells. Shown are average median levels of P-ERK (F) and P-S6 (G), corrected for wildtype in RasGRP1-EGFP low expressing cells. Friedman test was used, with post-test Dunn's multiple comparisons, comparing each mutant to WT. (N = 6. All graphs show mean ±SD. *p<0.05 and **p<0.01.
Figure 7—figure supplement 1
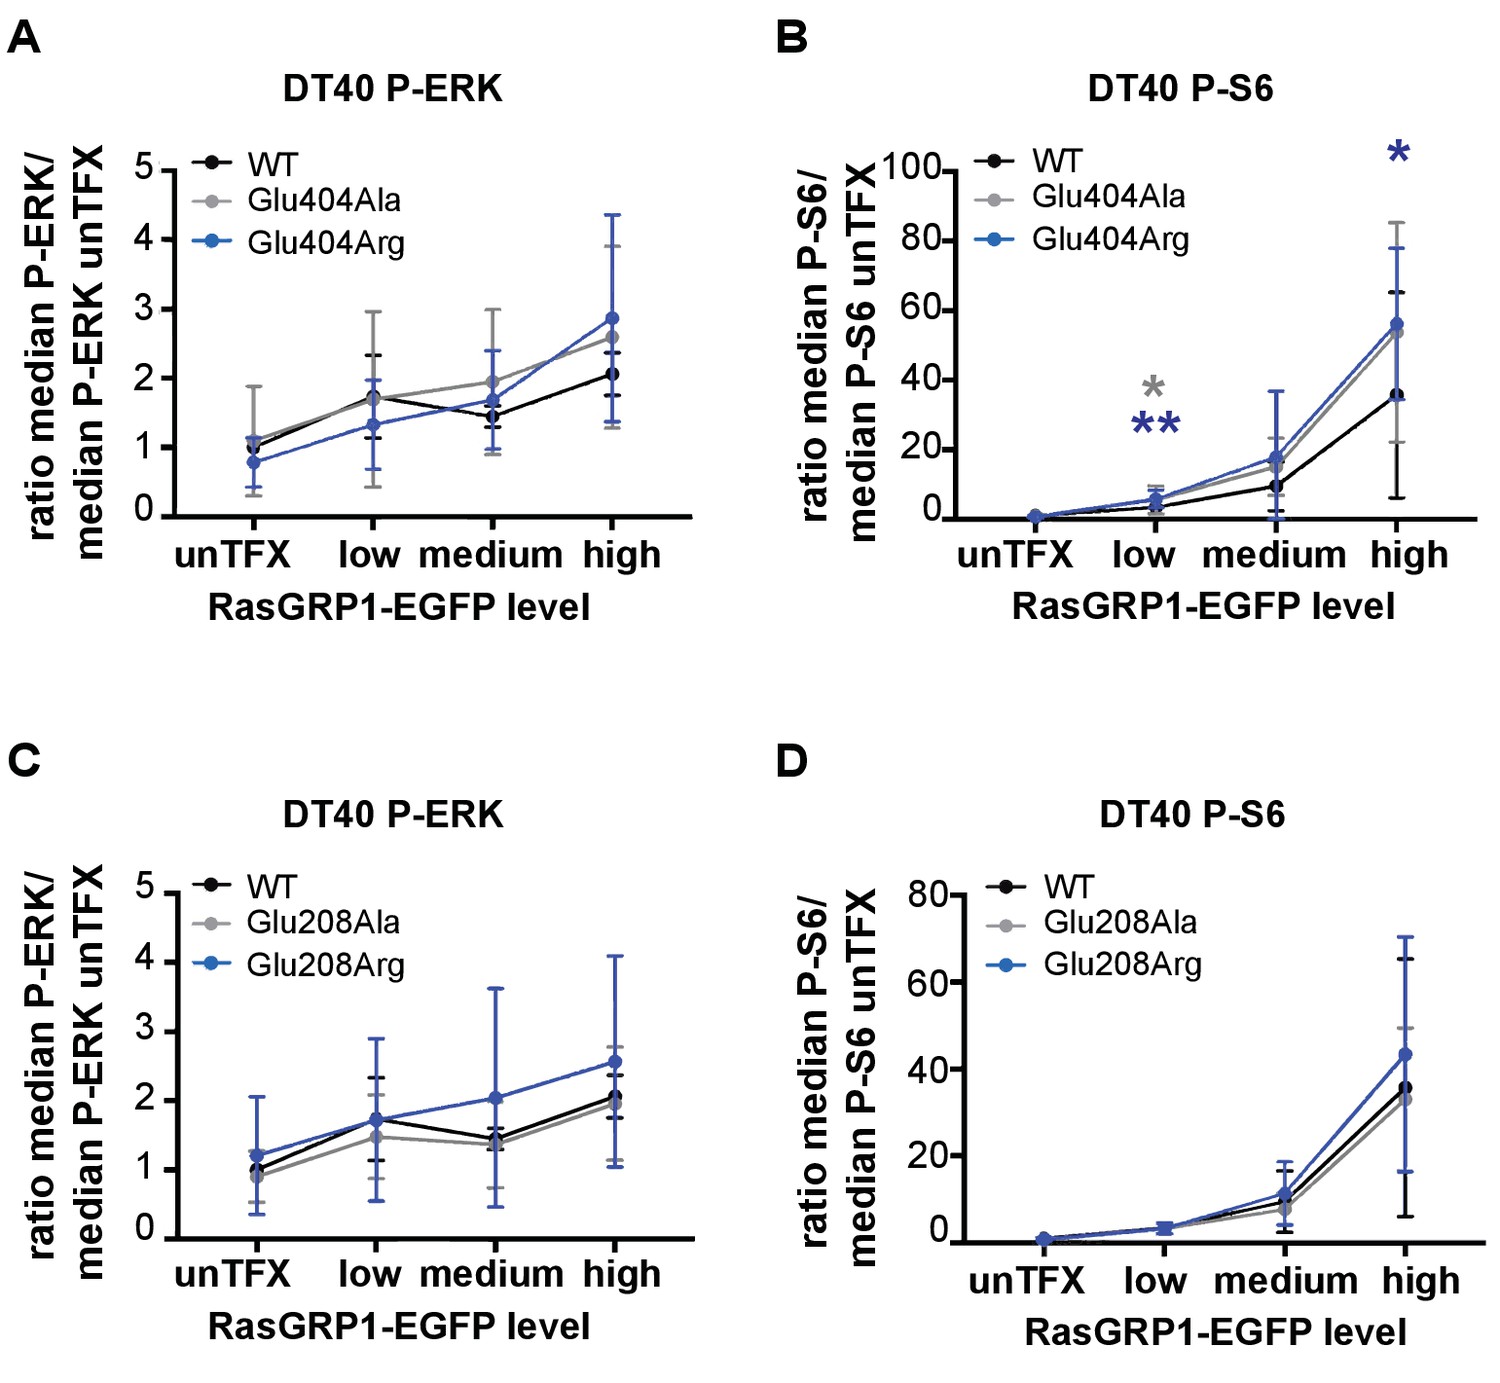
Basal signaling activity of RasGRP1 WT and Glu 404 (A,B), or Glu208 (C,D) variants in RasGRP1−/−RasGRP3−/− DT40 cells.
Shown are average median levels of P-ERK (A, C) and P-S6 (B, D), corrected for untransfected cells for each experiment. Friedman test was used, with post-test Dunn's multiple comparisons, comparing each mutant to WT. (RasGRP1 low N = 6, RasGRP1 medium (N = 5 for P-ERK, N = 6 for P-S6), RasGRP1 high (N = 4). All graphs show mean ±SD. *p<0.05 and **p<0.01.
Figure 8
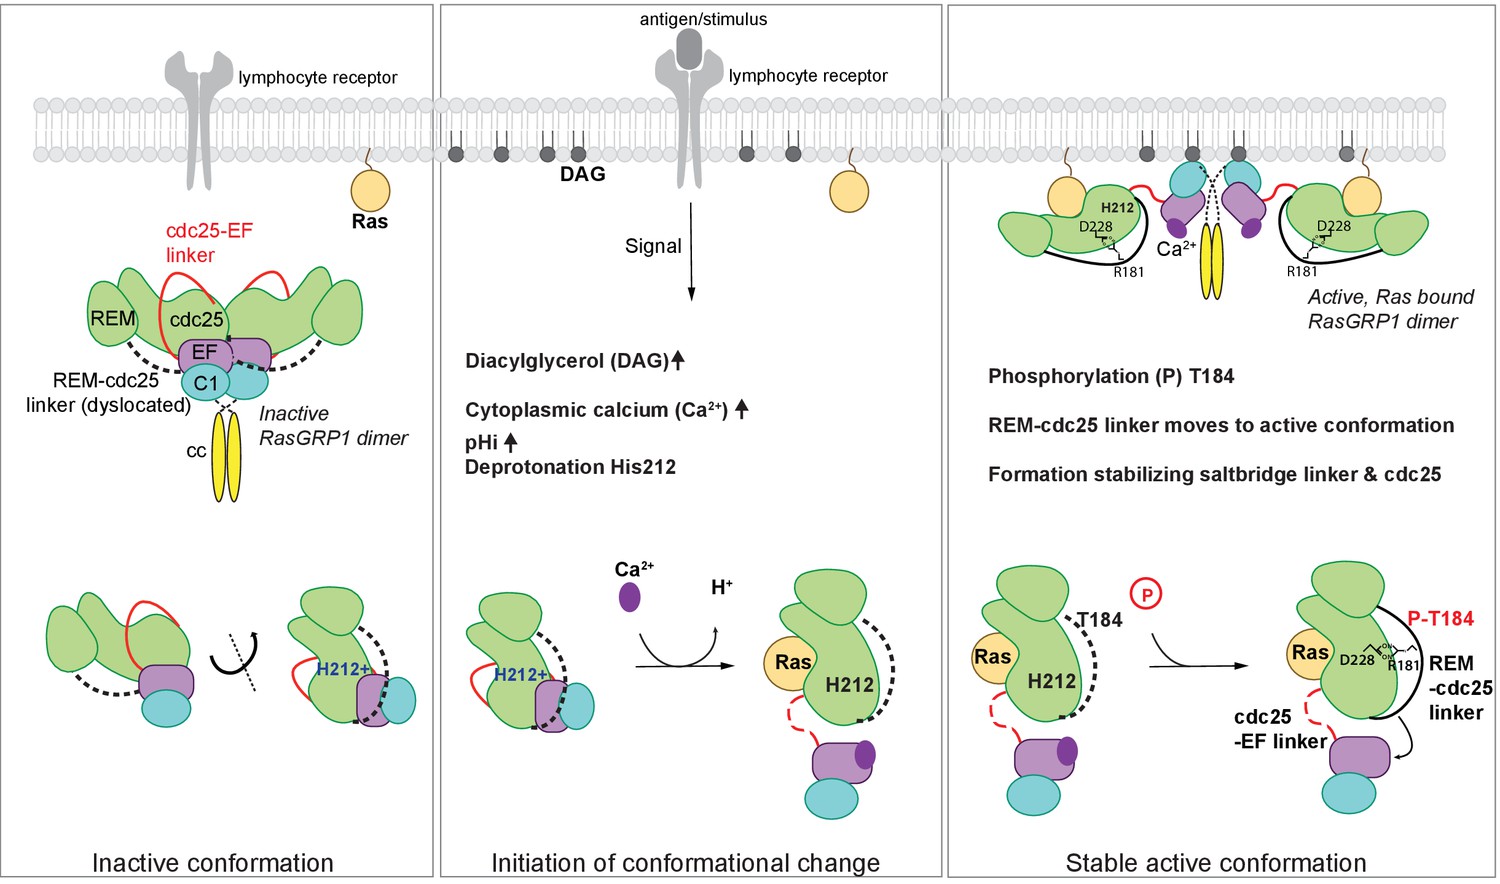
Model of RasGRP1 regulation.
(Left) In resting cells, RasGRP1's basal activity is autoinhibited through a dimer; the Cdc25-EF linker (red) blocks the Ras binding site, and the EF hands (purple) prevent C1 domains (cyan) from binding diacylglycerol (DAG), and thus block membrane recruitment. (Middle) Upon receptor stimulation, DAG- and intracellular calcium- levels are induced and the intracellular pH (pHi) increases, which we propose leads to deprotonation of His 212, calcium binding to the EF-hand, and initiation of a conformational change that allows for binding to DAG at the membrane. (Right) Formation of a stable, active RasGRP1 conformation. Phosphorylation of Thr 184 promotes the proximity of the REM-Cdc25 linker (black) with the positively charged patch in the Cdc25 domain of RasGRP1. At the same time, a salt-bridge is formed between Asp 228 and R181 to stabilize the active conformation.
Tables
Table 1
Estimated pKa values.
https://doi.org/10.7554/eLife.29002.015| Estimated pKa values | ||||||
|---|---|---|---|---|---|---|
| Residue no. | wild-type | E208A | E211A | E404A | E205A, E207A, E208A, E211A | E205A, E207A, E208A, E211A, E404A |
| His 212 | 6.90 | 6.81 | 6.71 | 6.71 | 6.44 | 6.12 |
| His 286 | 6.56 | 6.55 | 6.55 | 6.55 | 6.53 | 6.52 |
| His 303 | 6.83 | 6.83 | 6.83 | 6.83 | 6.82 | 6.82 |
| His 315 | 6.17 | 6.16 | 6.16 | 6.17 | 6.15 | 6.15 |
| His 318 | 6.26 | 6.26 | 6.26 | 6.26 | 6.26 | 6.26 |
| His 358 | 6.57 | 6.57 | 6.56 | 6.57 | 6.56 | 6.56 |
| His 381 | 6.27 | 6.27 | 6.27 | 6.27 | 6.27 | 6.27 |
| His 389 | 6.58 | 6.58 | 6.58 | 6.58 | 6.58 | 6.58 |
| His 411 | 6.23 | 6.22 | 6.22 | 6.22 | 6.21 | 6.20 |
Download links
A two-part list of links to download the article, or parts of the article, in various formats.
Downloads (link to download the article as PDF)
Open citations (links to open the citations from this article in various online reference manager services)
Cite this article (links to download the citations from this article in formats compatible with various reference manager tools)
A Histidine pH sensor regulates activation of the Ras-specific guanine nucleotide exchange factor RasGRP1
eLife 6:e29002.
https://doi.org/10.7554/eLife.29002


