The rate of transient beta frequency events predicts behavior across tasks and species
- Brown University, United States
- Providence VA Medical Center, United States
Figures
Figure 1 with 1 supplement

Average 1 s prestimulus beta (15–29 Hz) power is higher on non-detected/attend out trials in SI.
(i) Mean prestimulus beta power as a function of time relative to stimulus onset in (A) human MEG during a tactile detection task (source localized data from hand area of SI; N = 10 subjects, 100 detected and non-detected trials per subject), (B) mouse LFP during a vibrissae deflection detection task (barrel cortex; N = 10 sessions, a mean of 120 (range 106 ~ 160) detected and non-detected trials per session, in each session the number and stimulus amplitude for detected and non-detected trials were matched), and (C) human MEG during a cued spatial attention task (source localized data from the hand area of SI; N = 10 subjects, 100 detected and non-detected trials per subject). 7-cycle Morlet wavelet was convolved across the 1 s prestimulus window on each trial and shown only for −900~−100 ms of the 1 s prestimulus period to circumvent regions affected by edge effects. Mean ±standard error of the mean (SEM) error bar across subjects/sessions for non-detected/attend out (red) and detected/attend in (blue) trials. Grey shaded regions show significance across subjects/sessions at p<0.05 (pointwise right-tailed Wilcoxon signed rank test). (ii) Trials were sorted from low to high trial mean prestimulus beta power (21-trial bins sliding in 1-trial steps). For each bin, hit rate and attend-in rate were calculated as percent change from mean (PCM) (mean ±SEM across subjects/sessions). (iii) Trial mean prestimulus beta power pooled across each behavioral condition (units are factor of median, FOM; grey open circles: individual subject/session means; red and blue x: grand mean ±SEM across subjects/sessions). Asterisks denote p<0.05 right-tailed paired t-test, and d = Cohen’s d effect size. (iv) Box and whisker plots of distribution of detect probability (DP)/attend probability (AP) across subjects/sessions (colored ○: each subject/session). The numbers in parentheses at the top denote the percentage of subjects/sessions with DP/AP significantly less than 0.5 (as determined by 95% confidence interval, calculated from bootstrapping 1000 times). One-sample left-tailed Wilcoxon signed rank test was applied to test whether the median across subjects/sessions was significantly less than 0.5; p-value is denoted, with asterisk if p<0.05.
Figure 1—figure supplement 1
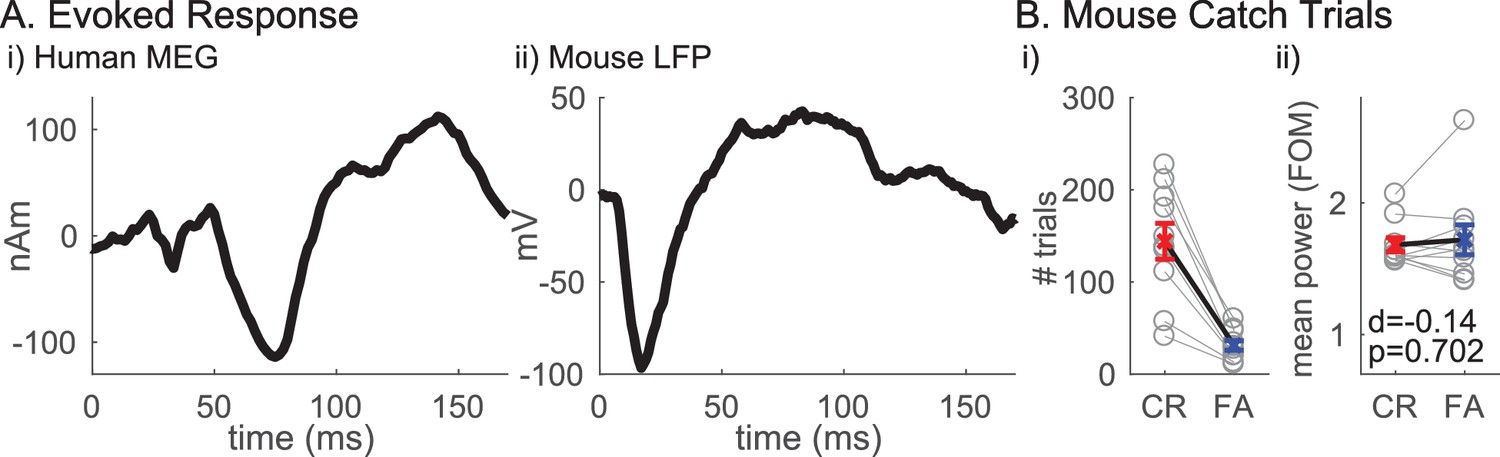
Evoked response to suprathreshold sensory input and beta power on catch trials.
(A) (i) Human MEG evoked response to a suprathreshold tap to the fingertip of the third digit of the right hand. (reproduced from Jones et al., 2007) (ii) Mouse LFP evoked response to a suprathreshold vibrissae deflection. (B) Catch trials in the Mouse Detection dataset. (i) Number of trials and (ii) trial mean prestimulus beta power in correct rejection (CR) and false alarm (FA) trials; in the mouse dataset for each session (grey connected open circles), and for mean (x marks, blue for CR and red for FA) with ±SEM error bars across sessions. Effect size (Cohen’s d) and right-tailed paired t-test p-value is denoted.
Figure 2

Beta emerges as brief events in non-averaged spectrograms.
(A) Top panel shows averaged spectrogram (1–40 Hz) in the 1 s prestimulus period from 100 trials, from an example subject in the human detection dataset (average across 100 non-detected trials). The bottom panels show examples of prestimulus beta band (15–29 Hz) activity in 10 trials from the same subject. White asterisks denote local maxima in the spectrogram with maxima power above 6X median power of the maxima frequency. (B) Same format as A in mouse detection task (average across 130 non-detected trials), and (C) in human attention task (average across 100 attend out trials).
Figure 3
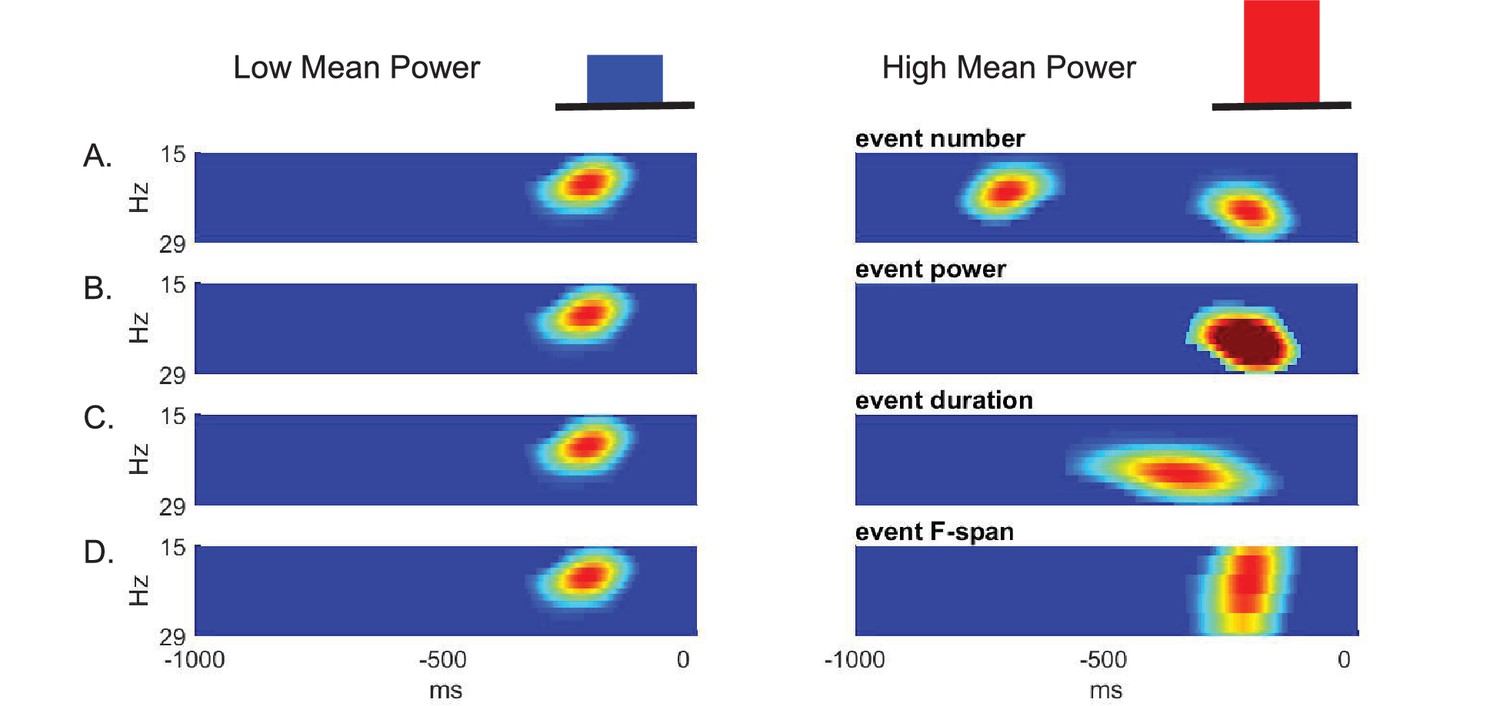
Schematic illustration of possible features underlying differences in averaged prestimulus beta power.
Given that surges in beta power in non-averaged data occur as transient events, higher trial mean beta power could be due to an increase in (A) event number (i.e. rate), (B) event power, (C) event duration, and/or (D) event frequency span (F-span).
Figure 4
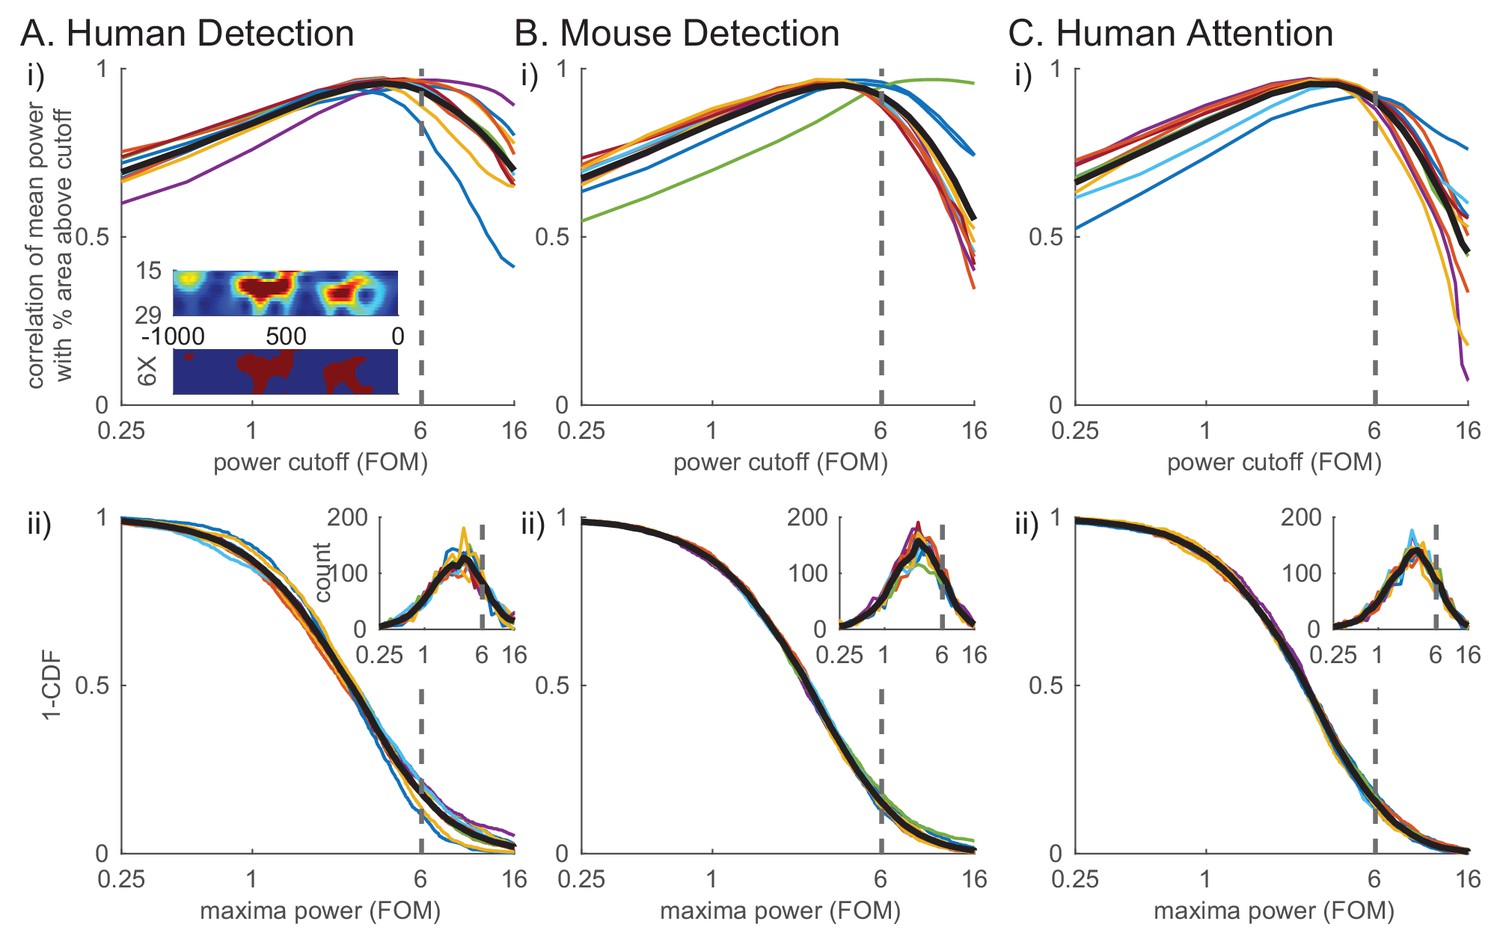
Beta events defined by a 6X median power cutoff show consistently high correlation with average prestimulus beta.
(i) Pearson’s correlation coefficient between mean prestimulus beta power and the percent area (i.e. percentage of pixels in the spectrogram) above cutoff in the non-averaged spectrogram, for various cutoffs calculated as factors of median and plotted on a log scale, in each dataset (A–C) (thin colored curves for individual subjects/sessions; thick black curve for average across subjects.). Inset in A shows an example spectrogram (top) with illustration of percent area above cutoff for a 6X median cutoff (below). (ii) Distribution of maxima power for all beta-band local maxima in non-averaged spectrograms. 1-CDF shows proportion of local maxima above the cutoff (thin colored curves for individual subjects/sessions; thick black curve for aggregate of all local maxima across subjects/sessions). Insets show the same data as histograms.
Figure 5 with 1 supplement
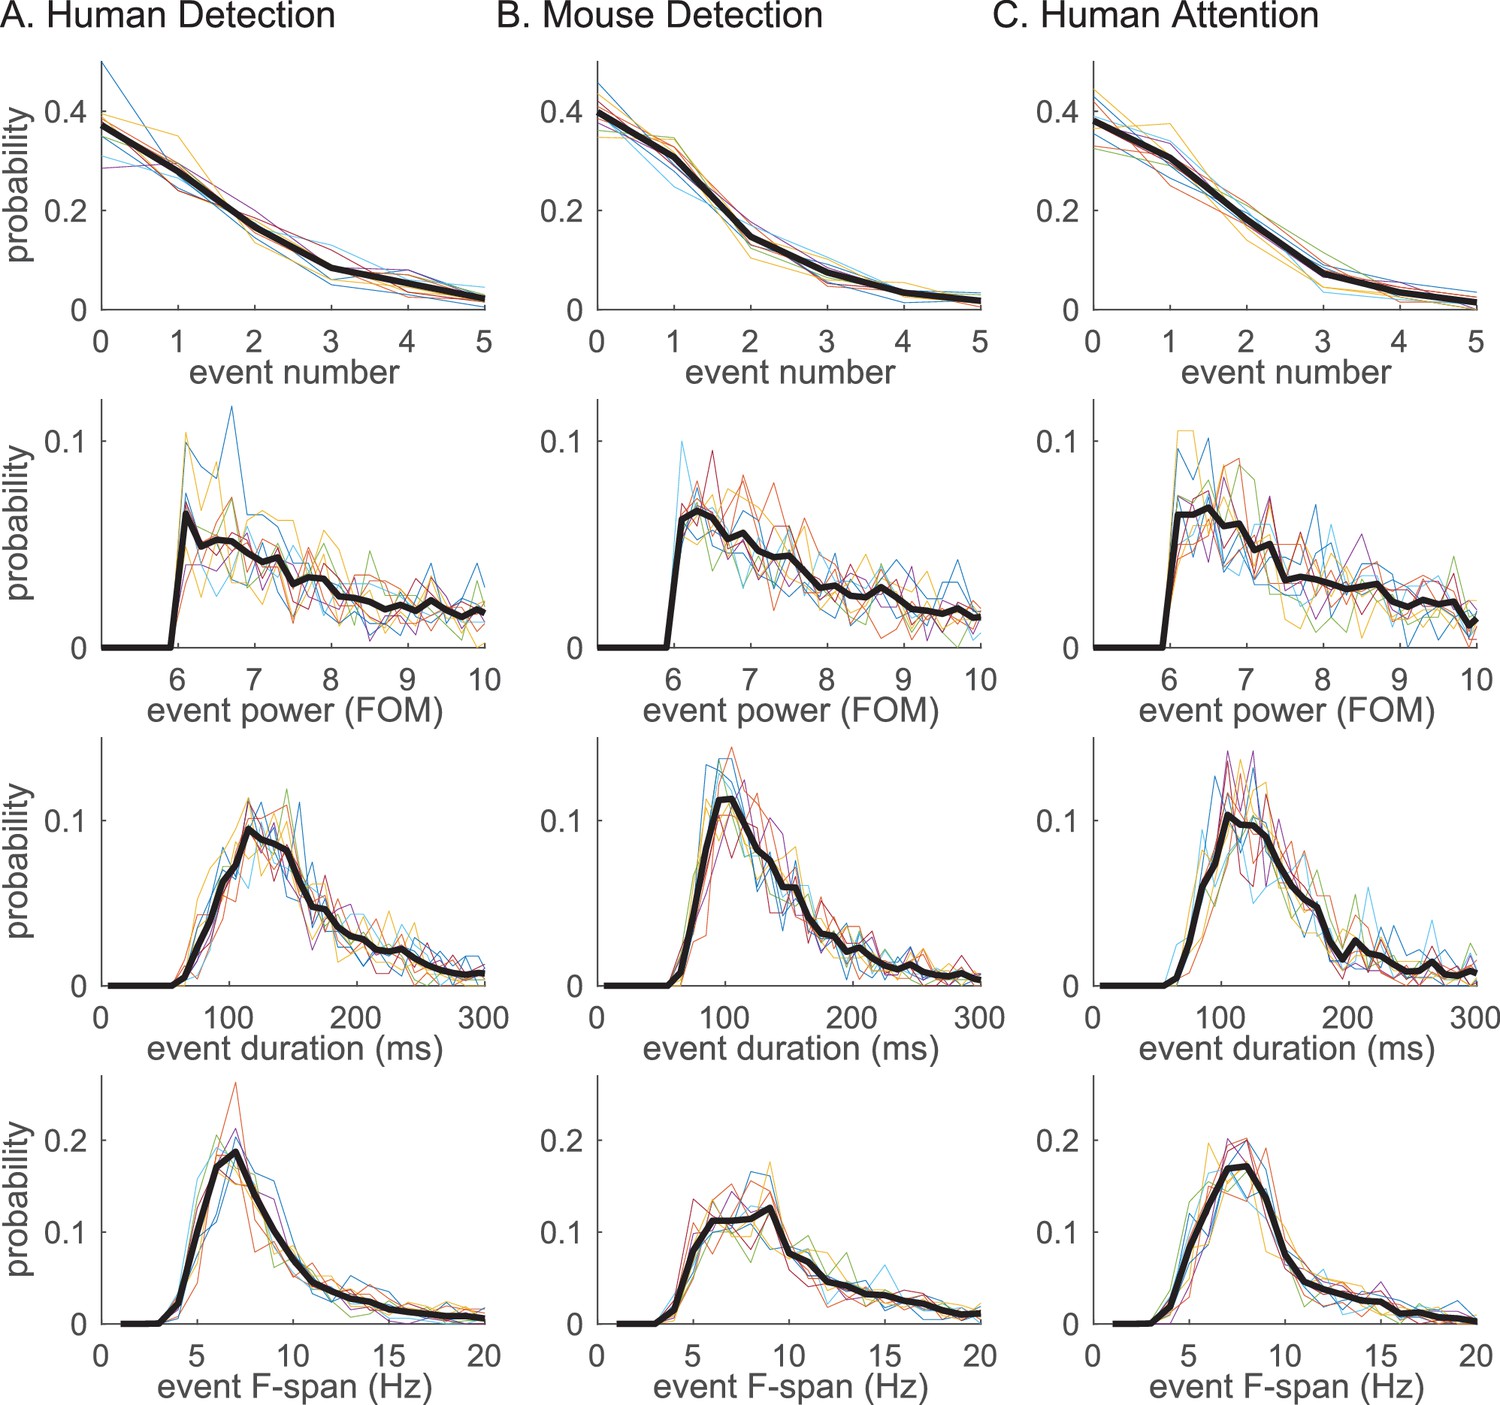
Beta event features are highly conserved across tasks and species.
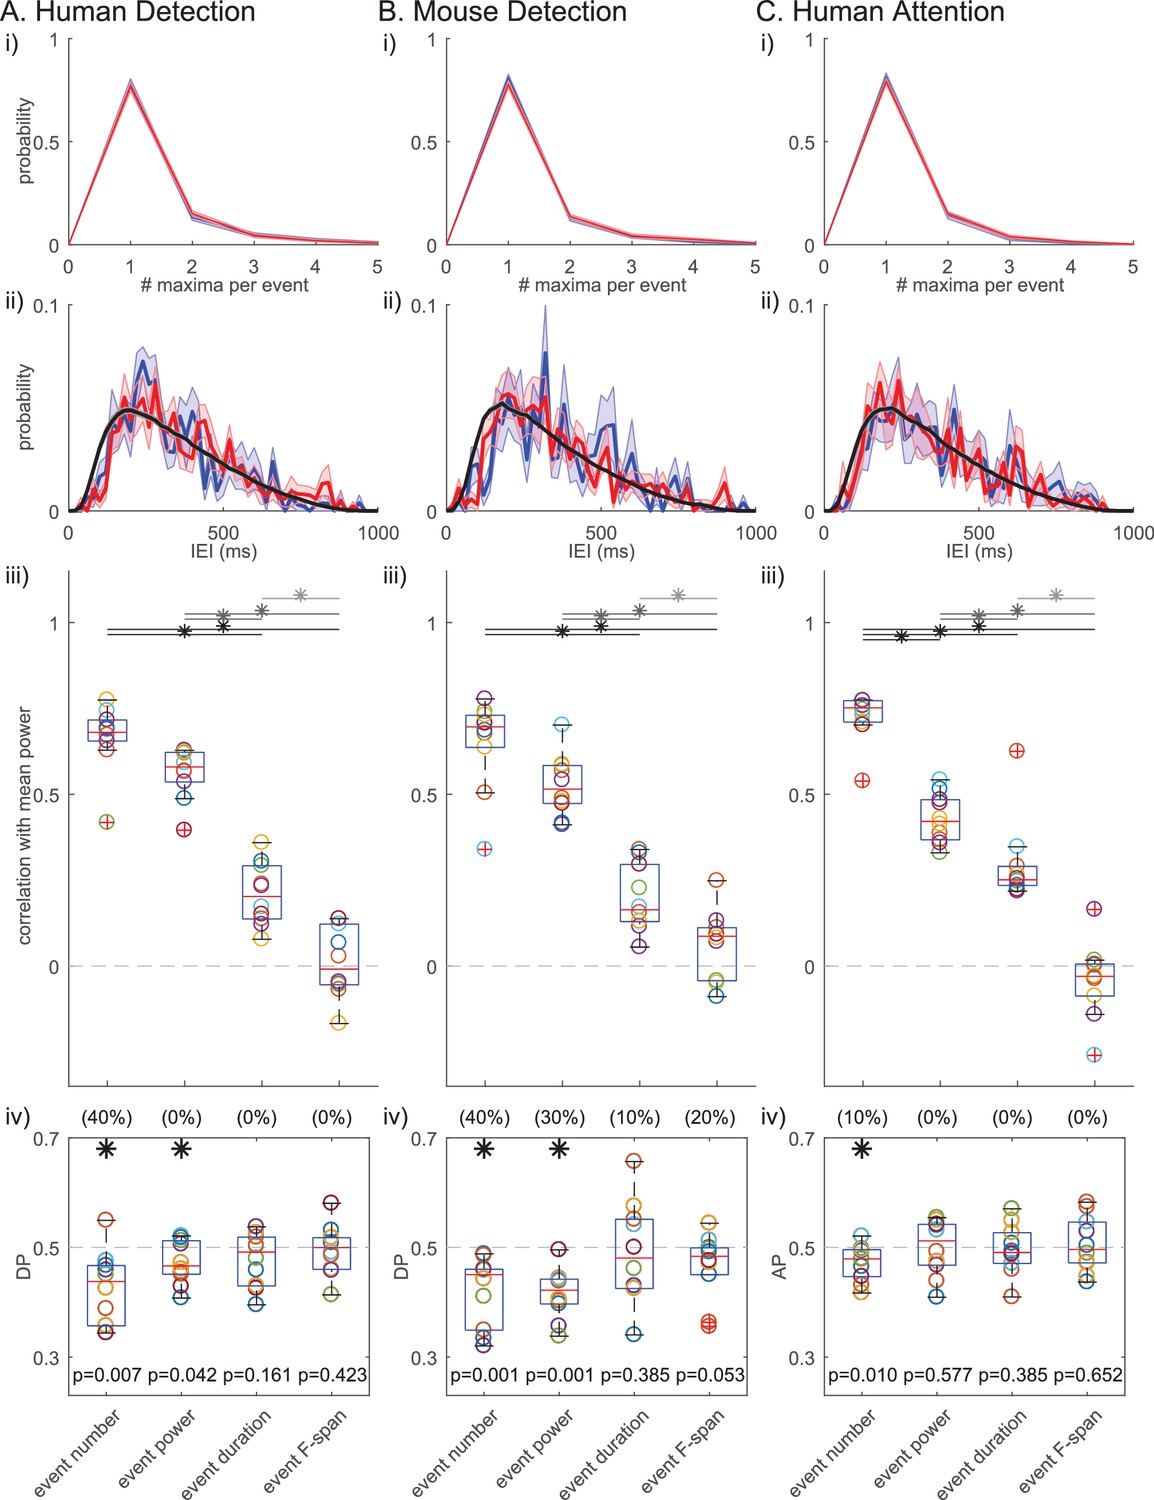
Probability histogram for each prestimulus beta event feature; (i) event number, (ii) event power, (iii) event duration, (iv) event frequency span; defined at 6X median cutoff in each dataset (A–C). Probability was calculated per trial for event number, and per event for event power, duration and frequency span. Probability histograms are plotted for each subject/session (colored); and for aggregate of all trials (for i) or events (for ii-iv) across subjects/sessions (black). Bin intervals for each histogram were as follows; 1 for event number; 0.2 (FOM) for event power; 10 (ms) for duration; and 1 (Hz) for frequency span.
Figure 5—figure supplement 1
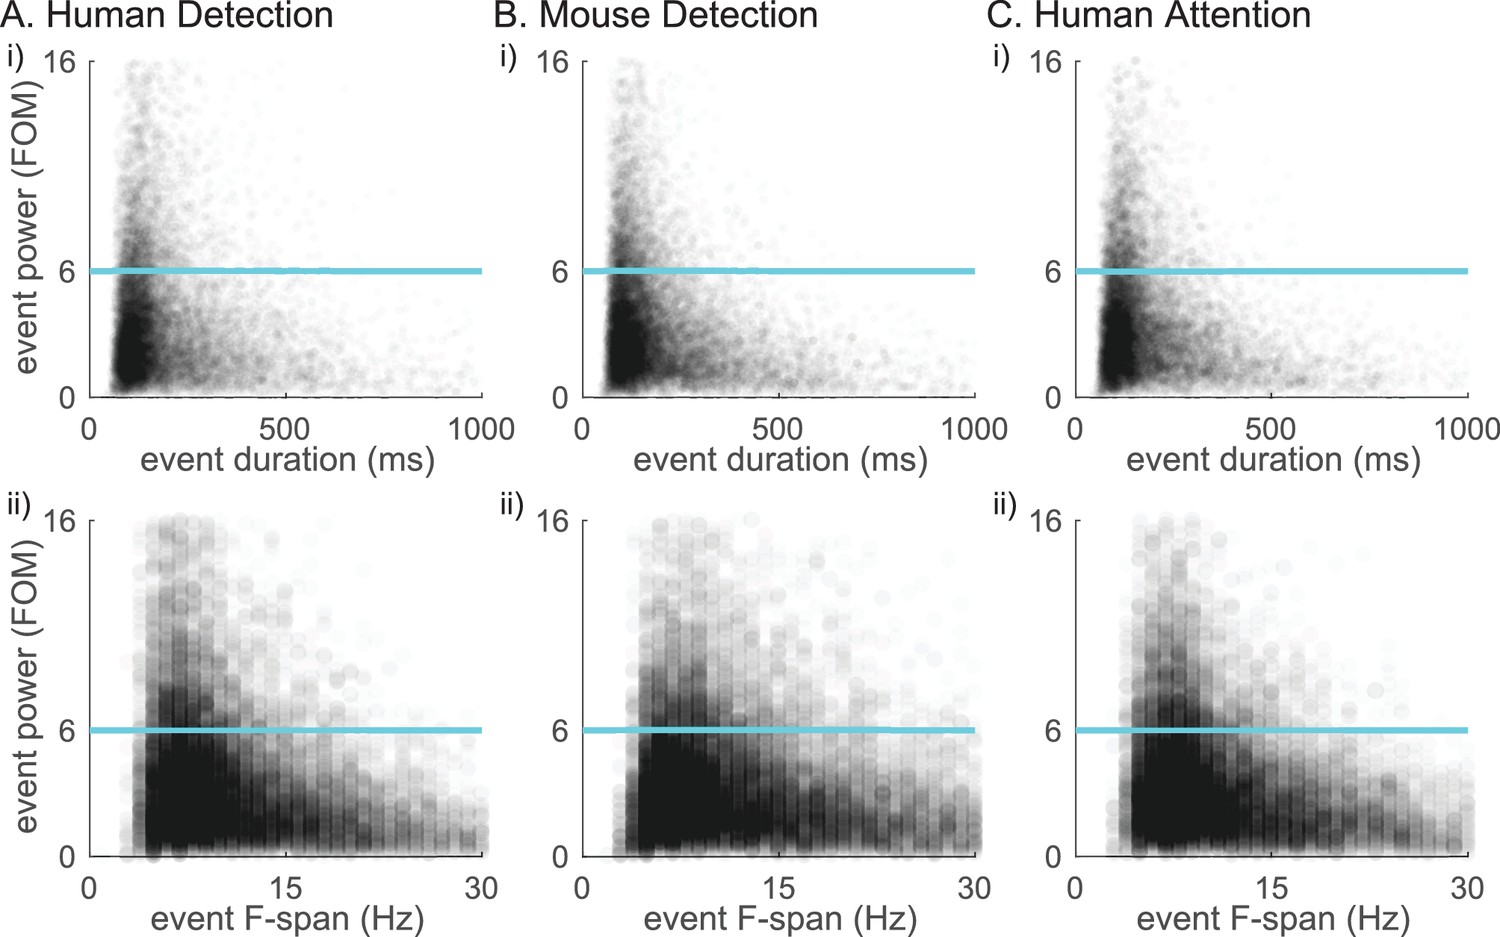
Beta event duration and frequency span is stereotyped when maxima power is higher than 6X median cutoff.
Scatter plots of all local maxima aggregated across all subjects/sessions in each dataset.
Figure 6 with 2 supplements
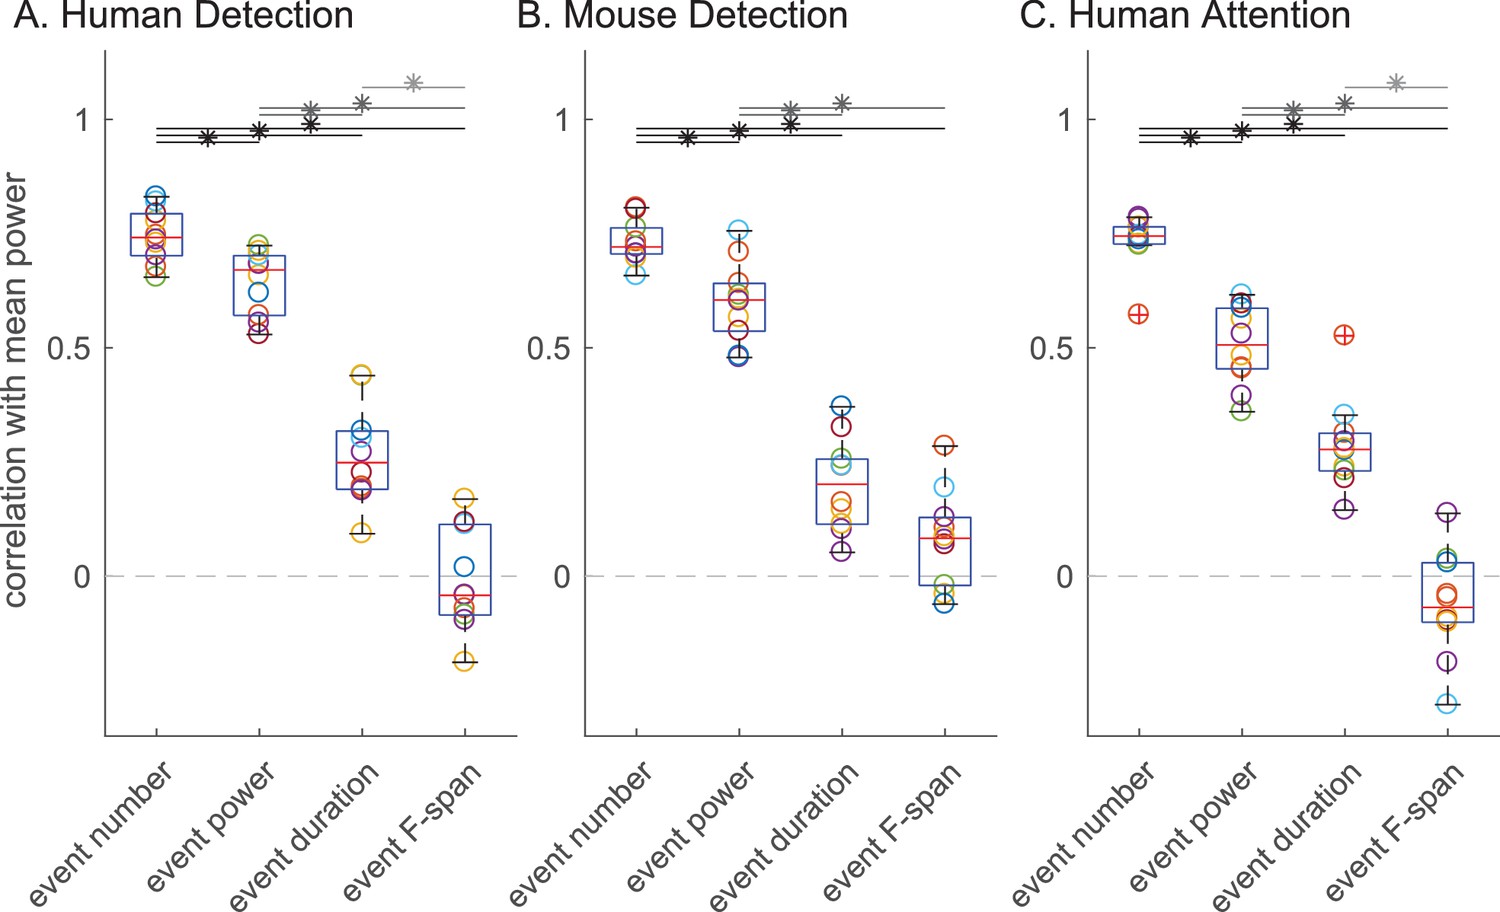
The number of beta events has a higher correlation with trial mean prestimulus beta power than event power, duration or frequency span.
Box and whisker plots over subjects/sessions depicting the Pearson’s correlation coefficients () between the trial summary of each beta event feature and trial mean prestimulus beta power. Note, for all analyses involving trial mean event power, duration and frequency span, only the trials with one or more events were considered. Friedman test followed by right-tailed Wilcoxon signed-rank test for each pair of event features, with Holm-Bonferroni correction for multiple comparisons; significance was determined at p<0.05 (asterisks).
Figure 6—figure supplement 1
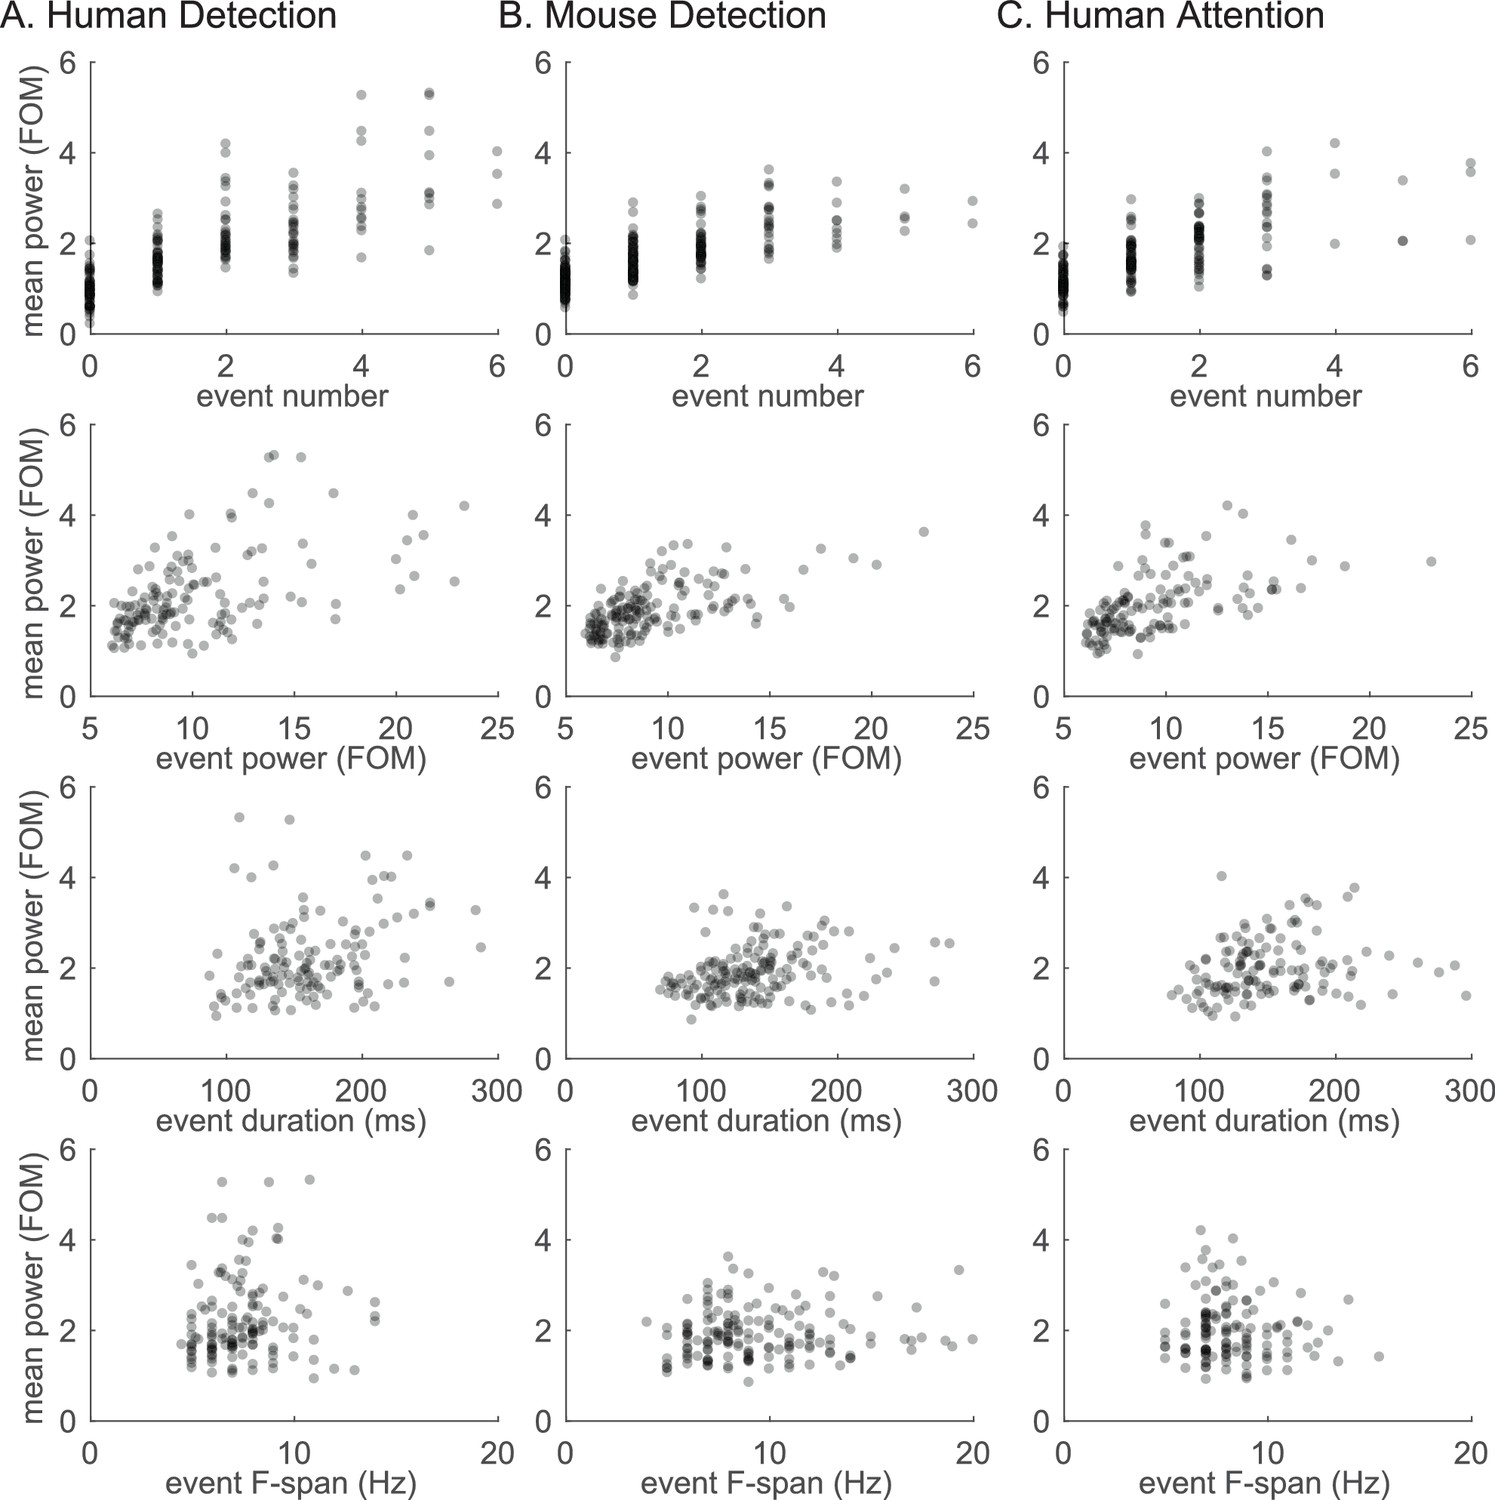
Example scatter plots showing relationship between trial mean prestimulus beta power and corresponding beta event number, trial mean event power, duration and frequency span.
Scatter plot showing trial-by-trial relationship between trial mean prestimulus beta power and trial summary of each event feature. Data shown for one representative subject (A, C)/session (B) from each dataset.
Figure 6—figure supplement 2
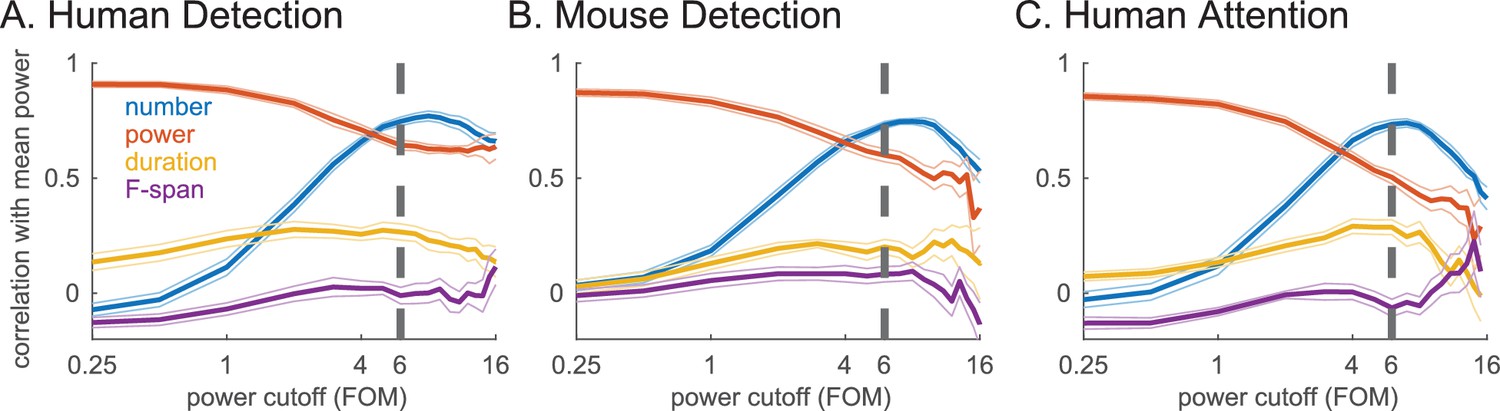
Dependence of correlation with mean power on choice of cutoff.
Pearson’s correlation with trial mean prestimulus power for event number per trial (blue), trial mean event power (red), trial mean event duration (yellow) and trial mean event frequency span (purple); mean across subjects/sessions with±SEM as error bars over a range of cutoffs. For all analyses involving trial mean event power, duration and frequency span, only the trials with at least one beta event over cutoff in the 1 s prestimulus period were considered.
Figure 7 with 2 supplements
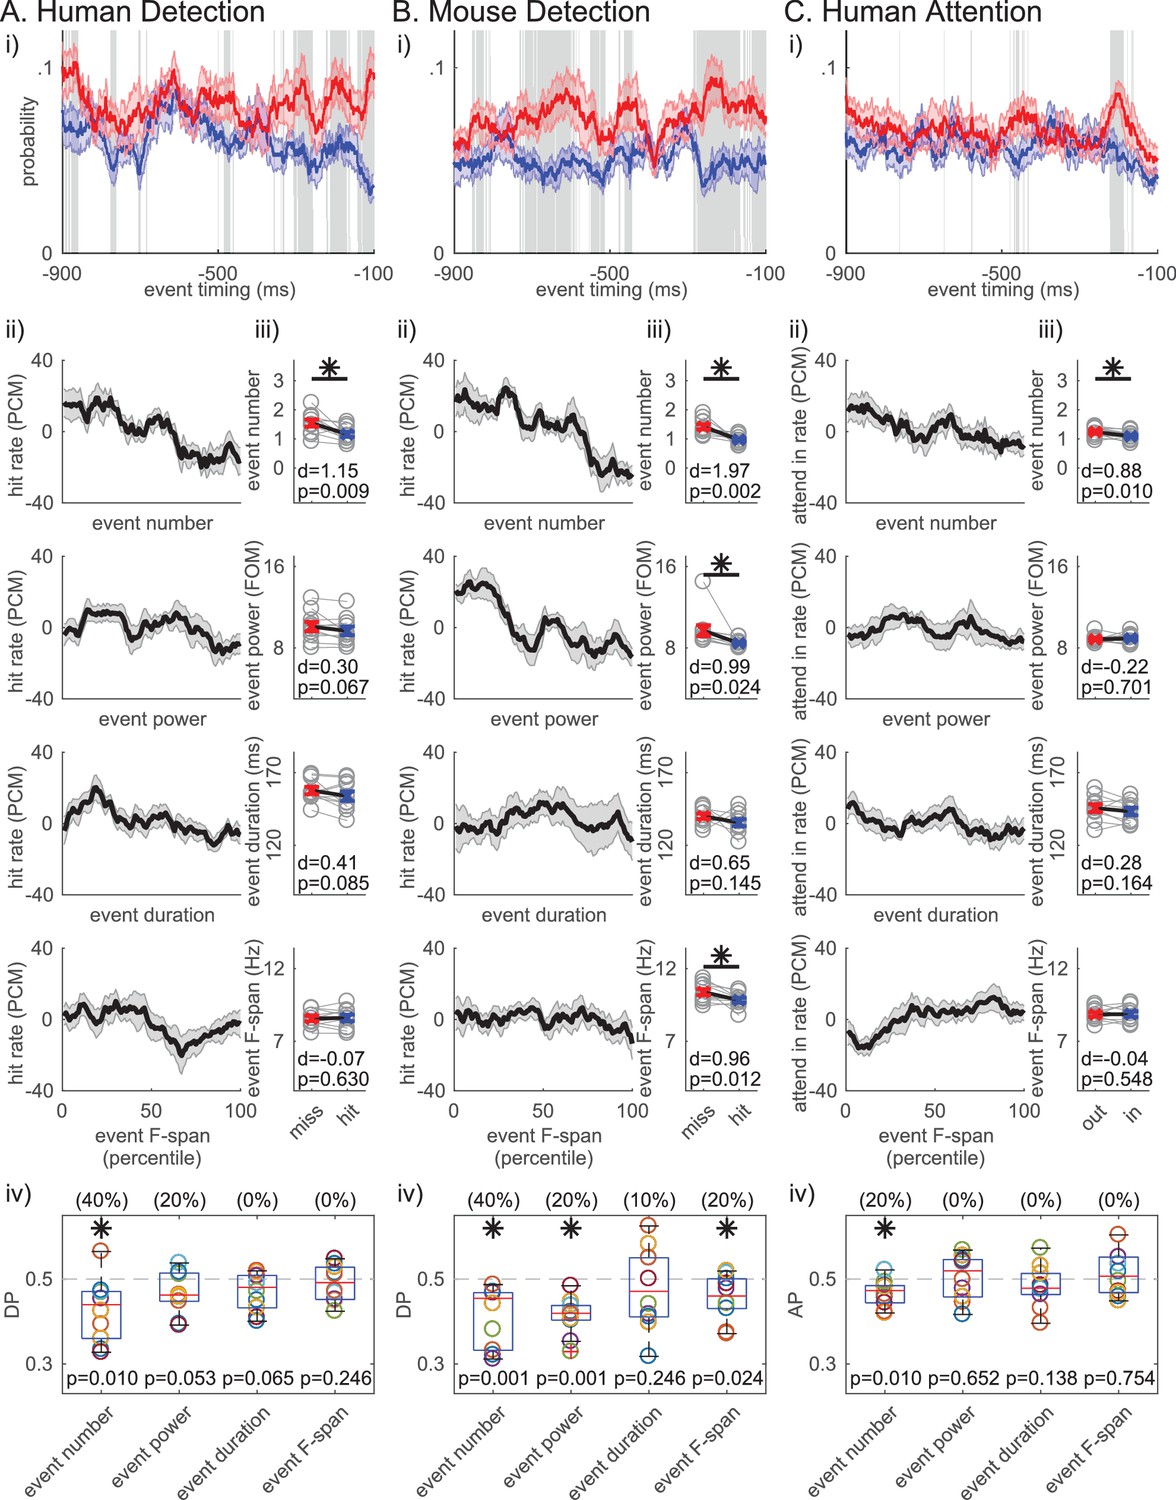
Beta event number per trial (i.e. rate) consistently predicts detection/attention across tasks and species.
(i) Probability time histogram of beta event occurrence in the 1 s prestimulus window. Data binned in 50 ms windows, sliding in 1 ms steps. All other notations are same as Figure 1i. (ii-iv) Analogous analyses to Figure 1ii-iv were done for ii-iv, for each trial summary event feature (number, power, duration, frequency span) separately. Only trials with one or more events were considered for trial mean event power, duration and frequency span.
Figure 7—figure supplement 1
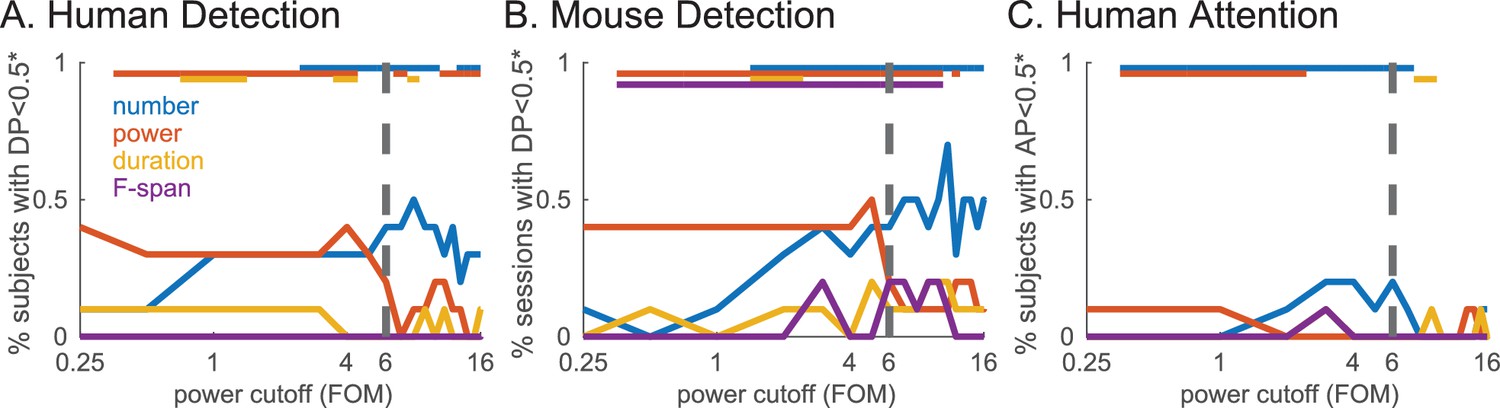
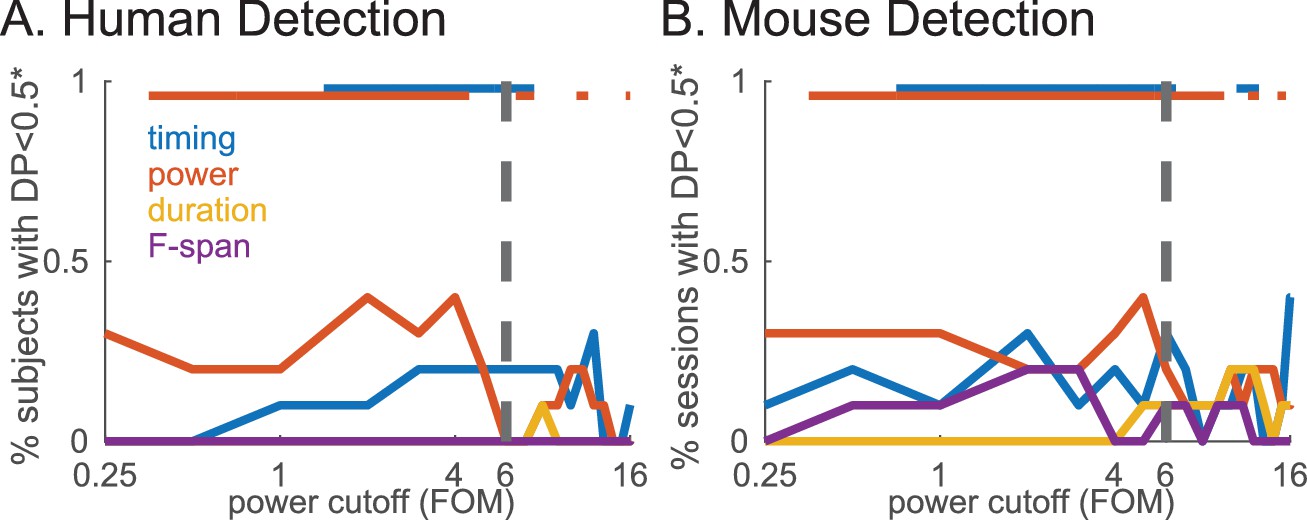
Dependence of relationship between beta event features and behavior on choice of power cutoff.
Percentage of subjects with DP/AP significantly less than 0.5 (i.e. beta is miss predictive) for trial summary of each beta event feature, over a range of cutoffs (significance determined by 95% confidence interval, calculated from bootstrapping 1000 times). For each dataset, feature, and power cutoff, we tested whether the DP/AP distribution across subjects/sessions was significantly less than 0.5 (one-sample left-tailed Wilcoxon signed-rank test, p<0.05 indicated with solid bars on top part of the panel for each feature, in corresponding colors).
Figure 7—figure supplement 2
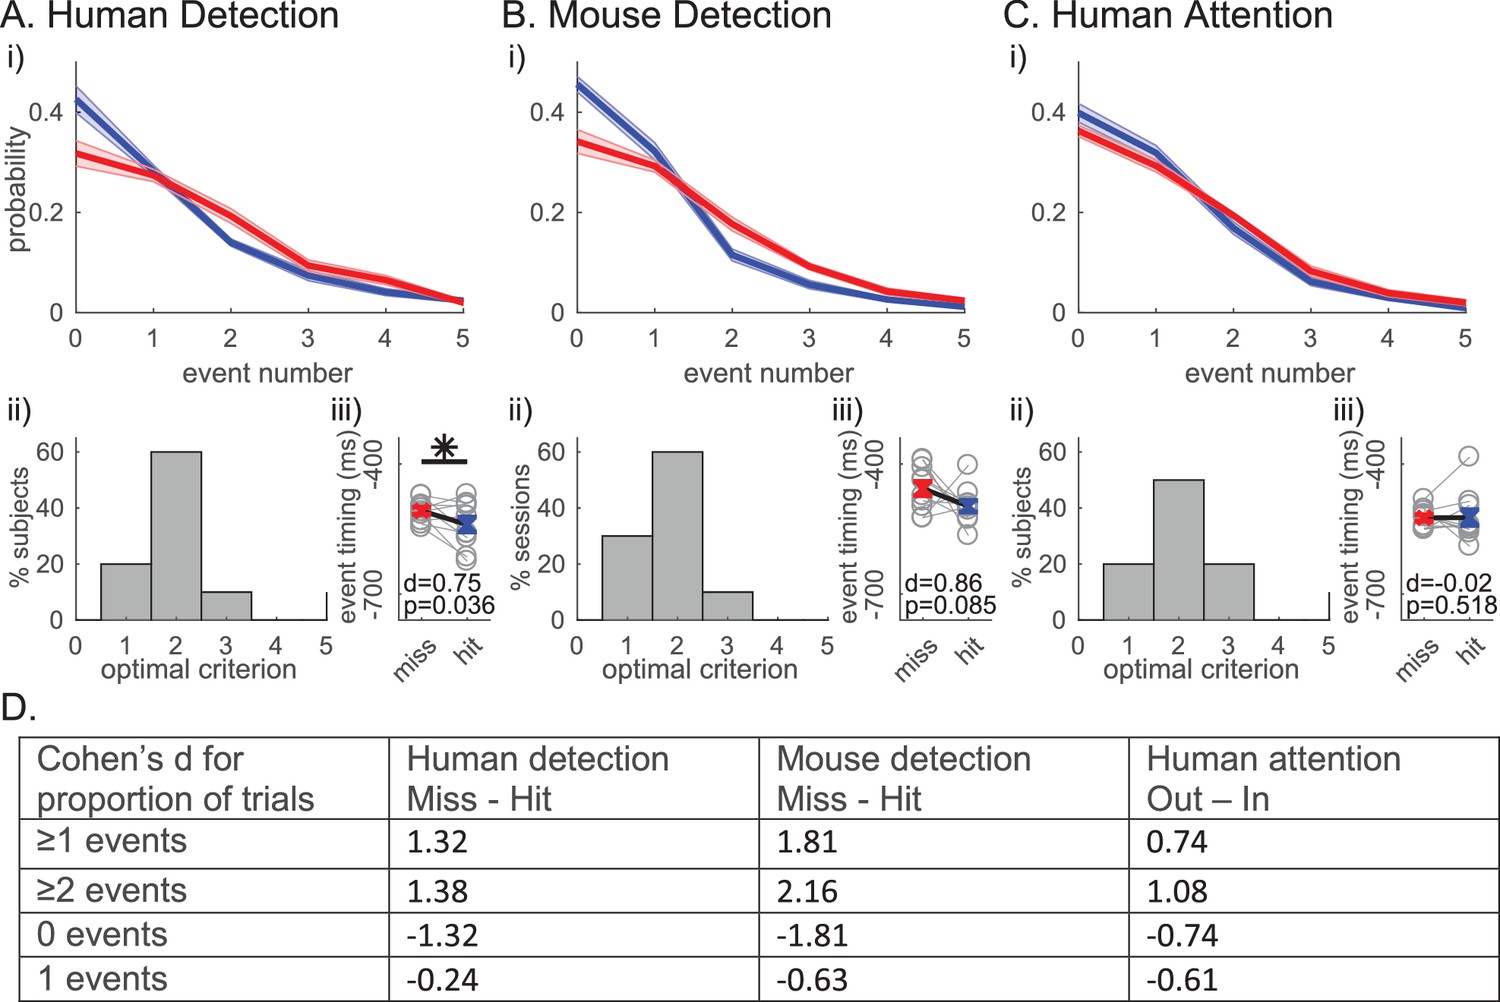
Optimal criterion for classifying behavior based on event number is two events per trial.
A-C (i) Probability histogram of event number across conditions (blue: detected/attend in; red: non-detected/attend out; mean ± SEM across subjects/sessions). (ii) % subjects/sessions with optimal event number criterion at each value. Here, we considered a binary classifier that categorized trials as non-detected/attend out when (event number ≥ criterion). The optimal criterion for each subject/session was the criterion at which the binary classifier achieved the highest performance, as measured by (True Positive Rate – False Positive Rate). (iii) Mean event timing in trials with only one event, pooled across detected (blue) and non-detected (red) trials, as in Figures 1iii, 7iii and 8iii. (D) Cohen’s d quantifying the effect size of the difference between behavioral conditions, for the proportion of trials with various event numbers, across subjects/sessions in each dataset.
Figure 8 with 1 supplement
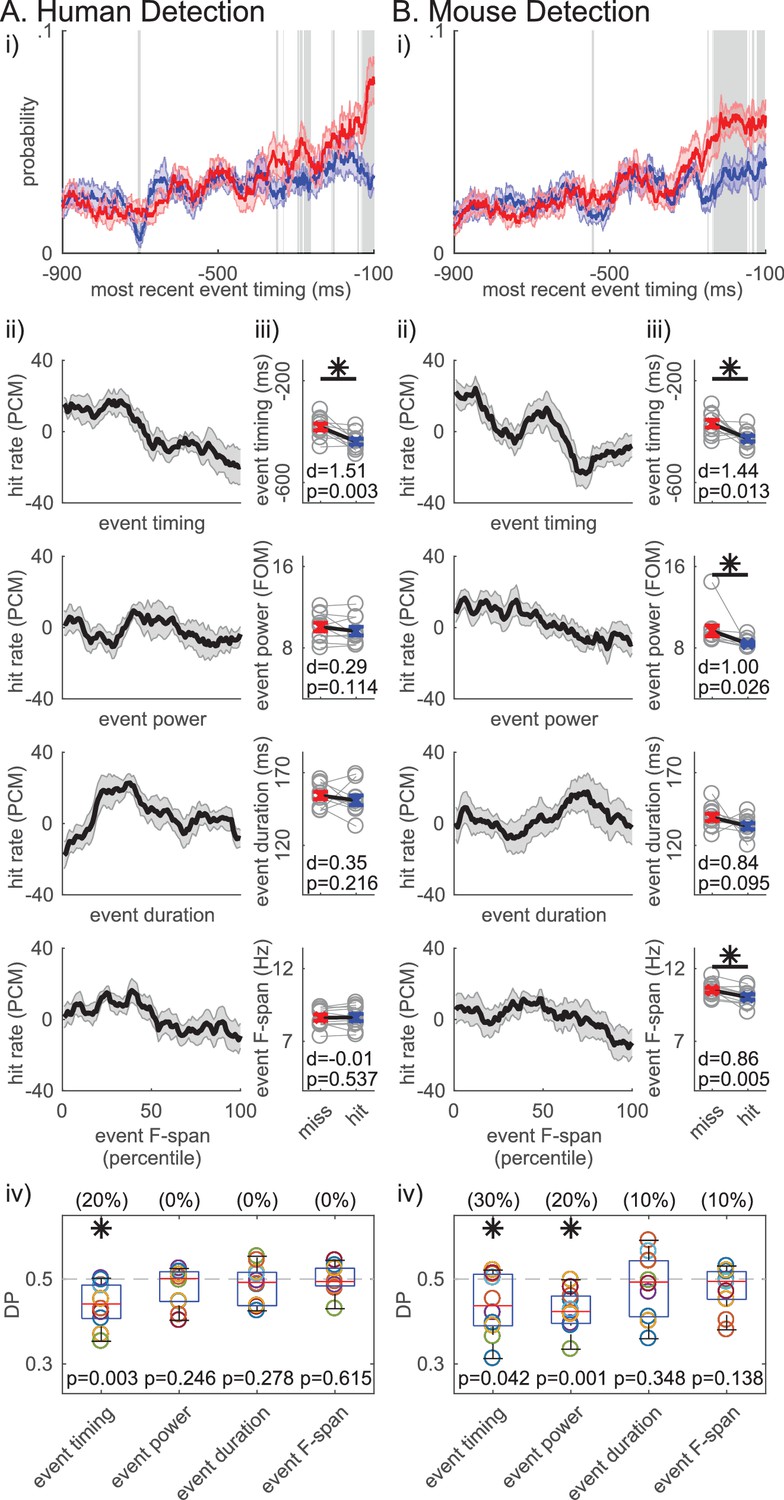
Non-detected trials are more likely to have a beta event closer to the time of the stimulus.
For each trial, the event occuring closest to the stimulus onset was termed the ‘most recent beta event’. All analyses are analogous to Figure 7, in the human (A) and mouse (B) detection datasets, but for features of the ‘most recent beta event’ (event timing relative to the stimulus, event power, duration and frequency span). For analyses in ii-iv, only the trials with one or more events were considered.
Figure 8—figure supplement 1
Dependence of relationship between ‘most recent beta event’ features and behavior on choice of cutoff.
Same as in Figure 7—figure supplement 1, but for ‘most recent beta event’ features.
Figure 9
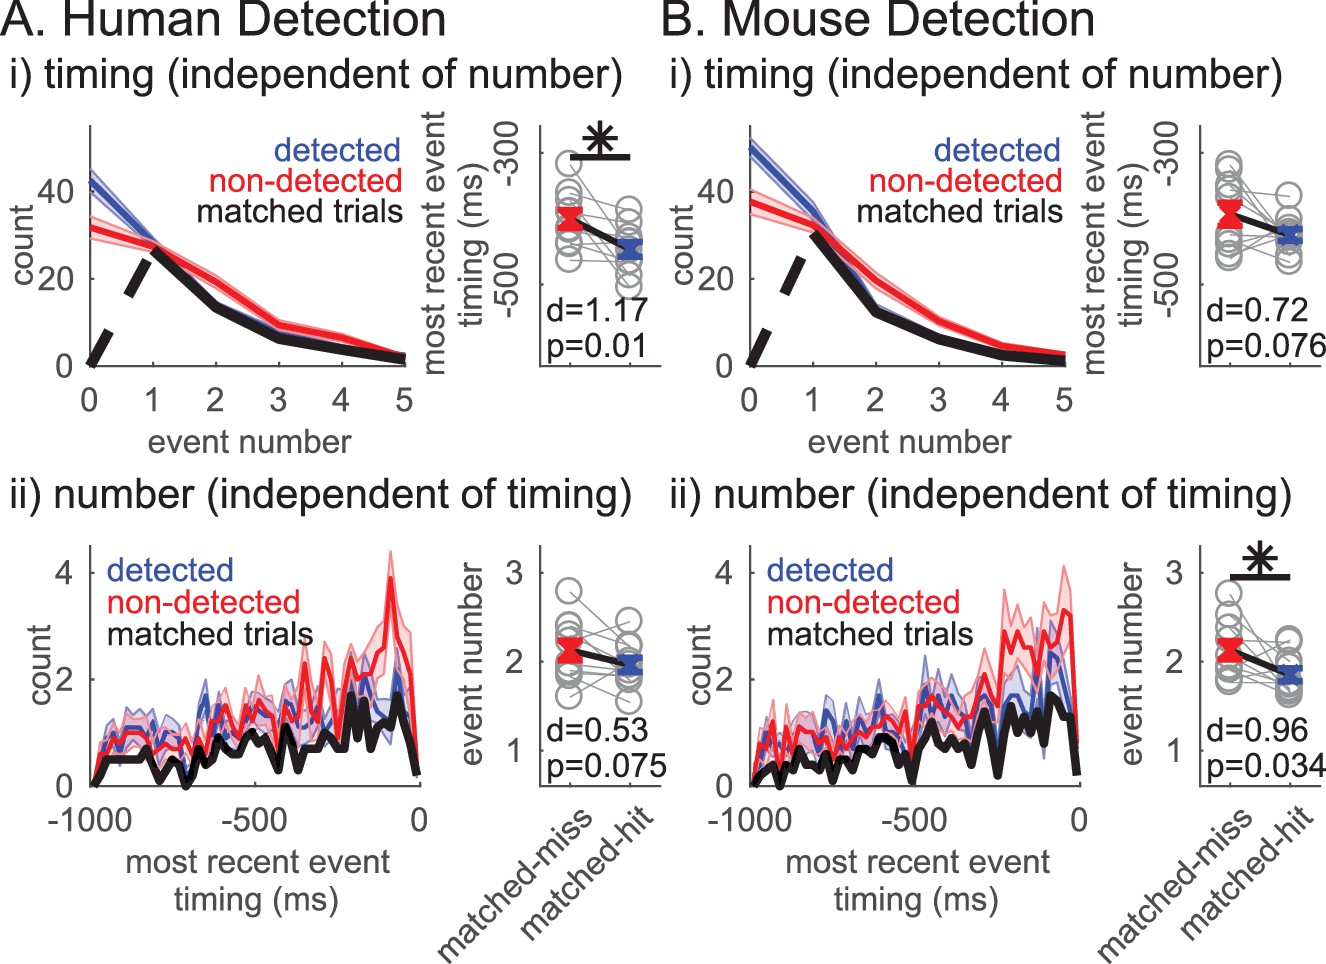
Independent influence of rate and timing on detection.
(i)Left panel: Event number histogram in detected (blue, mean ± SEM), non-detected (red, mean ± SEM), and event number matched (black, mean across subjects/sessions) trials via a random trial trimming process. Right panel: Pooled average of ‘most recent event’ timing on event number matched non-detected and detected trials. Cohen’s d and p-value for right-tailed paired t-test denoted, asterisk p<0.05. (ii) Analogous to i, where ‘most recent event’ timing histograms (20 ms bins) were matched via a random trial trimming process (left panel, black). Pooled average of event number on ‘most recent event’ timing matched trials.
Figure 10
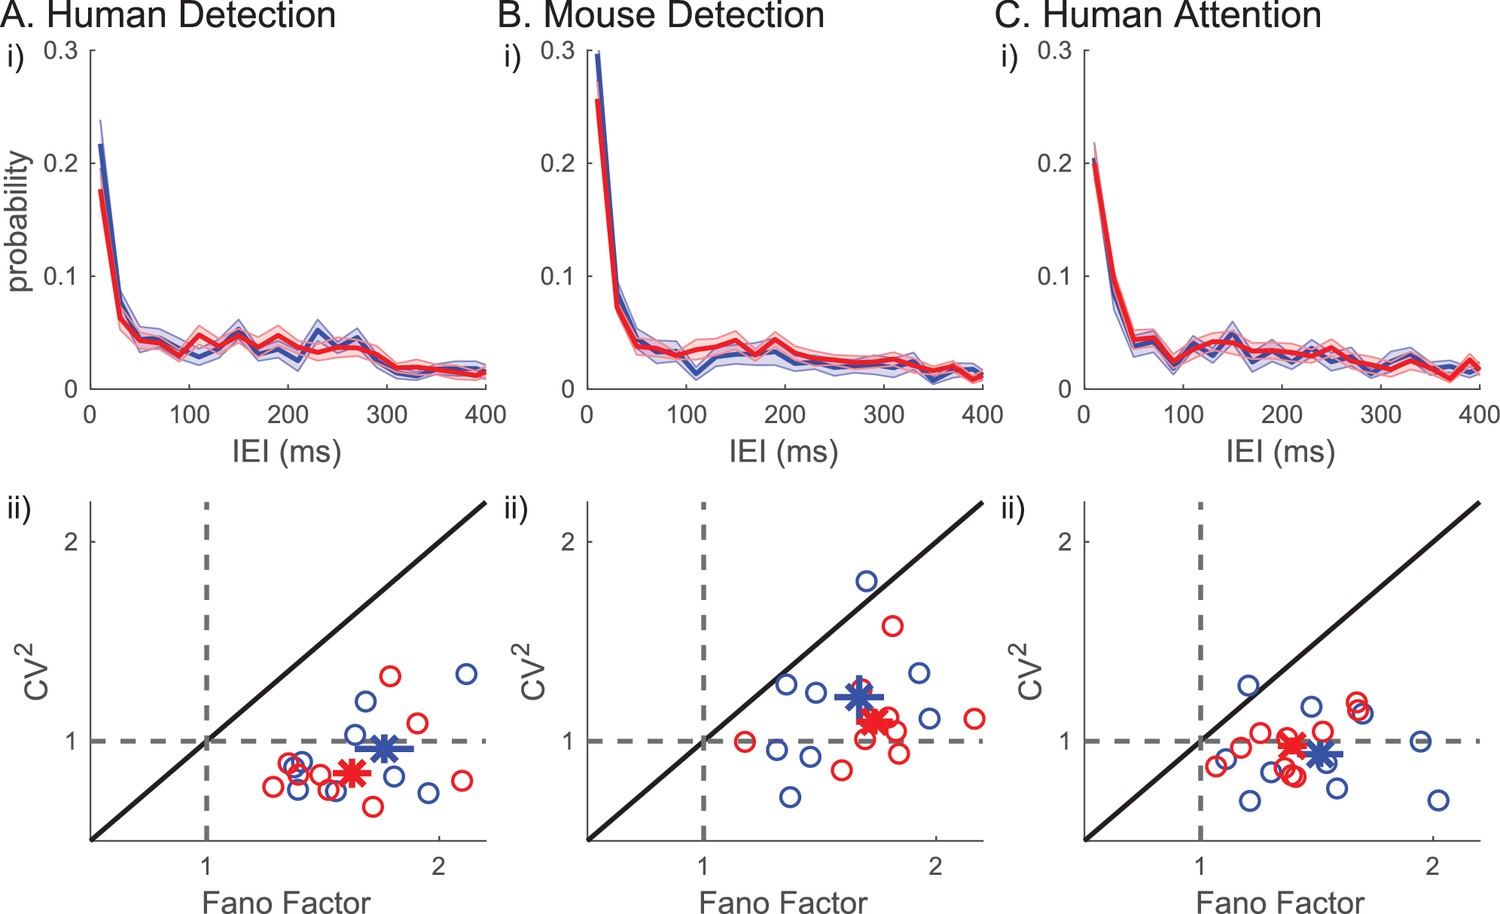
Inter-event-interval (lEI) analyses suggest that beta events are not rhythmic or a renewal process.
(i) IEI distributions (20 ms bins) on detected/attend in (blue) and non-detected/attend out (red) conditions; mean across subjects with ± SEM as error bars. (ii) Fano factor and for each subject are plotted as ○, for all trials (black), for only the detected/attend in trials (blue); and only the non-detected/attend out trials (red). The mean across subjects are plotted as х, with ± SEM as error bars.
Figure 11
Beta event findings are robust under redefinition of events as ‘non-overlapping beta events’.
(i) Probability histograms for number of local maxima per supra-cutoff region (i.e. a ‘non-overlapping beta event’), in detected (blue) and non-detected (red) trials; mean ± SEM across subjects. (ii) IEI distributions (20 ms bins) on detected/attend in (blue), and non-detected/attend out (red) conditions. The jittered distribution (black) was generated by randomly jittering the event timing within the 1 s prestimulus window 1000 times. Mean across subjects/sessions. (iii) As in Figure 6; and, (iv) As in Figure 7iv for ‘non-overlapping beta events.’.
Figure 12
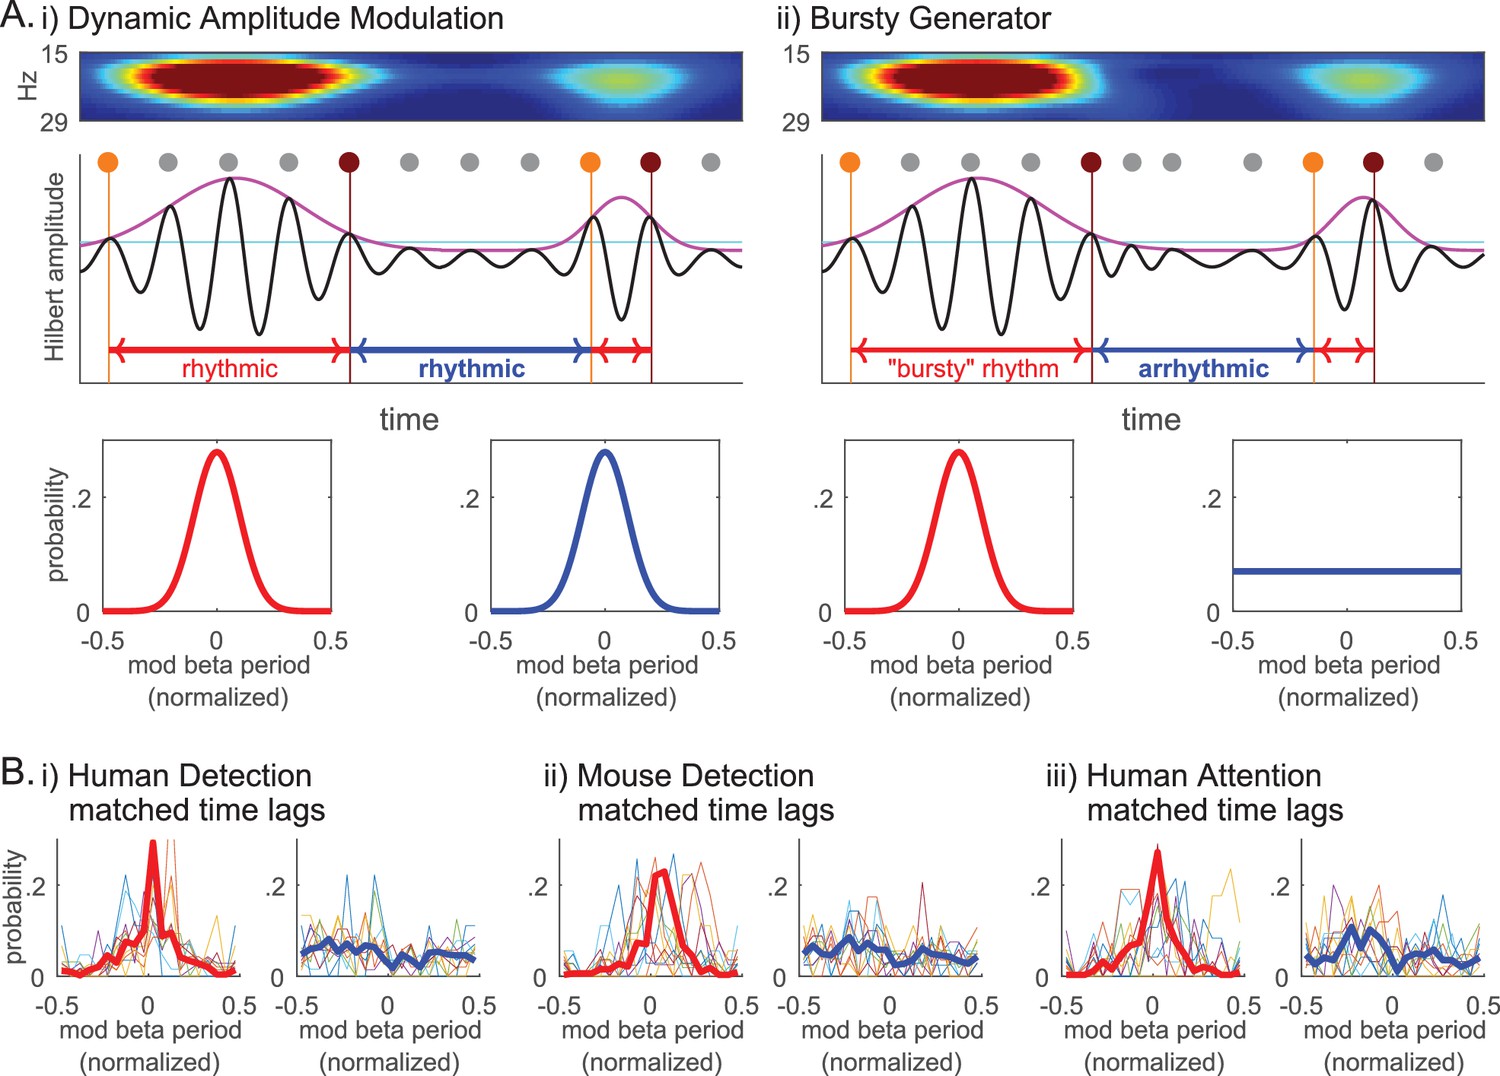
Beta event emergence is consistent with a bursty generator mechanisms, as opposed to dynamic amplitude modulation of a sustained beta oscillation.
(A) Schematic illustration of two alternative mechanisms that could underlie transient surges in beta power in the spectrogram: (i) Dynamic Amplitude Modulation mechanism; versus, (ii) Bursty Generator mechanism. Hilbert amplitude envelope in magenta and the amplitude cutoff in cyan. For each supra-cutoff region, orange and brown dots denote the first and last peaks in the oscillation (phase 0° time points), respectively; all other peaks are denoted with grey dots. The Dynamic Amplitude Modulation hypothesis would predict that the probability histogram of time lag modulo the beta period is centered around zero for both the time lags above (lower left panel, red curve) and below (lower right panel, blue curve) the cutoff, indicating rhythmicity in each region. In contrast, the Bursty Generator hypothesis would predict that the modulo probability histogram is centered around zero for the time lags above the cutoff (red), but flat for the time lags below the cutoff (blue) that lacks rhythmicity. (B) The probability histograms of time lag modulo the beta period are compared for the regions above (left panels, red) and below (right panels, blue) the 2X median amplitude cutoff (thin colored curves for individual subjects/sessions; thick red and blue curves for aggregate of all subjects/sessions in each dataset).
Author response image 1
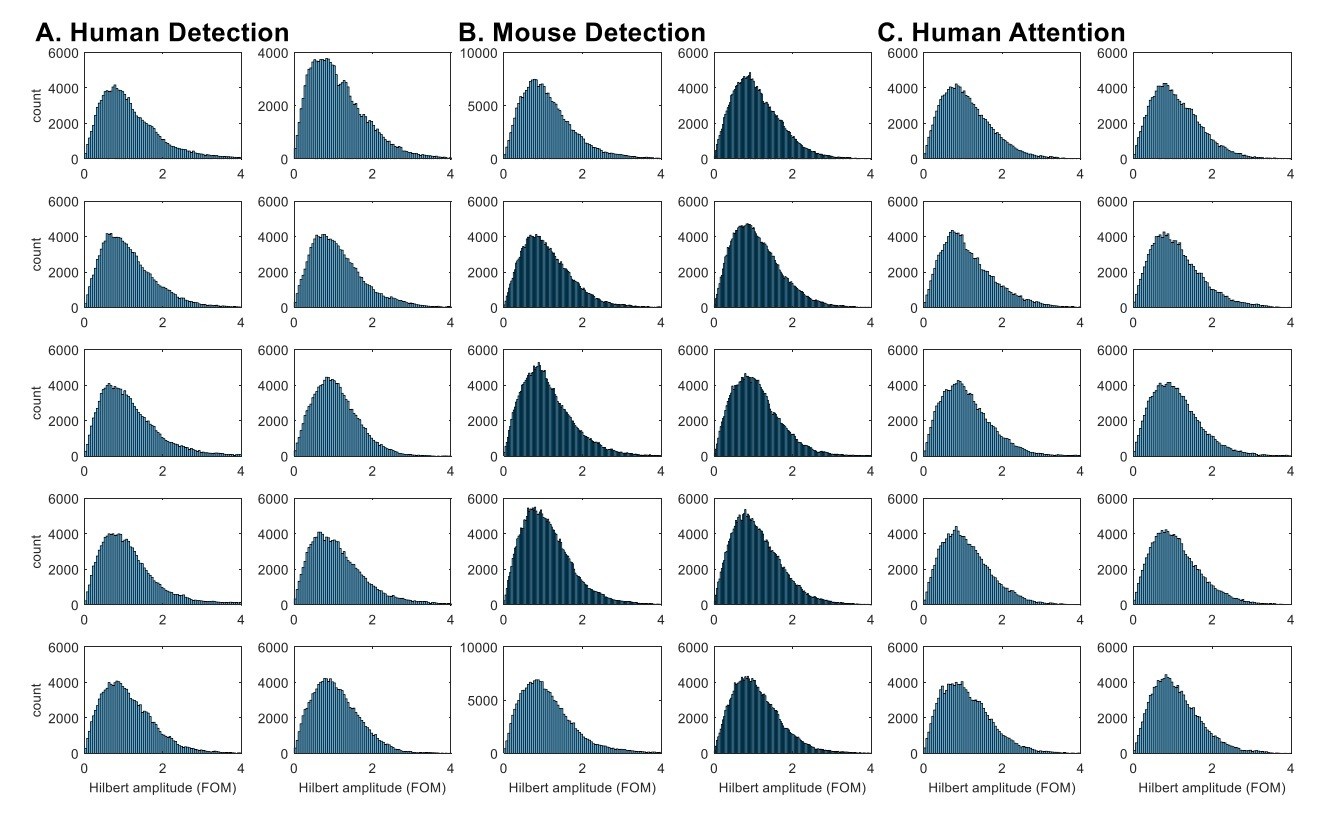
Hilbert-transformed amplitude histograms do not consistently show bimodality.
Hilbert-transformed amplitude histograms of band-pass (14~29Hz) filtered data for each subject / session in A. Human Detection, B. Mouse Detection, C. Human Attention datasets. The amplitude values were taken from all time points in the 1 second prestimulus window, and normalized as factors of median. The bandpass filtering was done with an FIR filter, using the eegfilt function in EEGlab (https://sccn.ucsd.edu/eeglab/index.php).
Author response image 2
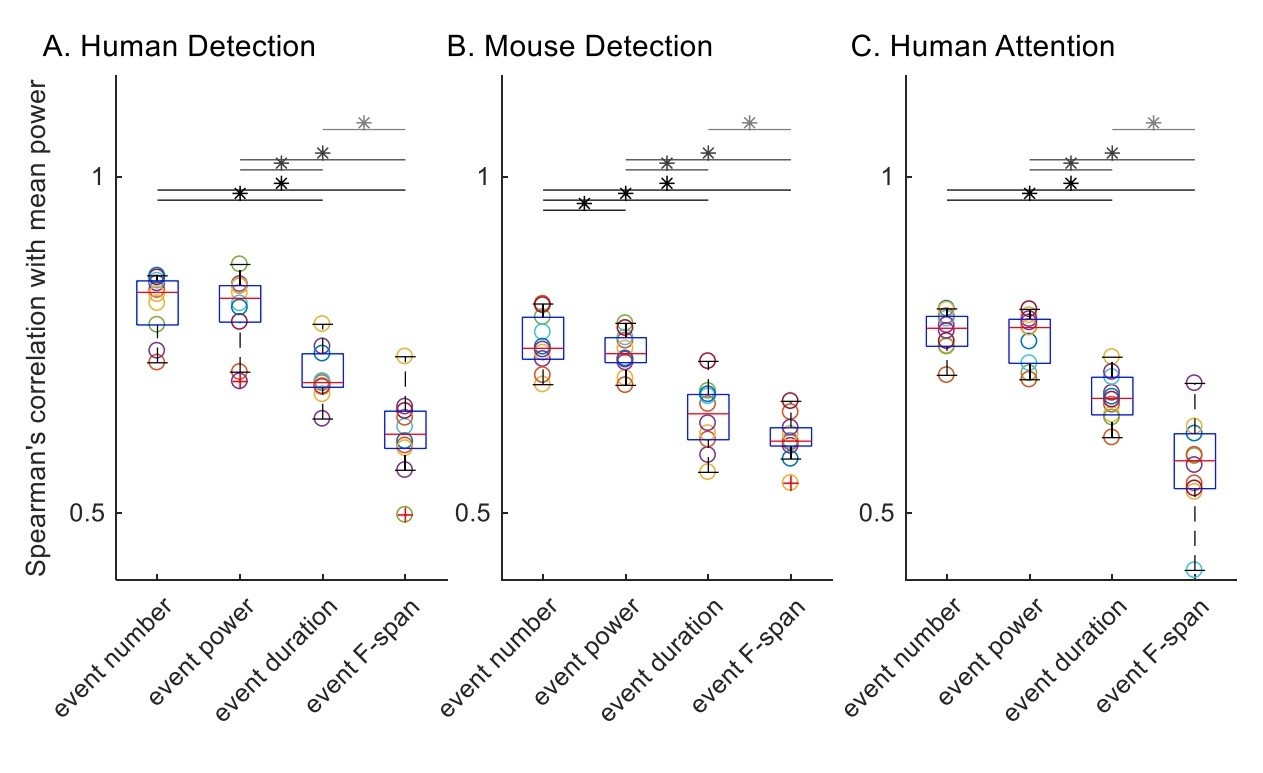
Spearman’s correlation with trial mean prestimulus beta power.
All trials were included for all features, and trial mean event power, duration and frequency span as zero for zero event trials.
Author response image 3

Multiple linear regression slopes, with trial mean prestimulus beta power as the response variable and the four trial summary event features as regressors.
All trials were included for all four features; trial mean event power, duration and frequency span were defined as zero for zero event trials.
Additional files
-
Transparent reporting form
- https://doi.org/10.7554/eLife.29086.021
Download links
A two-part list of links to download the article, or parts of the article, in various formats.
Downloads (link to download the article as PDF)
Open citations (links to open the citations from this article in various online reference manager services)
Cite this article (links to download the citations from this article in formats compatible with various reference manager tools)
The rate of transient beta frequency events predicts behavior across tasks and species
eLife 6:e29086.
https://doi.org/10.7554/eLife.29086


