Lipid transfer from plants to arbuscular mycorrhiza fungi
- LMU Munich, Biocenter Martinsried, Germany
- University of Bonn, Germany
- Technical University Munich, Germany
- Centre National de la Recherche Scientifique, France
- Norwich Research Park, United Kingdom
Figures
Figure 1 with 4 supplements
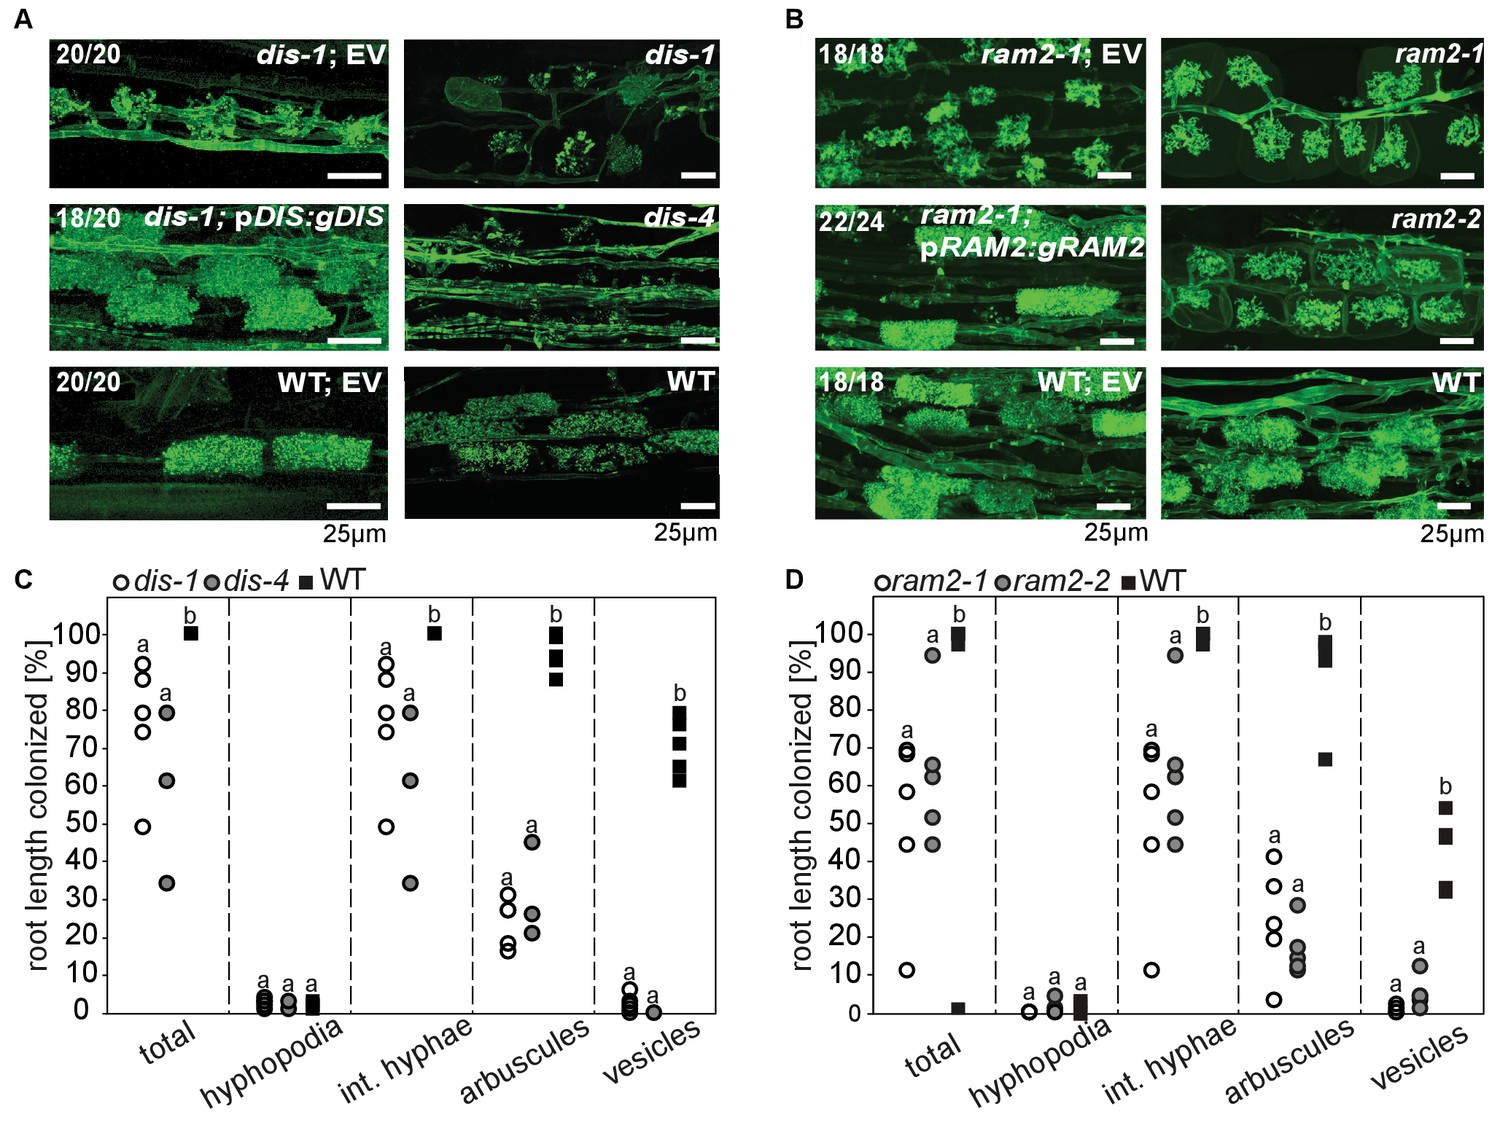
DIS and RAM2 are required for arbuscule branching and vesicle formation.
Arbuscule phenotype and complementation of dis (A) and ram2 (B) mutants. The fungus was stained with wheat-germ agglutinin (WGA)-AlexaFluor488. (C-D) Percent root length colonization of dis (C) and ram2 (D) mutants as compared to wild-type. Different letters indicate significant differences among treatments (ANOVA; posthoc Tukey). (C): n = 13; p≤0.1, F2,10 = 8.068 (total & int. hyphae); p≤0.001 F2,10 = 124.5 (arbuscules); p≤0.001, F2,10 = 299.1 (vesicles) (D): n = 15; p≤0.1, F2,12 = 10.18 (total & int. hyphae); p≤0.001 F2,12 = 57.86 (arbuscules); p≤0.001, F2,12 = 72.37 (vesicles). (A-D) Plants were inoculated with R. irregularis and harvested at 5 weeks post inoculation (wpi).
Figure 1—figure supplement 1

Identification of the dis mutation.
(A–B) Genetic map of the DIS locus on chromosome 4. Numbers next to marker positions refer to the proportion of recombinant individuals among the number of analyzed F2 mutant plants. Rough mapping had previously identified the position of the dis mutation on the south arm of chromosome 4 (Groth et al., 2013). (A) In the first fine-mapping round, the interval narrowed down by recombinants comprised 19 EMS-induced SNPs (red stars), that could be confirmed by re-sequencing the mutant genome using next generation sequencing. (B) Further fine mapping resulted in an interval with 3 of these confirmed SNPs. (C) Physical map of the DIS locus. LjT followed by a number refers to TAC clones. CM followed by a number refers to contigs. One of the three SNPs causes a G to A transition in exon 3 of chr.4.CM004.1640.r2.a resulting in an amino acid change from glycine to arginine at position 190 of the protein product, which shares 79% sequence identity with a β-keto-acyl ACP synthase I (KASI) from Arabidopsis thaliana. Black boxes indicate exons separated by introns. (D) The DIS gene is duplicated in tandem. (E) Gene structure of DIS, DIS-LIKE and KASI. Black boxes display exons separated by introns (black lines). Grey boxes indicate determined un-translated regions. (F) DIS, DIS-LIKE and KASI are predicted to contain a plastid transit peptide (green). The catalytic triad is shown in blue and the location of mutations identified by TILLING in the DIS gene are shown in red. We chose the dis-4 mutant for further analysis because the mutation resulted in a glycine replacement, which likely affects the functionality of the protein.
Figure 1—figure supplement 2
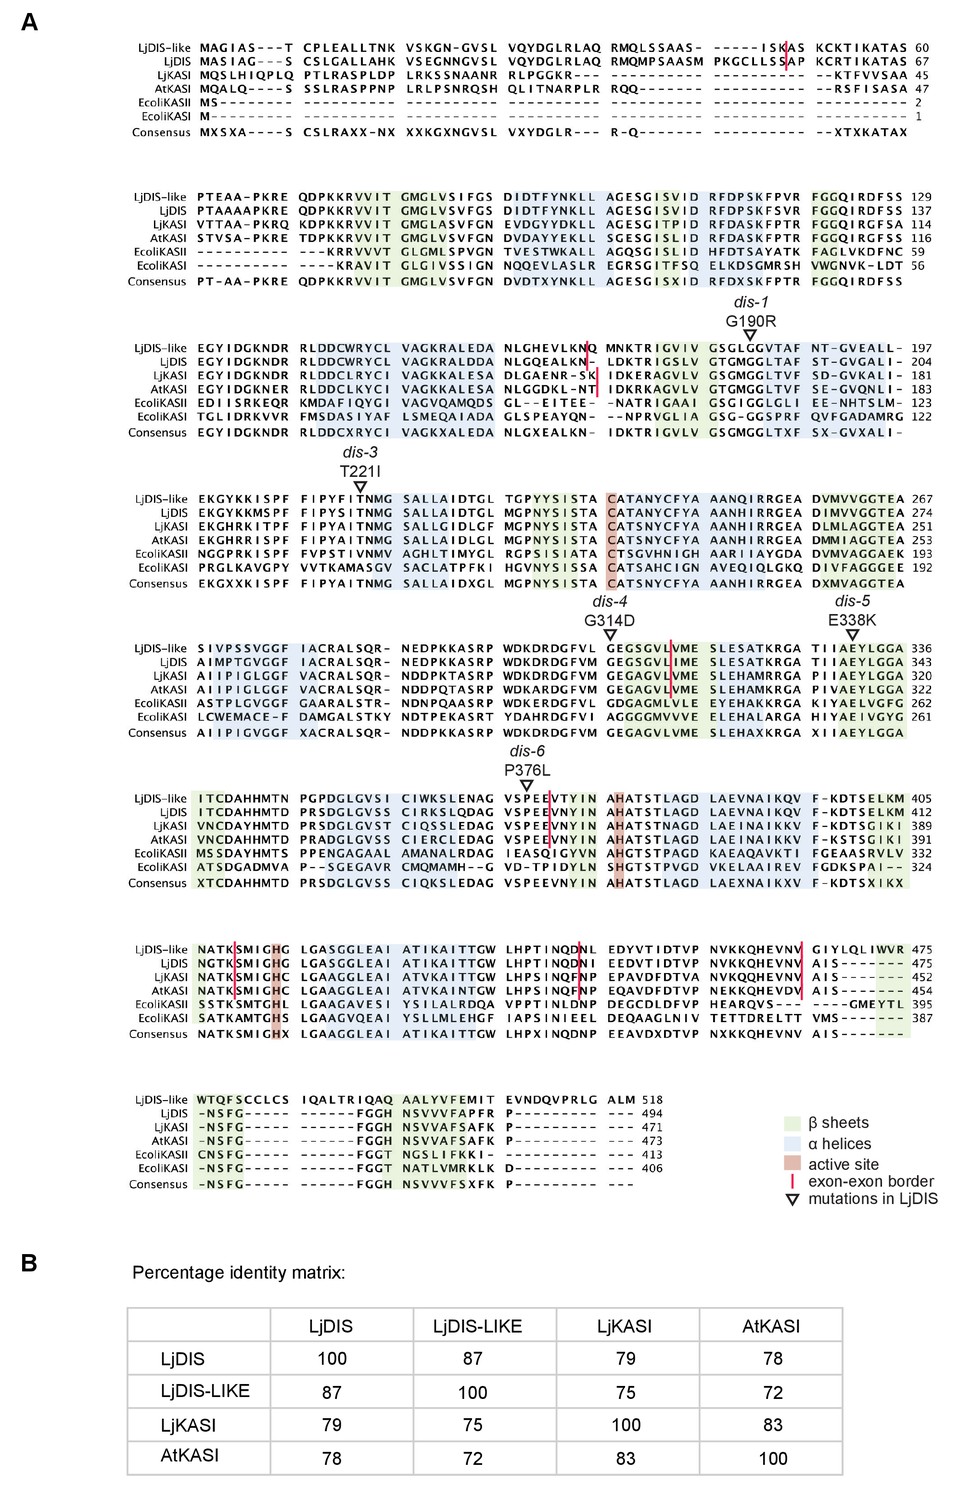
Protein sequence alignment of L. japonicus DIS with other KASI proteins.
(A) Sequence alignment of LjDIS, LjDIS-LIKE, LjKASI, AtKASI and E. coli KASI and KASII. (B) Identity matrix of LjDIS, LjDIS-LIKE, LjKASI and AtKASI.
Figure 1—figure supplement 3
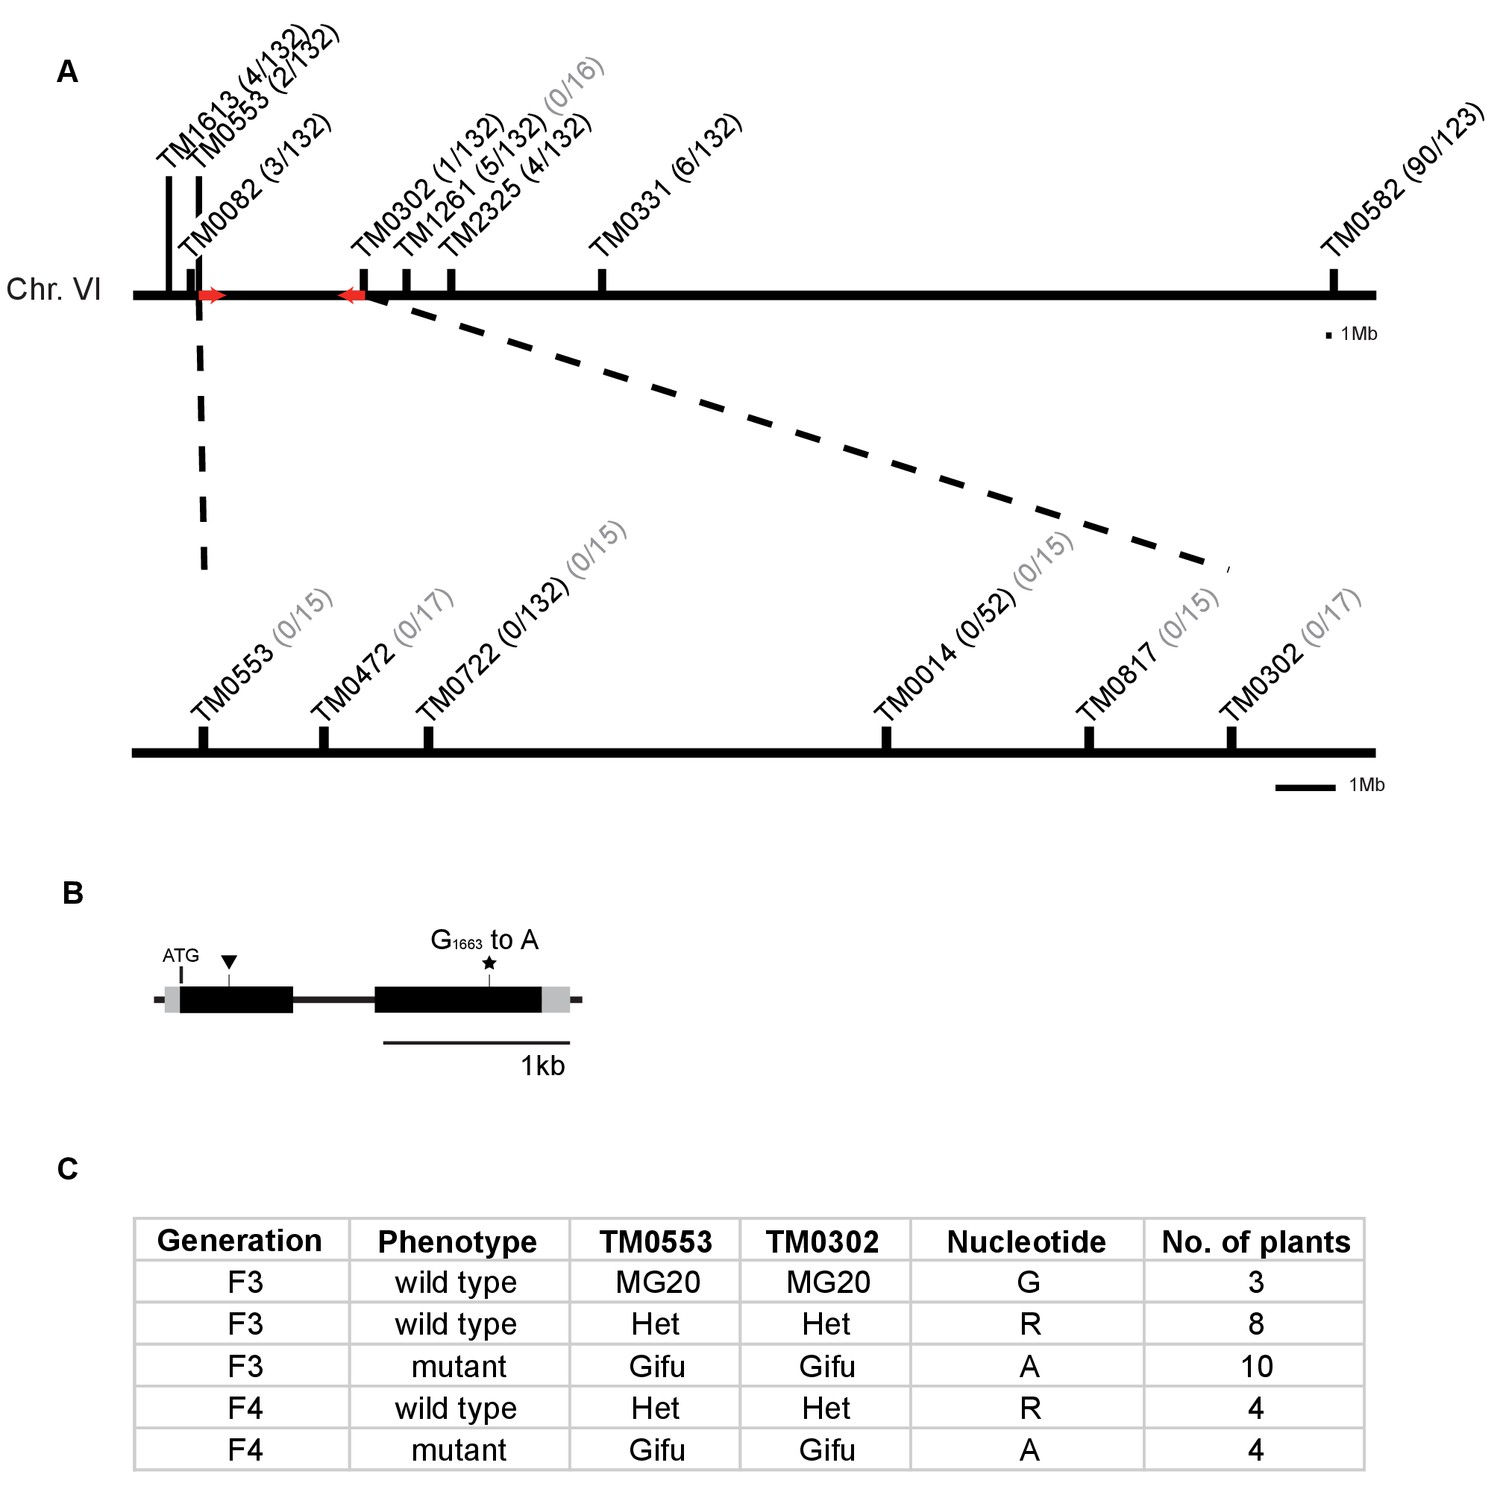
Identification of mutation in the RAM2 gene.
(A) Genetic map of the red locus on chromosome 6. Numbers next to the marker position refer to the proportion of recombinant individuals among the number of analysed F3 (black) and F4 (grey) segregating and mutant plants respectively. Fine mapping narrowed down the interval between TM0553 and TM0302. Red arrows indicate the genomic interval that contains the causative mutation. (B) Gene structure of L. japonicus RAM2 with locations of the identified EMS-induced mutation at position 1663 (star, ram2-1) leading to an amino acid exchange from glycine to glutamic acid at position 555 of the RAM2 protein and LORE1 insertion (triangle, ram2-2). Black boxes indicate exons separated by intron (thin black line). Grey boxes indicate untranslated regions (UTRs) comprising 77 bp (5’UTR) and 151 bp (3’UTR). (C) Co-segregation analysis of arbuscule phenotype and mutation in the RAM2 gene in a number of F3 and F4 plants from segregating populations containing only the mutation on chromosome 6. The number of plants analysed per generation, arbuscule phenotype, genotype at markers TM0053 and TM0302 and the nucleotide observed at position 1663 in the RAM2 gene are indicated. The ram2 mutation at position 1663 clearly co-segregates with the stunted arbuscule phenotype.
Figure 1—figure supplement 4

Protein sequence alignment of L.
japonicus RAM2 with M. truncatula RAM2. Sequence alignment (A) and identity matrix (B) of LjRAM2, Lj1g3v2301880.1, MtRAM2 and Medtr7g067380.
Figure 2 with 1 supplement
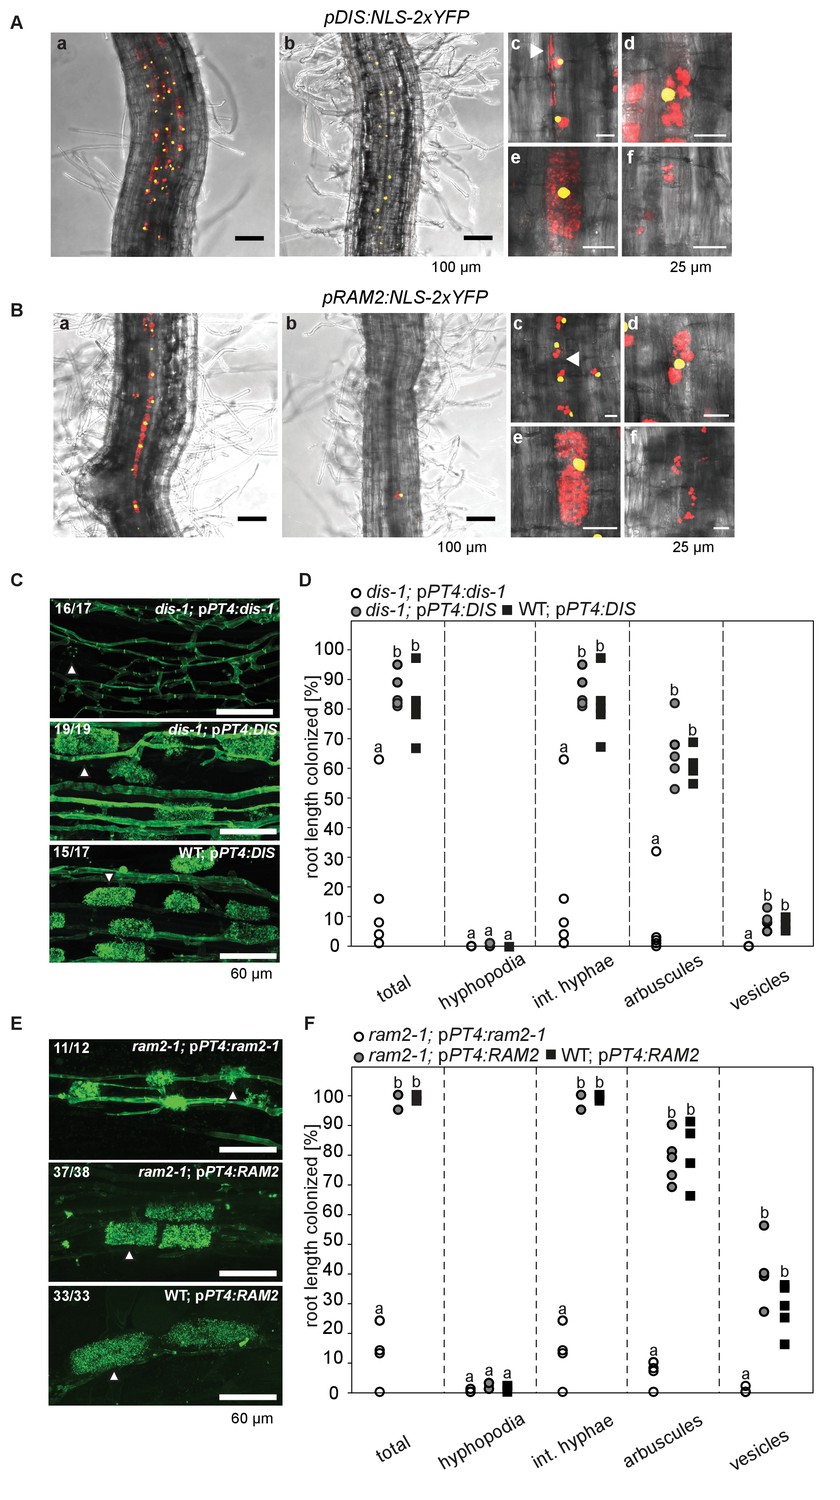
Arbuscocyte-specific expression of DIS and RAM2 is sufficient for arbuscule branching.
Promoter activity indicated by nuclear localized yellow fluorescence in colonized transgenic L. japonicus wild-type roots transformed with constructs containing a 1.5 kb promoter fragment of DIS (A) or a 2.275 kb promoter fragment of RAM2 (B) fused to NLS-YFP. (A-B) Red fluorescence resulting from expression of pSbtM1:SP-mCherry labels the apoplastic space surrounding pre-penetration apparatuus (PPAs) and fungal structures, thereby evidencing the silhouette of these structures. a Colonized root, b non-colonized part of colonized root, c PPAs, (white arrow heads indicate the silhouette of fungal intraradical hyphae) d small arbuscules, e fully developed arbuscules f collapsed arbuscules. Merged confocal and bright field images of whole mount roots are shown. (C-D) Transgenic complementation of dis-1 (C) and ram2-1 (D) hairy roots with the respective wild-type gene driven by the PT4 promoter. The mutant gene was used as negative control. White arrowheads indicate arbuscules. (E-F) Quantification of AM colonization in transgenic roots shown in (C-D). Different letters indicate significant differences (ANOVA; posthoc Tukey; n = 15; p≤0.001) among genotypes for each fungal structure separately. Int. hyphae, intraradical hyphae. (E): F2,12 = 26.53 (total), F2,12 = 46.97 (arbuscules), F2,12 = 27.42 (vesicles). (F) F2,12 = 341.5 (total), F2,12 = 146.3 (arbuscules), F2,12 = 35.86 (vesicles).
Figure 2—figure supplement 1
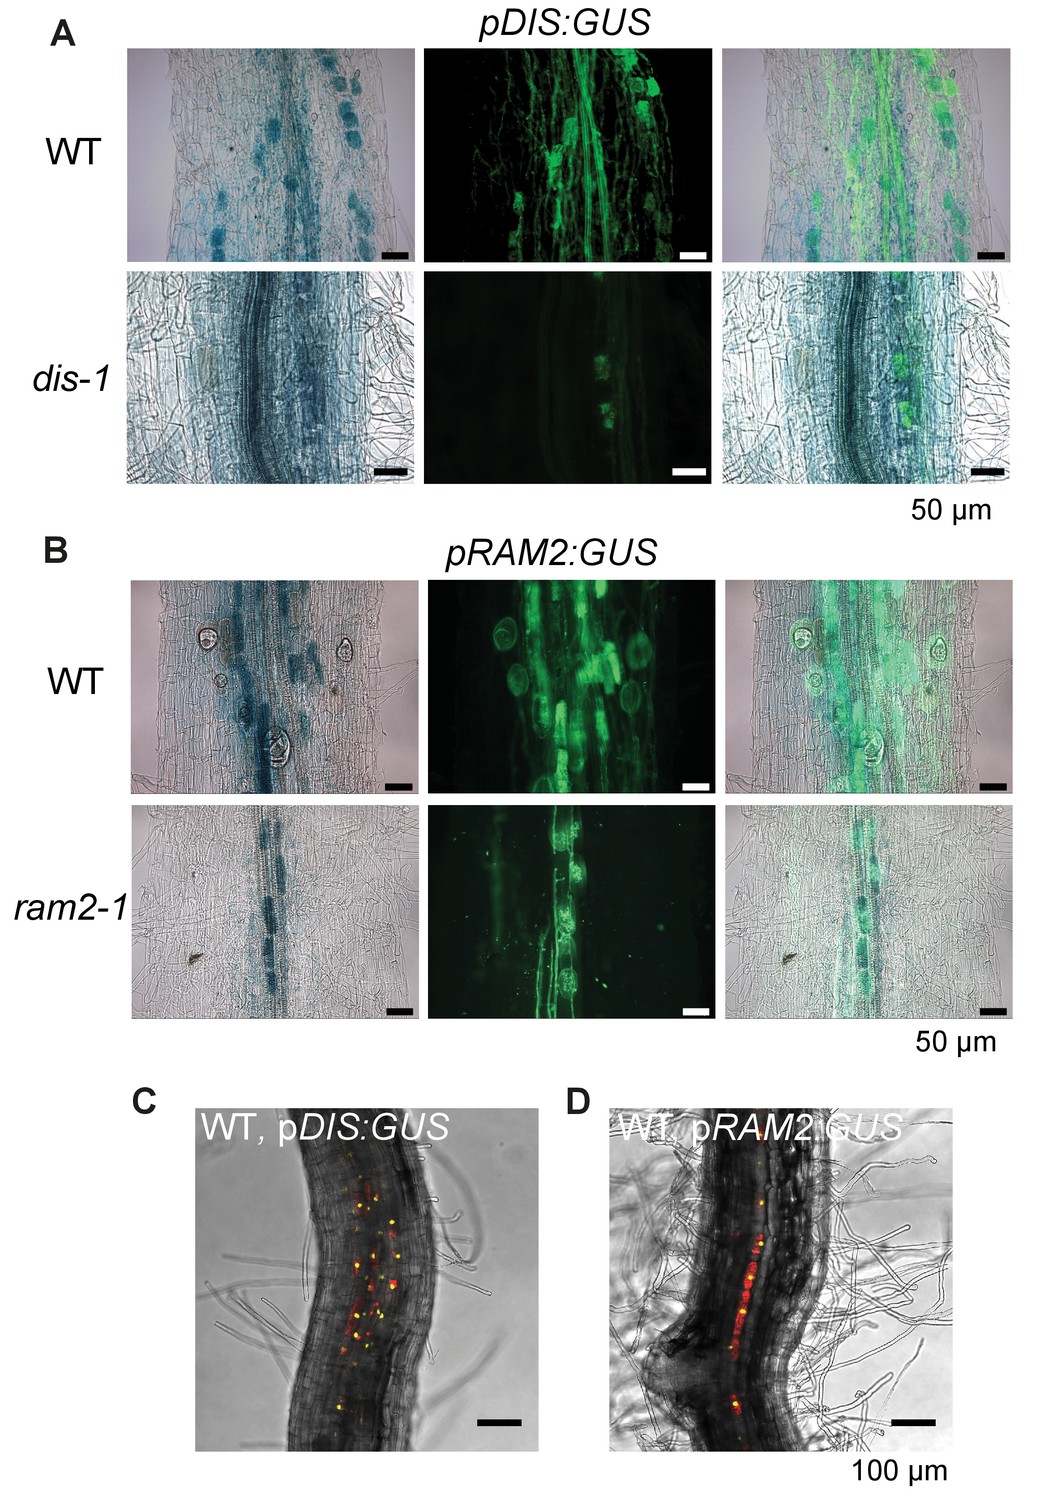
DIS and RAM2 promoter activity in wild type and dis and ram2 mutants.
GUS activity in colonized transgenic L. japonicus wild-type and mutant roots transformed with constructs containing a 1.5 kb promoter fragment of DIS (A) or a 2.275 kb promoter fragment of RAM2 (B) fused to the uidA gene. Left micrographs: bright field channel to detect GUS-staining, middle micrographs: GFP-channel to detect (WGA)-AlexaFluor488 stained fungal structures. Right micrographs: Merge. (C-D) Single optical section of z-stack shown in Figure 2Aa (C) and Figure 2Ba (D) showing that DIS and RAM2 promoter activity is detected exclusively in the cortex.
Figure 3 with 3 supplements
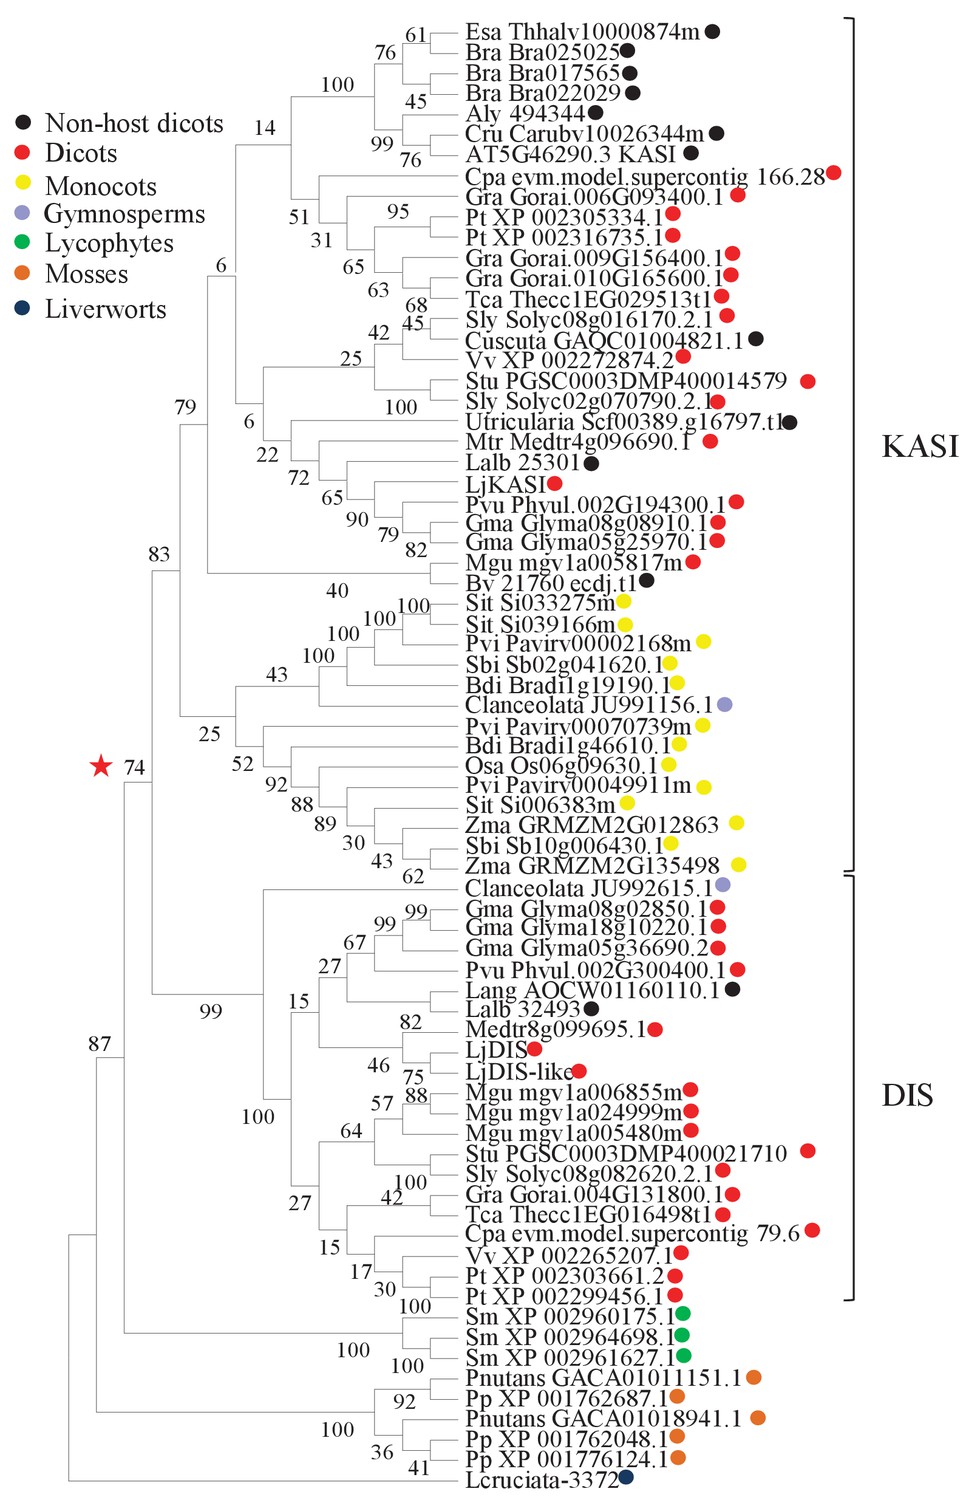
Phylogenetic tree of KASI proteins in land plants.
Protein sequences were aligned using MAFFT. Phylogenetic trees were generated by neighbor-joining implemented in MEGA5 (Tamura et al., 2011). Partial gap deletion (95%) was used together with the JTT substitution model. Bootstrap values were calculated using 500 replicates. DIS likely originated before the angiosperm divergence (red star).
-
Figure 3—source data 1
Accession numbers for protein sequences used in the phyologenic tree.
- https://doi.org/10.7554/eLife.29107.017
Figure 3—figure supplement 1
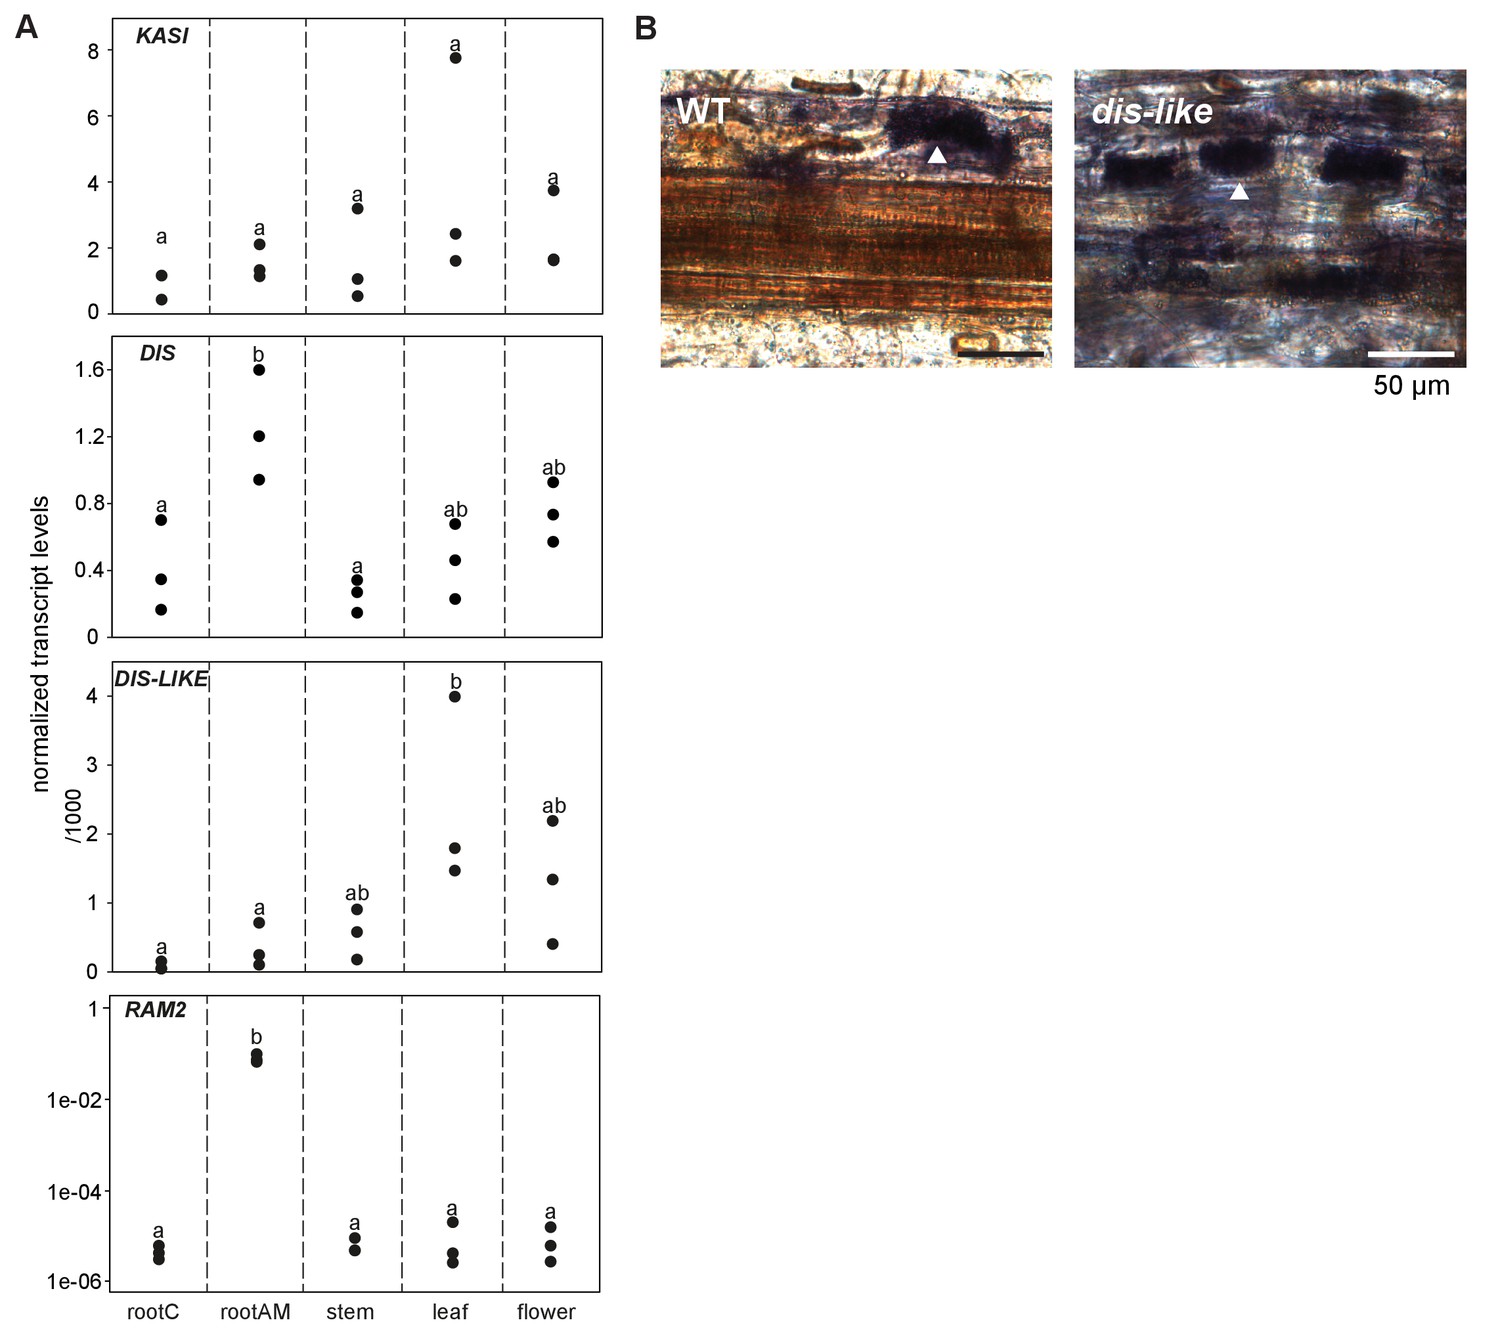
Transcript accumulation of KASI and RAM2 genes.
(A) Transcript accumulation of DIS, DIS-LIKE, KASI and RAM2 in control (mock) and R. irregularis colonized (AM) roots and in different organs of L. japonicus assessed by qRT-PCR. Expression values were normalized to those of the constitutively expressed gene EF1α (DIS, DIS-LIKE, KASI) and Ubiquitin10 (RAM2). Black circles represent three biological replicates. Different letters indicate significant differences (ANOVA; posthoc Tukey; n = 15; p≤0.05, F4,14(KASI) = 1.191, F4,14(DIS) = 8.412, F4,14(DIS-LIKE) = 4.563; p≤0.001, F4,14 = 67.41 (RAM2)). AM plants were inoculated with R. irregularis. Control and AM plants were harvested 5 wpi. (B) Arbuscule phenotype in wild type and dis-like-5 mutant roots after 5 wpi with R. irregularis as indicated by acid ink staining. White arrow heads indicate arbuscules.
Figure 3—figure supplement 2

Shoot phenotypes of dis and ram2 mutants.
dis and ram2 mutants do not show growth differences in shoot growth as compared to Gifu wild-type. The image has been taken 17 weeks post planting (size bar, 5 cm).
Figure 3—figure supplement 3
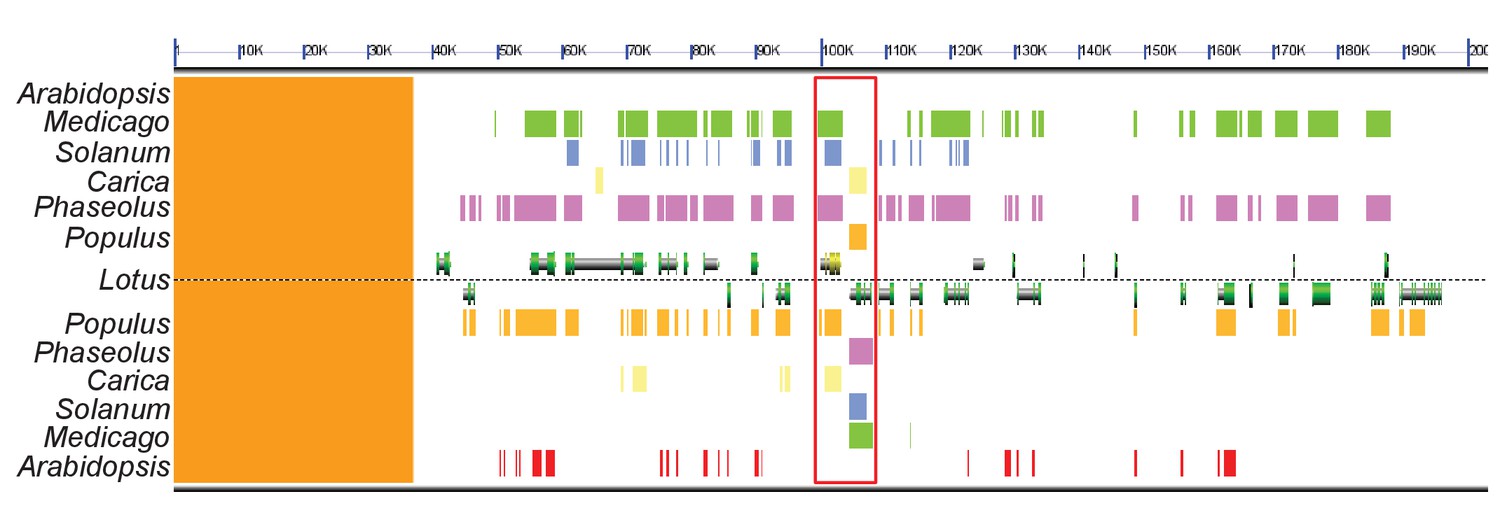
Genomic comparison of the DIS locus in host and non-host species.
Synteny analysis of a ~ 200 kb sized region in the Lotus japonicus, Medicago truncatula (green), Populus trichocarpa (orange), Phaseolus vulgaris (pink), Solanum lycopersicum (blue) and Carica papaya (yellow) genomes containing the DIS locus. The genomic block is well conserved in these host species. By contrast, no DIS homolog was detected in the corresponding genomic block of Arabidopsis thaliana (red). The red rectangle indicates the DIS and DIS-LIKE locus, DIS is indicated in yellow. The sequences above Lotus correspond to the forward strand and those below Lotus to the reverse strand. The orange strip on the left side corresponds to a non-assembled region of the L. japonicus genome.
Figure 4
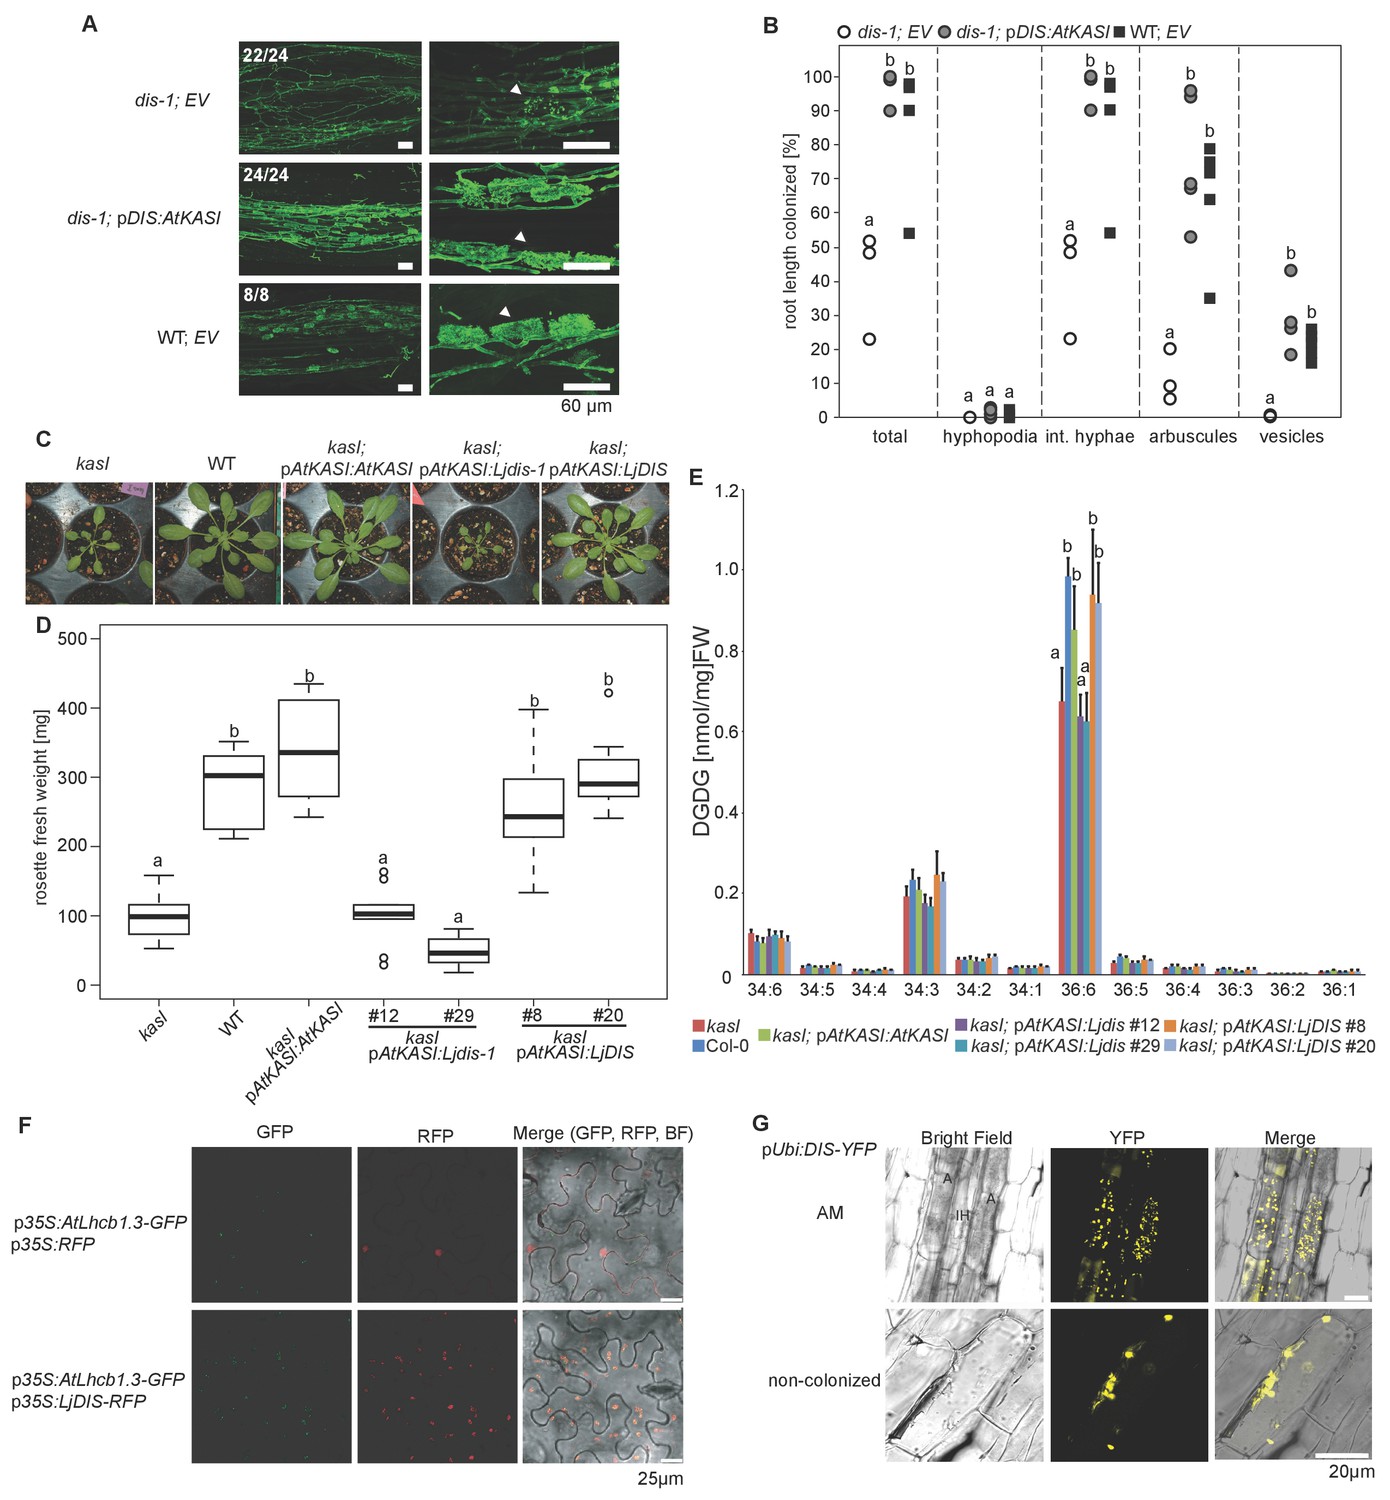
DIS function is equivalent to a canonical KASI.
(A) Microscopic AM phenotype of transgenic dis-1 mutant and wild-type hairy roots transformed with either an empty vector (EV) or the Arabidopsis KASI gene fused to the L. japonicus DIS promoter. White arrowheads indicate arbuscules. (B) Quantification of AM colonization in transgenic roots of dis-1 transformed with EV (open circles), dis-1 transformed with pDIS-AtKASI (grey circles) and wild-type transformed with EV (black squares). int. hyphae, intraradical hyphae. Different letters indicate significant differences (ANOVA; posthoc Tukey; n = 15; p≤0.001) among genotypes for each fungal structure separately. F2,12 = 0.809 (total and intraradical hyphae), F2,12 = 43.65 (arbuscules), F2,12 = 0.0568 (vesicles). (C) Rosettes of Arabidopsis, kasI mutant, Col-0 wild-type plants and kasI mutant plants transformed either with the native AtKASI gene, the dis-1 mutant or the DIS wild-type gene driven by the Arabidopsis KASI promoter at 31 days post planting. (D) Rosette fresh weight of kasI mutant, Col-0 wild-type plants, one transgenic pAtKASI:AtKASI complementation line (Wu and Xue, 2010) and two independent transgenic lines each of kasI mutant plants transformed either with the dis-1 mutant or the DIS wild-type gene driven by the Arabidopsis KASI promoter at 31 days post planting. Different letters indicate significant differences (ANOVA; posthoc Tukey; n = 70; p≤0.001; F6,63 = 34.06) among genotypes. (E) Q-TOF MS/MS analysis of absolute amount of digalactosyldiacylglycerols (DGDG) containing acyl chains of 16:x + 18:x(34:x DGDG) or di18:x(36:x DGDG) derived from total leaf lipids of the different Arabidopsis lines. Different letters indicate significant differences (ANOVA; posthoc Tukey; n = 32; (p≤0.05, F 6,25 = 14.48 (36:6)). (F) Subcellular localization of DIS in transiently transformed Nicotiana benthamiana leaves. Free RFP localizes to the nucleus and cytoplasm (upper panel). RFP fused to DIS co-localizes with the Arabidopsis light harvesting complex protein AtLHCB1.3-GFP in chloroplasts (lower panel). (G) Subcellular localization in plastids of DIS-YFP expressed under the control of the L. japonicus Ubiquitin promoter in R. irregularis colonized (upper panel) and non-colonized (lower panel) L. japonicus root cortex cells. BF, bright field; IH, intercellular hypha; A, arbuscule.
Figure 5 with 11 supplements
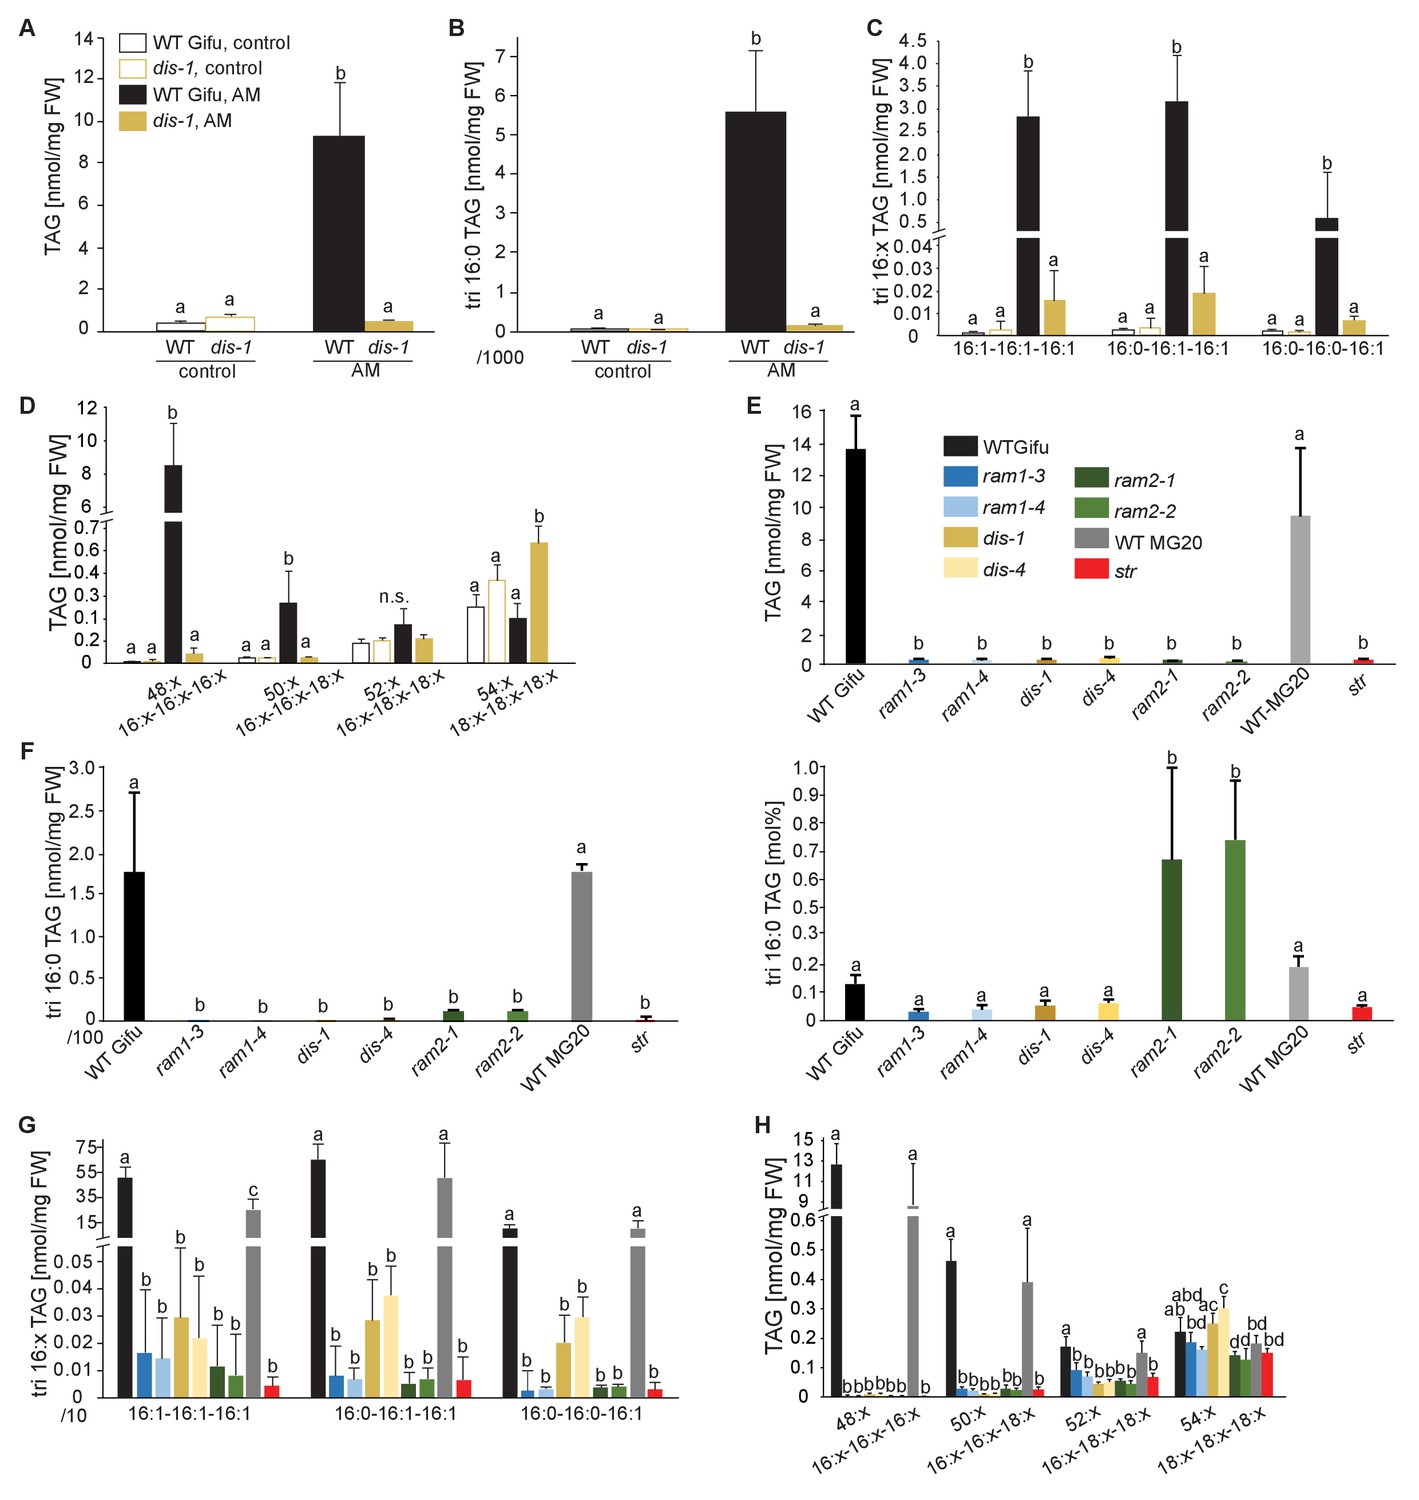
Lack of characteristic accumulation of triacylglycerols in AM-defective mutants.
(A-D) Quantitative accumulation of (A) total triacylglycerols, (B) tri16:0-triacylglycerol (C) tri16:x-triacylglycerols and (D) of triacylglycerols harbouring 16:x and 18:x FA-chains in non-colonized and R. irregularis colonized wild-type and dis-1 roots. Different letters indicate significant differences (ANOVA; posthoc Tukey) (A): n = 18; p≤0.001; F3,14 = 68.16. (B): n = 18; p≤0.001; F3,14 = 68.48. (C): n = 19; p≤0.01, F3,15 = 7.851 (16:1-16:1-16:1); p≤0.001, F3,15 = 14.52 (16:0-16:1-16:1); p≤0.001, F3,15 = 39.22 (16:0-16:0-16:1). (D): n = 19; p≤0.001, F3,15 = 12.15 (48:x), F3,15 = 15.56 (50:x); p≤0.01, F3,15 = 22.93 (54:x). (E-G) Quantitative accumulation of (E) total triacylglycerols, (F) tri16:0-triacylglycerols, (G) tri16:x-triacylglycerols and (H) of triacylglycerols harbouring 16:x and 18:x FA-chains in colonized roots of L. japonicus wild-type Gifu, wild-type MG-20 and arbuscule-defective mutants. Different letters indicate significant differences (ANOVA; posthoc Tukey). (E): n = 40; p≤0.001; F8,31 = 38.42. (F) Left: absolute tri16:0 TAG content: n = 40; p≤0.001; F8,31 = 19.05. Right: tri16:0 TAG proportion among all TAGs, n = 40; p≤0.001; F8,31 = 14.21. (G): p≤0.001; n = 41, F8,32 = 86.16 (16:1-16:1-16:1); n = 39, F8,30 = 24.16 (16:0-16:1-16:1); n = 40, F8,31 = 17.67 (16:0-16:0-16:1). (H): n = 40; p≤0.001, F8,31 = 39.26 (48:x), F8,31 = 28.93 (50:x); p≤0.01, F8,31 = 19.78 (52:x); p≤0.05, F8,31 = 13.77 (54:x). (A-H) Bars represent means ±standard deviation (SD) of 3–5 biological replicates.
-
Figure 5—source data 1
Raw data for lipid profiles in Figure 5 and Figure 5—figure supplements 1–3 and 5–11.
- https://doi.org/10.7554/eLife.29107.023
Figure 5—figure supplement 1
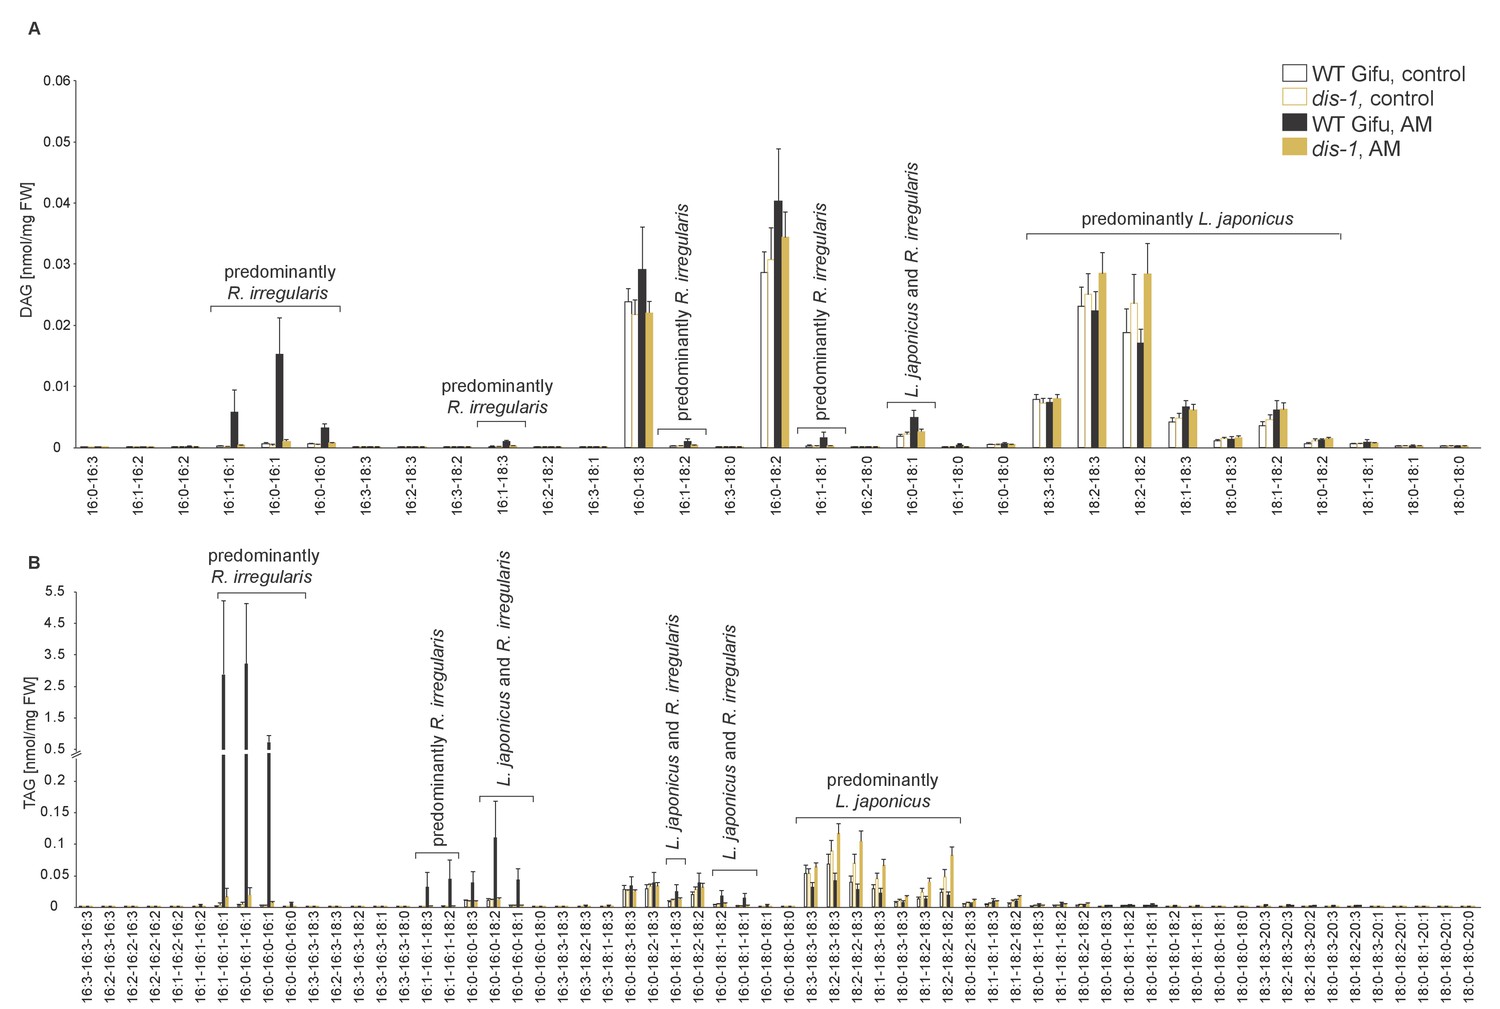
Diacylglycerol (DAG) and triacylglycerol (TAG) profiles of L. japonicus WT and dis-1 control and AM roots.
(A) Profile of diacylglycerols in control and AM-colonized L. japonicus WT and dis-1 roots. (B) Profile of triacylglycerols in control and AM-colonized L. japonicus WT and dis-1 roots. (A–B) Bars represent means ±standard deviation (SD) of 3–5 biological replicates. ‘L. japonicus and R. irregularis’ marks lipids which are found in both organisms according to (Wewer et al., 2014) .
Figure 5—figure supplement 2
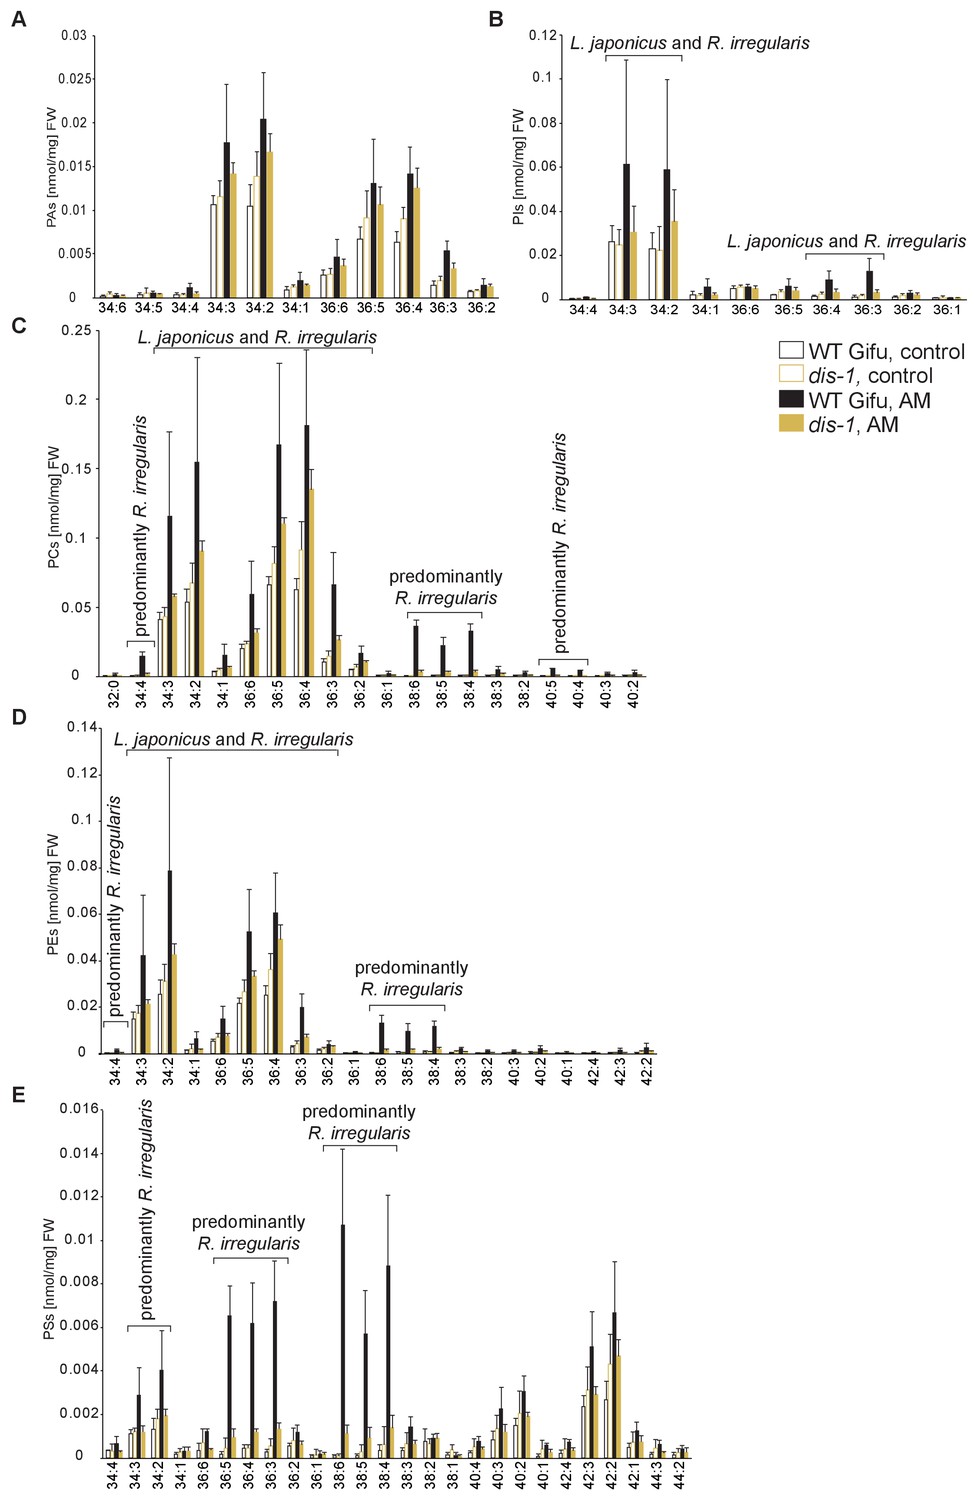
Profiles of phospholipids in non-colonized and colonized L. japonicus WT Gifu and dis-1 roots.
(A) Absolute amounts of phosphatidic acid (PA) species. (B) Absolute amounts of phosphatidylinositol (PI) species. (C) Absolute amounts of phosphatidylcholine (PC) species. (D) Absolute amounts of phosphatidylethanolamine (PE) species. (E) Absolute amounts of phosphatidylserine (PS) species. (A–D) Bars represent means ±standard deviation (SD) of 3–5 biological replicates. ‘L. japonicus and R. irregularis’ marks lipids which are found in both organisms according to Wewer et al. (2014).
Figure 5—figure supplement 3
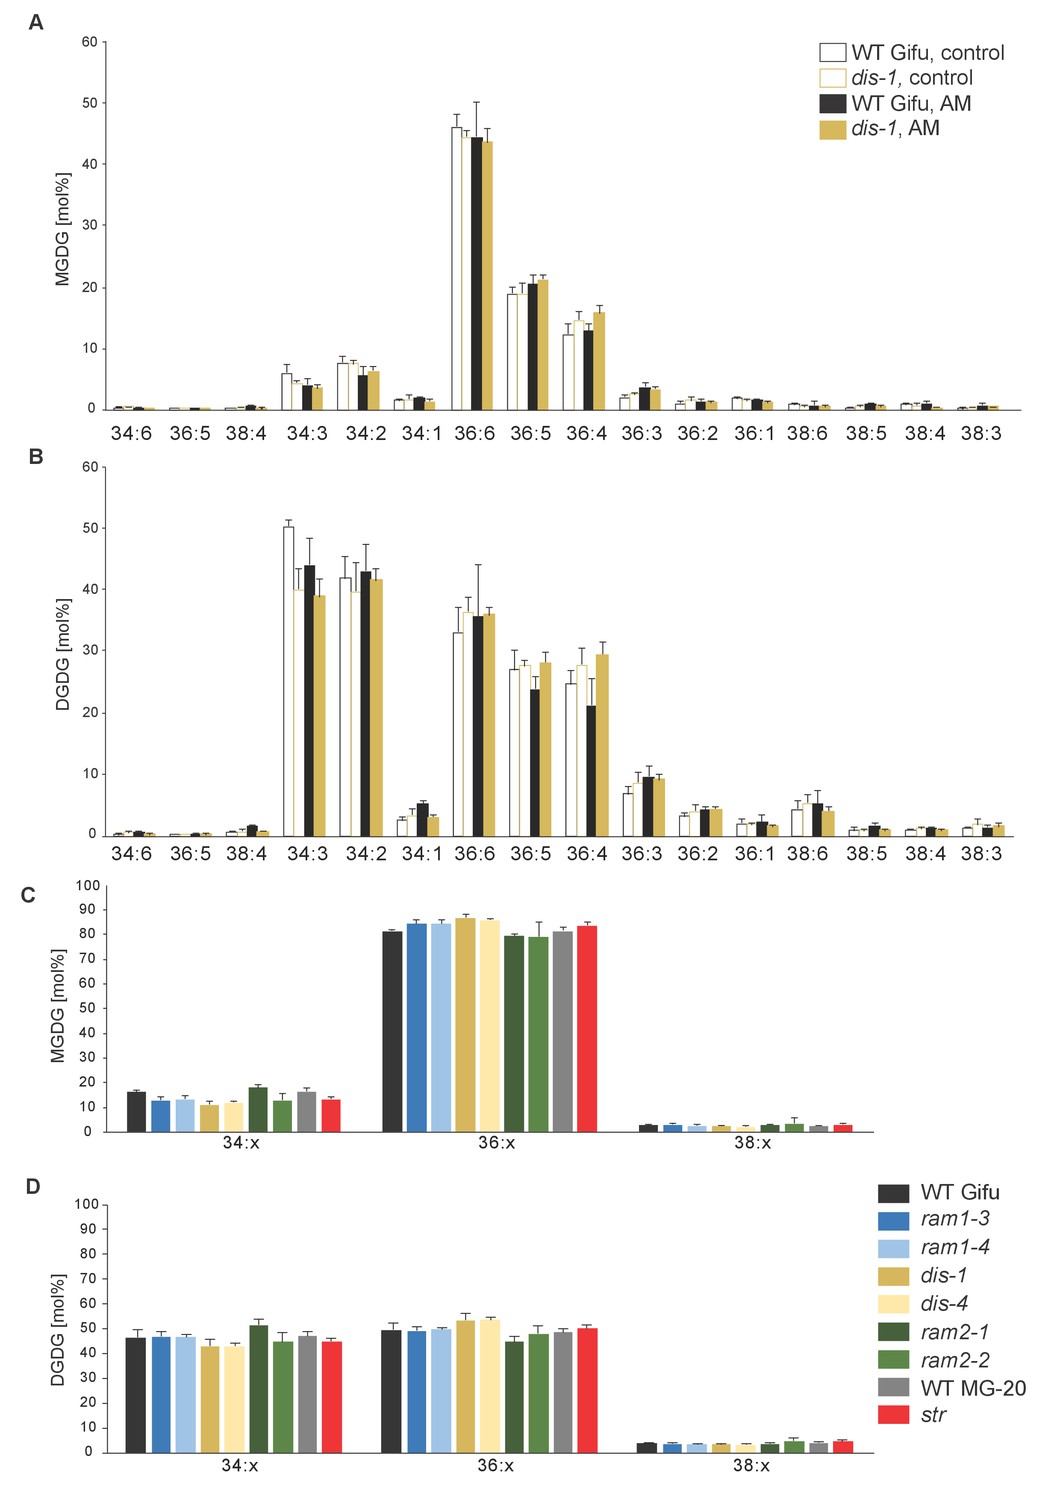
MGDG and DGDG profiles do not differ among L. japonicus wild-type and mutant roots.
(A) Relative amounts of monogalactosyldiacylglycerol (MGDG) in control and colonized roots of Gifu WT and dis-1. (B) Relative amount of digalactosyldiacylglycerol (DGDG) in control and colonized roots of Gifu WT and dis-1. (C) Relative amounts of monogalactosyldiacylglycerols (MGDG) containing acyl chains of 16:x + 18:x(34:x MGDG), di18:x(36:x MGDG) or 18:x + 20:x(38:x MGDG) in the different colonized genotypes. (D) Relative amount of digalactosyldiacylglycerols (DGDG) containing acyl chains of 16:x + 18:x(34:x DGDG), di18:x(36:x DGDG) or 18:x + 20:x(38:x DGDG) of the different colonized genotypes. (A–D) Bars represent means ±standard deviation (SD) of 3–5 biological replicates.
Figure 5—figure supplement 4
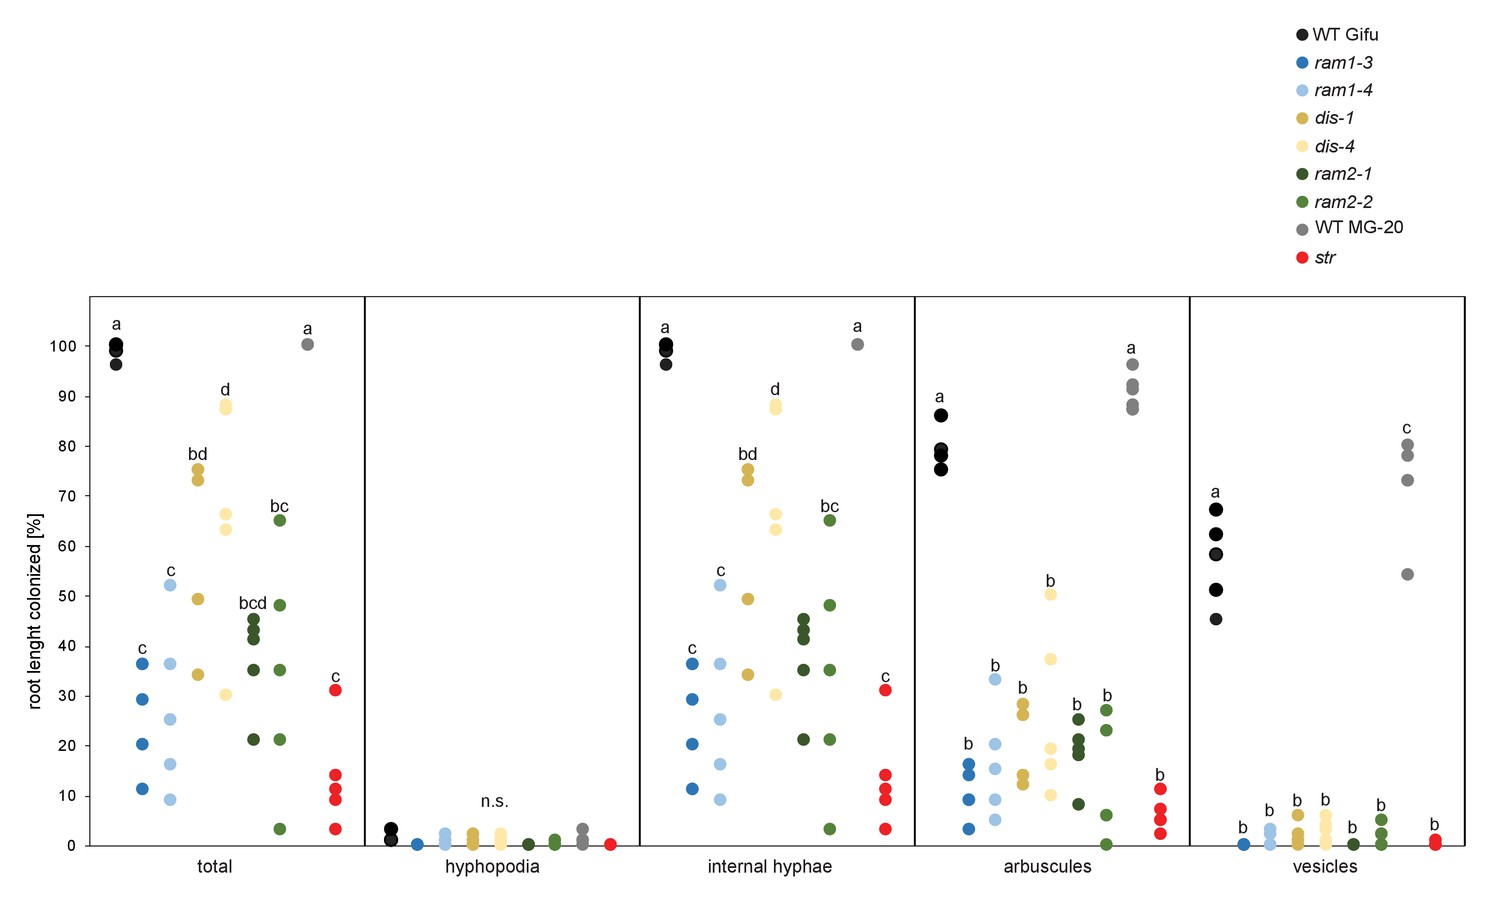
All arbuscule-deficient mutants show reduced root length colonization.
Quantitative AM colonization in root samples employed for lipidomics (Figure 3D–F, Figure 5E–H, Figure 7, Figure 5—figure supplements 1–3 and 5–11) as determined by modified grid-line intersect methods after acid-ink staining. WT Gifu, WT MG-20 and all AM-deficient mutants in the Gifu background (ram1-3, ram1-4, dis-1, dis-4, ram2-1 and ram2-2) and the str mutant in the MG-20 background. Different letters indicate significant differences (ANOVA; posthoc Tukey; n = 45) among genotypes for each fungal structure separately. p≤0.05, F8,36 = 21.69 (total and intraradical hyphae); p≤0.001, F8,36 = 62.1 (arbuscules), F8,36 = 176.5 (vesicles).
Figure 5—figure supplement 5
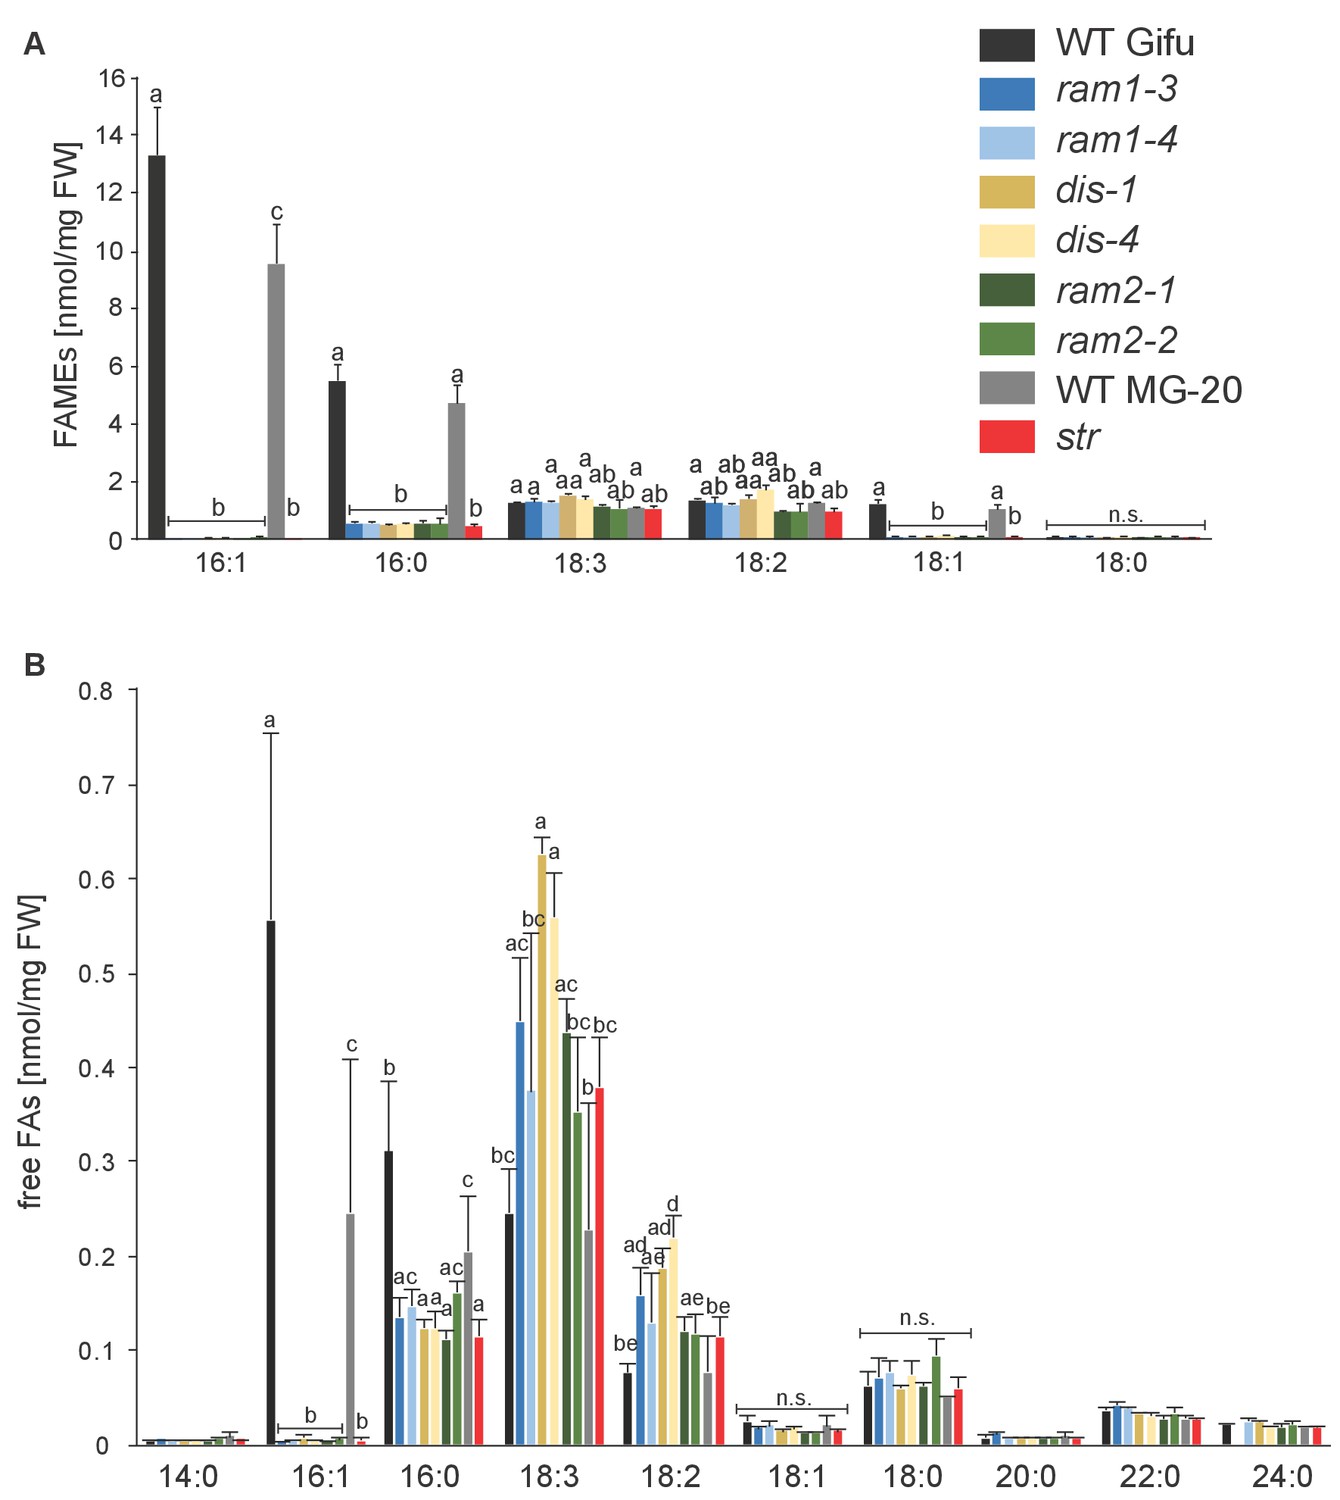
Total fatty acid and free fatty acid profiles of colonized L. japonicus WT and AM-defective mutant roots.
(A) Total amounts of fatty acids (FAME) in colonized L. japonicus roots of the different genotypes. Fatty acid methyl esters (FAME) were prepared from total root lipids and analysed by GC. Different letters indicate significant differences (ANOVA; posthoc Tukey; p≤0.01; (n = 42, F8,33 = 29.91 (16:1); n = 43, F8,34 = 20.25 (16:0); n = 43, F8,34 = 11.34 (18:3); F8,34 = 13.14 (18:2)). (B) Free fatty acid composition in colonized L. japonicus roots from Gifu WT, MG-20 WT, ram1-3, ram1-4, dis-1, dis-4, ram2-1, ram2-2 and str. Free fatty acids were isolated from total root lipids and converted into fatty acid methyl esters for quantification by GC Different letters indicate significant differences (ANOVA; posthoc Tukey; n = 44; (p≤0.001, F8,35 = 230.6 (16:0); p≤0.001, F8,35 = 257.7 (16:1); F8,35 = 222.5 (18:1); F8,35 = 15.48 (18:2); F8,35 = 8.225 (18:3)). (A–B) Bars represent means ±standard deviation (SD) of 3–5 biological replicates.
Figure 5—figure supplement 6
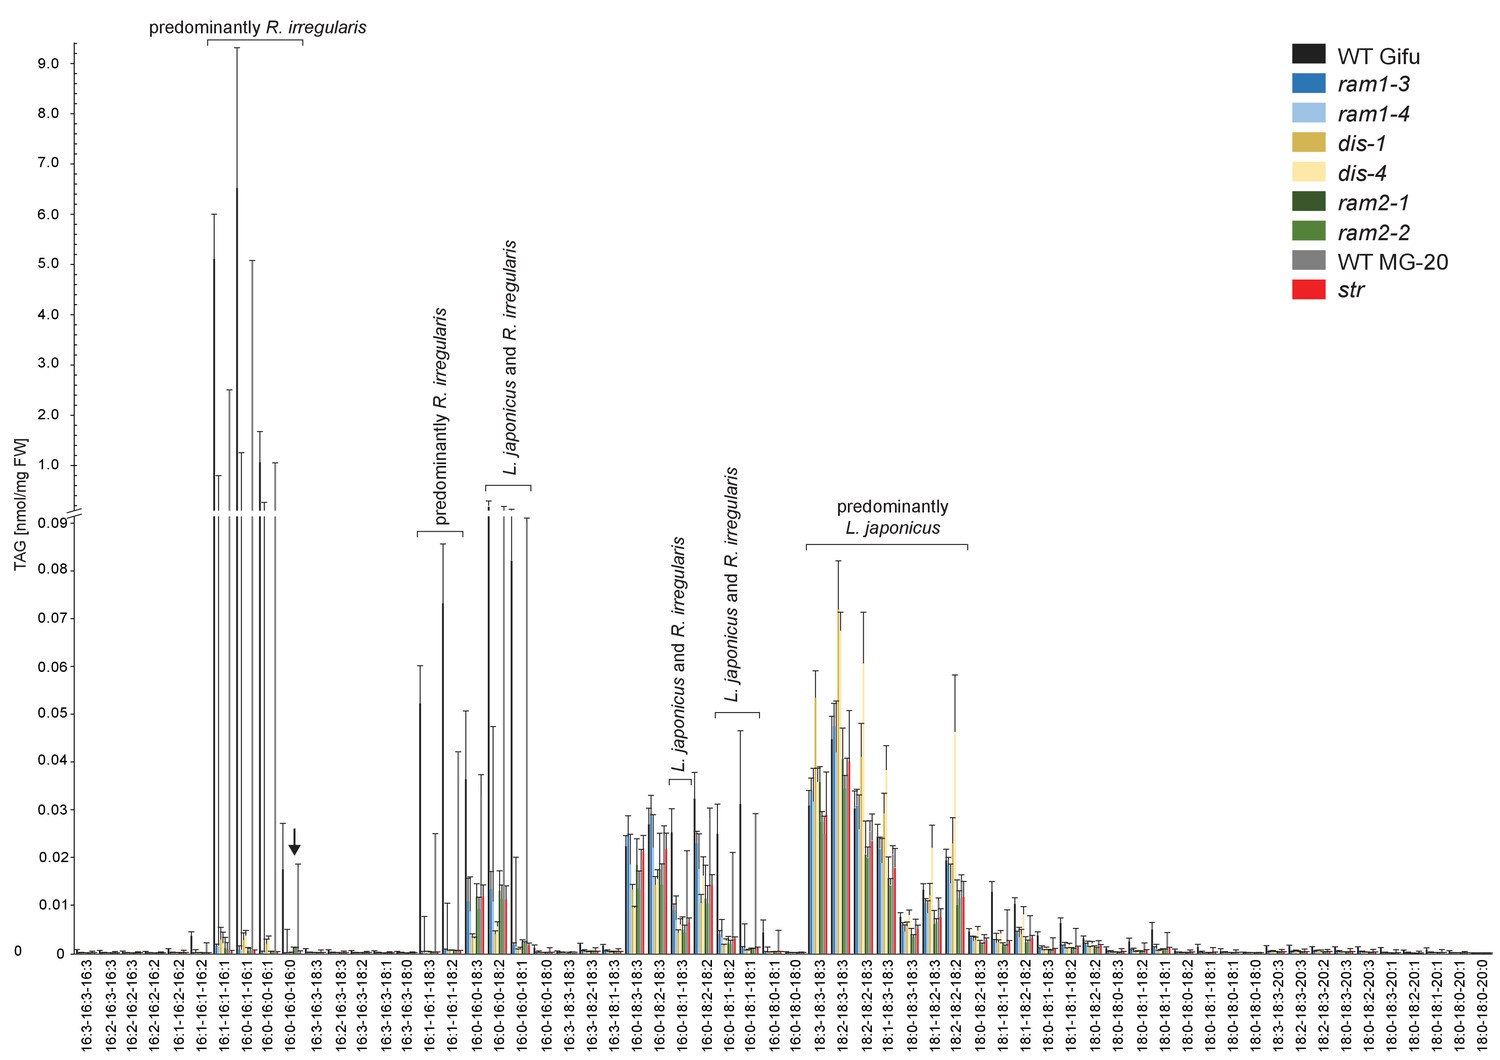
Triacylglycerol (TAG) profiles of colonized L. japonicus WT and AM-defective mutant roots.
Absolute amounts of triacylglycerol molecular species in colonized L. japonicus roots of WT Gifu, WT MG-20 ram1-3, ram1-4, dis-1, dis-4, ram2-1, ram2-2 and str. Black arrow indicates accumulation of tri 16:0 TAG in ram2-1 and ram2-2. Bars represent means ±standard deviation (SD) of 3–5 biological replicates.
Figure 5—figure supplement 7

Phosphatidic acid (PA) profiles in L. japonicus WT and AM-defective mutants.
Absolute amounts of phosphatidic acid molecular species in colonized L. japonicus roots of WT Gifu, WT MG-20 ram1-3, ram1-4, dis-1, dis-4, ram2-1, ram2-2 and str. Black arrow indicates accumulation of 32:0 (di16:0) PA in ram2-1 and ram2-2. Bars represent means ±standard deviation (SD) of 3–5 biological replicates.
Figure 5—figure supplement 8
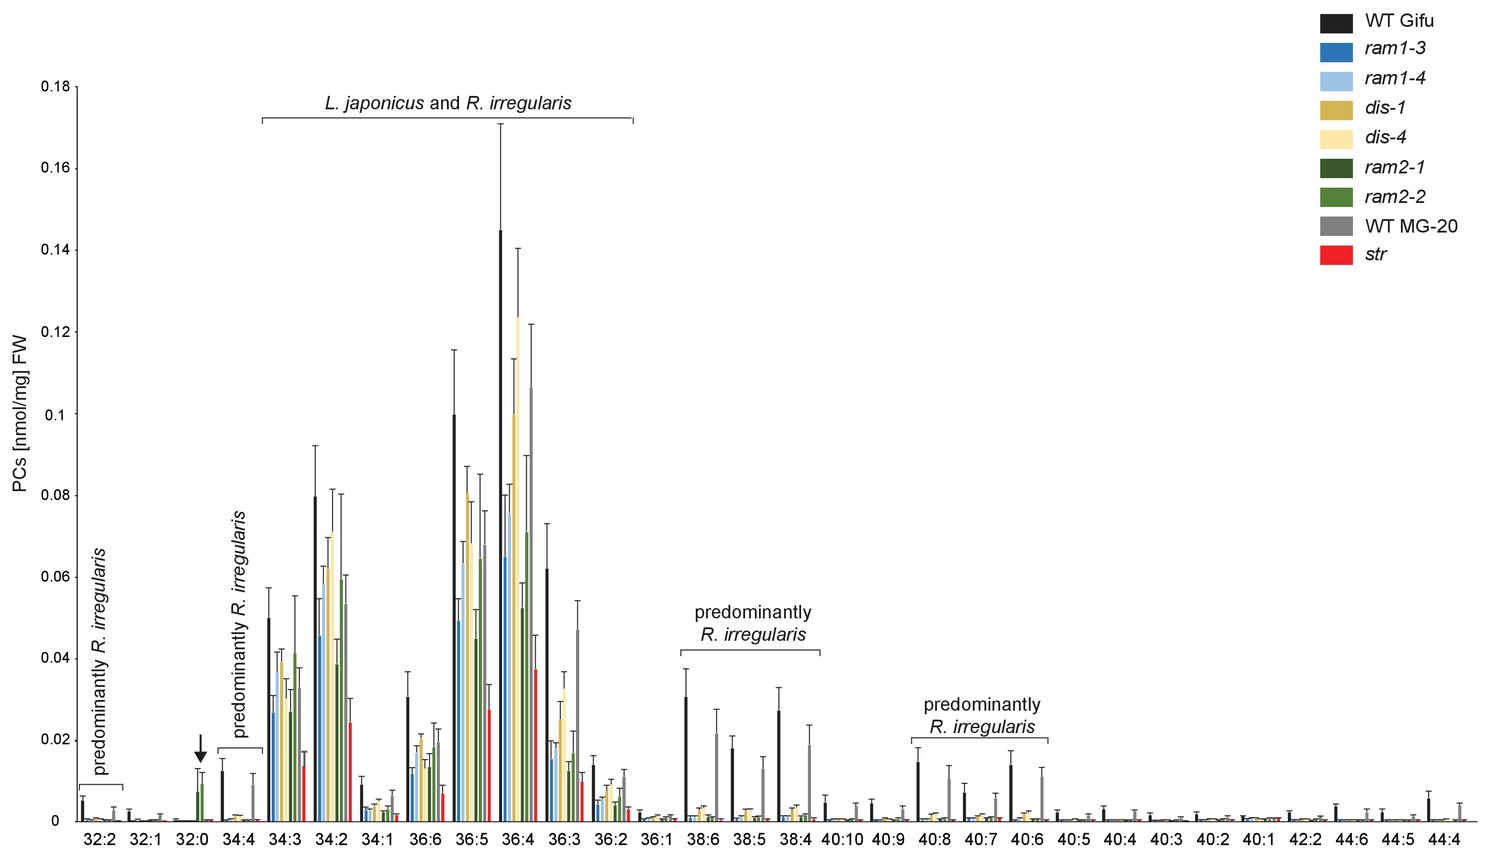
Profile of phosphatidylcholines (PC) in L. japonicus WT and AM-defective mutants.
Absolute amounts of phosphatidylcholine molecular species in colonized L. japonicus roots of WT Gifu, WT MG-20, ram1-3, ram1-4, dis-1, dis-4, ram2-1, ram2-2 and str. Bars represent means ±standard deviation (SD) of 3–5 biological replicates. ‘L. japonicus and R. irregularis’ marks lipids which are found in both organisms according to Wewer et al. (2014). Arrow highlights the exclusive accumulation of unusual 32:0 (di16:0) PC in ram2-1 and ram2-2.
Figure 5—figure supplement 9

Phosphatidylethanolamine (PE) profile in L. japonicus WT and AM-defective mutants.
Absolute amounts of phosphatidylethanolamine molecular species in colonized L. japonicus roots of WT Gifu, WT MG-20, ram1-3, ram1-4, dis-1, dis-4, ram2-1, ram2-2 and str. Bars represent means ±standard deviation (SD) of 3–5 biological replicates. ‘L. japonicus and R. irregularis’ marks lipids which are found in both organisms according to Wewer et al. (2014). Arrow highlights the exclusive accumulation of unusual 32:0 (di16:0) PE in ram2-1 and ram2-2.
Figure 5—figure supplement 10
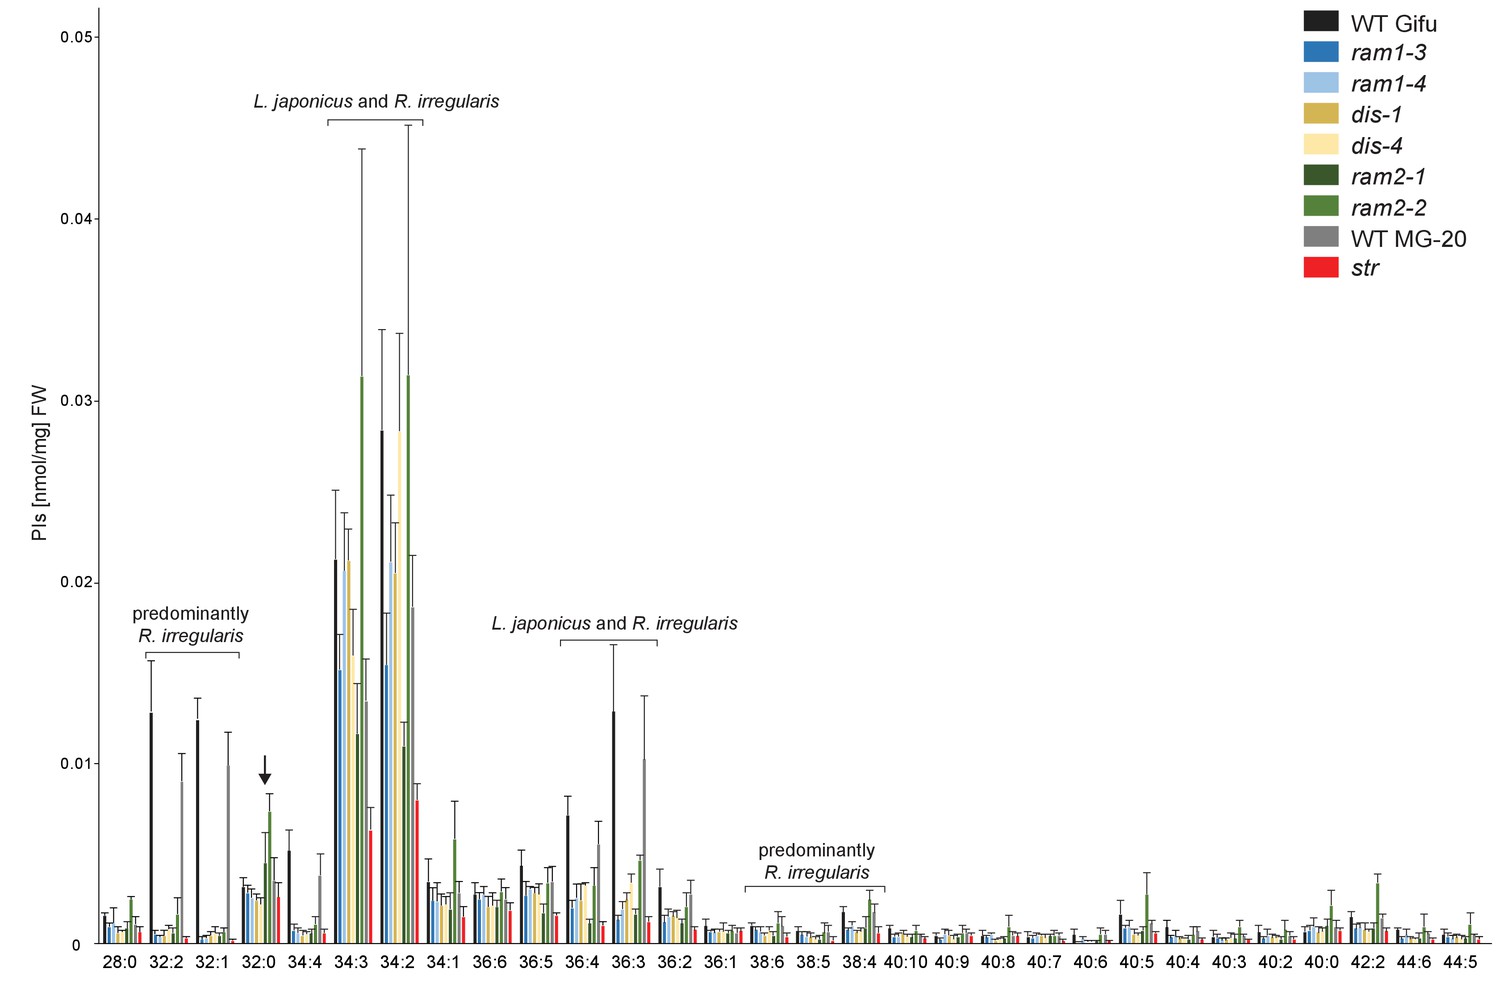
Phosphatidylinositol (PI) profile in L. japonicus WT and AM-defective mutants.
Absolute amounts of phosphatidylinositol molecular species in colonized L. japonicus roots of WT Gifu, WT MG-20, ram1-3, ram1-4, dis-1, dis-4, ram2-1, ram2-2 and str. Bars represent means ± standard deviation (SD) of 3–5 biological replicates. ‘L. japonicus and R. irregularis’ marks lipids which are found in in both organisms according to Wewer et al. (2014). Arrow highlights the exclusive accumulation of unusual 32:0 PI in ram2-1 and ram2-2.
Figure 5—figure supplement 11
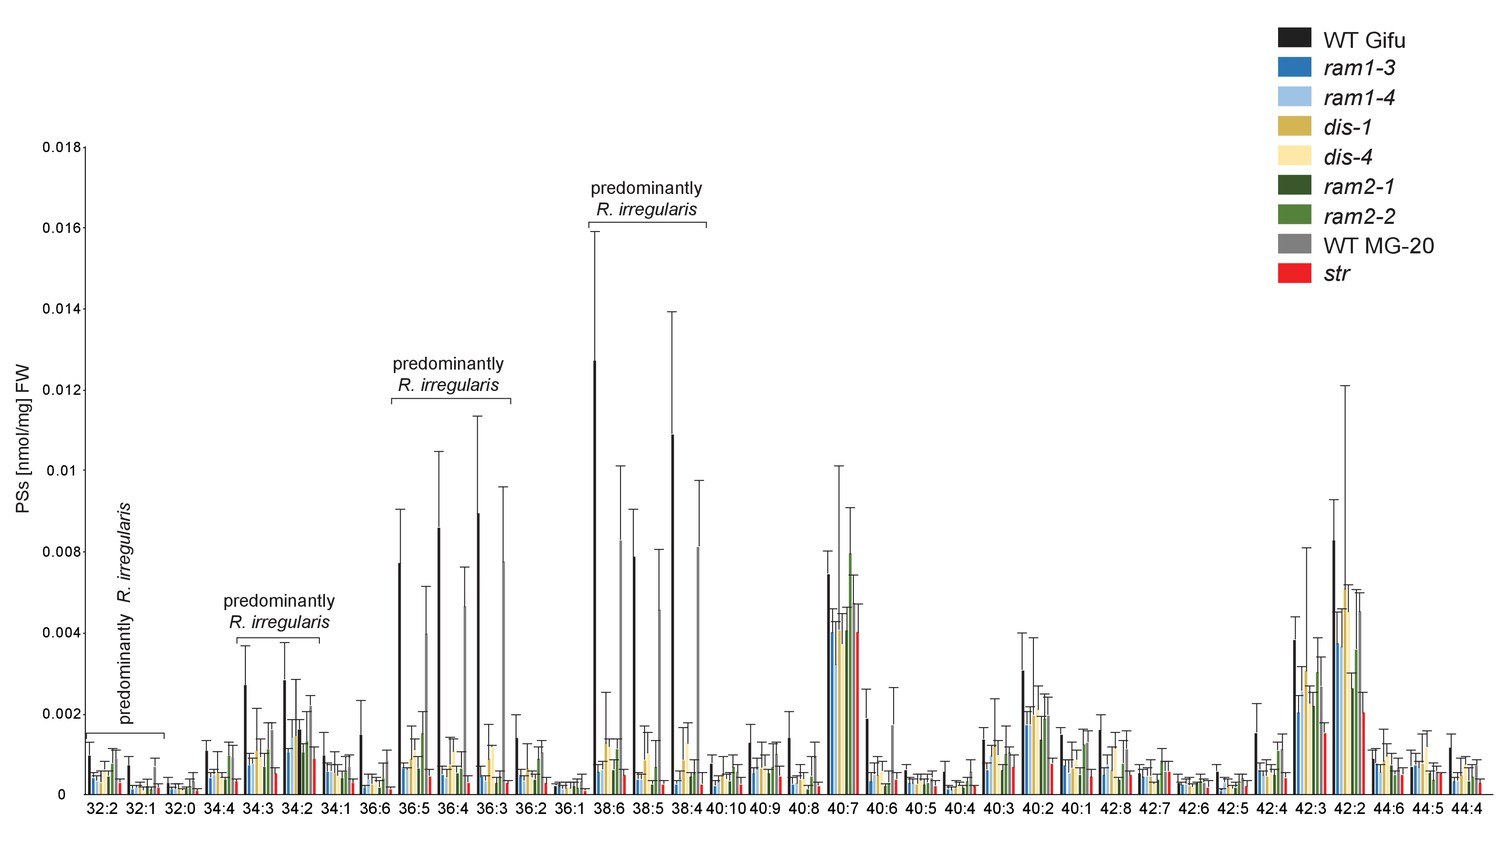
Phosphatidylserine (PS) profile in L. japonicus WT and AM-defective mutants.
Absolute amounts of phosphatidylserine molecular species in colonized L. japonicus roots of WT Gifu WT, WT MG-20, ram1-3, ram1-4, dis-1, dis-4, ram2-1, ram2-2 and str. Bars represent means ± standard deviation (SD) of 3–5 biological replicates.
Figure 6
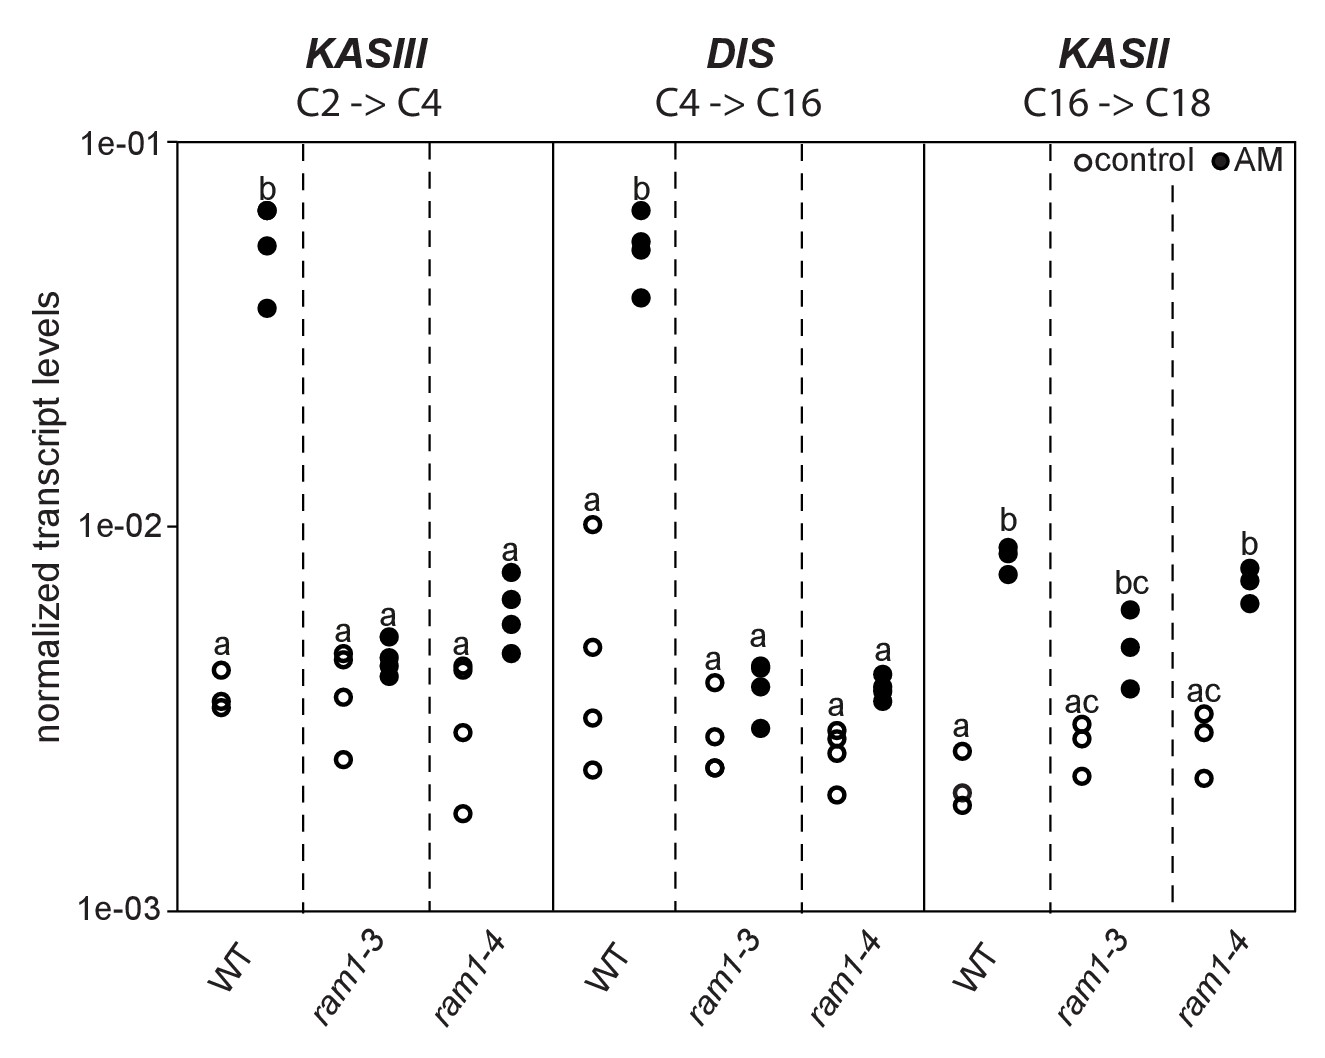
Loss of RAM1 affects AM-dependent induction of KASIII and DIS.
(A) RAM1 effects on AM-dependent induction of KASIII and DIS, which catalyze 16:0 FA biosynthesis, and absence of effects on KASII. According to BLAST analysis via Kazusa (http://www.kazusa.or.jp/lotus/) and NCBI (http://www.ncbi.nlm.nih.gov/) KASIII and KASII are single copy genes in L.japonicus. Transcript accumulation of KASIII, DIS and KASII in non-colonized (open circles) and colonized (black circles) roots of Gifu WT, ram1-3 and ram1-4. Different letters indicate different statistical groups (ANOVA; posthoc Tukey; p≤0.001; n = 23 F5,12 = 65.04(KASIII); n = 24 F5,18 = 54.42 (DIS); n = 18 F5,12 = 33.11 (KASII)). Transcript accumulation was determined by qRT-PCR and the housekeeping gene Ubiquitin10 was used for normalization. AM plants were inoculated with R. irregularis and harvested 5 wpi.
Figure 7
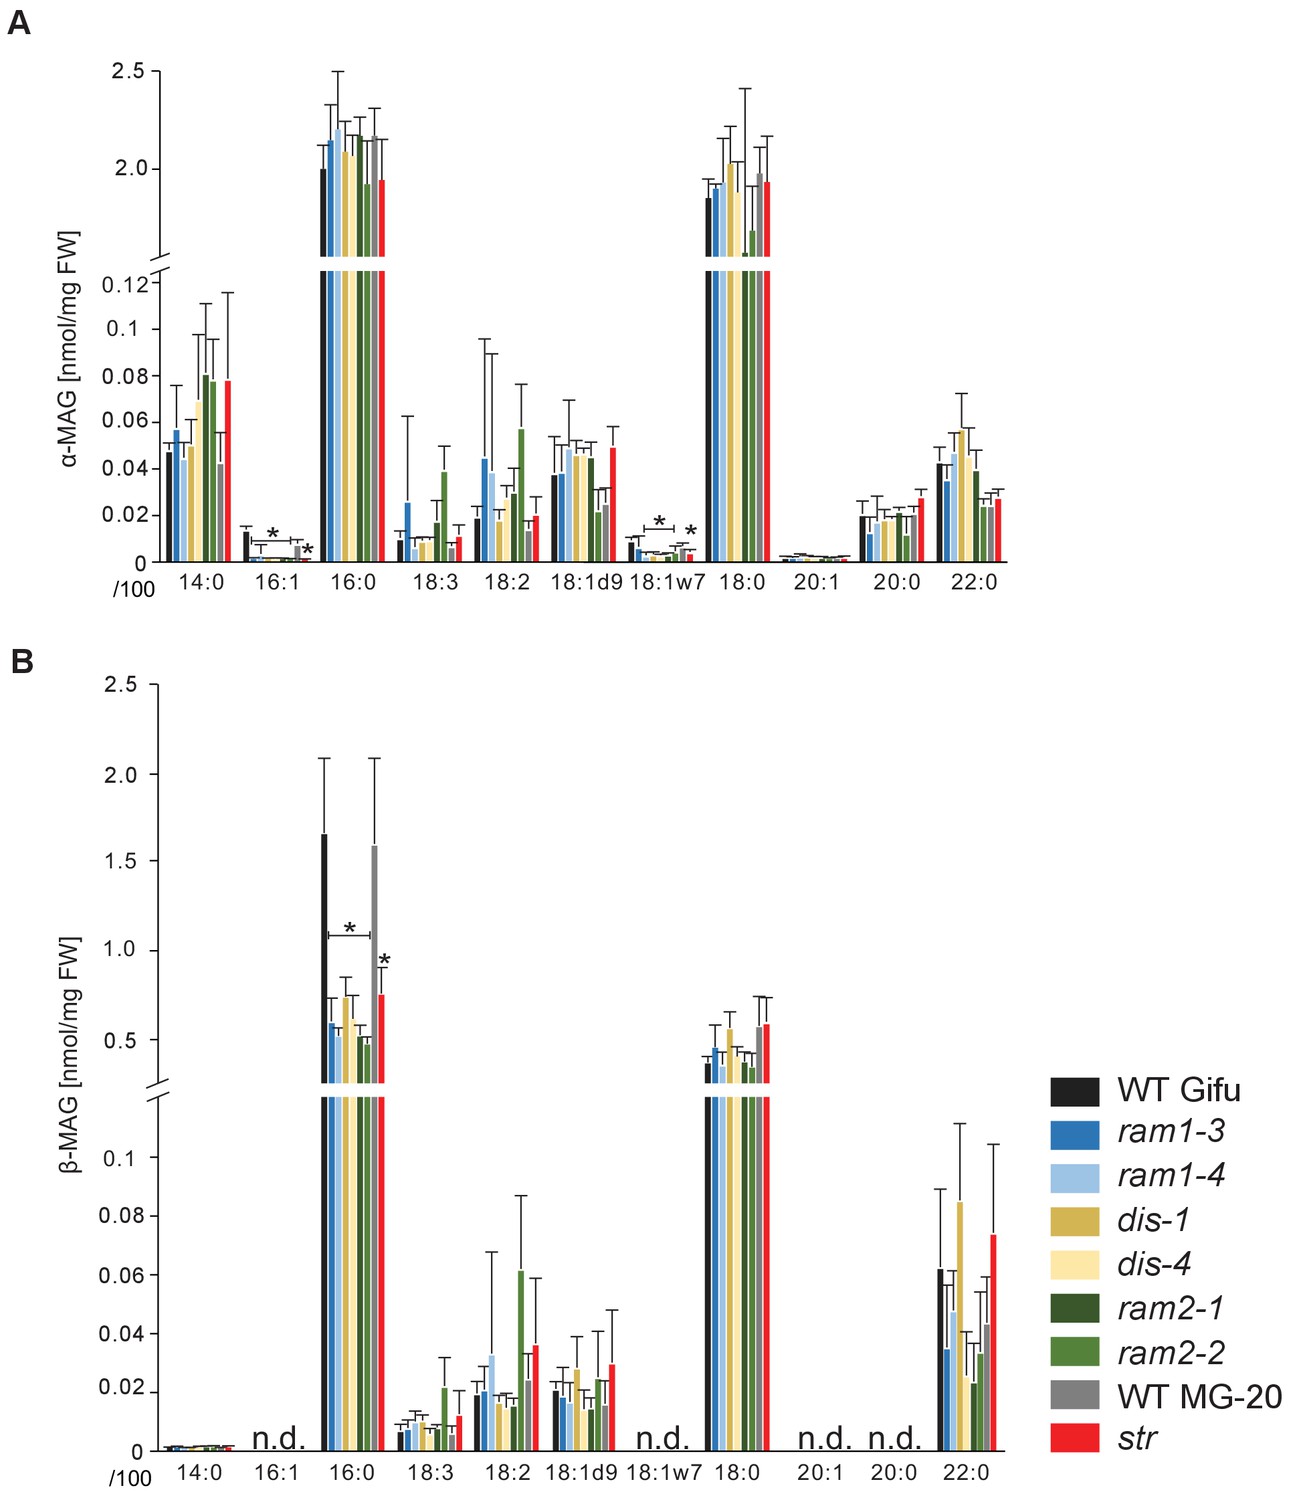
sn-1 monoacylglycerol (α-MAG) and sn-2 monoacylglycerol (β-MAG) profiles of colonized L. japonicus wild-type and AM-defective mutant roots.
(A) Total amounts of α-MAG molecular species in the different genotypes. (B) Total amounts of β-MAG molecular species in the different genotypes. 16:0 β-MAG levels are significantly reduced in all mutant lines compared to the respective wild-type. (A–B) Bars represent means ±standard deviation (SD) of 3–5 biological replicates. Black asterisk indicates significant difference of mutants vs. wild-type according to Student’s t-test, p<0.05.
Figure 8 with 4 supplements
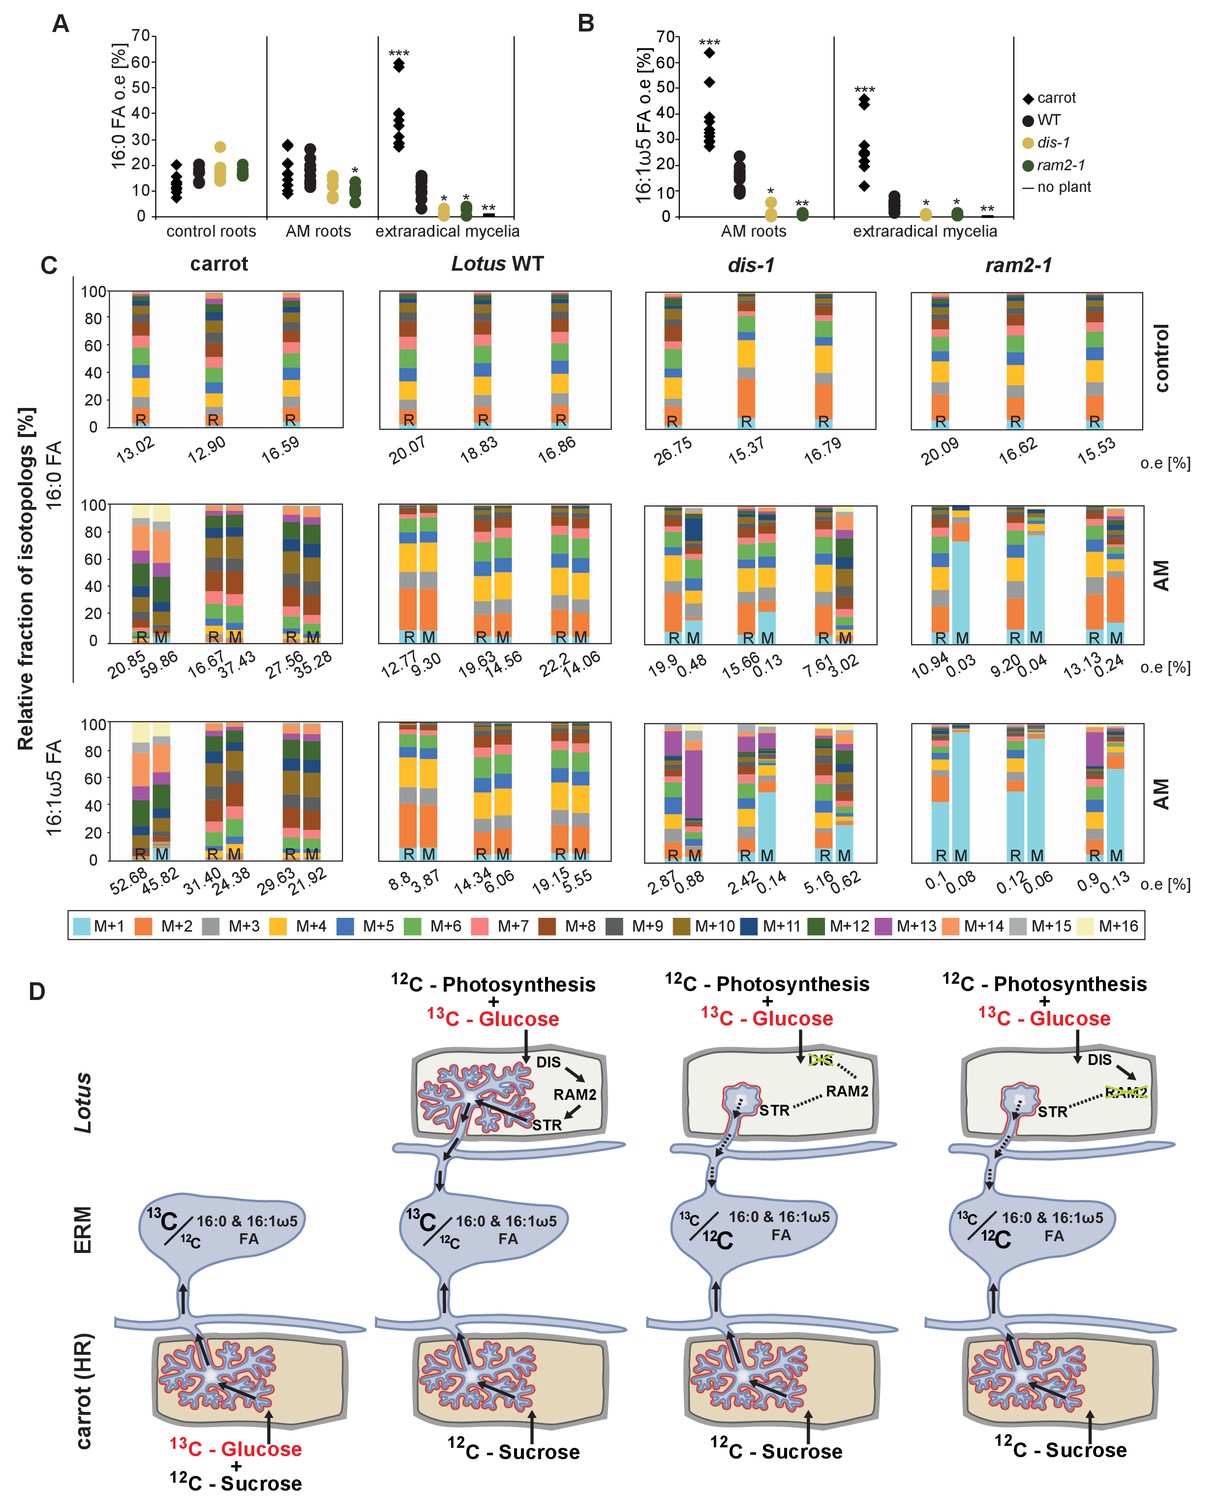
Isotopolog profiling indicates lipid transfer from plant to fungus.
(A–B) Overall excess (o.e.) 13C over air concentration in 16:0 FAs (A) and in 16:1ω5 FAs (B) detected in non-colonized (only 16:0 FAs) and colonized carrot, L. japonicus wild-type, dis-1, ram2-1 roots and in the extraradical mycelium of R. irregularis. P values were generated by ANOVA using the Dunnett Test for multiple comparisons to L. japonicus wild-type (n = 29 (16:0 control roots); n = 33 (16:0 root AM); n = 39 (16:0 extraradical mycelium); n = 33 (16:1ω5 root AM); n = 39 (16:1ω5 extraradical mycelium), ***p<0.001, **p<0.01, *p<0.05). (C) Relative fraction of 13C isotopologs for 16:0 FAs of three replicates of carrot, L. japonicus WT Gifu, dis-1, ram2-1 in control roots (upper panel) and AM roots and each of the associated R. irregularis extraradical mycelia with spores (middle panel) and 16:1ω5 FAs in AM roots and extraradical mycelia with spores (lower panel). Individual bars and double bars indicate individual samples. Values from roots are indicated by ‘R’ and from fungal extraradical mycelia with spores by ‘M’. For carrot and L. japonicus WT the 13C labelling pattern of 16:0 and 16:1ω5 FAs in the plant is recapitulated in the fungal extraradical mycelium. Extraradical mycelium associated with dis-1 and ram2-1 does not mirror these patterns. Compare bars for AM roots and extraradical mycelium side by side. Black numbers indicate 13C o. e. for individual samples. Colors indicate 13C-isotopologs carrying one, two, three, etc. 13C-atoms (M + 1, M + 2, M + 3, etc.). (D) Schematic and simplified illustration of carbon flow and 12C vs.13C-carbon contribution to plant lipid metabolism and transport to the fungus in the two-compartment cultivation setup used for isotope labelling. Carbohydrate metabolism and transport is omitted for simplicity. ERM, extraradical mycelium.
-
Figure 8—source data 1
Raw data for isotopolog profiles in Figure 8 and Figure 8—figure supplements 2,4.
- https://doi.org/10.7554/eLife.29107.038
Figure 8—figure supplement 1
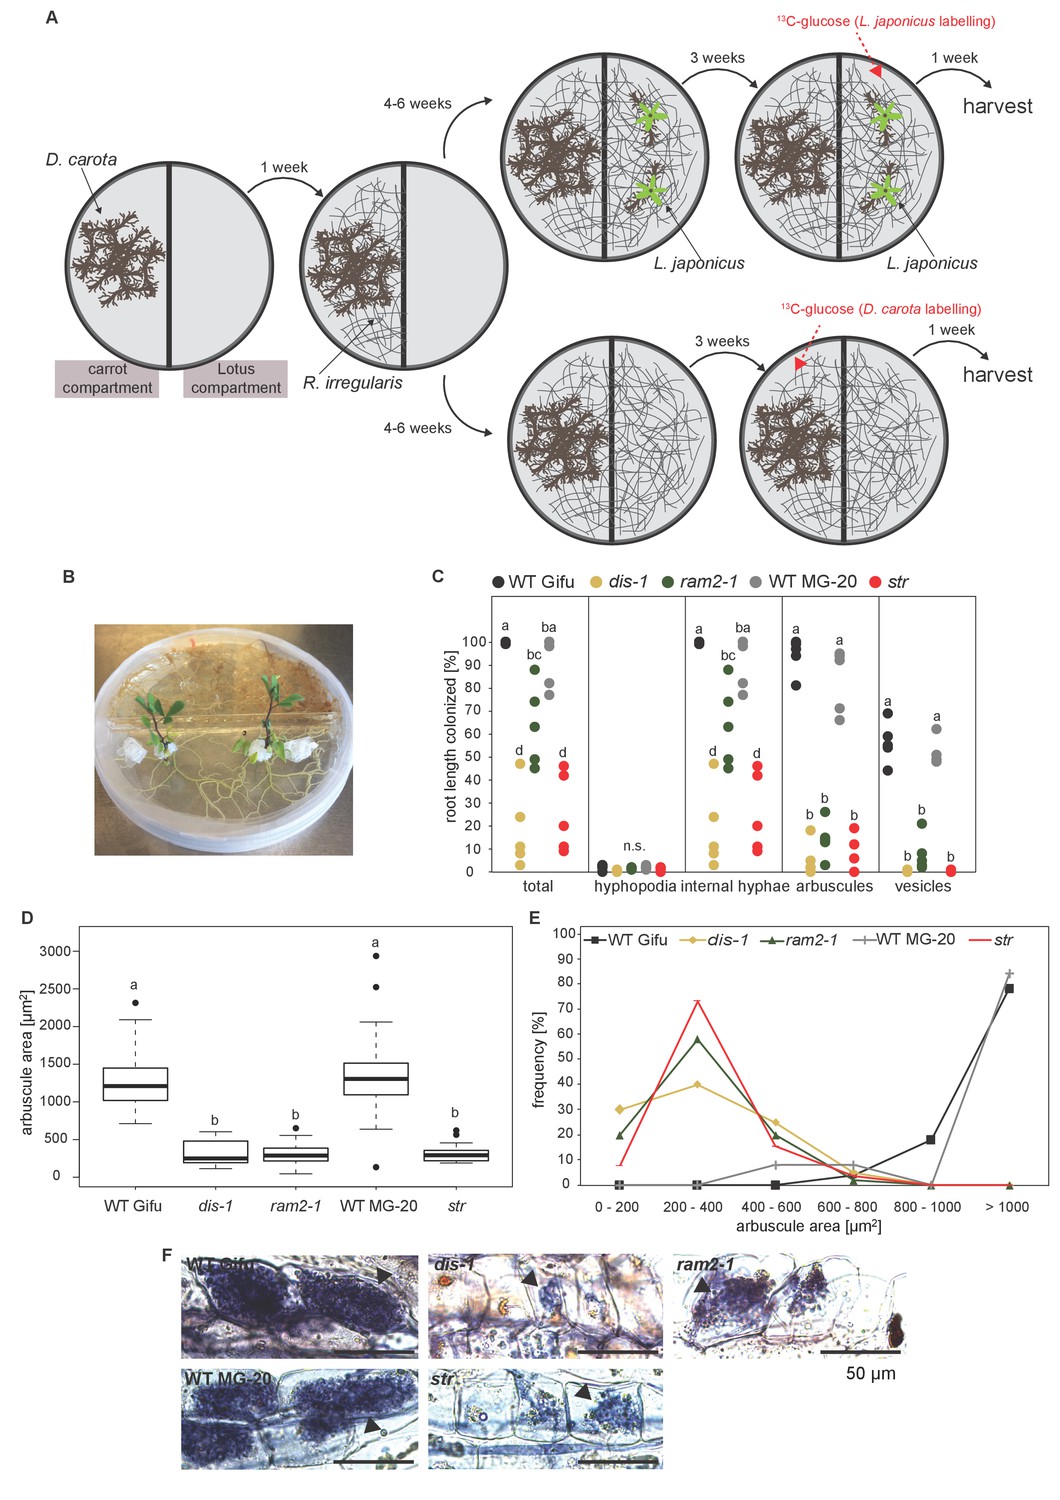
Two-compartment cultivation setup used for labelling experiments.
(A) Schematic representation of cultivation setup which was used for 13C-glucose labelling experiments (Figure 8, Figure 8—figure supplement 2–4). [U-13C6]Glucose as substrate was either applied to the carrot compartment or the Lotus compartment. Colonized roots and extraradical mycelia populating the plate were harvested separately. (B) Photo of the 2-compartment setup. 2 week old Lotus seedlings were cultivated for 4 weeks on this setup. 100 mg of [U-13C6]Glucose was applied one week before harvest. (C) Quantitative AM colonization as determined by the modified grid-line intersect method after acid-ink staining in roots of genotypes indicated in the figure from plants grown in the Petri dish system (A and B) in parallel with the plants used for isotopolog profiling. Different letters indicate significant differences (ANOVA; posthoc Tukey; n = 25) among genotypes for each fungal structure separately. p≤0.01, F4,20 = 32.49 (total and intraradical hyphae); F4,20 = 110.1 (arbuscules), F4,20 = 112.6 (vesicles). (D) Arbuscule area and (E) frequency distribution of arbuscule area in the root samples used in (C). 10 arbuscules were analysed per root system. For wild-type Gifu, MG20 and ram2-1 five, for str three and for dis-1 two root systems were available. Different letters in (D) indicate significant differences (ANOVA; posthoc Tukey; n = 196) in arbuscule area among genotypes. p≤0.001, F4,191 = 127.4. (E) Representative bright-field images of arbuscules in roots of the samples analyzed in C-D.
Figure 8—figure supplement 2
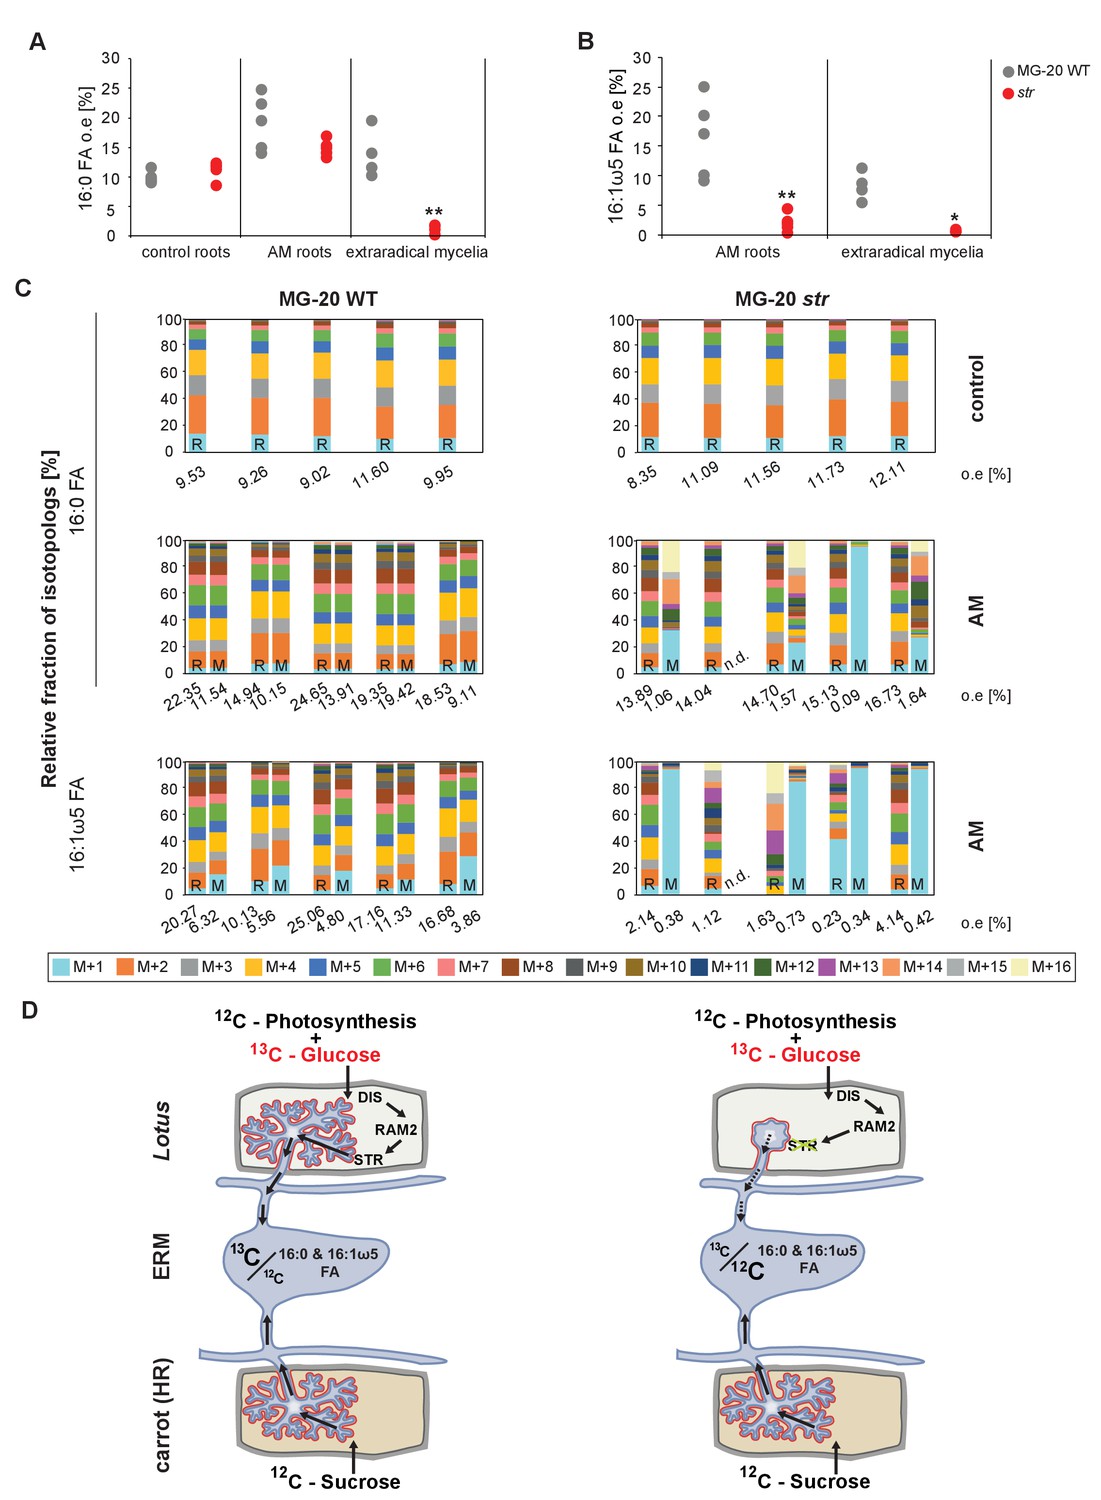
Isotopolog profiles of wild-type MG20 and str.
(A–B) Overall excess (o.e.) of 13C over air concentration in 16:0 FAs (A) and in AMF specific 16:1ω5 FAs (B) detected in non-colonized (only 16:0 FAs) and colonized, L. japonicus wild-type and str roots and in the extraradical mycelium of R. irregularis. Five biological replicates of each genotype and treatment are shown. Black asterisks indicate statistically significant differences between mutant lines and wild-type according to Student’s t-test *p<0.05; **p<0.01. (C) Relative fraction of 13C isotopologs for 16:0 fatty acids of five replicates (individual bars and double bars) of L. japonicus WT MG-20 and str in control roots (upper panel) and AM roots and each of the associated R. irregularis extraradical mycelia (middle panel). The same is shown for fungus-specific 16:1ω5 FAs in AM roots and extraradical mycelia (lower panel). Values from roots are indicated by ‘R’ and from fungal extraradical mycelia by ‘M’. For L. japonicus wild-type the 13C labelling pattern of 16:0 and 16:1ω5 FAs in the plant is recapitulated in the fungal extraradical mycelium. Extraradical hyphae associated with str do not mirror these patterns. Compare bars for AM roots and extraradical hyphae side by side. Black numbers indicate 13C overall excess for individual samples. Colors indicate 13C-isotopologues carrying one, two, three, etc. 13C-atoms (M + 1, M + 2, M + 3, etc.). (n. d. = not detected). (D) Schematic and simplified illustration of carbon flow and 12C vs.13C contribution to plant lipid metabolism and transport to the fungus in the two-compartment cultivation setup used for isotope labelling. Carbohydrate metabolism and transport is omitted for simplicity. ERM, extraradical mycelium.
Figure 8—figure supplement 3

Proportion of 16:0 and 16:1ω5 FA containing only non-labelled 12C in plant and fungal tissue.
Proportion of 12C 16:0 fatty acids (M + 0) in non-colonized and colonized carrot, L. japonicus Gifu wild-type, dis-1, ram2-1 roots and in the extraradical mycelium of R. irregularis (A) as well as in L. japonicus MG-20 wild-type, str roots and in the extraradical mycelium of R.irregularis (C). Proportion of non-labeled 12C AMF specific 16:1ω5 fatty acids (M + 0) in colonized carrot, L. japonicus Gifu wild-type, dis-1, ram2-1 roots and in the extraradical mycelium of R. irregularis (B) as well as in L. japonicus MG-20 wild-type, str and in the extraradical mycelium of R. irregularis (D).
Figure 8—figure supplement 4

Isotopolog profiles of additional samples.
Relative fraction of 13C isotopologs for 16:0 fatty acids (individual bars and double bars) of D. carota, L. japonicus WT Gifu, dis-1, ram2-1 in control roots (upper panel) and AM roots and each of the associated R. irregularis extraradical mycelia (middle panel) and 16:1ω5 FAs in AM roots and extraradical mycelia (lower panel). Values from roots are indicated by ‘R’ and from fungal extraradical mycelia by ‘M’. Compare bars for AM roots and extraradical hyphae side by side. Isotopolog profiles shown here and in Figure 8C were generated from 3 independent experiments for L. japonicus wild-type and, 2 independent experiments for L. japonicus mutants and carrot roots. Transfer of 13C-label from plant to fungus is higher for carrot than for L. japonicus wild-type. This is possibly caused by the fungus being exclusively dependent on carrot when carrot is labelled, while lipid transfer from L. japonicus competes with un-labeled transfer from carrot from the other side of the petri dish. Whatever the isotopolog pattern of wild-type roots, it is mirrored in the extrarical fungal mycelium, indicating lipid transfer. However, the isotopolog pattern is for most cases not mirrored in extraradical mycelium associated with lipid biosynthesis mutants. (n.d. = not detected).
Figure 9
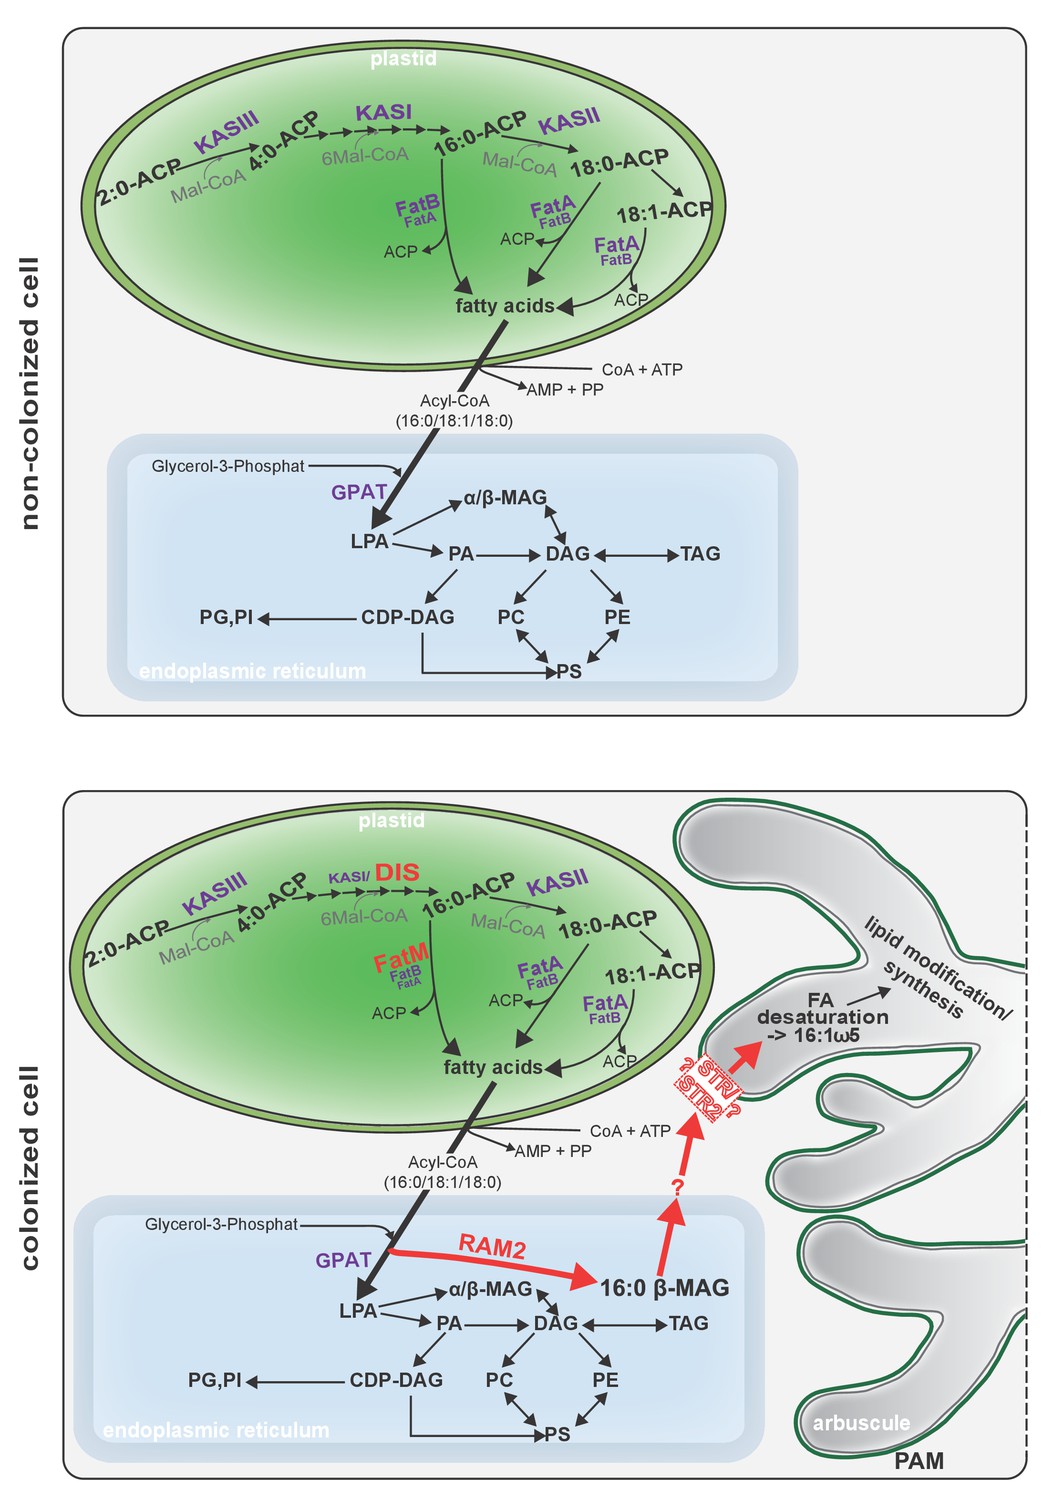
Schematic representation of plant fatty acid and lipid biosynthesis in a non-colonized root cell and a root cell colonized by an arbuscule.
In non-colonized cells FAs are synthesized in the plastid, bound via esterification to glycerol to produce LPA in the ER, where further lipid synthesis and modification take place. Upon arbuscule formation AM-specific FA and lipid biosynthesis genes encoding DIS, FatM and RAM2 are activated to synthesize specifically high amounts of 16:0 FAs and 16:0-ß-MAGs or further modified lipids (this work and Bravo et al., 2017). These are transported from the plant cell to the fungus. The PAM-localized ABCG transporter STR/STR2 is a hypothetical candidate for lipid transport across the PAM. Desaturation of 16:0 FAs by fungal enzymes (Wewer et al., 2014) leads to accumulation of lipids containing specific 16:1ω5 FAs. Mal-CoA, Malonyl-Coenzyme A; FA, fatty acid; KAS, β-keto-acyl ACP synthase; GPAT, Glycerol-3-phosphate acyl transferase; PAM, periarbuscular membrane; LPA, lysophosphatic acid; MAG, monoacylglycerol; DAG, diacylglycerol; TAG, triacylglycerol; PA, phosphatidic acid; PC, phosphatidylcholine; PE, phosphatidylethanolamine; PS, phosphatidylserine; CDP-DAG, cytidine diphosphate diacylglycerol; PG, phosphatidylglycerol; PI, phosphatidylinositol.
Author response image 1

Videos
Video 1
3D animation of Figure 2Ac illustrating that the silhouette of the fungal intraradical hyphae (red fluorescent vertical line) aligns with the silhouette of pre-penetration apparatuus (red fluorescent bag-like structure). Yellow fluorescence in nuclei indicates activation of pDIS:YFP.
https://doi.org/10.7554/eLife.29107.010
Video 2
3D animation of Figure 2Bc illustrating that the silhouette of the fungal intraradical hyphae (red fluorescent vertical line) aligns with the silhouette of pre-penetration apparatuus (red fluorescent bag-like structure). Yellow fluorescence in nuclei indicates activation of pRAM2:YFP.
https://doi.org/10.7554/eLife.29107.011
Video 3
Scan through confocal z-stack of Figure 2Aa illustrating correlation of DIS promoter activity with arbuscocytes.
https://doi.org/10.7554/eLife.29107.012
Video 4
Scan through confocal z-stack of Figure 2Ab illustrating DIS promoter activity exclusively in the cortex.
https://doi.org/10.7554/eLife.29107.013
Video 5
Scan through confocal z-stack of Figure 2Ba illustrating correlation of RAM2 promoter activity with arbuscocytes.
https://doi.org/10.7554/eLife.29107.014
Video 6
Scan through confocal z-stack of Figure 2Bb illustrating absence of RAM2 promoter activity from non-colonized cells.
https://doi.org/10.7554/eLife.29107.015Additional files
-
Source code 1
Source code for ANOVA statistical test in R
- https://doi.org/10.7554/eLife.29107.044
-
Supplementary file 1
Mutations in DIS and DIS-LIKE identified by TILLING or in a LORE1 insertion collection.
- https://doi.org/10.7554/eLife.29107.045
-
Supplementary file 2
Primers used in this study.
- https://doi.org/10.7554/eLife.29107.046
-
Supplementary file 3
Plasmids used in this study were produced by classical cloning, Gateway cloning (Entry plasmids and Destination plasmids) and Golden Gate cloning (Level I, II and III).
The Golden Gate toolbox is described in Binder et al. (2014). EV, empty vector; HR, hairy root; trafo, transformation.
- https://doi.org/10.7554/eLife.29107.047
-
Supplementary file 4
Accession numbers for protein sequences used in the phyologenic tree (Figure 3).
- https://doi.org/10.7554/eLife.29107.048
Download links
A two-part list of links to download the article, or parts of the article, in various formats.
Downloads (link to download the article as PDF)
Open citations (links to open the citations from this article in various online reference manager services)
Cite this article (links to download the citations from this article in formats compatible with various reference manager tools)
Lipid transfer from plants to arbuscular mycorrhiza fungi
eLife 6:e29107.
https://doi.org/10.7554/eLife.29107


