CpG and UpA dinucleotides in both coding and non-coding regions of echovirus 7 inhibit replication initiation post-entry
- Jelke Jan Fros

- Isabelle Dietrich
- Kinda Alshaikhahmed
- Tim Casper Passchier
- David John Evans
- Peter Simmonds
- University of Oxford, United Kingdom
- University of St Andrews, United Kingdom
Figures
Figure 1
E7 virus replication is restricted by increased UpA and CpG dinucleotide frequencies independent of replication efficiency.
(A) Genome organisation of E7 virus with the two regions (R1 and R2) that have been mutated for this study. Numbers indicate nucleotides that border R1 and R2. (B) Viral titres (TCID50/ml) of E7 viruses with R2 variants, UpA high (U, green) or CpG high (C, red) in a variety of cell types after twenty-four hours of infection with a multiplicity of infection of 0.01. Bars represent the average of three biological replicates normalised to E7 with wild type R2 sequence (WT, blue). (C) WT E7 titre from B in relation to the relative restriction caused by mutation of R2 with either increased UpA or CpG dinucleotides in each cell type. Cell types are indicated and relative replication rates of viruses with R2_U and R2_C connected by a dashed line. Error bars represent one standard error of the mean from three biological replicates.
Figure 2 with 3 supplements
E7 replicon RNA replication is reduced by unfavourable dinucleotides in either coding or non-coding regions.
(A) Schematic representation of E7 replicon with coding R2 and non-coding R1 (ncR1) indicated. (B) Replication efficiency of the E7 replicon RNA as measured by firefly luciferase expression. Non-coding region 1 (ncR1) or coding region 2 (R2) of wild type (WT), permutated (P), CpG and UpA low (cu), UpA high (U) and CpG high (C) composition were cloned into the E7luc_cu replicon system and luciferase expression was measured at indicated hours post transfection (hpt). Data points represent the average of three biological replicates normalised to one hpt. Error bars represent one standard error of the mean.
Figure 2—figure supplement 1
E7 replicon RNA replication is unaffected by additional non-coding nucleotides of WT composition.
Replication efficiency of the E7 replicon RNA as measured by firefly luciferase expression. Firefly luciferase was either of WT sequence (high in CpG dinucleotides, luc_WT, black) or with CpG and UpA dinucleotides removed (luc_cu, gray). In the latter replicon R1 regions of WT (ncR1_WT, dark blue) and permutated (ncR1_P, light blue) were inserted as 3’-non-coding region. Data points represent the average of three biological replicates normalised to one hpt. Error bars represent one standard error of the mean.
Figure 2—figure supplement 2
E7 replicon RNA replication with unfavourable dinucleotides in BHK cells.
Replication efficiency of the E7 replicon RNA as measured by firefly luciferase expression. Non-coding region 1 (ncR1) or coding region 2 (R2) of wild type (WT), permutated (P), CpG and UpA low (cu), UpA high (U) and CpG high (C) composition were cloned into the E7luc replicon system and luciferase expression was measured at indicated hours post transfection (hpt). Data points represent the average of three biological replicates normalised to one hpt. Error bars represent one standard error of the mean.
Figure 2—figure supplement 3
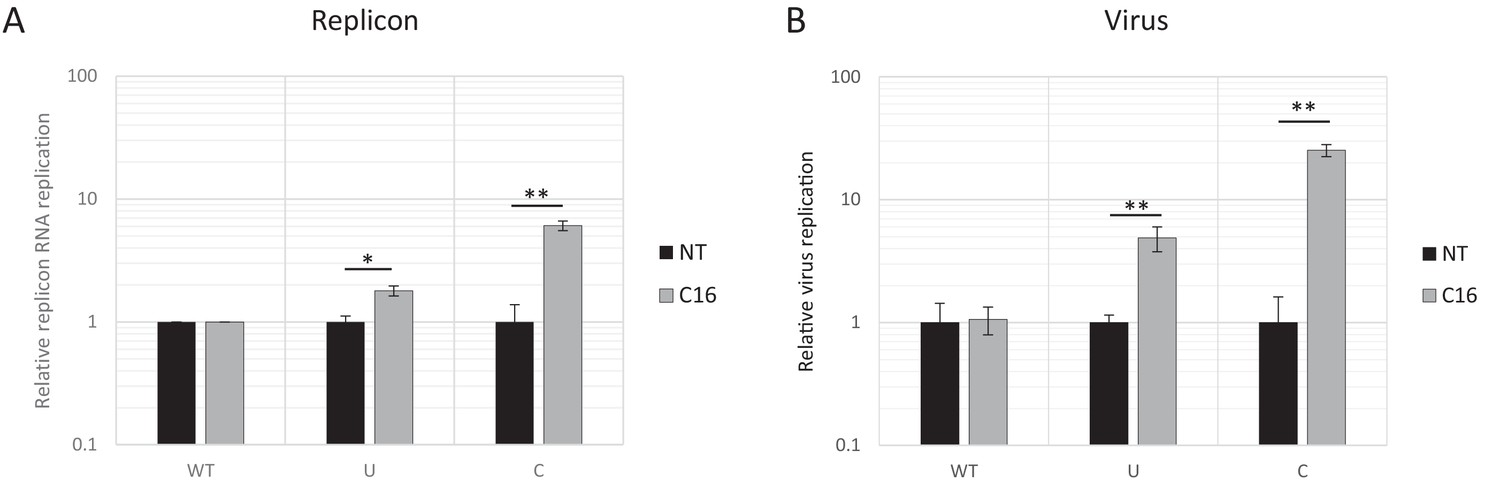
Reduced replication of E7 replicon RNA with increased CpG and UpA dinucleotides is not the result of reduced translation and can be restored by kinase inhibitor C16.
RD cells were pre-treated with C16 (2 μM), or left untreated (NT) for one hour prior to E7 replicon transfection (A) or E7 virus infections (B) in appropriate NT or C16 treated media. (A) E7 replicon RNA with ncR1 extensions of either wild type (WT), UpA high (U) or CpG high (C) composition were transfected into RD cells. Firefly luciferase was measured at six hpt. Bars represent the mean of three biological replicates normalized to E7 with ncR1_WT and relative the not treated sample. (B) E7 virus infections (MOI 5) with coding R2 of indicated composition. After 24 hr viral titres were measured in cell culture supernatant in an EPDA. Bars represent the mean of three biological replicates normalized to WT E7 and relative, to the respective NT sample. Error bars represent one standard error of the mean and asterisks indicate significant difference between treatments, p-value *<0.1, **<0.05, T-test.
Figure 3
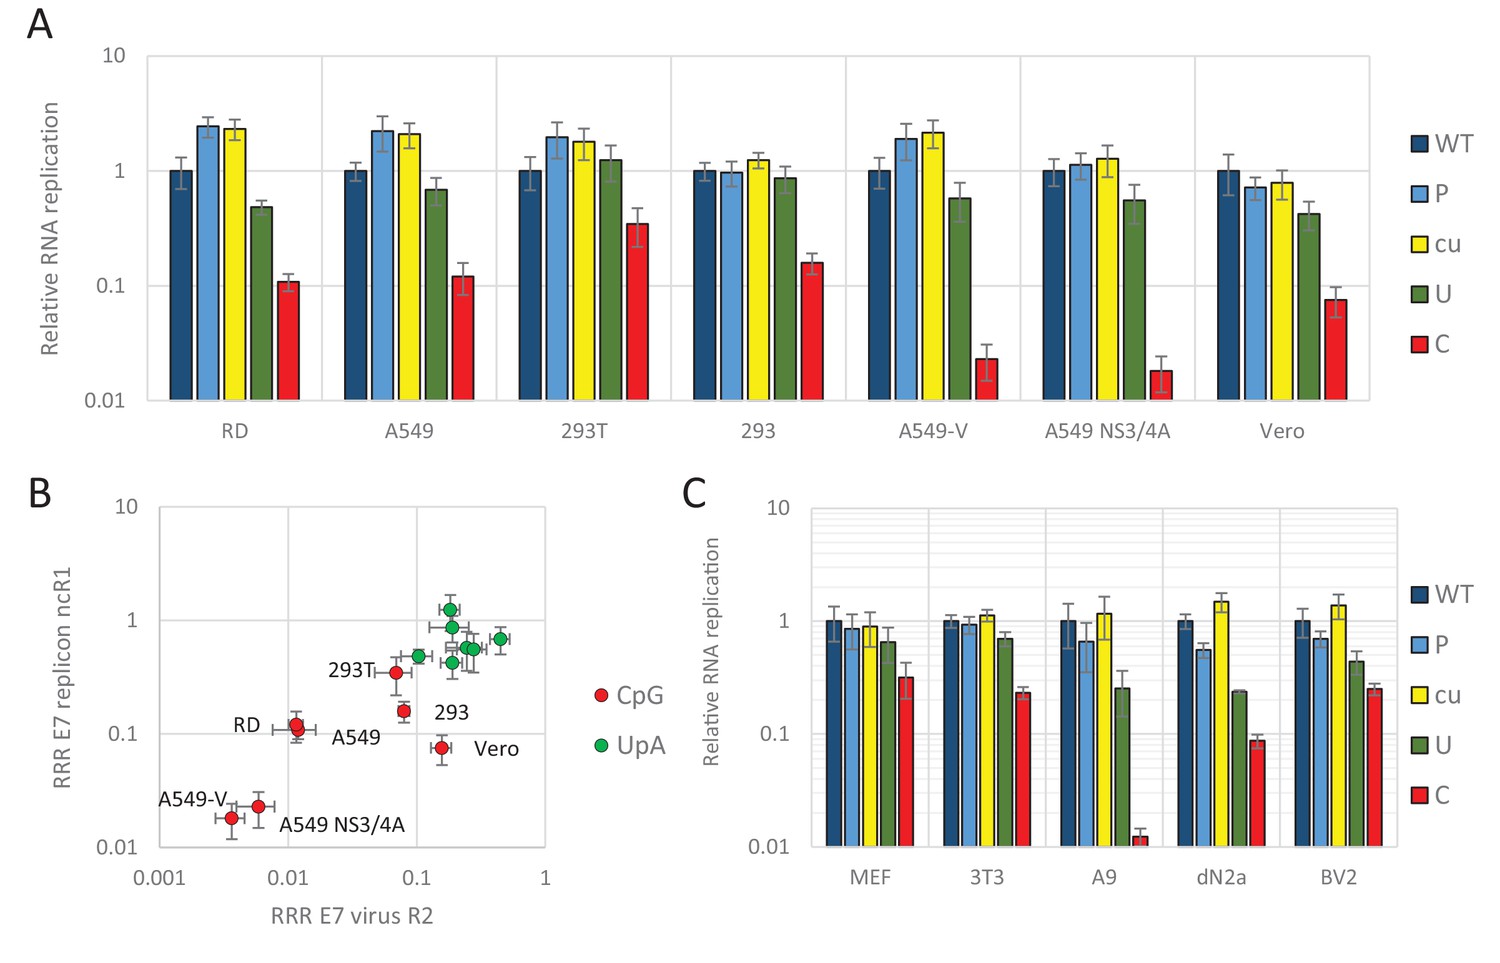
E7 replicon RNA replication is restricted by increased UpA and CpG dinucleotides in a non-coding region.
(A) Relative RNA replication (RRR) of the E7 replicon with wild type (WT), permutated (P), CpG and UpA low (cu), UpA high (U) and CpG high (C) composition in an extended 3’-ncR1 as measured by firefly luciferase expression at six hpt in primate cells. (B) Comparison between E7 virus and replicon replication rates. Each data appoint refers to the RRR of E7 replicon RNA replication with ncR1 of the indicated composition (Y-axis) against the RRR of E7 virus with coding R2 in the same cell line (Figure 1 and S1, X-axis). (C) RRR of the E7 replicon with various nucleotide compositions in the 3’-ncR1 as measured by firefly luciferase expression at six hpt in rodent cell types. Bars represent the average of three biological replicates relative to E7 replicon RNA replication with a ncR1 of WT composition. Error bars represent one standard error of the mean.
Figure 4 with 1 supplement
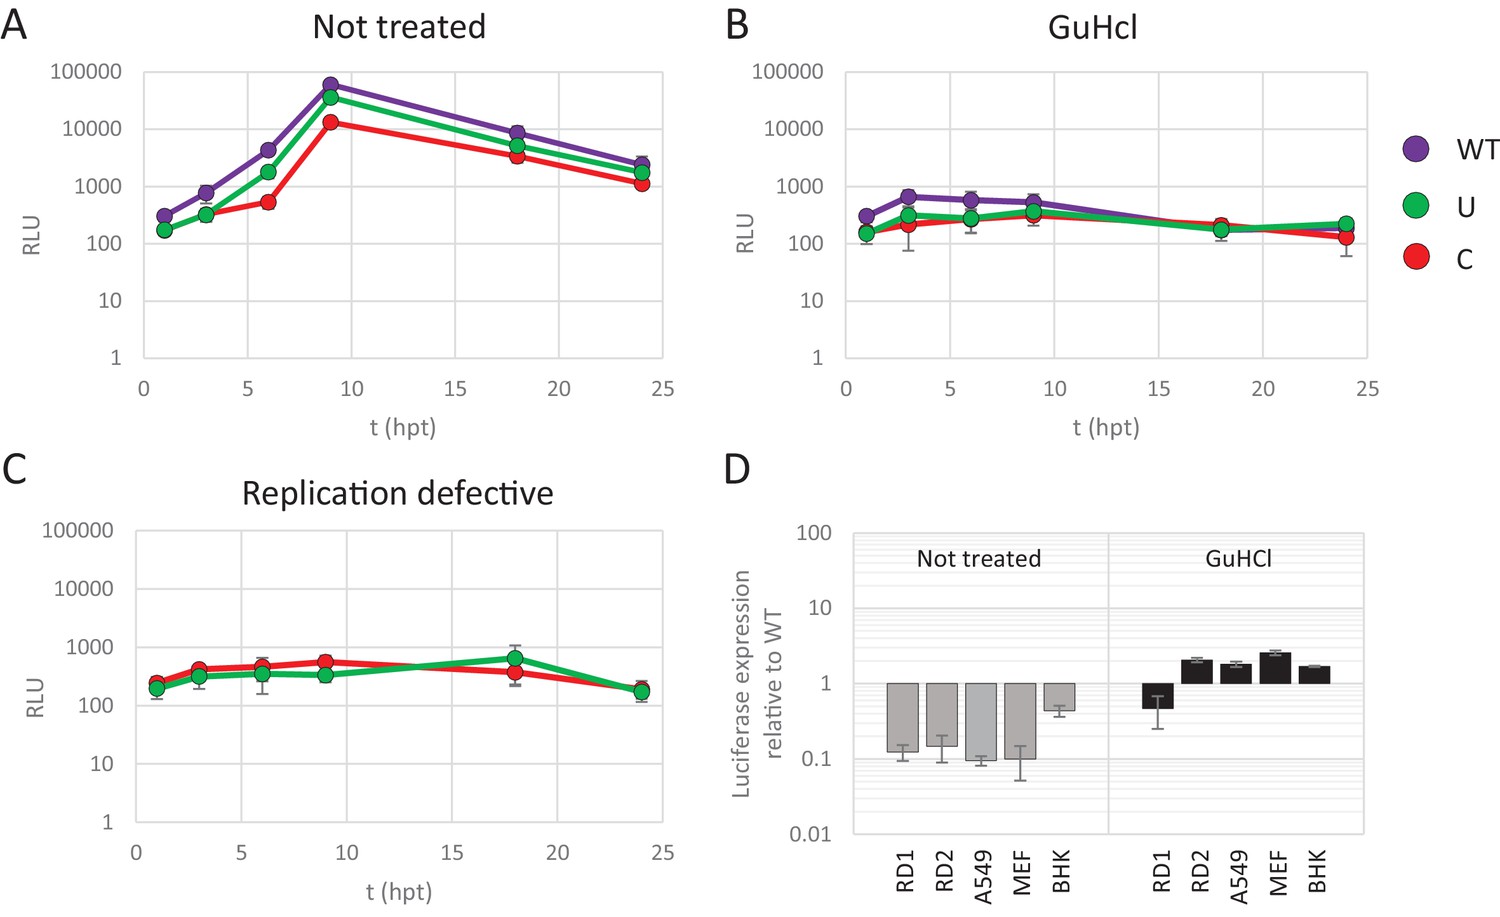
Reduced replication of E7 replicon RNA with increased CpG and UpA dinucleotides is not the result of reduced translation.
(A–C) E7 replicon RNA with ncR1 extensions of either wild type (WT), UpA high (U) or CpG high (C) composition were transfected into RD cells. Cells were either not treated (A) or treated with guanidine hydrochloride (GuHCl) (B) to inhibit E7 RNA replication. Similarly, RD cells were transfected with RNA of replication-defective E7 replicons with ncR1 of either WT or C composition (C). Firefly luciferase was measured at the indicated times post transfection (hpt). (D) Indicated cell types were transfected with E7 replicon RNA with either the WT or CpG-high ncR1 sequence. RD1 shows the six hour time point from panel A and B, while RD2 is a second independent experiment in RD cells. Cells were either treated with GuHCl or left untreated. At six hpt luciferase expression was measured. Bars show the fold change in luciferase expression of the E7 replicon with the CpG-high ncR1 relative from that of their respective not treated or GuHCl treated WT. (A–D) Data points represent the mean of three biological replicates. Error bars represent one standard error of the mean.
Figure 4—figure supplement 1
Reduced replication of E7 replicon RNA with increased CpG and UpA dinucleotides is not the result of reduced translation.
(A) Indicated cell types were transfected with E7 replicon RNA with either the WT or UpA-high ncR1 sequence. RD1 shows the six hour time point from panel A and B, while RD2 is a second independent experiment in RD cells. Cells were either treated with GuHCl or left untreated. At six hpt luciferase expression was measured. Bars show the fold change in luciferase expression of the E7 replicon with the UpA-high ncR1 relative from that of their respective not treated or GuHCl treated WT. (B) Raw luciferase values from Figure 4D and Figure 4—figure supplement 1A. Bars represent the mean of three biological replicates. Error bars represent one standard error of the mean.
Figure 5
E7 replicon RNA replication is restricted by repeats of synthetic non-coding regions with increased UpA and CpG dinucleotides.
(A) Schematic representation of E7 replicon with coding non-coding synthetic (ncS) repeats indicated. (B) RD cells were transfected with luciferase expressing E7 replicon RNA containing either a single (gray bars) or double (black bars) ncS repeat of either normalised (Norm) CpG and UpA low (cu) UpA high (U) or CpG high (C) composition. Luciferase expression was measured at 6 hpt. Bars are normalised to their respective E7 replicon with randomised nucleotide composition, but WT dinucleotide frequencies (Norm). Error bars represent one standard error of the mean and the dashed line displays the level of luciferase expression from non-replicative guanidine treated samples. Asterisks indicate significant difference from the respective single or double Norm ncS, p-value *<0.01, T-test.
Figure 6 with 1 supplement
Replication of E7 virus with increased CpG dinucleotides is restricted immediately upon entry delaying replication rates.
RD cells were infected with 1000 E7 RNA copies/cell with coding region 2 (R2) either of wild type (WT), permutated (P), CpG and UpA low (cu), UpA high (U) or CpG high (C) composition. Infectivity of progeny virus was determined in EPDA (A) RNA copies were determined by quantitative RT-PCR on total RNA and are presented relative to WT E7 at one hpi (B) Data points represent the mean of three independent experiments and error bars one standard error of the mean.
Figure 6—figure supplement 1
Replication of E7 virus with increased CpG dinucleotides is restricted immediately upon entry delaying replication rates.
RD cells were infected with E7 at equal infectivity (MOI 0.01). In these viruses, coding region 2 (R2) was either of wild type (WT), permutated (P), CpG and UpA low (cu), UpA high (U) or CpG high (C) composition. Infectivity of progeny virus was determined in EPDA (A). RNA copies were determined by quantitative RT-PCR on total RNA and are presented relative to WT E7 at one hpi (B). Data points represent the mean of three independent experiments and error bars one standard error of the mean.
Figure 7
Reduced infectivity of E7 with increased UpA and CpG dinucleotides.
(A) RD cells were infected with E7 variants with R2 of either wild type (WT), UpA high (U) or CpG high (C) composition at 1000 RNA copies/cell. Cells were fixed at indicated times post infection and stained with Stellaris probes against an unchanged region of the E7 genomic RNA (red) and the nucleus was stained with Hoechst 33342. To clearly capture E7 genomes at 2 hpi and the 4 hpi E7_R2_C sample, images of the red channel were taken with an exposure time of 1 s. Arrows are placed to indicate the location of the E7 genomes and enlarged images are displayed. For the other samples exposure time was reduced to 0.25 s. Images were Z-stacked and deconvolved with SoftWorx Deltavision software. (B, C) RD cells with indicated R2 composition that contained genomic E7 RNA were photographed at six hpi. Per experiment, each sample was photographed three times with identical exposure times (representative images panel B). (C) Bars represent the mean of three independent experiments and error bars one standard error of the mean. For each condition the total cell count n > 500.
Figure 8 with 2 supplements
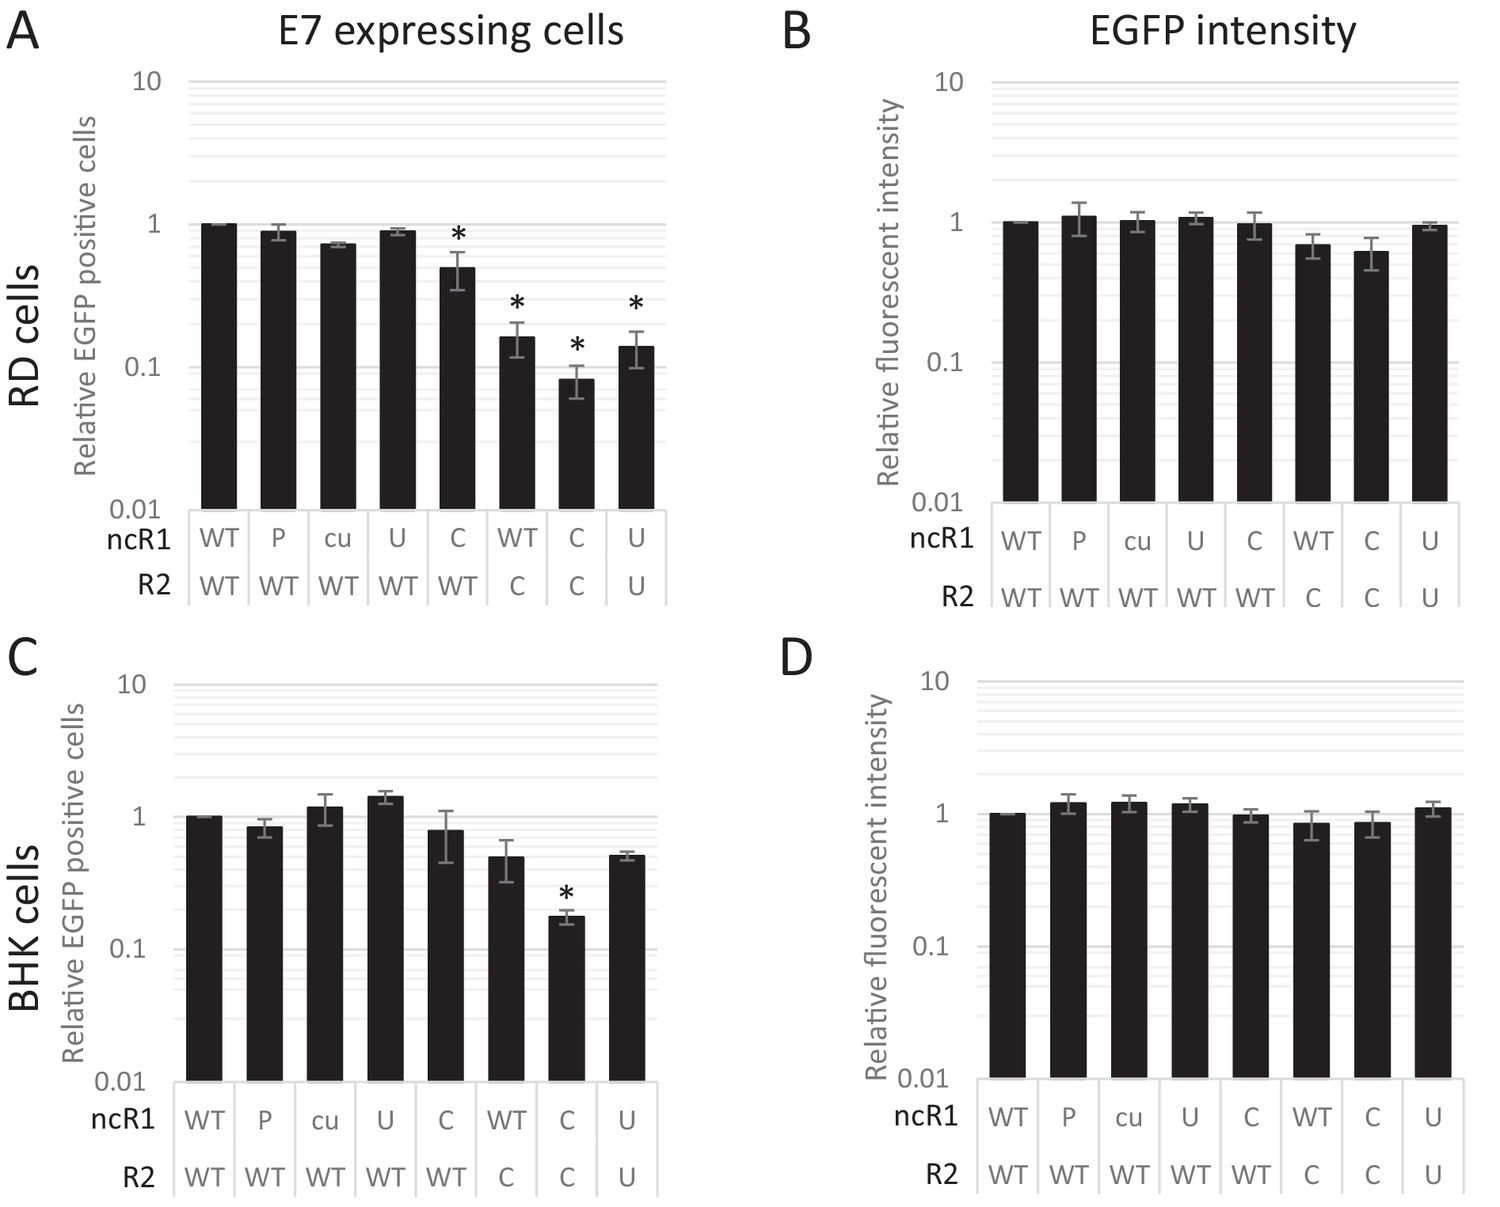
CpG and UpA dinucleotides inhibit initiation of E7 replicon RNA replication.
EGFP expressing E7 replicon RNA with coding (R2) and non-coding region (ncR1) of either wild type (WT), permutated (P), CpG and UpA low (cu), UpA high (U) or CpG high (C) dinucleotide compositions as indicated was transfected in RD (A, B) or BHK (C, D) cells. FACS analysis quantified the number of EGFP positive cells (A, C) and their mean fluorescent intensities (B, D). Bars are depicted relative to the respective WT values and represent the mean of three biological replicates. Error bars represent one standard error of the mean and asterisks significant difference from native sequence with ncR1_WT (p<0.05, One-way ANOVA with Dunett’s multiple comparison post hoc test).
Figure 8—figure supplement 1
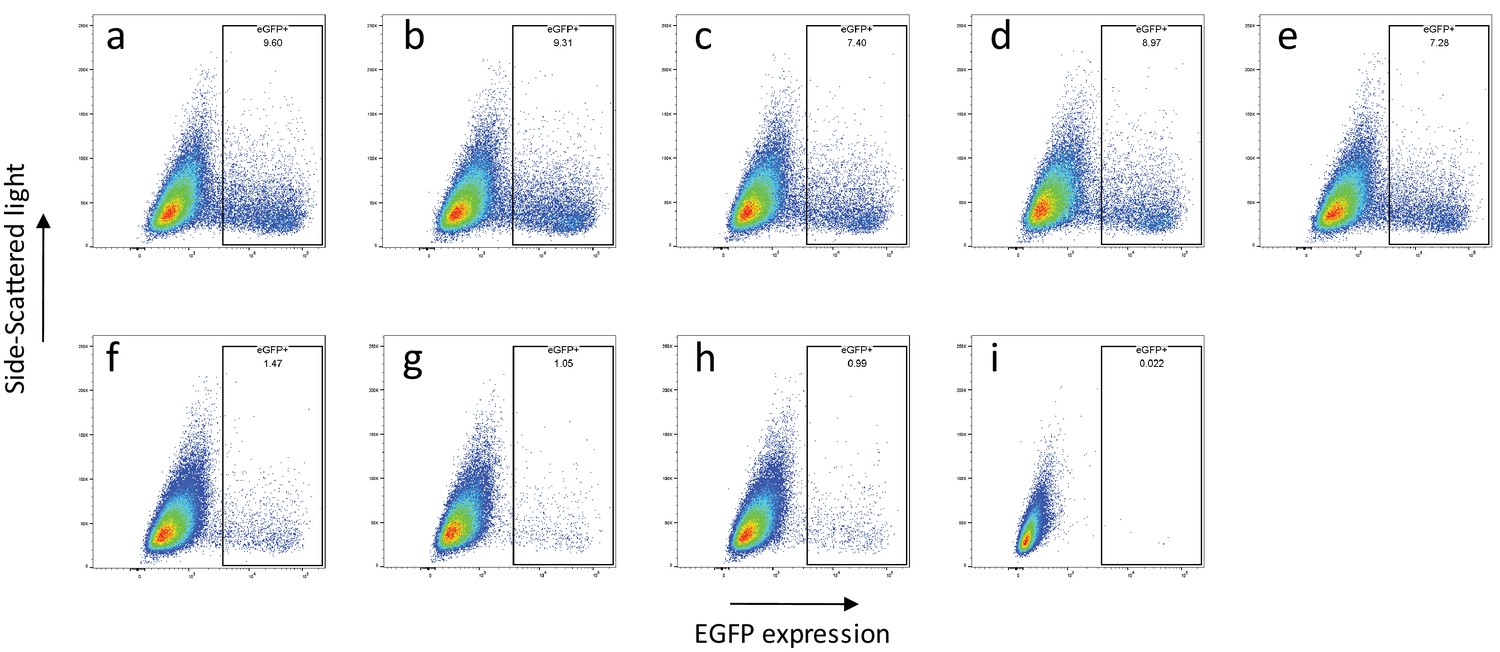
CpG and UpA dinucleotides inhibit initiation of E7 replicon RNA replication.
FACS analysis quantified the number of EFP expressing RD cells after transfection of EGFP expressing E7 replicon RNA containing (a) R2_WT and ncR1 _WT, (b) R2_WT and ncR1_P, (c) R2_WT and ncR1_cu, (d) R2_WT and ncR1_U, (e) R2_WT and ncR1_C, (f) R2_C and ncR1_WT, (g) R2_C and ncR1_C, (h) R2_U and ncR1_U and (i) mock transfected sequences. Plots are representatives of three biological replicates.
Figure 8—figure supplement 2
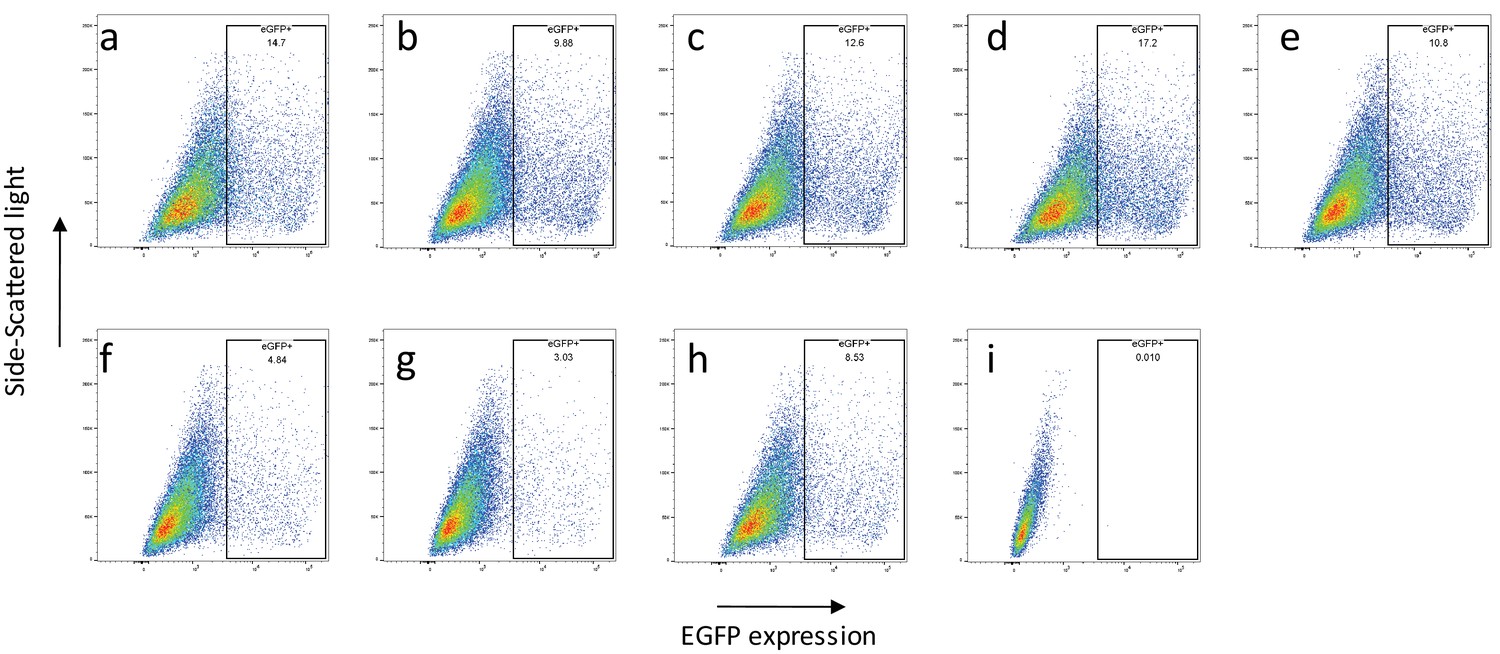
CpG and UpA dinucleotides inhibit initiation of E7 replicon RNA replication.
FACS analysis quantified the number of EFP expressing BHK cells after transfection of EGFP expressing E7 replicon RNA containing (a) R2_WT and ncR1 _WT, (b) R2_WT and ncR1_P, (c) R2_WT and ncR1_cu, (d) R2_WT and ncR1_U, (e) R2_WT and ncR1_C, (f) R2_C and ncR1_WT, (g) R2_C and ncR1_C, (h) R2_U and ncR1_U and (i) mock transfected sequences. Plots are representatives of three biological replicates.
Figure 9 with 1 supplement
E7 variants do not differentially co-localise with stress granule protein G3BP.
RD cells were infected with E7 variants with R2 of wild type (WT), UpA high (U) or CpG high (C) composition at 1000 RNA copies/cell. Fixed at six hpi and stained with Stellaris probes against an unchanged region of the E7 genomic RNA (red/magenta) and G3BP (green), the nucleus was stained with Hoechst 33342 (Blue).
Figure 9—figure supplement 1
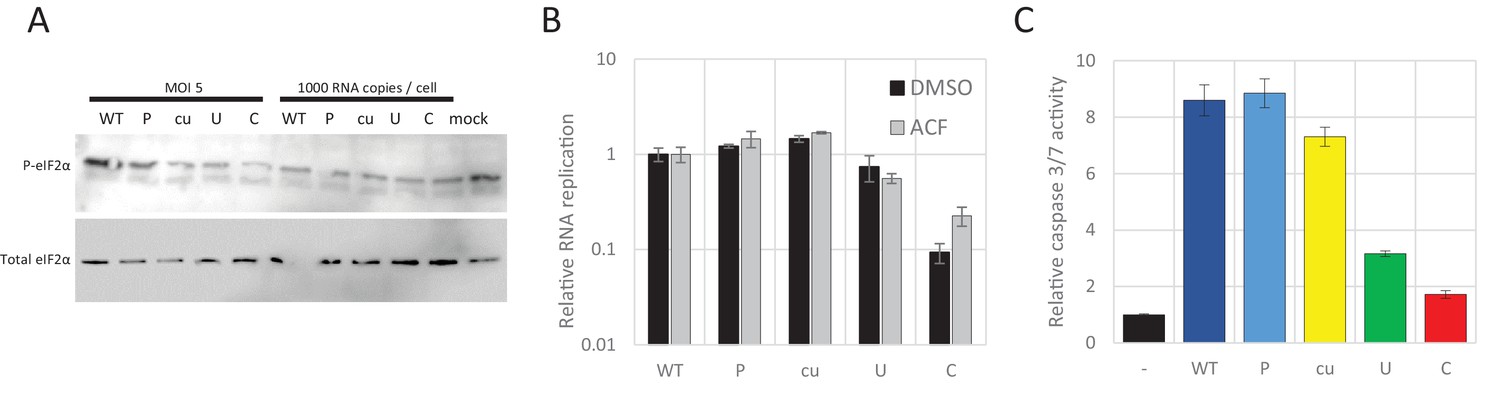
Translation attenuation, RNA interference and apoptosis.
(A) RD cells, infected for six hours with equal MOI or equal RNA copies of E7 viruses with indicated R2 variants were immunostained for total eukaryotic initiation factor 2α (eIF2α) or the phosphorylated protein (P- eIF2α). (B) RD cells were pre-treated for two hours with an inhibitor of RNA interference; acriflavine (ACF) or DMSO as a control. Cells were transfected with E7luc replicon RNA containing ncR1 variants in the presence of ACF or DMSO respectively. Bars represent the average luciferase measurements at six hpt relative to WT of three independent experiments and error bars one standard error of the mean. (C) RD cells, infected with E7 viruses with the indicated nucleotide composition of R2 at a MOI of 0.01 were assayed for caspase 3/7 activity at 24 hpi. Bars represent the mean of three independent experiments, normalised for not infected cells. Error bars represent one standard error of the mean.
Figure 10 with 1 supplement
Viral RNA of wild type composition cannot be restricted by supplying RNA high in UpA or CpG dinucleotide frequencies in trans.
(A) 293 cells were transfected with plasmids expressing R2 regions of either wild type (WT), permutated (P), CpG and UpA low (cu), UpA high (U) or CpG high (C) dinucleotide compositions from a CMV promoter or mock transfected (Con), 24 hr prior to infection with wild type E7. Cells were infected with a MOI of 0.01 and at 48 hpi the supernatant was titrated on RD cells. (B) The 800 nt long ncS regions of indicated composition were in vitro transcribed from a T7 promoter outside the context of the E7 replicon. Equal molar amounts of E7luc with ncR1 of WT composition and the individual ncS RNAs were co-transfected into RD cells and luciferase expression of E7luc was measured at six hpt. (C) E7luc with a 3’ WT ncR1 was co-transfected with E7 replicons containing EGFP of the indicated nucleotide composition instead of firefly luciferase. Bars depict the means of at least three independent experiments and have been normalised to their respective P (A), Norm (B) and WT (C) controls. Error bars display one standard error of the mean.
Figure 10—figure supplement 1
Protein expression from E7 replicons with ncR1 compositional variants.
RD cells transfected with E7_EGFP replicons with 3’ ncR1 variants together with E7luc replicon containing a 3’ ncR1 tail of WT composition. EGFP replication was imaged at 6 hpt with identical exposure times.
Figure 11
CpG dinucleotide mediated restriction of E7 replicon RNA replication is dependent on the context of CpG dinucleotides.
(A) Full length enterovirus sequences analysed for their O/E CpG ratio and G + C content. Isolates of enterovirus B, which includes E7 are indicated. (B) RD cells were transfected with luciferase expressing E7 replicon RNA containing either the previously described ncR1 sequence of wild type (WT) composition (51 CpGs) or increased CpG (180 CpGs) dinucleotide frequency (C), or sequences containing 51 CpGs in the following context: AACGAA or TTCGTT (U in RNA). Luciferase expression was measured at six hpt. Bars represent the average of three biological replicates and are normalised to the respective non-replicative RNA and relative to E7 replicon with ncR1 WT. Error bars represent one standard error of the mean and the numbers represent the number of CpG dinucleotides in the respective ncR1.
Tables
Table 1
UpA and CpG dinucleotide composition of mutated regions used in this study.
https://doi.org/10.7554/eLife.29112.004| Region | Sequence composition | Abbreviation | G + C content | Total CpG (Change)* | Total UpA (Change)* | Ratio† CpG | Ratio† UpA |
|---|---|---|---|---|---|---|---|
| Full length | Native | E7 | 0.48 | 252 | 390 | 0.59 | 0.77 |
| R1 | Native | WT | 0.48 | 51 (-) | 62 (-) | 0.73 | 0.74 |
| R1 | Permutated | P | 0.48 | 51 (0) | 62 (0) | 0.73 | 0.74 |
| R1 | CpG and UpA - low | cu | 0.47 | 0 (-51) | 29 (-43) | 0.00 | 0.23 |
| R1 | UpA - high | U | 0.41 | 39 (-12) | 171 (+109) | 0.76 | 1.59 |
| R1 | CpG - high | C | 0.57 | 180 (+129) | 52 (-10) | 1.83 | 0.90 |
| R1 | Adenine CpG motif | AACGAA | 0.48 | 51 (0) | 62 (0) | 0.73 | 0.74 |
| R1 | Uracil CpG motif | UUCGUU | 0.48 | 51 (0) | 62 (0) | 0.73 | 0.74 |
| R2 | Native | WT | 0.47 | 18 (-) | 48 (-) | 0.32 | 0.69 |
| R2 | Permutated | P | 0.47 | 18 (0) | 48 (0) | 0.32 | 0.69 |
| R2 | CpG and UpA - low | cu | 0.48 | 0 (-18) | 14 (-34) | 0.00 | 0.21 |
| R2 | UpA - high | U | 0.39 | 15 (-3) | 151 (+103) | 0.39 | 1.63 |
| R2 | CpG - high | C | 0.56 | 135 (+117) | 38 (-10) | 1.67 | 0.80 |
| ncS | Normalised | Norm | 0.47 | 28 (-) | 42 (-) | 0.63 | 0.72 |
| ncS | CpG - UpA low | cu | 0.47 | 5 (-23) | 2 (-40) | 0.11 | 0.03 |
| ncS | UpA - high | U | 0.47 | 28 (0) | 118 (+76) | 0.63 | 2.02 |
| ncS | CpG - high | C | 0.47 | 90 (+62) | 42 (0) | 2.03 | 0.72 |
-
* Change from respective Native or Normalised sequence (in bold) with WT dinucleotide frequencies
† Ratio is observed over expected frequency of the respective dinucleotide corrected for G + C content
Table 2
CpG and UpA dinucleotides inhibit initiation of E7 replicon RNA replication
https://doi.org/10.7554/eLife.29112.019| RD cells | |||||||
|---|---|---|---|---|---|---|---|
| Mutated regions | EGFP positive (%) | Relative EGFP positive cells | Relative mean fluorescence intensity | ||||
| Coding R2 | ncR1 | Average | SE | Average | SE | Average | SE |
| WT | WT | 14.47 | 2.67 | 1.00 | 0.00 | 1.00 | 0.00 |
| WT | P | 12.84 | 3.23 | 0.89 | 0.11 | 1.09 | 0.29 |
| WT | cu | 10.33 | 1.70 | 0.72 | 0.03 | 1.02 | 0.17 |
| WT | U | 12.69 | 1.87 | 0.89 | 0.05 | 1.07 | 0.10 |
| WT | C | 6.62 | 1.47 | 0.49 | 0.15 | 0.97 | 0.21 |
| C | WT | 2.25 | 0.68 | 0.16 | 0.04 | 0.69 | 0.14 |
| C | C | 1.08 | 0.20 | 0.08 | 0.02 | 0.61 | 0.16 |
| U | U | 2.00 | 0.66 | 0.14 | 0.04 | 0.94 | 0.06 |
| BHK cells | |||||||
|---|---|---|---|---|---|---|---|
| Mutated regions | EGFP positive (%) | Relative EGFP positive cells | Relative mean fluorescence intensity | ||||
| Coding R2 | ncR1 | Average | SE | Average | SE | Average | SE |
| WT | WT | 10.22 | 2.25 | 1.00 | 0.00 | 1.00 | 0.00 |
| WT | P | 8.09 | 1.10 | 0.83 | 0.13 | 1.21 | 0.20 |
| WT | cu | 11.16 | 2.02 | 1.17 | 0.31 | 1.21 | 0.17 |
| WT | U | 13.87 | 1.75 | 1.41 | 0.16 | 1.18 | 0.14 |
| WT | C | 7.75 | 2.90 | 0.78 | 0.33 | 0.97 | 0.11 |
| C | WT | 4.74 | 1.31 | 0.49 | 0.17 | 0.84 | 0.21 |
| C | C | 1.87 | 0.60 | 0.18 | 0.02 | 0.85 | 0.19 |
| U | U | 5.35 | 1.59 | 0.51 | 0.04 | 1.10 | 0.14 |
Table 3
Sequence integrity.
https://doi.org/10.7554/eLife.29112.020| Transversions | Transitions | ||||||||||
|---|---|---|---|---|---|---|---|---|---|---|---|
| Sequence | Sequenced nucleotides | Mutations | Mutations/nt | A > T | A > C | T > A | A > G | T > C | C > T | G > A | AA change |
| R1_WT | 49719 | 8 | 1.61E-04 | 1 | 1 | 2 | 2 | 2 | 4 | ||
| R1_C | 49684 | 9 | 1.81E-04 | 1 | 1 | 5 | 2 | 3 | |||
| R1_CDLR | 18414 | 2 | 1.09E-04 | 1 | 1 | 2 | |||||
| R1_U | 14649 | 1 | 6.83E-05 | 1 | 0 | ||||||
| R2_WT | 35517 | 0 | 0.00E + 00 | - | |||||||
| R2_C | 27814 | 3 | 1.08E-04 | 3 | 0 | ||||||
Additional files
-
Supplementary File 1
(A) Oligonucleotides used in this study.
(B) Probes for RNA fluorescent in situ hybridization.
- https://doi.org/10.7554/eLife.29112.026
-
Transparent reporting form
- https://doi.org/10.7554/eLife.29112.027
Download links
A two-part list of links to download the article, or parts of the article, in various formats.
Downloads (link to download the article as PDF)
Open citations (links to open the citations from this article in various online reference manager services)
Cite this article (links to download the citations from this article in formats compatible with various reference manager tools)
CpG and UpA dinucleotides in both coding and non-coding regions of echovirus 7 inhibit replication initiation post-entry
eLife 6:e29112.
https://doi.org/10.7554/eLife.29112


