A chemical screen in zebrafish embryonic cells establishes that Akt activation is required for neural crest development
- Children’s Hospital Boston, Howard Hughes Medical Institute, United States
- Harvard Medical School, United States
- Washington University School of Medicine, United States
- Massachusetts General Hospital, United States
- University Medical Center Utrecht, Netherlands
- Harvard Stem Cell Institute, United States
Figures
Figure 1 with 1 supplement
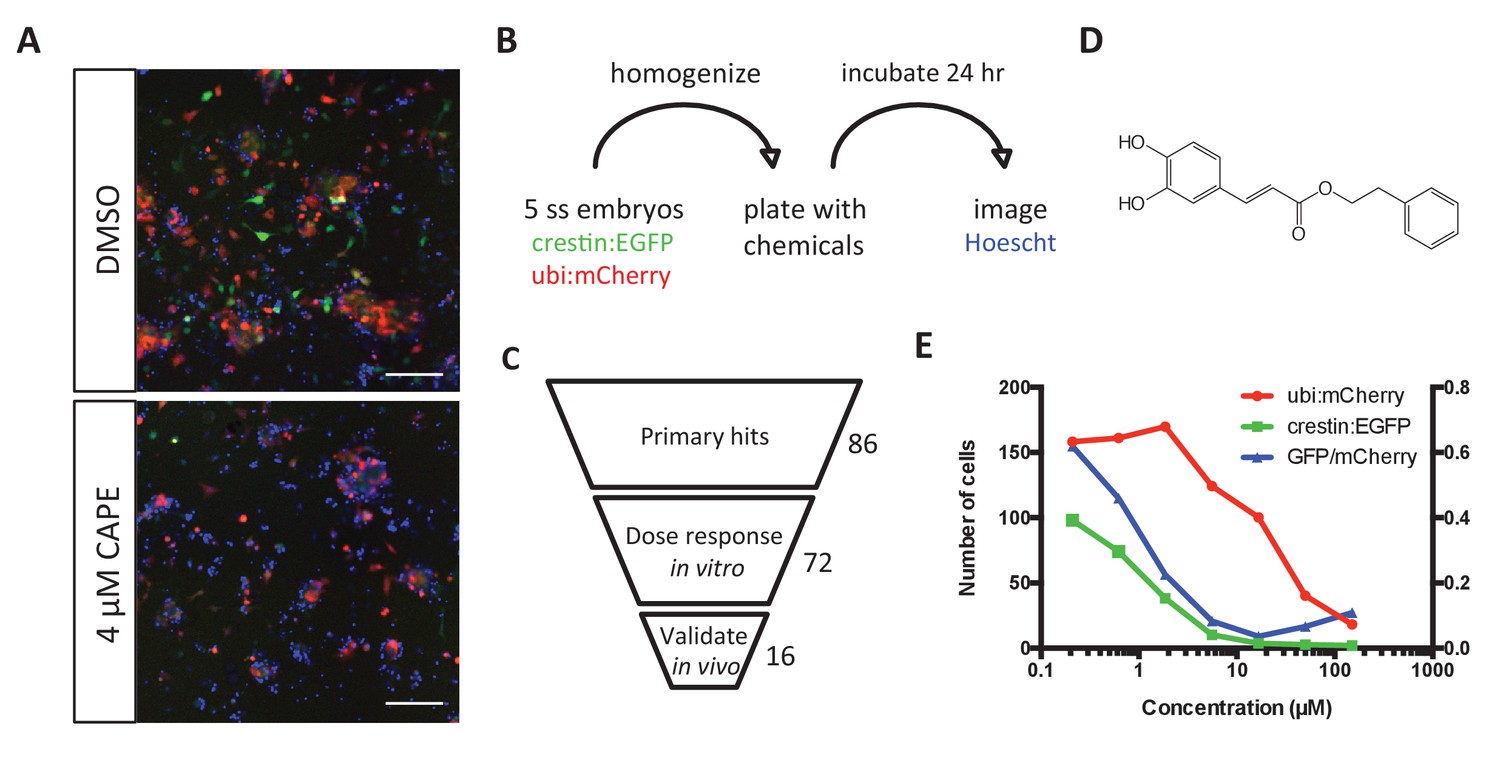
Chemical screening in zebrafish embryonic cell cultures identifies inhibitors of neural crest development.
(A) CAPE decreases crestin:EGFP+ cells in culture while leaving ubi:mCherry+ cells unchanged. Scale bar: 100 μm. Characterization of cultured crestin:EGFP+ cells is shown in Figure 1—figure supplement 1. (B) Chemical screen design. Whole embryos were mechanically homogenized and plated on standard tissue culture coating in neural crest medium with chemicals. After 24 hr of culture, Hoechst 33342 was added to stain nuclei before imaging. (C) Screen hits were validated in the primary screen assay and tested for an effect on crestin:EGFP expression in vivo. (D) Structure of CAPE. (E) CAPE shows a greater than 10-fold selectivity for crestin:EGFP+ cells versus ubi:mCherry+ cells in vitro.
-
Figure 1—source data 1
Ubi:mCherry and crestin:EGFP+ cell numbers in CAPE-treated cultures.
- https://doi.org/10.7554/eLife.29145.004
Figure 1—figure supplement 1
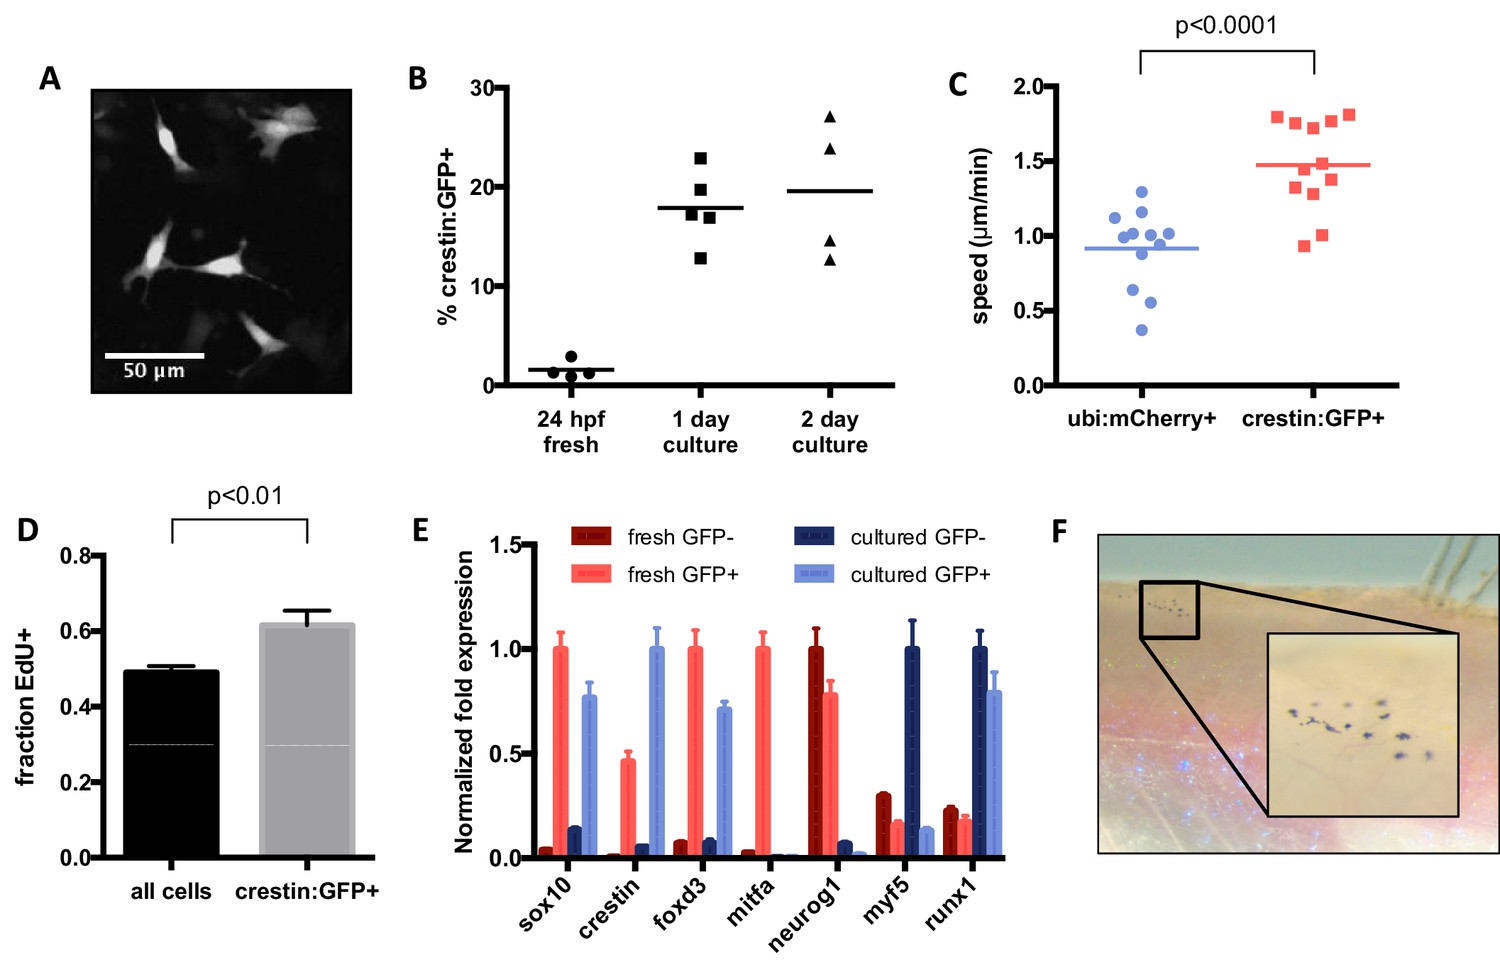
Characterization of cultured crestin:EGFP+ cells.
(A) Cell size and morphology visualized by crestin:EGFP. (B) Percentage of crestin:EGFP+ cells determined by FACS. Bars indicate mean and points indicate independent experiments. (C) Crestin:EGFP+ cells are more migratory than a random population of cells. Points indicate individual cells in a single experiment. (D) Crestin:EGFP+ cells are slightly more proliferative than the culture average, as determined by EdU staining after 4 hr of EdU treatment. Mean and standard deviation of three frames from the same experiment are shown. Similar results were obtained in two independent experiments. (E) Crestin:EGFP+ cells cultured for 24 hr express neural crest genes comparable to freshly isolated (24 hpf) crestin:EGFP+ cells and do not express markers of more differentiated tissues. Gene expression was determined by qPCR and normalized to β-actin. The highest expressing sample for each group was assigned a value of 1. Average and standard deviation of three technical replicates are shown. Myf5 and runx1 are negative controls. Results are representative of three independent experiments. (F) Crestin:EGFP+ cells form pigmented melanocytes in vivo. Cells were sorted for crestin:EGFP after two days of culture and injected under the scale of a casper fish lacking endogenous melanocytes. Pigmented cells were observed at 4 days post transplant in 4/8 EGFP+ transplants and 0/10 EGFP- transplants. Student’s t-test was used for statistical analyses.
-
Figure 1—figure supplement 1—source data 1
Percentage crestin:EGFP+ cells in culture.
- https://doi.org/10.7554/eLife.29145.005
-
Figure 1—figure supplement 1—source data 2
Cell migration speed.
- https://doi.org/10.7554/eLife.29145.006
-
Figure 1—figure supplement 1—source data 3
Fraction EdU+ cells.
- https://doi.org/10.7554/eLife.29145.007
-
Figure 1—figure supplement 1—source data 4
qPCR analysis of neural crest gene expression in cultured crestin:EGFP+ cells.
- https://doi.org/10.7554/eLife.29145.008
Figure 2 with 4 supplements
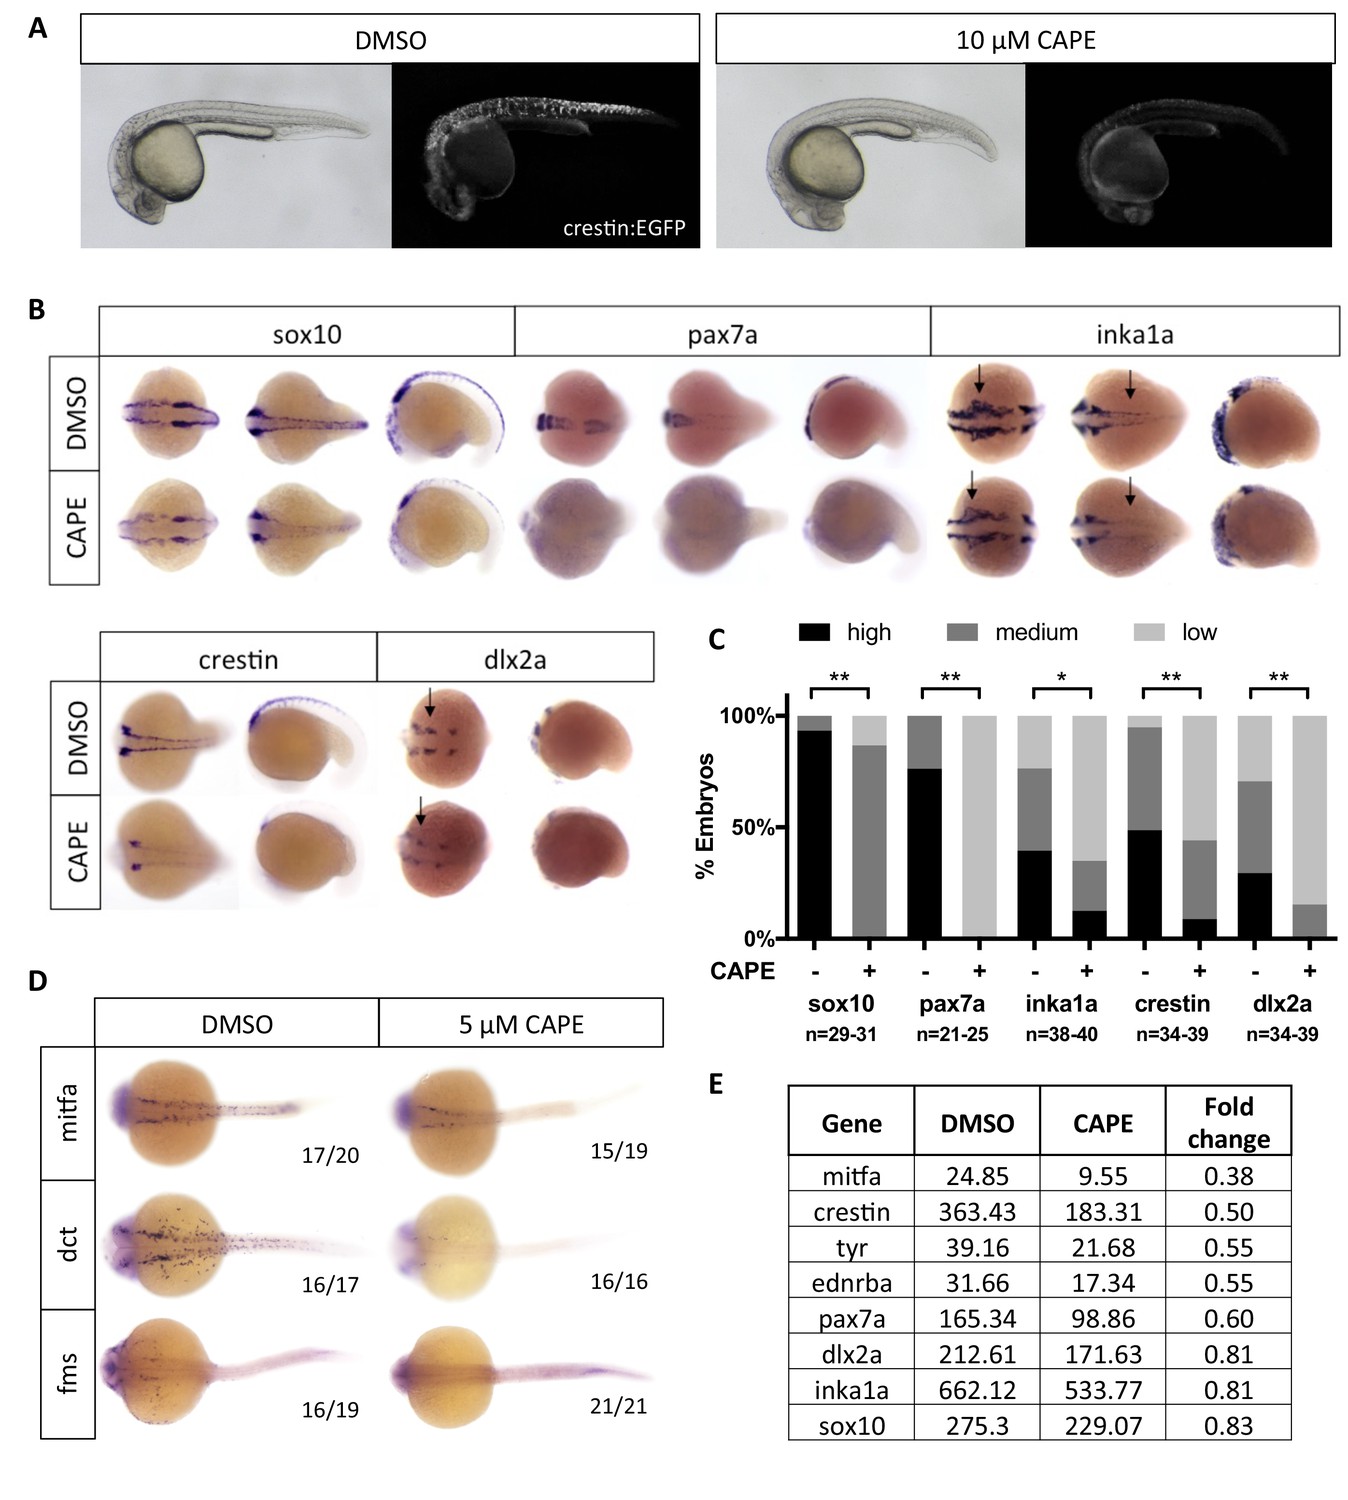
CAPE decreases neural crest gene expression.
(A) CAPE dramatically reduces crestin:EGFP expression at 26 hpf. Figure 2—figure supplement 1 shows the response of a smaller (396 bp) crestin promoter fragment to CAPE and the timing of crestin response to CAPE. (B) CAPE decreases neural crest gene expression as determined by whole mount in situ hybridization (ISH) at 15–17 ss. Expression of some genes is decreased ubiquitously while others are only altered in specific anatomic locations (arrows). Images are representative of at least two independent experiments. (C) Scoring of ISH in (B). (D) CAPE reduces expression of pigment cell genes at 24 hpf. (E) FPKM values from RNA-sequencing of sox10:Kaede+ cells confirmed decreases in neural crest genes, though to a lesser extent than by ISH. Cells were sorted from control or CAPE-treated embryos at 17 ss. Figure 2—figure supplement 2 shows neural crest genes with no significant change by ISH. Figure 2—figure supplement 3 shows that a change in cell number does not account for neural crest gene expression changes. Figure 2—figure supplement 4 shows other gene expression changes in neural crest cells. *p<0.001, **p<0.0001, chi-square test.
-
Figure 2—source data 1
Expression of neural crest genes by ISH in CAPE-treated embryos.
- https://doi.org/10.7554/eLife.29145.016
Figure 2—figure supplement 1
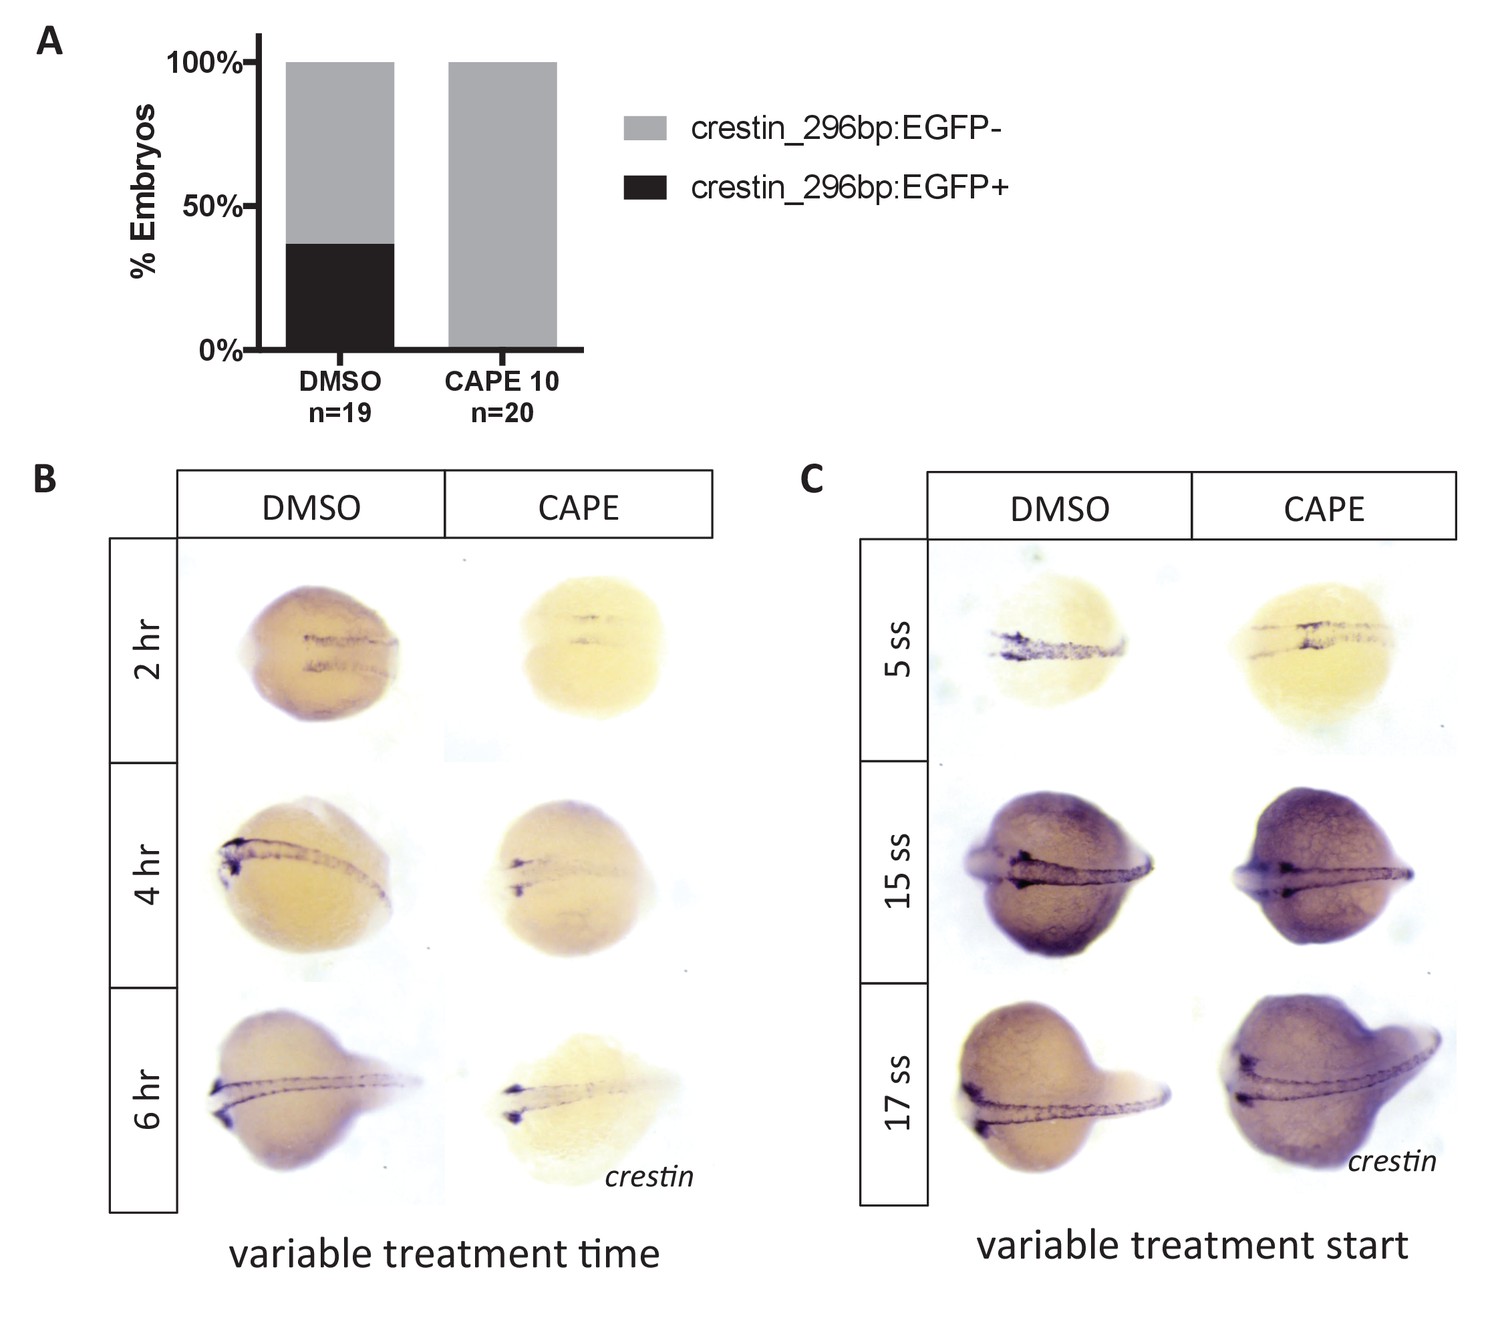
Crestin_296bp:EGFP expression in CAPE-treated embryos and time course of CAPE treatment.
(A) CAPE decreases expression of crestin_296bp:EGFP. Embryos were treated at 2 ss and imaged at 24 hpf. A single clutch is shown. (B) CAPE reduces crestin expression within two hours of treatment. Embryos were treated at 2 ss for the indicated amount of time and fixed for ISH. (C) CAPE has no effect on crestin expression after 15 ss. Embryos were treated for 2 hr at the indicated developmental stage.
-
Figure 2—figure supplement 1—source data 1
Scoring of crestin_296bp:EGFP expression in CAPE-treated embryos.
- https://doi.org/10.7554/eLife.29145.017
Figure 2—figure supplement 2

Neural crest genes not significantly affected by CAPE treatment as determined by ISH.
(A) Representative embryos from ISH. Images are representative of at least two independent experiments. Arrows point to regions with subtle decreases in expression. (B) Scoring of ISH in (A). Images with arrows were scored only in the region of interest. No statistically significant changes were observed in the genes listed (p>0.05, chi-square test). (C) Expression as determined by RNA-seq of sox10:Kaede+ cells. Some genes that appeared unchanged by ISH were decreased by RNA-seq.
-
Figure 2—figure supplement 2—source data 1
Scoring of neural crest gene expression by ISH in CAPE-treated embryos.
- https://doi.org/10.7554/eLife.29145.018
Figure 2—figure supplement 3
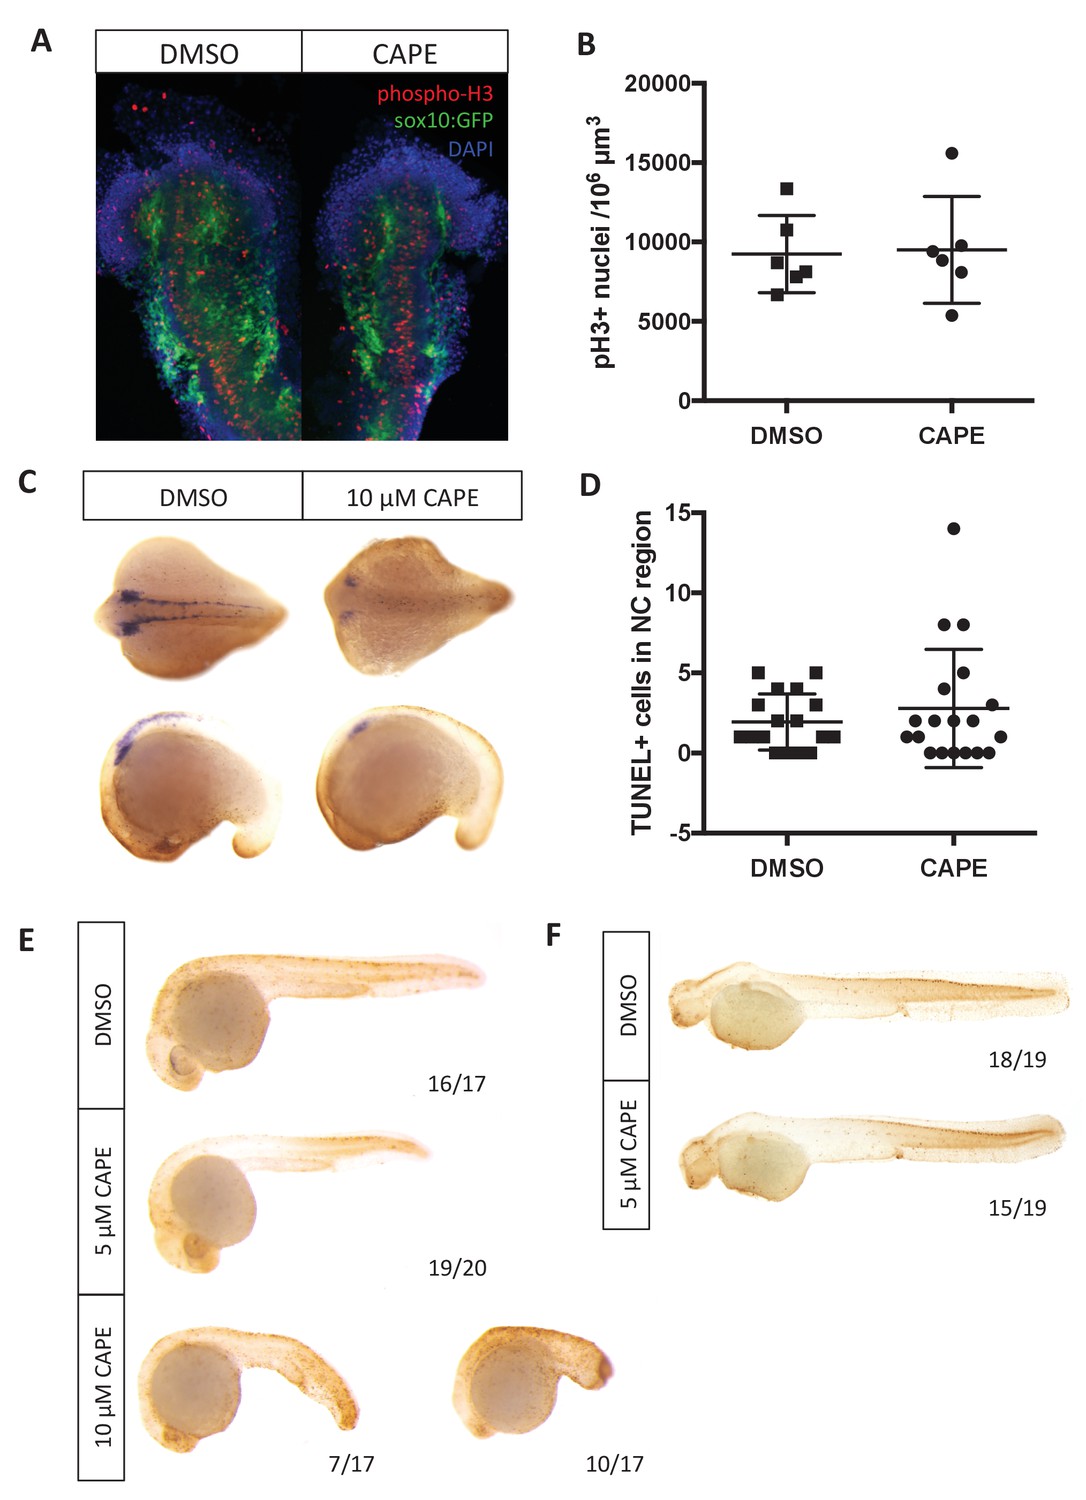
Changes in cell number do not explain reduced crestin expression in CAPE-treated embryos.
Embryos were treated continuously starting at 2 ss. (A) CAPE does not affect proliferation of neural crest cells as determined by phospho-histone H3 in the sox10:GFP+ region of embryos. Flat mounts of representative embryos are shown. Results are representative of two independent experiments. (B) Quantification of images in (A). Images were quantified using Imaris. Bars indicate the average and SEM of 6 embryos per condition from the same clutch. (C) CAPE does not increase cell death in the neural crest region of embryos after 5–6 hr of treatment. Representative embryos show whole mount TUNEL (brown) and crestin ISH (purple). (D) Quantification of embryos in (C). Quantification was conducted manually. Average and standard deviation of two independent experiments are shown. (E) 10 μM but not 5 μM CAPE broadly increases cell death after 19 hr of treatment. (F) 5 μM CAPE does not substantially alter cell death at 48 hpf.
-
Figure 2—figure supplement 3—source data 1
PH3+ cells in sox10:GFP+ region of CAPE-treated embryos.
- https://doi.org/10.7554/eLife.29145.019
-
Figure 2—figure supplement 3—source data 2
TUNEL+ cells in neural crest region of CAPE-treated embryos.
- https://doi.org/10.7554/eLife.29145.020
Figure 2—figure supplement 4
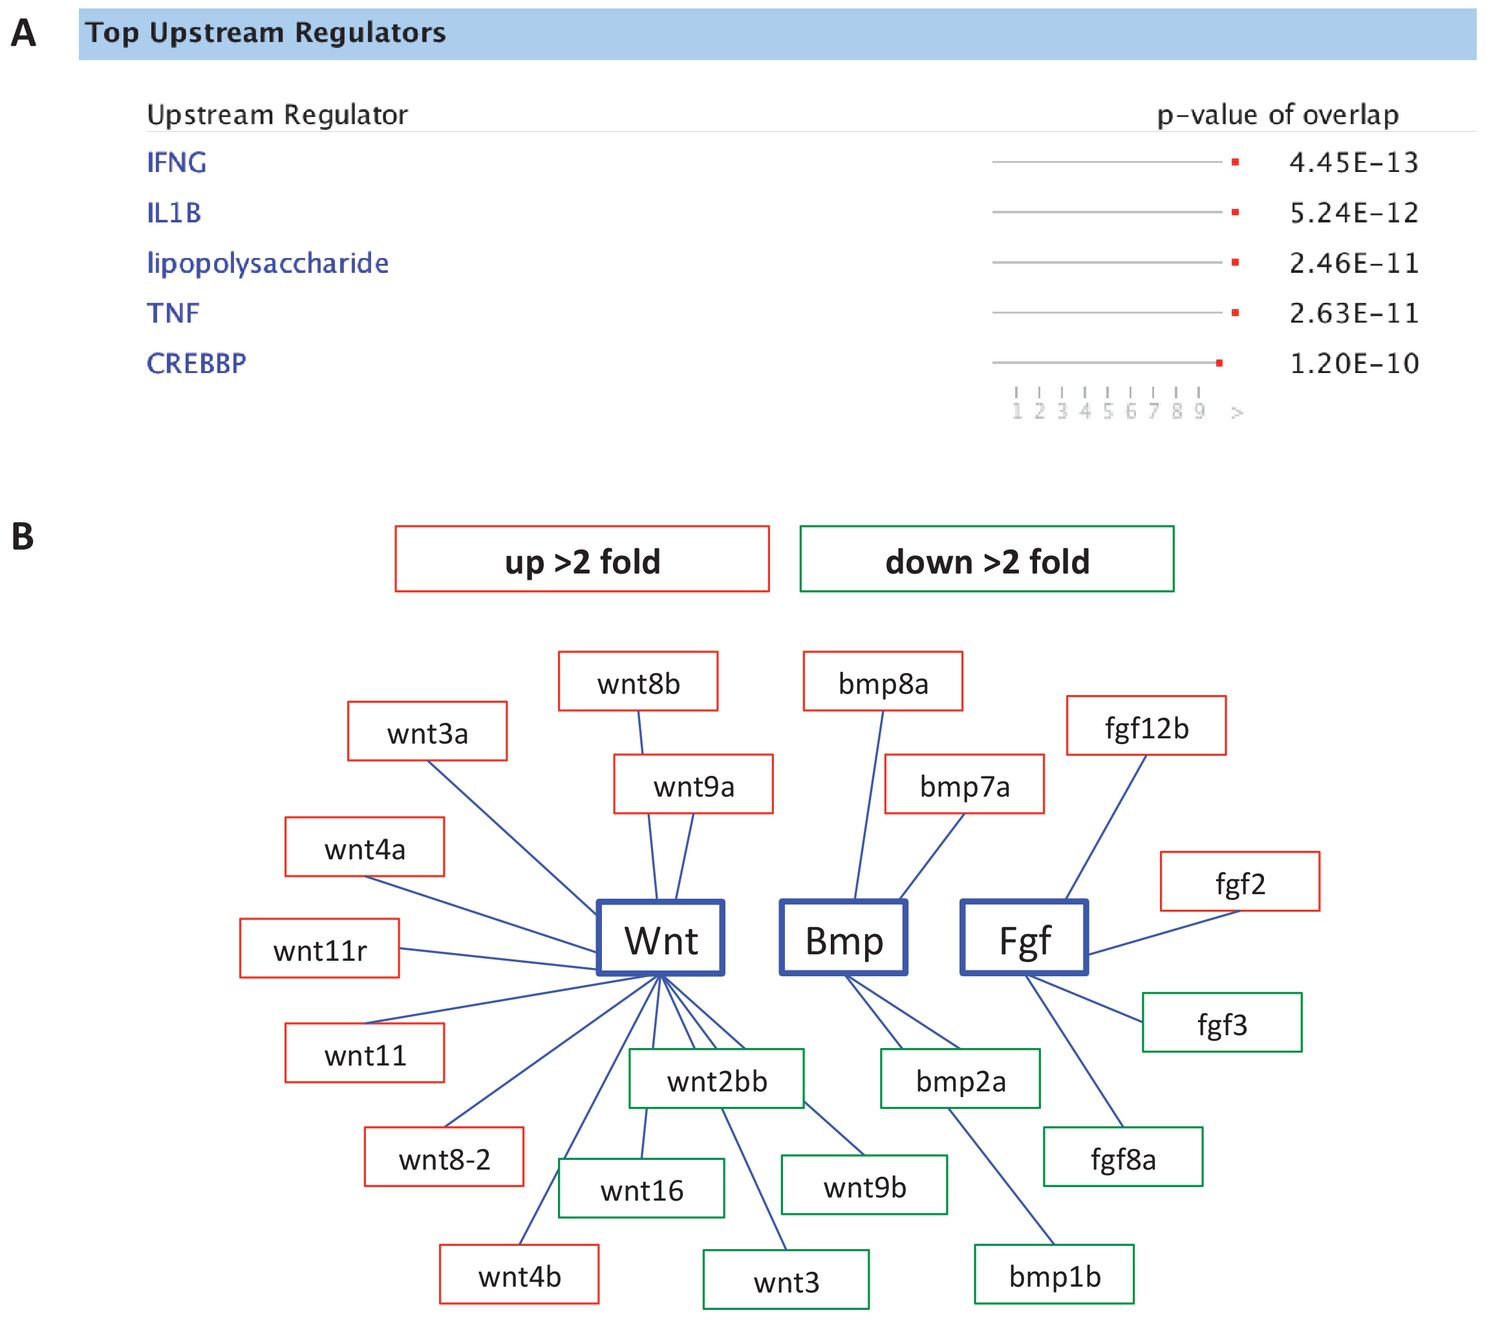
Analysis of gene expression changes in sox10:Kaede+ cells by RNA-seq, comparing DMSO- to CAPE-treated embryos.
(A) IPA analysis pointed to increased inflammatory signaling with CAPE treatment. (B) CAPE alters morphogen expression. Red indicates upregulation while green indicates downregulation. Fold change was determined using FPKM values.
Figure 3 with 1 supplement
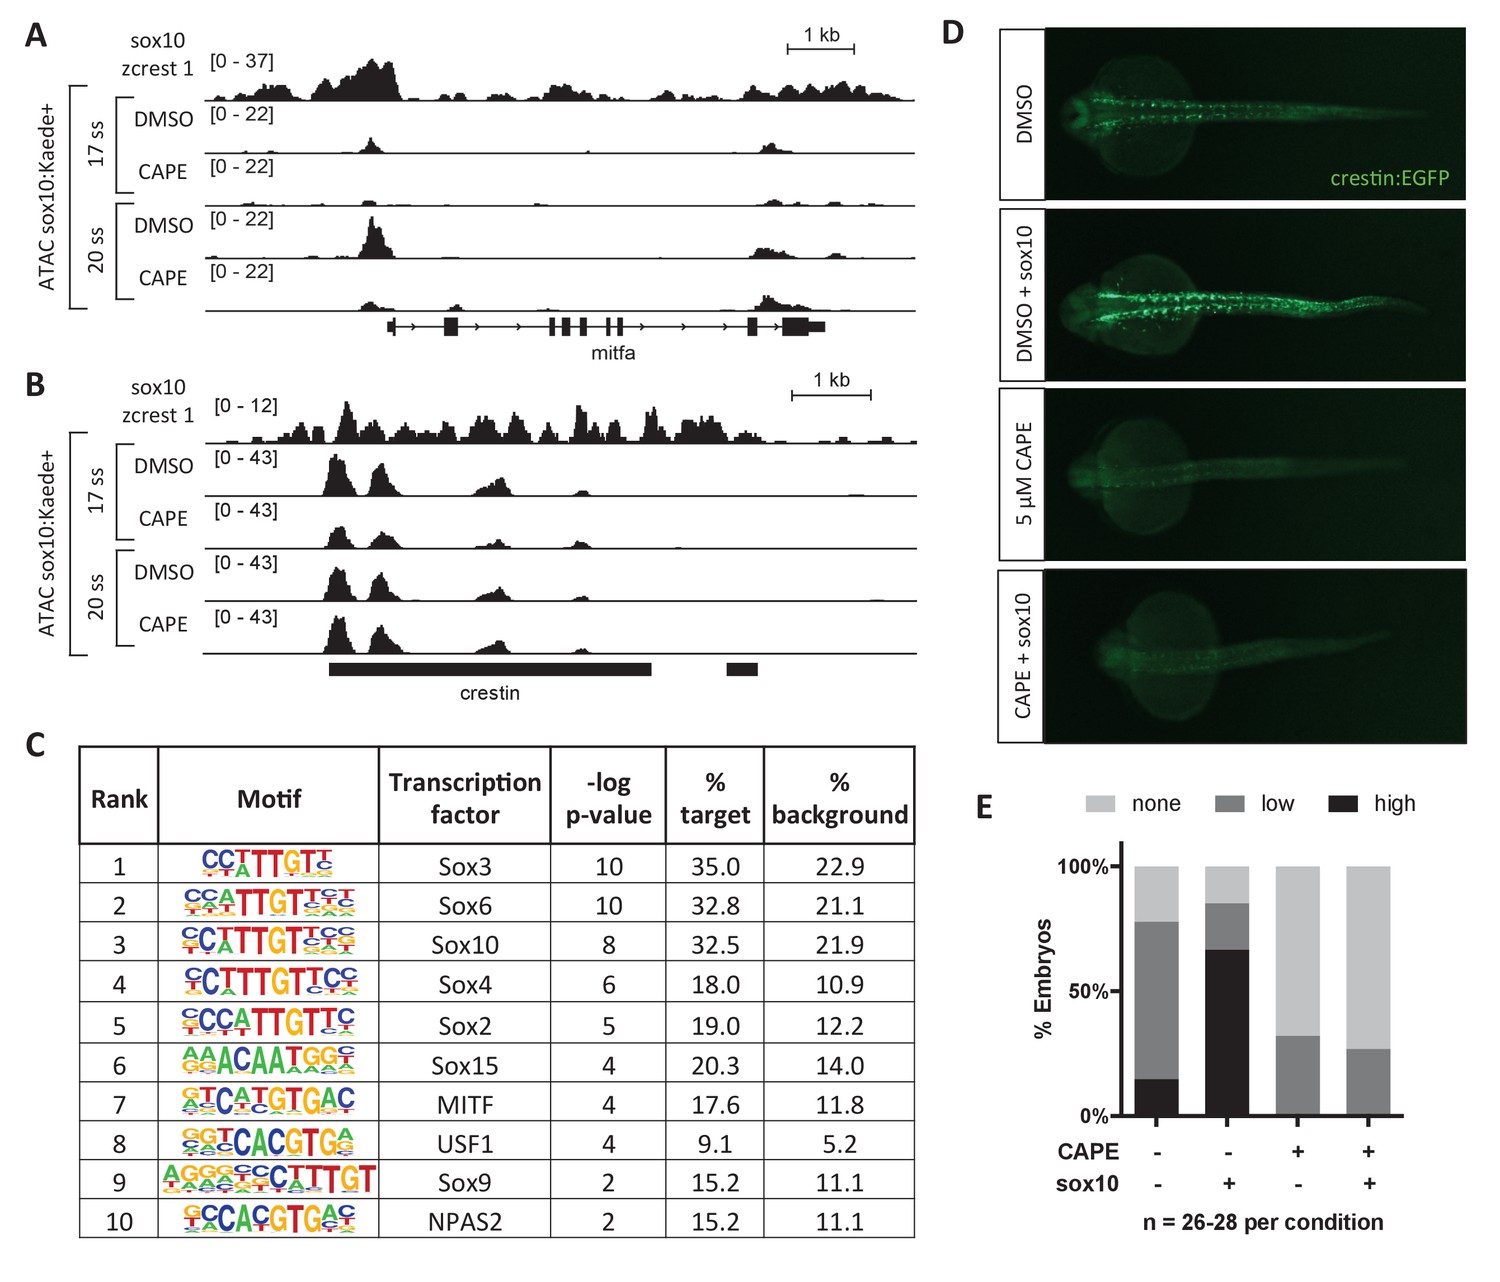
CAPE reduces Sox10 activity.
(A) ATAC-seq was conducted on sox10:Kaede+ cells from DMSO- or CAPE-treated embryos at two stages. CAPE reduces chromatin accessibility at the mitfa promoter in sox10:Kaede+ cells, and Sox10 binds the mitfa promoter in a zebrafish tumor cell line. (B) Crestin binds Sox10 but does not show a change in chromatin accessibility with CAPE treatment. Bar indicates region of crestin sequence similarity (chr4:41,270,000). (C) HOMER analysis of 20 ss ATAC-seq peaks revealed an enrichment for Sox and MITF motifs when comparing unique peaks in DMSO-treated embryos (% target) to all peaks in CAPE-treated embryos (% background). (D) CAPE (5 μM) prevents sox10 RNA (30 pg) from increasing crestin:EGFP expression. (E) Quantification of experiment shown in (D). Sum of three clutches from two independent experiments is shown. Figure 3—figure supplement 1 shows that tfap2c RNA increases crestin:EGFP expression in both DMSO- and CAPE-treated embryos, and that the number of sox10:Kaede+ cells does not change with CAPE treatment.
-
Figure 3—source data 1
Scoring of crestin:EGFP expression in sox10-injected and CAPE-treated embryos.
- https://doi.org/10.7554/eLife.29145.025
Figure 3—figure supplement 1
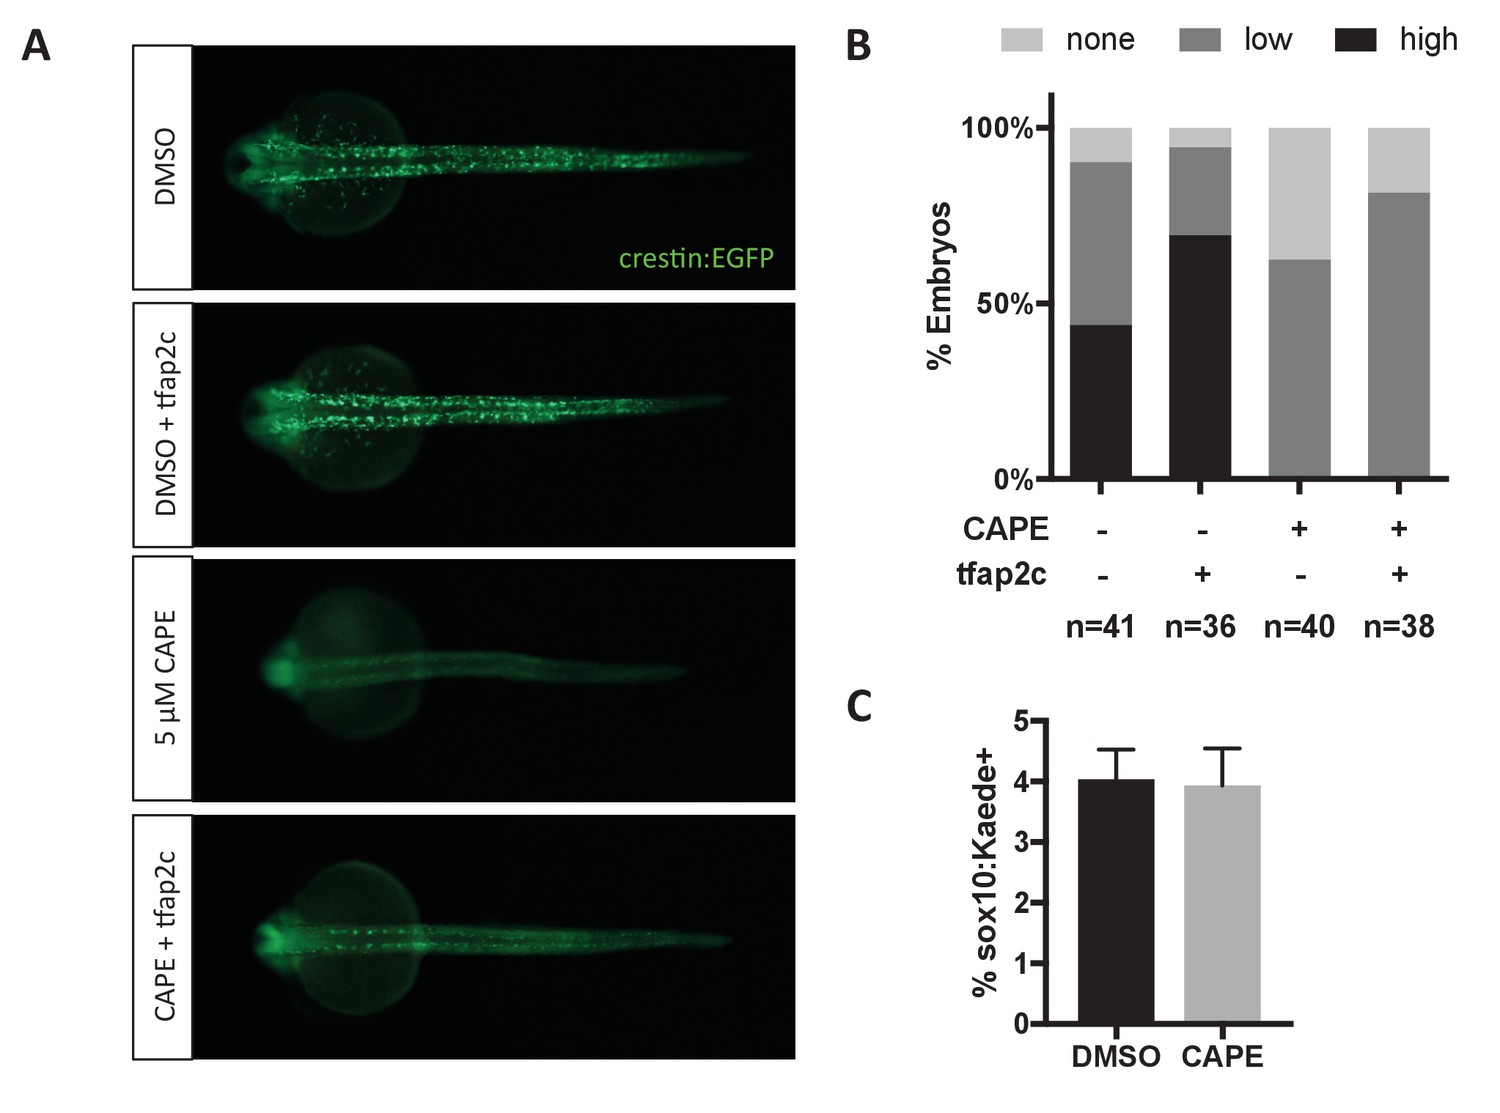
Tfap2c RNA injection (120 pg) increases crestin:EGFP expression in both control and CAPE-treated embryos.
(A) Crestin:EGFP expression in representative embryos. (B) Embryos were scored as in Figure 3E. Sum of three clutches from two independent experiments is shown. (C) Based on flow cytometric analysis at 17 ss, the percentage of sox10:Kaede+ live cells does not change with CAPE treatment. Mean and standard deviation of three independent experiments is shown.
-
Figure 3—figure supplement 1—source data 1
Scoring of crestin:EGFP expression in tfap2c-injected and CAPE-treated embryos.
- https://doi.org/10.7554/eLife.29145.026
-
Figure 3—figure supplement 1—source data 2
Percentage sox10:Kaede+ live cells in CAPE-treated embryos.
- https://doi.org/10.7554/eLife.29145.027
Figure 4 with 2 supplements
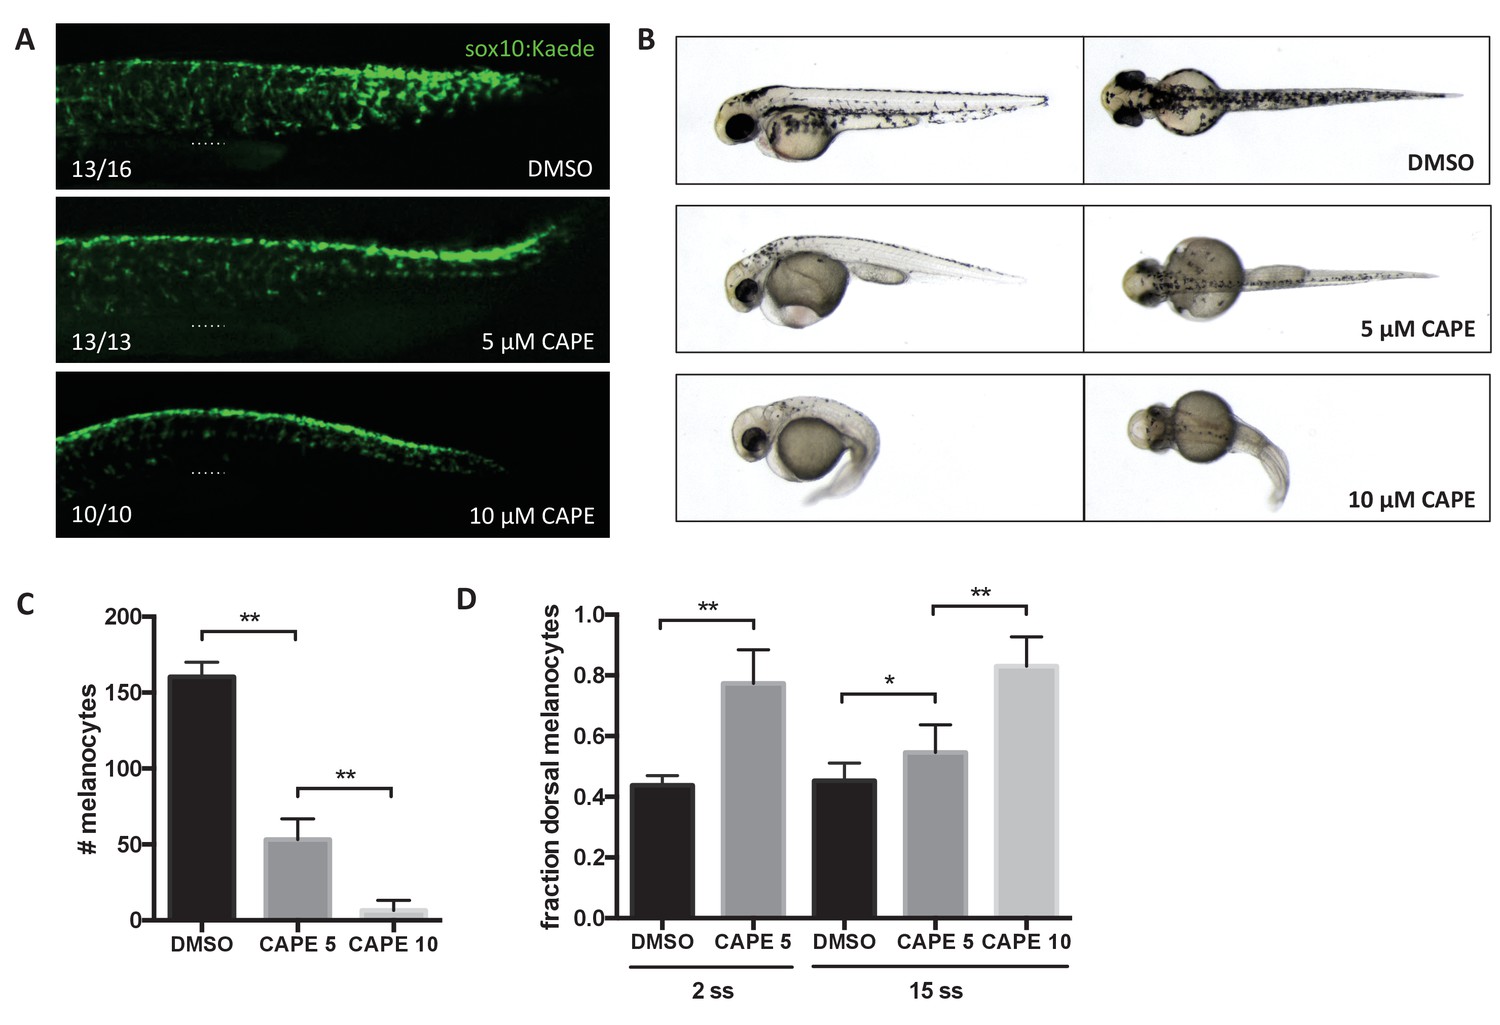
CAPE inhibits neural crest migration and pigment cell differentiation.
Embryos were treated at 2 ss unless otherwise indicated. (A) Sox10:Kaede+ cells in the trunk of zebrafish embryos are more dorsally located at 24 hpf. Dotted line indicates top of yolk sac extension. CAPE-treated embryos were allowed to develop for 4 hr longer than control embryos for stage matching. Numbers indicate fraction of embryos for which images are representative. Some DMSO control embryos showed a pattern similar to 5 μM CAPE. Similar results were observed in three independent experiments. (B) Morphology and pigmentation of CAPE-treated embryos at 2 dpf. Treated embryos showed reduced pigmentation and defects such as pericardial edema and a curved tail. (C) Melanocyte counts corresponding to (B). Trunk melanocytes were counted from the yolk sac extension to the end of the tail. Error bars represent standard deviation of 10 embryos from two independent experiments. (D) CAPE increases the fraction of dorsal melanocytes at 2 dpf. Melanocytes were counted as in (C). Embryonic stage at drug treatment is indicated. *p<0.05, **p<0.0005, unpaired t-test. Figure 4—figure supplement 1 shows the effect of CAPE on xanthophores and iridophores at 3 dpf. Figure 4—figure supplement 2 shows the effect of CAPE on otic vesicle development.
-
Figure 4—source data 1
Melanocyte numbers in CAPE-treated embryos.
- https://doi.org/10.7554/eLife.29145.031
-
Figure 4—source data 2
Fraction dorsal melanocytes in CAPE-treated embryos.
- https://doi.org/10.7554/eLife.29145.032
Figure 4—figure supplement 1
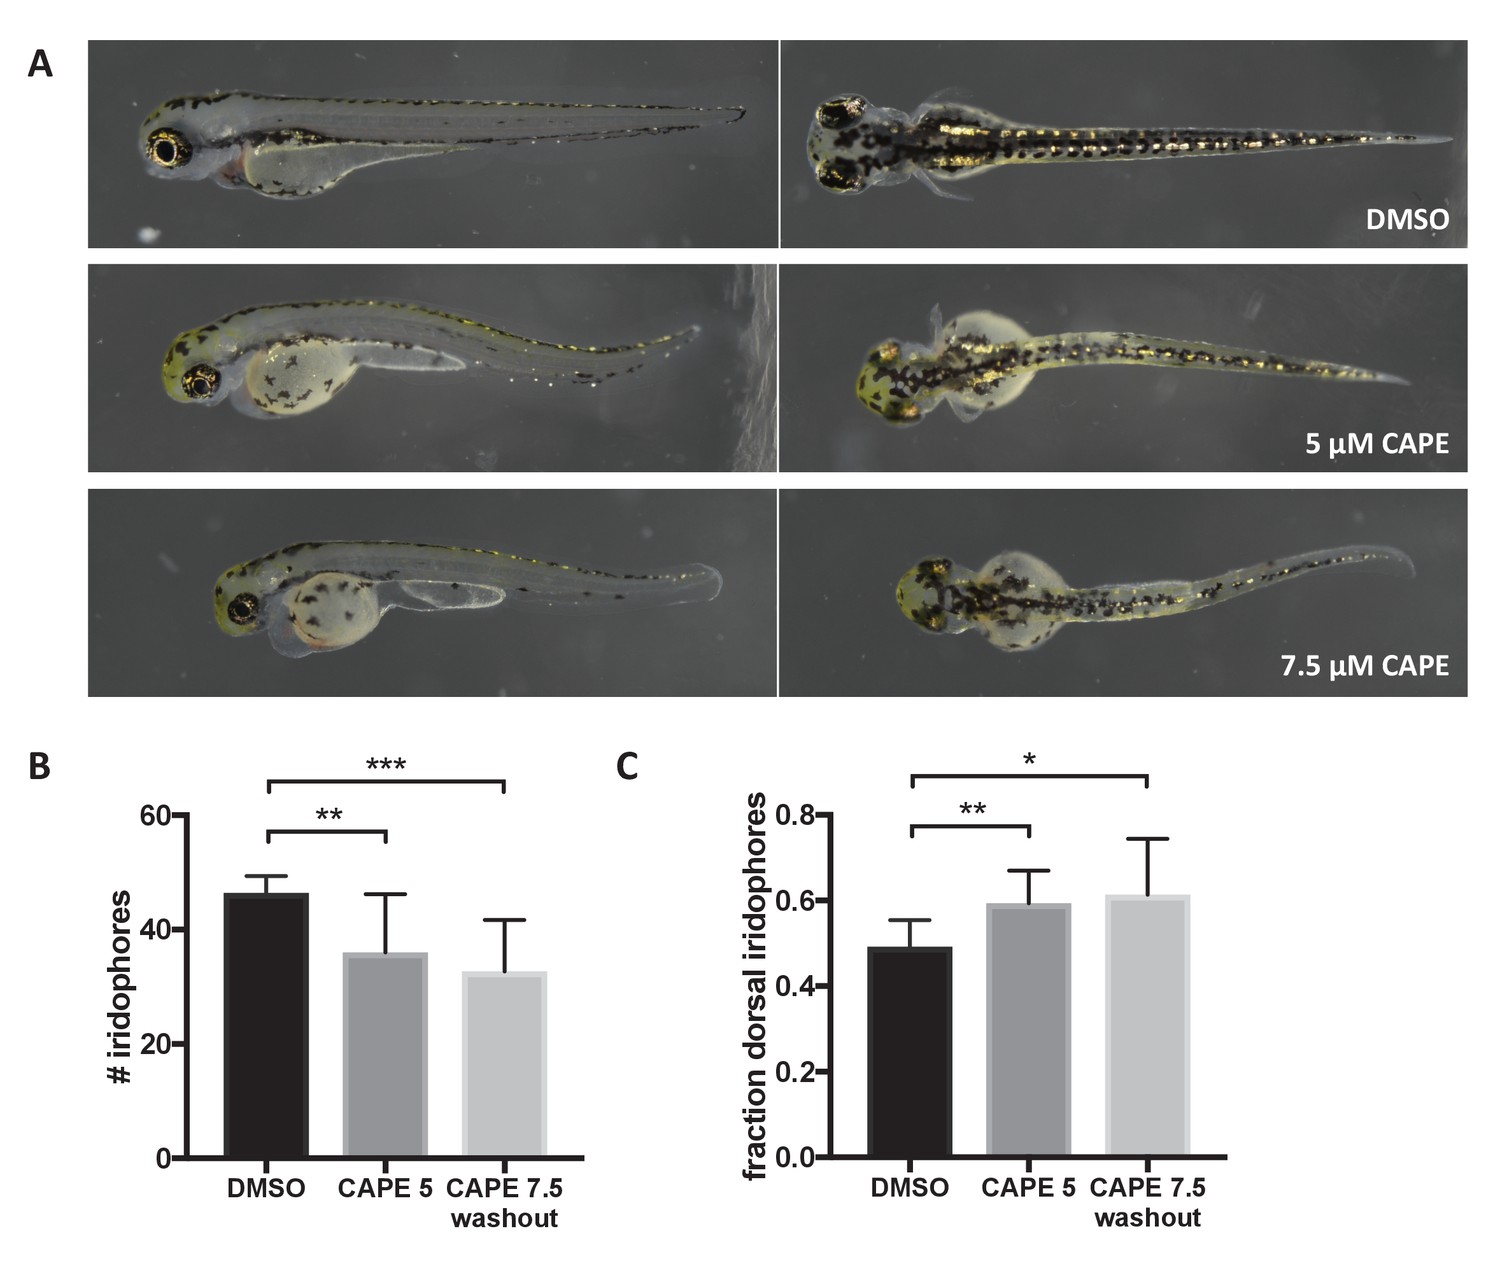
CAPE disrupts iridophore development less dramatically than melanocyte development.
Embryos were treated with the indicated concentration of CAPE at 2 ss either continuously (5 μM) or until 48 hpf (7.5 μM washout) to reduce toxicity. (A) Pigment cell phenotypes at 3 dpf. (B) Iridophore counts at 3 dpf. Iridophores were counted from the yolk sac extension to the end of the tail. Iridophore number is slightly reduced by CAPE. Error bars represent standard deviation of 10 embryos from a single clutch. (C) Fraction of dorsal iridophores is slightly increased by CAPE. *p<0.05, **p<0.005, ***p<0.0005, unpaired t-test.
-
Figure 4—figure supplement 1—source data 1
Number of iridophores in CAPE-treated embryos.
- https://doi.org/10.7554/eLife.29145.033
-
Figure 4—figure supplement 1—source data 2
Fraction dorsal iridophores in CAPE-treated embryos.
- https://doi.org/10.7554/eLife.29145.034
Figure 4—figure supplement 2
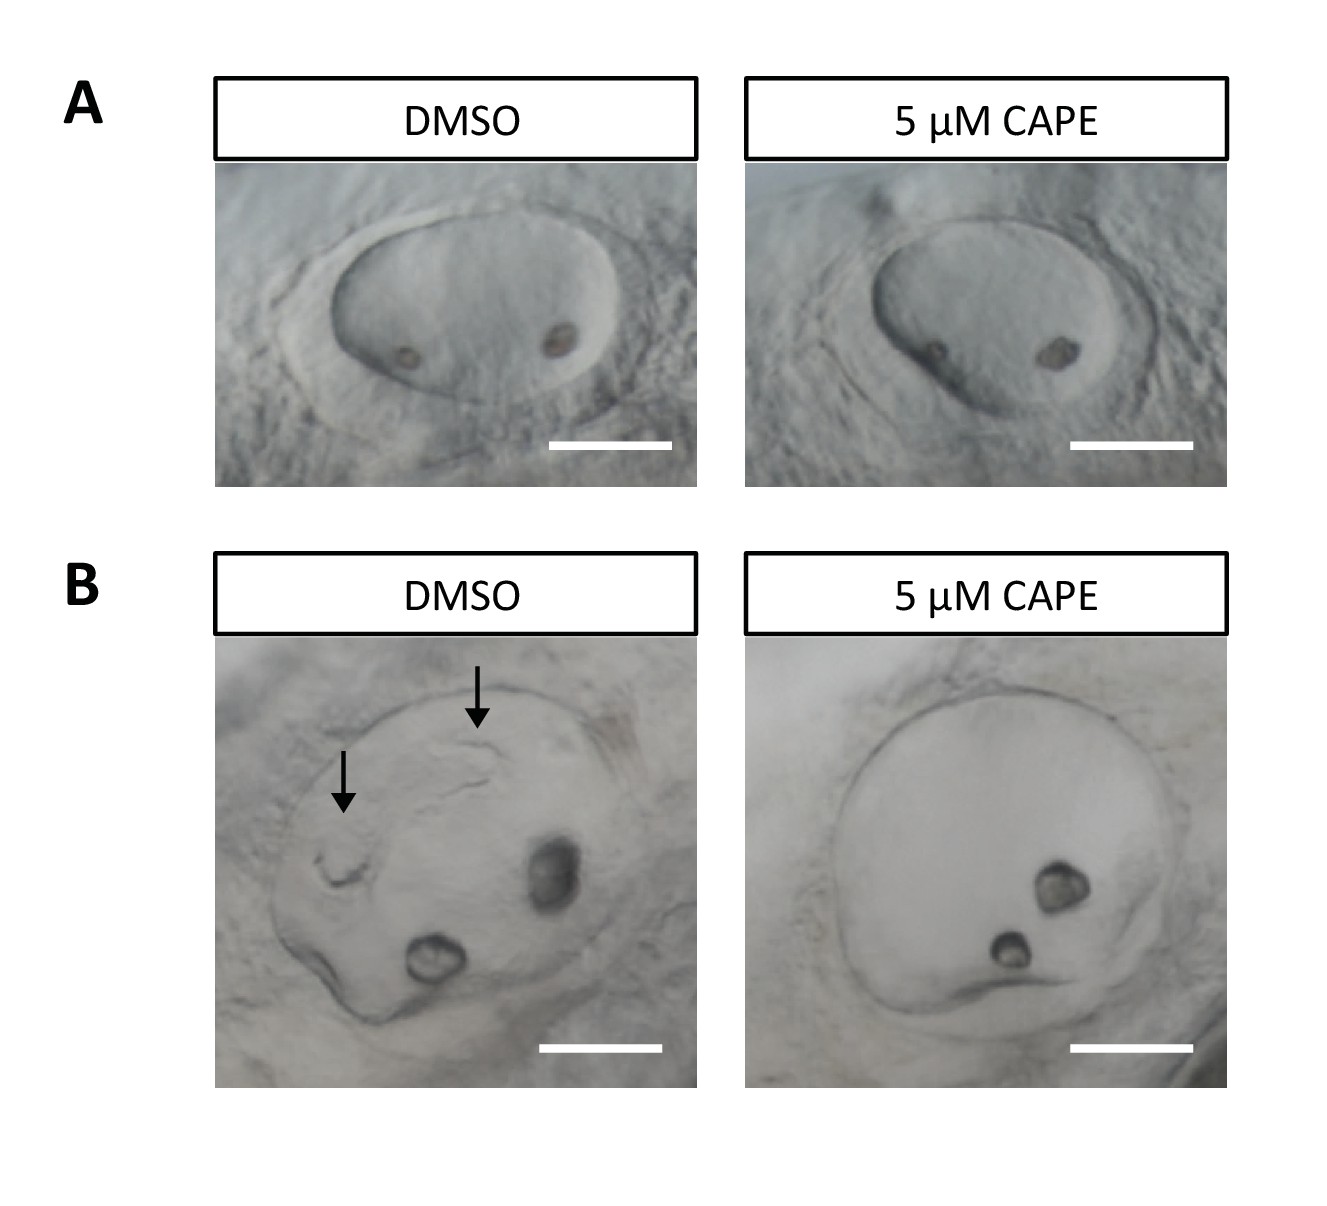
CAPE disrupts ear development.
Embryos were treated continuously from 2 ss. (A) Otic vesicles of control and CAPE-treated embryos at 24 hpf. (B) Otic vesicles of control and CAPE-treated embryos at 48 hpf. Note lack of semicircular canal projections (arrows). Scale bar: 50 μm.
Figure 5 with 1 supplement
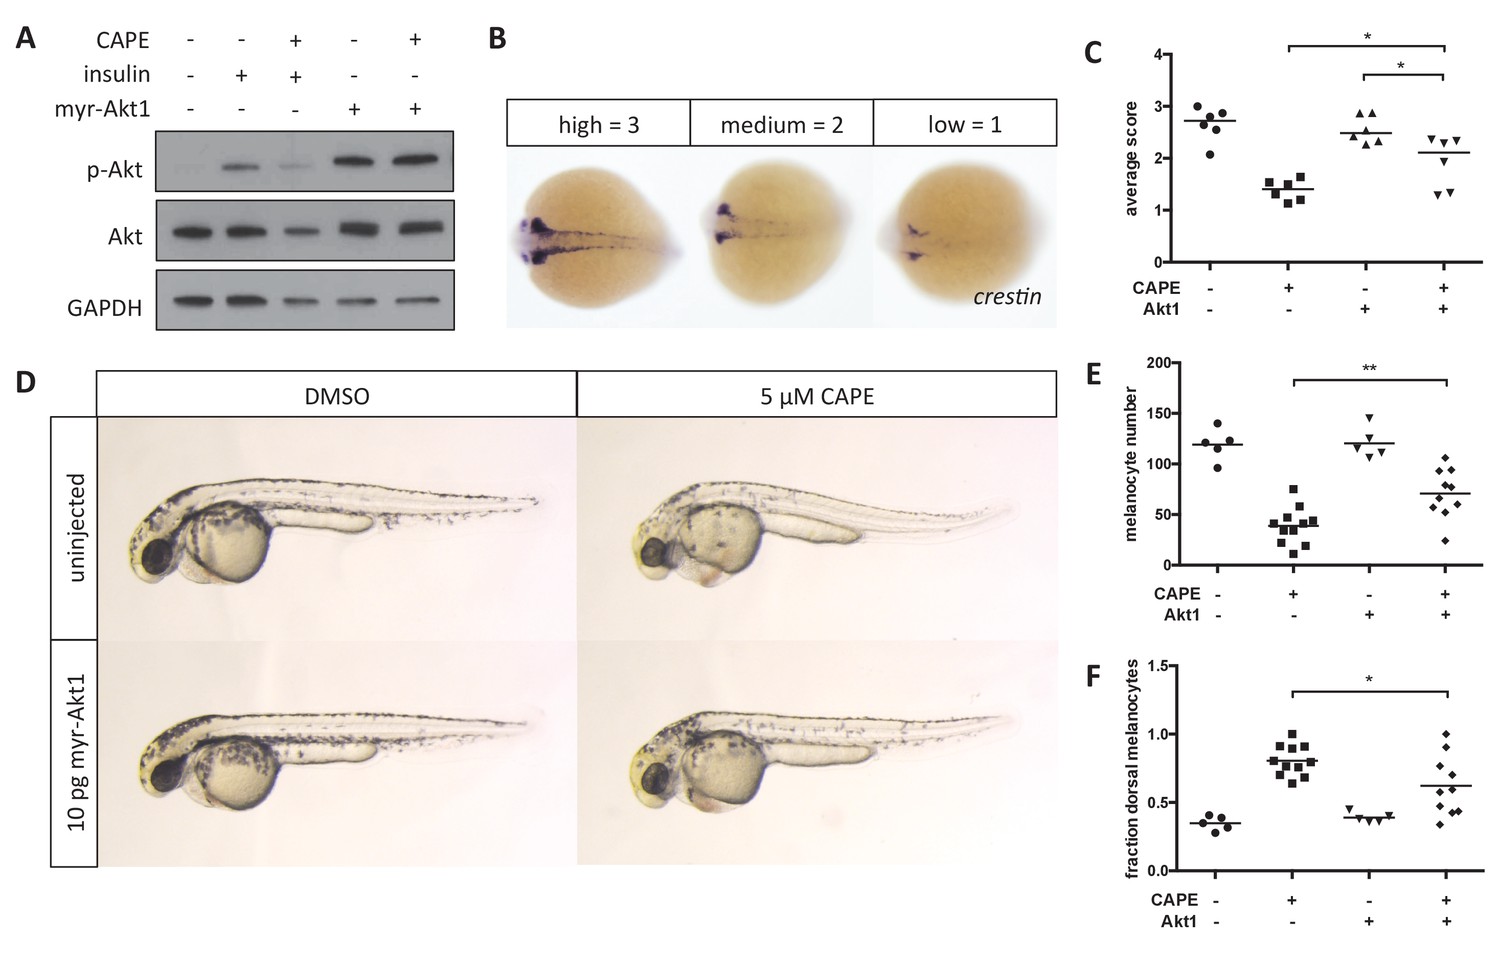
Myr-Akt1 rescues neural crest defects caused by CAPE.
(A) Injection of myr-Akt1 RNA results in high phospho-Akt in heterogeneous neural crest cultures regardless of CAPE treatment. The same result was observed in four independent experiments. (B) Scoring system for crestin in situ hybridization. (C) Myr-Akt1 injection increases crestin expression in CAPE-treated embryos. Each point represents the average score of embryos from a single clutch (23–66 embryos per clutch). Three independent experiments are shown. (D) Morphology and pigmentation of CAPE-treated and injected embryos at 2 dpf. Images are representative of three independent experiments. (E) Myr-Akt1 increases melanocyte number in CAPE-treated embryos. Trunk melanocytes were counted as in Figure 4. Each point represents one embryo from the same clutch; bars indicate mean. (F) Myr-Akt1 reduces the fraction of dorsal melanocytes in CAPE-treated embryos. *p<0.05, **p<0.005, (C) paired t-test, (E–F) unpaired t-test. Figure 5—figure supplement 1 shows the effect of PI3K inhibitors on crestin:EGFP expression in vitro and the effect of myr-Akt1 on CAPE-induced embryonic defects.
-
Figure 5—source data 1
Scoring of crestin expression by ISH in CAPE-treated and myr-Akt1-injected embryos.
- https://doi.org/10.7554/eLife.29145.039
-
Figure 5—source data 2
Melanocyte numbers in CAPE-treated and myr-Akt1-injected embryos.
- https://doi.org/10.7554/eLife.29145.040
-
Figure 5—source data 3
Melanocyte numbers in CAPE-treated and myr-Akt1-injected embryos.
- https://doi.org/10.7554/eLife.29145.041
Figure 5—figure supplement 1
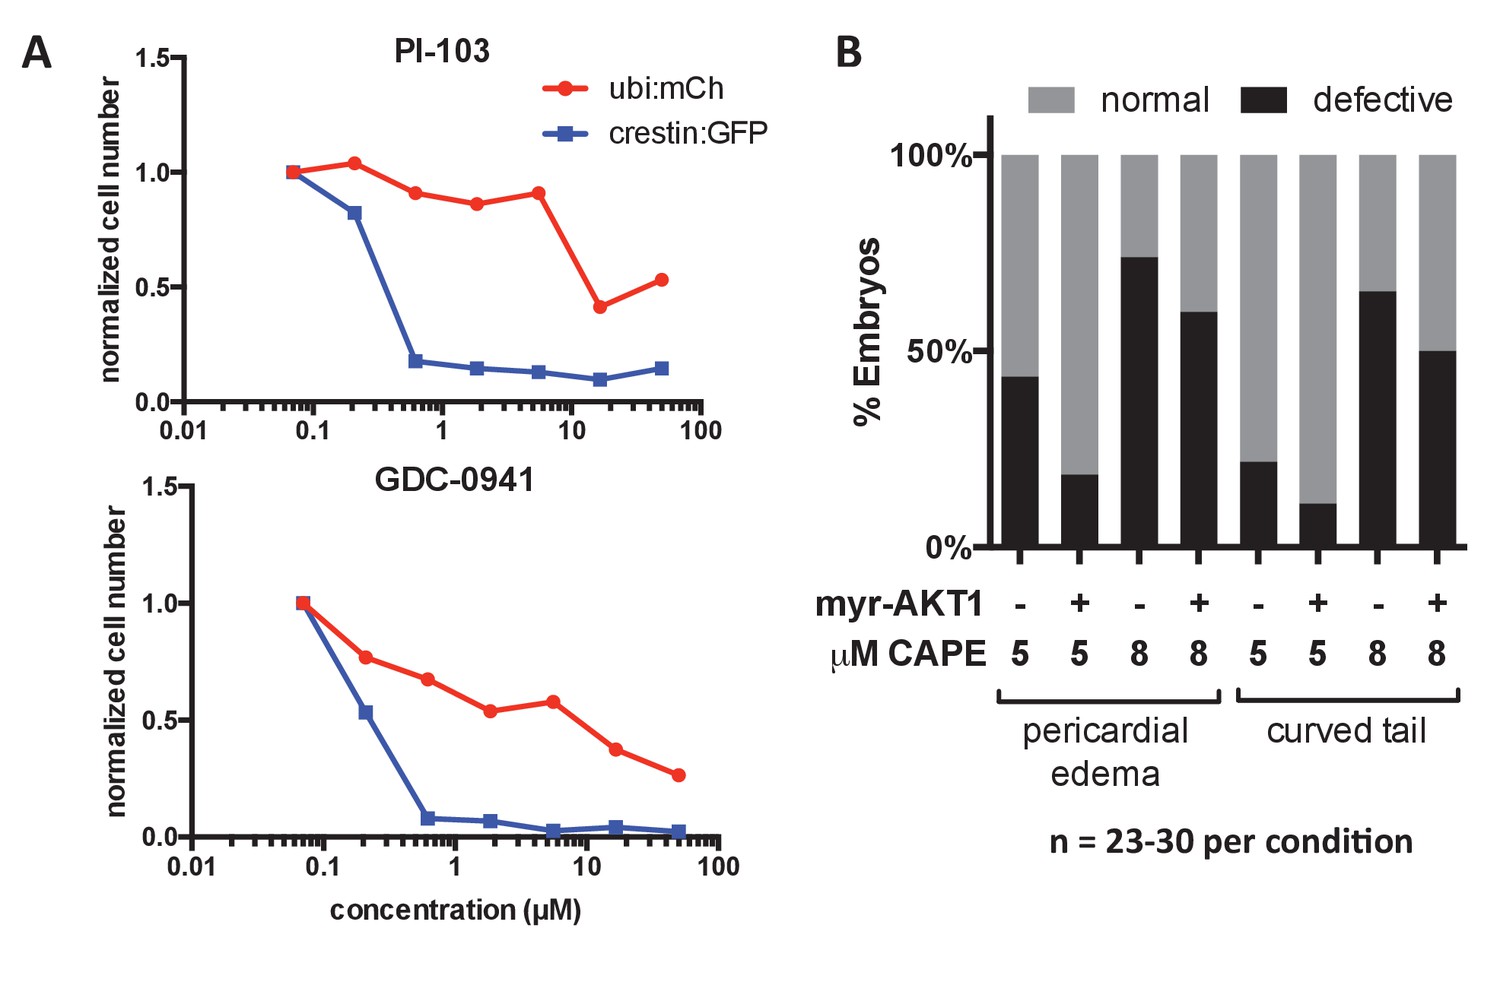
Effect of PI3K inhibitors on crestin:EGFP expression in vitro and effect of myr-Akt1 injection on CAPE-induced defects.
(A) PI3K inhibitors selectively reduce crestin:EGFP+ cells compared to ubi:mCherry+ controls representing a random population of cells. Cells were plated with the indicated concentration of inhibitor and cultured for 24 hr. (B) Myr-Akt1 injection slightly reduces CAPE-induced defects. 23–30 embryos were analyzed per condition from the same injection.
-
Figure 5—figure supplement 1—source data 1
Ubi:mCherry+ and crestin:EGFP+ cell numbers in cultures treated with PI-103.
- https://doi.org/10.7554/eLife.29145.042
-
Figure 5—figure supplement 1—source data 2
Ubi:mCherry+ and crestin:EGFP+ cell numbers in cultures treated with GDC0941.
- https://doi.org/10.7554/eLife.29145.043
-
Figure 5—figure supplement 1—source data 3
Developmental defects in CAPE-treated and myr-Akt1-injected embryos.
- https://doi.org/10.7554/eLife.29145.044
Figure 6 with 2 supplements
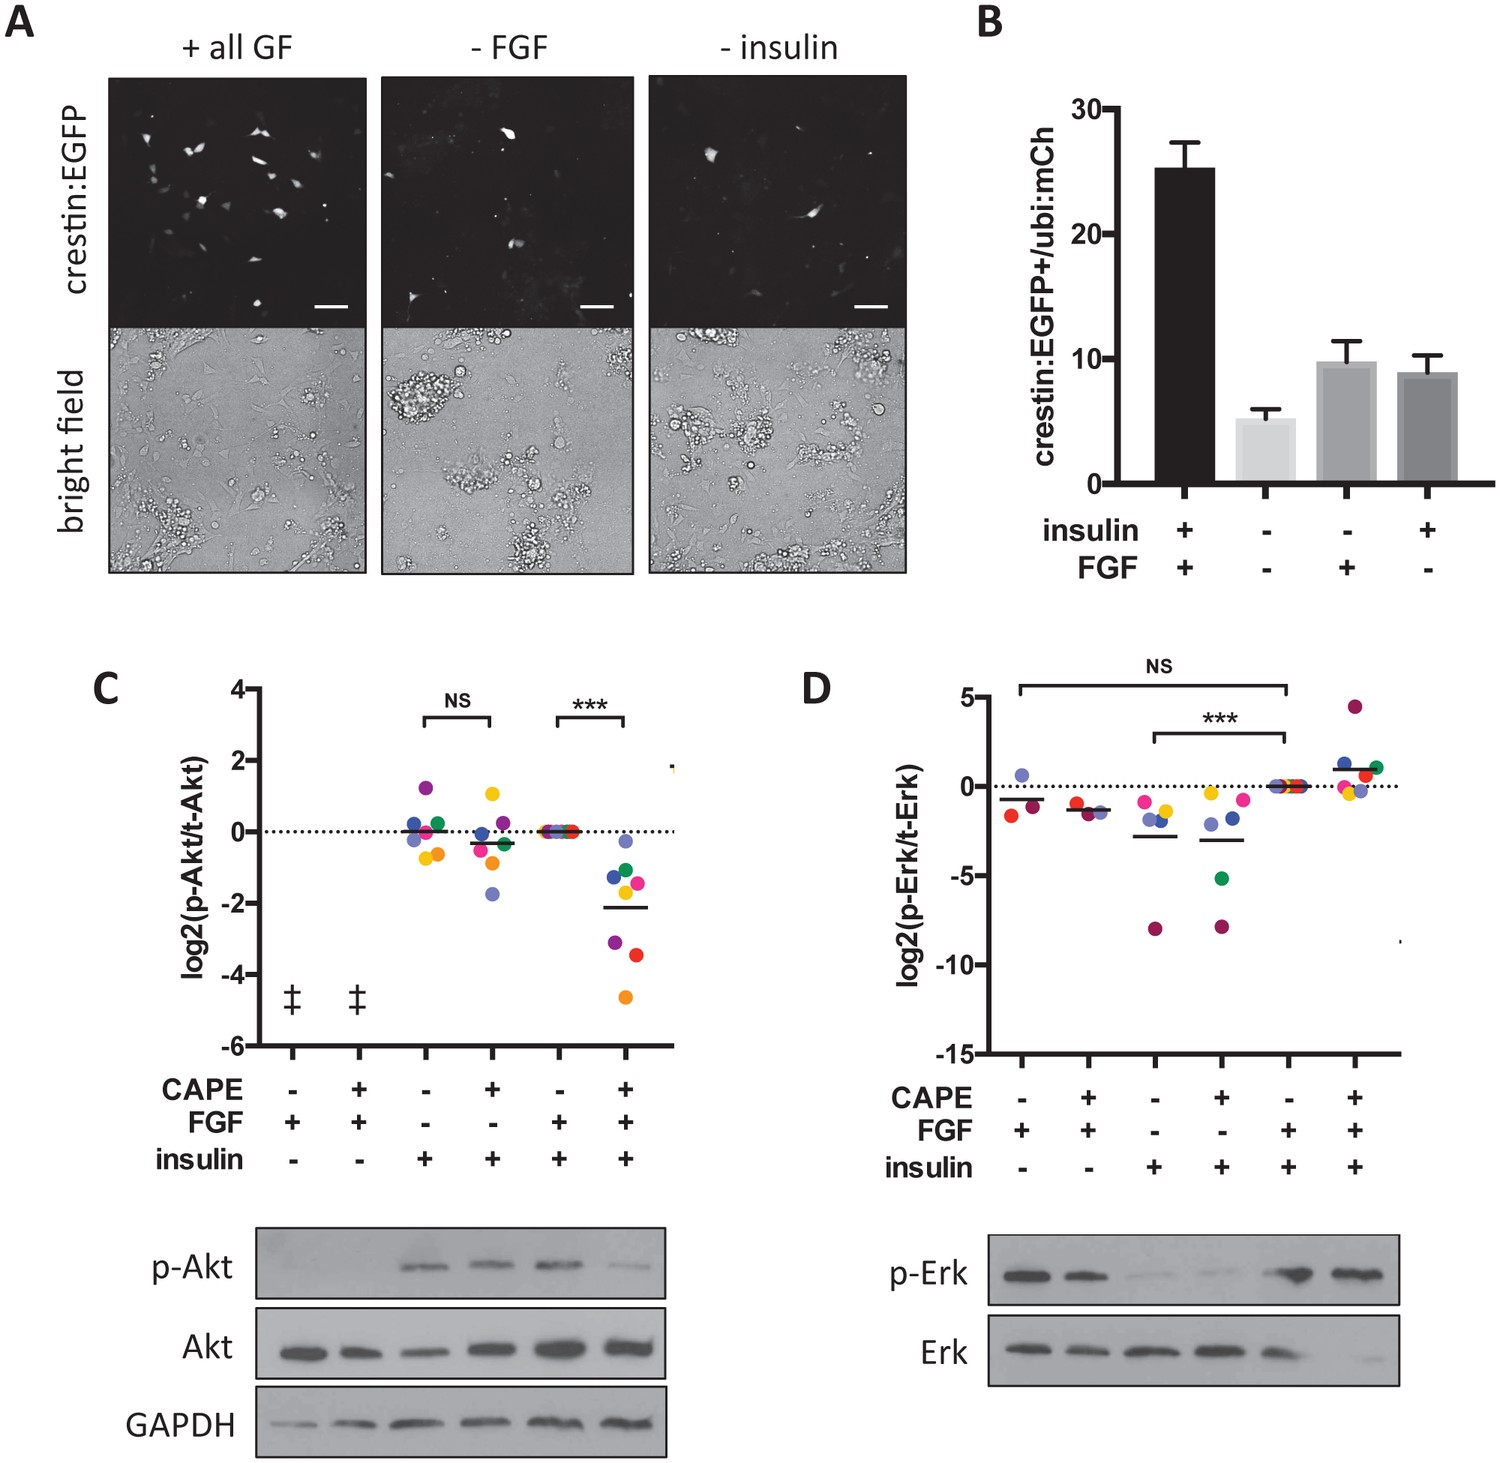
CAPE inhibits FGF-stimulated Akt activation in vitro.
Embryos were plated in neural crest medium and cultured for 2 hr for western blotting. (A) Heterogeneous neural crest cultures after 24 hr in neural crest medium with or without FGF and insulin. Scale bar: 100 μm. Images are representative of three independent experiments. (B) Quantification of crestin:EGFP+ cells for (A). Number of cells was determined by thresholding and normalized to ubi:mCherry fluorescence representing total cell number. Mean and standard deviation of at least 4 wells is shown. (C) Ratio of phosphorylated to total Akt. Each point represents an independent experiment corresponding to color. Samples were normalized within an experiment so that p-Akt to Akt ratio with FGF and insulin but without CAPE (condition 5) had a value of 1. Insulin but not FGF stimulation leads to Akt phosphorylation. CAPE inhibits Akt only in FGF-stimulated cells. (D) Ratio of phosphorylated to total Erk. Values were normalized as in (C). FGF but not insulin stimulation leads to Erk phosphorylation. ‡ no signal detected *p<0.05, **p<0.005, ***p<0.0005, paired t-test. Figure 6—figure supplement 1 shows a model for CAPE’s mechanism of action based on the effects of a Mek inhibitor (CI-1040) and a PI3K inhibitor (PI-103) on Akt and Erk phosphorylation. Figure 6—figure supplement 2 shows the effect of RTK inhibitors on crestin expression in vivo.
-
Figure 6—source data 1
Number of crestin:EGFP+ cells per total ubi:mCherry fluorescence.
- https://doi.org/10.7554/eLife.29145.048
-
Figure 6—source data 2
Quantification of p-Erk/Erk and p-Akt /Akt ratios by western blot and densitometry.
- https://doi.org/10.7554/eLife.29145.049
Figure 6—figure supplement 1
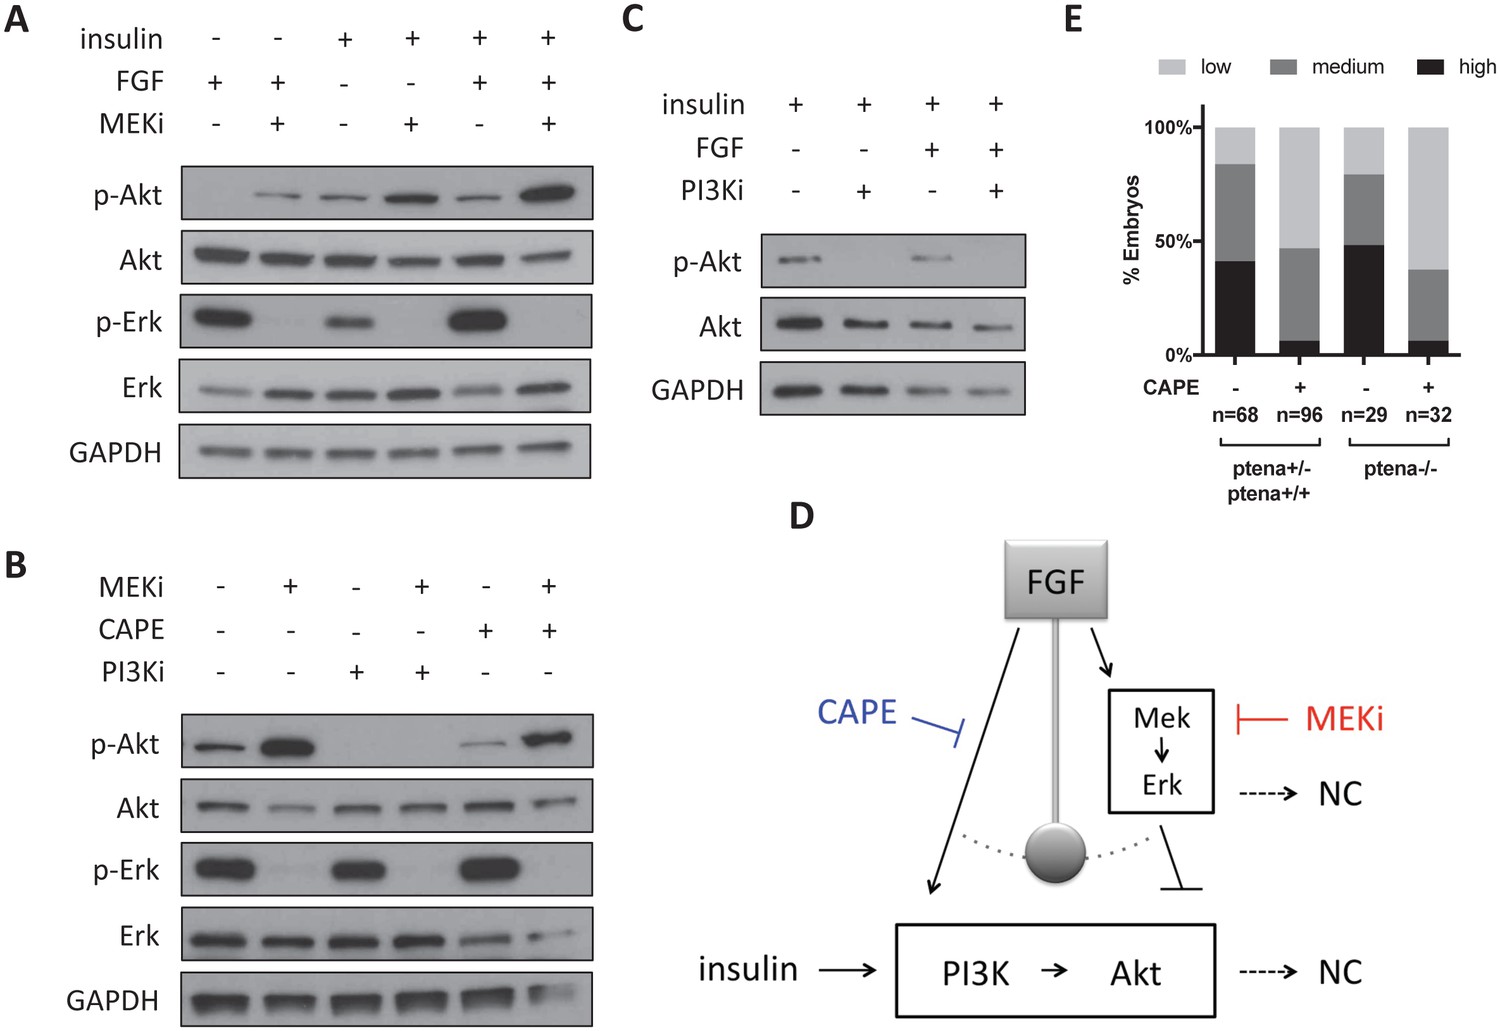
CAPE inhibits FGF-stimulated Akt activation.
Whole embryos were cultured for two hours in neural crest medium with the indicated growth factors and inhibitors for all experiments. Unless otherwise noted, cultures contained insulin and FGF. CI-1040 was used to inhibit Mek (10 μM), and PI-103 (5 μM) was used to inhibit PI3K. Blots are representative of three independent experiments. (A) Mek inhibition leads to increased Akt phosphorylation. FGF stimulates Akt phosphorylation only in the context of Mek inhibition. Mek inhibition more strongly stimulates Akt phosphorylation with FGF stimulation. (B) PI-103 prevents p-Akt induction upon Mek inhibition, but CAPE does not. (C) PI3K inhibition reduces phospho-Akt regardless of FGF stimulation. (D) Model for CAPE’s mechanism of action based on data in (A–C). FGF stimulation acts like a pendulum that swings between Akt activation and Erk activation. (E) CAPE reduces crestin expression regardless of pten status based on ISH and scoring system in Figure 5B. All embryos were ptenb -/- and ptena genotypes are indicated. The sum of two independent experiments is shown.
-
Figure 6—figure supplement 1—source data 1
Scoring of crestin expression by ISH in pten mutant embryos.
- https://doi.org/10.7554/eLife.29145.050
Figure 6—figure supplement 2
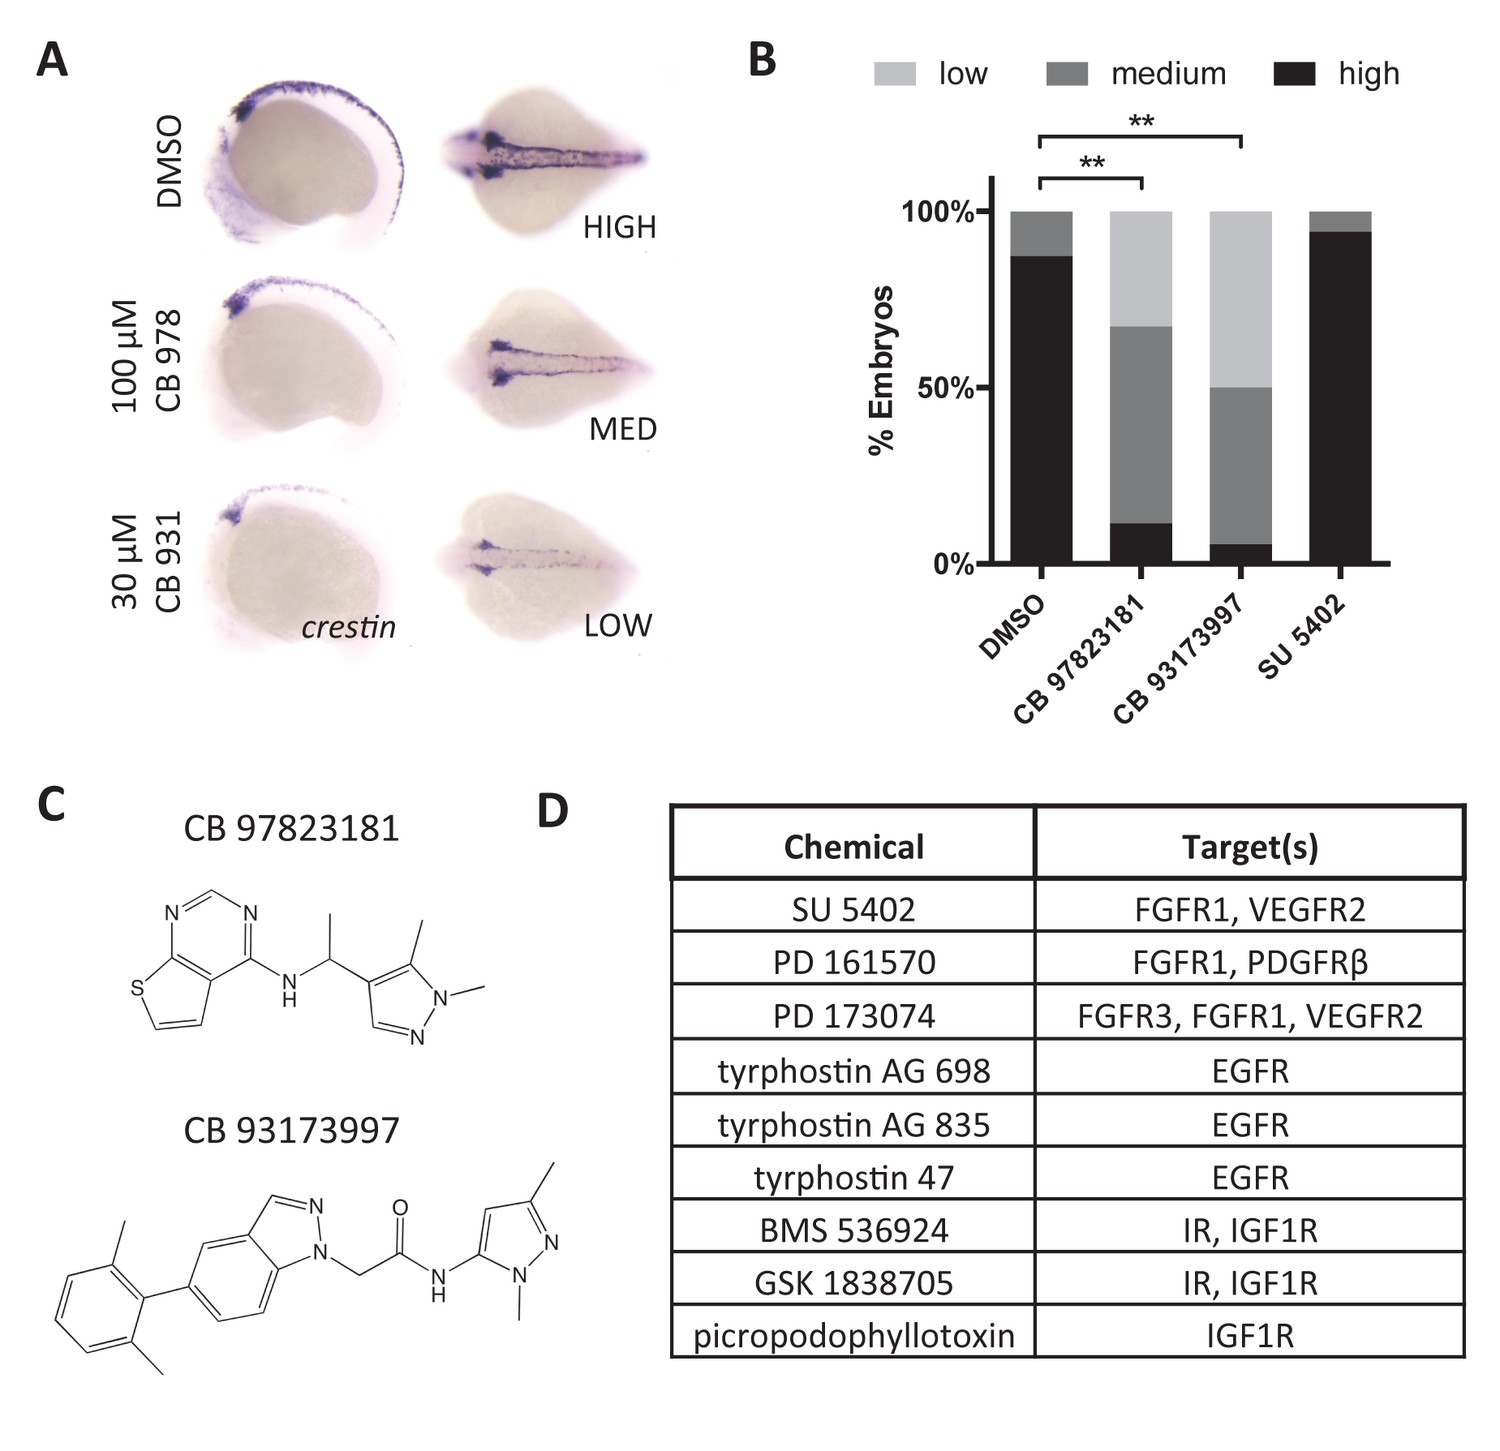
RTK signaling regulates crestin expression.
(A) Treatment of embryos with Chembridge novel kinase inhibitors at 2 ss decreases crestin expression at 15 ss. (B) Quantification of crestin expression in drug-treated embryos based on the scoring system in (A). The combined results of two independent experiments are shown. **p<0.0005, chi-square test (C) Structures of Chembridge kinase inhibitors. (D) Receptor tyrosine kinase inhibitors that had no effect on crestin expression. Chemicals were tested up to 100 μM.
-
Figure 6—figure supplement 2—source data 1
Scoring of crestin expression by ISH with kinase inhibitor treatment.
- https://doi.org/10.7554/eLife.29145.051
Figure 7
Akt signaling regulates neural crest gene expression in vivo.
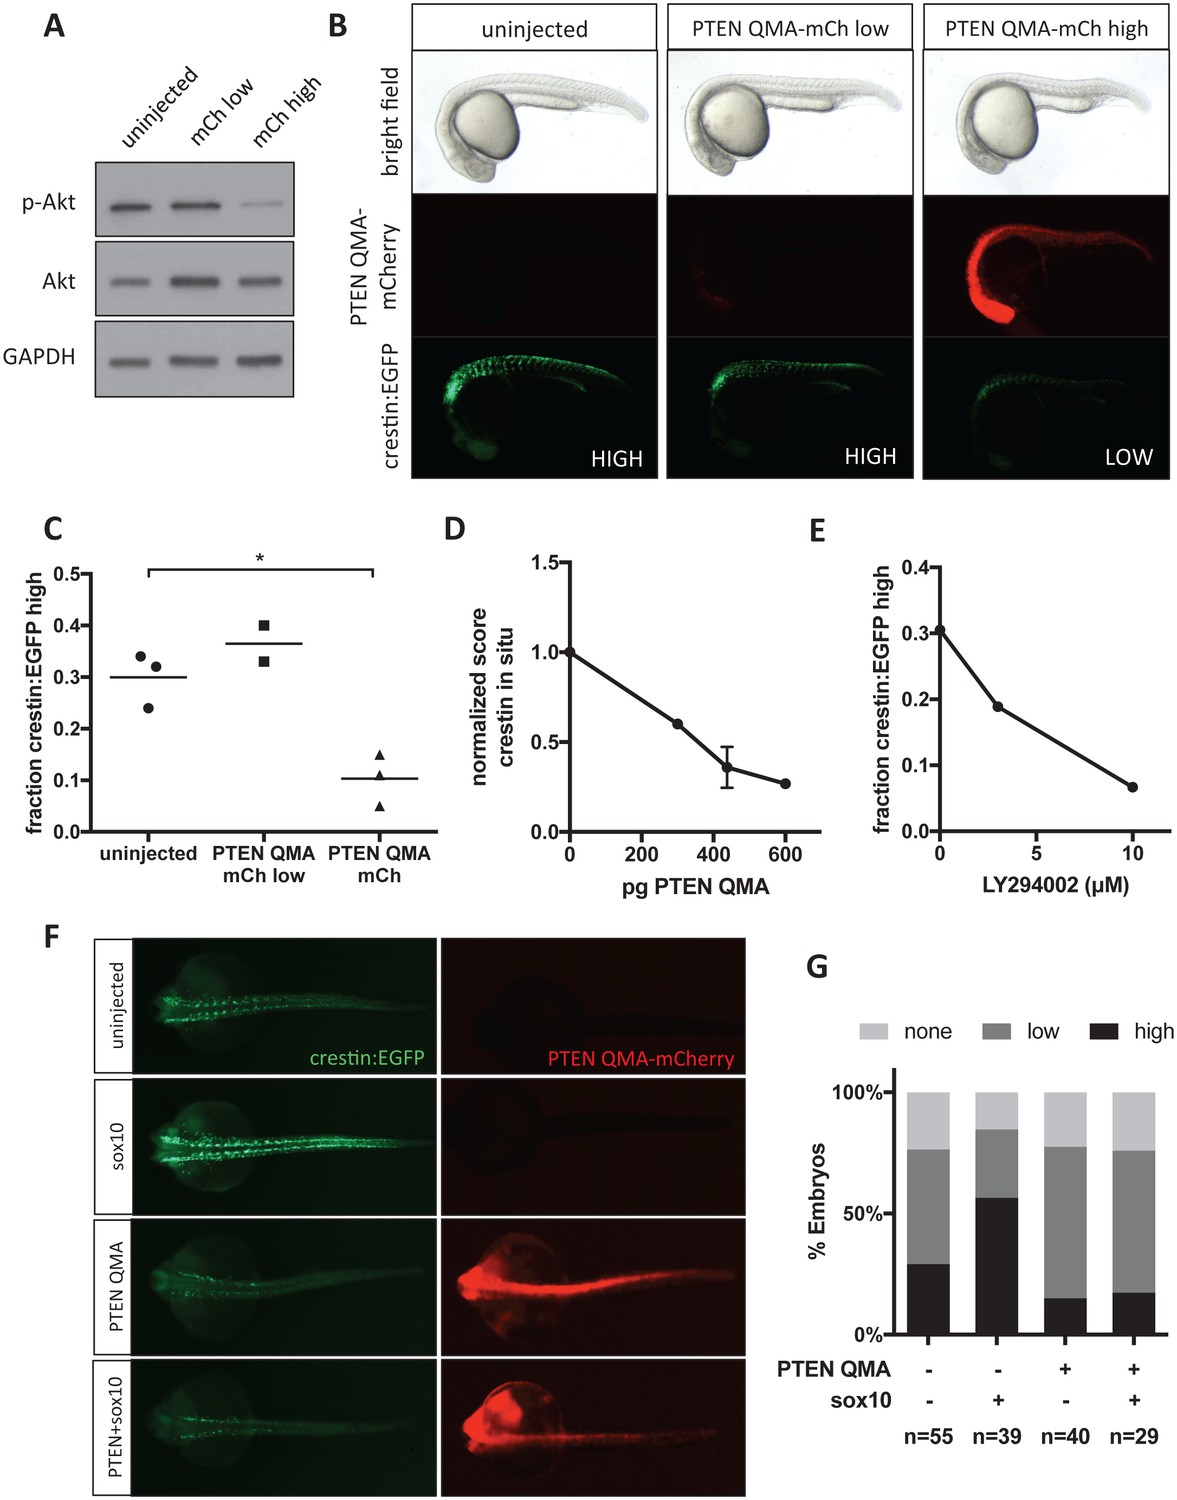
(A) PTEN QMA-mCherry (300 pg) reduces phospho-Akt level in whole embryos. (B) Morphology, PTEN QMA-mCherry expression, and crestin:EGFP expression of PTEN QMA-mCherry injected embryos. Scoring system for crestin:EGFP levels is indicated. (C) Quantification based on scoring in (B). Each point represents a single clutch (5–53 embryos per condition), and mean is indicated. One clutch generated less than 5 PTEN QMA-mCherry low embryos and is not shown. *p<0.01, Student’s t-test (D) PTEN QMA-mCherry decreases crestin expression by ISH. Embryos were scored as in Figure 5B. Average score normalized to uninjected control is indicated. Error bars represent SEM of four clutches (7–28 embryos per condition) from three independent experiments. One clutch was excluded because of abnormally low staining in both control and injected embryos. (E) The PI3K inhibitor LY294002 decreases crestin:EGFP expression. Points indicate the average of two independent experiments. (F) PTEN QMA-mCherry prevents Sox10 from stimulating crestin:EGFP expression. Representative embryos from the same clutch are shown. (G) Three clutches (8–19 embryos per condition) from two independent experiments were scored as in (B).
-
Figure 7—source data 1
Scoring of crestin:EGFP expression in PTEN QMA-mCherry-injected embryos.
- https://doi.org/10.7554/eLife.29145.053
-
Figure 7—source data 2
Scoring of crestin expression by ISH in PTEN QMA-injected embryos.
- https://doi.org/10.7554/eLife.29145.054
-
Figure 7—source data 3
Scoring of crestin:EGFP expression in LY294002-treated embryos.
- https://doi.org/10.7554/eLife.29145.055
-
Figure 7—source data 4
Scoring of crestin:EGFP in sox10- and PTEN-injected embryos.
- https://doi.org/10.7554/eLife.29145.056
Videos
Video 1
Crestin:EGFP time lapse in heterogeneous neural crest cultures.
https://doi.org/10.7554/eLife.29145.009
Video 2
Crestin:EGFP expression in DMSO-treated zebrafish embryos.
Embryos were treated at 2 ss and mounted for imaging at 10 ss. Embryos were imaged for 16.25 hr, and images were collected every 9 min.
Video 3
Crestin:EGFP expression in CAPE-treated (10 μM) zebrafish embryos.
Embryos were treated at 2 ss and mounted for imaging at 10 ss. Embryos were imaged for 16.25 hr, and images were collected every 9 min.
Video 4
Neural crest migration in DMSO-treated zebrafish embryos.
Sox10:GFP transgenic embryos were treated at 2 ss and mounted for imaging at 15 ss. Embryos were imaged for 12 hr, and images were collected every 10 min.
Video 5
Neural crest migration in CAPE-treated (10 μM) zebrafish embryos.
Sox10:GFP transgenic embryos were treated at 2 ss and mounted for imaging at 15 ss. Embryos were imaged for 12 hr, and images were collected every 10 min.
Tables
Table 1
In vitro validated screen hits.
Hits that also validated in vivo are bold.
| Compound | Library | Target/category |
|---|---|---|
| CAPE | ICCB | NFkB/multiple |
| raloxifene | LOPAC | Estrogen receptor |
| mianserin | LOPAC | 5-HT receptor antagonist |
| GANT61 | LOPAC | Hedgehog |
| MnTBAP | ICCB | SOD mimetic |
| loperamide | FDA approved | Mu opiod receptor agonist |
| latanoprost | FDA approved | prostaglandin F2a analogue |
| tetraethylthiuram disulfide | LOPAC | alcohol dehydrogenase |
| dopamine | LOPAC | dopamine receptor |
| mycophenolate mofetil | LOPAC | IMPH |
| genistein | LOPAC | kinase inhibitor |
| albendazole | FDA approved | antihelminthic |
| JFD00244 | LOPAC | sirt2 inhibitor |
| perphenazine | FDA approved | 5-HT receptor |
| 5-NOT | FDA approved | 5-HT agonist |
| SKF95282 | LOPAC | histamine H2 receptor antagonist |
| bicalutamide | FDA approved | anti-androgen |
| capsazepine | LOPAC | sodium channels |
| triflupromazine | LOPAC | monoamine transporters |
| flubendazole | FDA approved | antihelminthic |
| GDC-0941 | LOPAC | PI3K |
| imatinib | FDA approved | RTK inhibitor |
| indatraline | LOPAC | dopamine uptake inhibitor |
| MBCQ | ICCB | PDE5 |
| MDL-28170 | ICCB | calpain inhibitor |
| NS8593 | LOPAC | potassium channels |
| NU6027 | LOPAC | ATR/CDK2 inhibitor |
| PD180970 | LOPAC | RTK inhibitor |
| PD173074 | LOPAC | src inhibitor |
| PI-103 | LOPAC | PI3K |
| rapamycin | LOPAC | mTOR |
| SB242084 | LOPAC | 5-HT receptor antagonist |
| triptolide | FDA approved | RNA pol II |
| tyrphostin AG698 | LOPAC | tyrosine kinase inhibitor |
| wiskostatin | LOPAC | actin |
| PAC-1 | LOPAC | proapoptotic zinc chelator |
| PD407824 | LOPAC | chk1 inhibitor |
| PD173952 | LOPAC | src inhibitor |
| sanguinarine | LOPAC | Na/K ATPase |
| tyrphostin AG835 | LOPAC | EGFR |
| (-)-alpha-methylnorepinephrine | LOPAC | sympathomimetic |
| chloroquine | LOPAC | antimalarial |
| M-344 | LOPAC | HDAC inhibitor |
| olmesartan medoxomil | FDA approved | angiotensin II receptor antagonist |
| 1,10-phenanthroline | LOPAC | chelator, MMP |
| 2,3-dimethoxy-1,4-naphthoquinone | LOPAC | ROS |
| amiloride | ICCB | calcium channels |
| fluvastatin | FDA approved | HMG co-A reductase |
| CHM-1 | LOPAC | antimitotic |
| SAHA | LOPAC | HDAC inhibitor |
| nimesulide | LOPAC | COX-2 |
| mibefradil | LOPAC | calcium channels |
| KB-R7493 | LOPAC | sodium calcium exchanger |
| LY165163 | LOPAC | 5-HT receptor antagonist |
| dequalinium | LOPAC | potassium channels |
| AM92016 | ICCB | potassium channels |
| 2-[4-(1,3-benzodioxol-5-yl)−1H-pyrazol-1-yl]-N-(2-ethyl-2H-1,2,3-triazol-4-yl)acetamide | Chembridge | predicted adenosine kinase |
| N-(2-ethyl-2H-1,2,3-triazol-4-yl)−2-{4-[3-(1H-pyrazol-1-yl)phenyl]−1H-pyrazol-1-yl}acetamide | Chembridge | predicted adenosine kinase |
| 2,2,6,6-tetramethyl-N-(1-methyl-3-phenylpropyl)−4-piperidinamine | Chembridge | predicted vitamin D receptor |
| N-[(5-chloro-1H-indol-2-yl)methyl]−2-(3-hydroxyphenyl)acetamide | Chembridge | predicted TK(FLT3) |
| 5-(1H-indol-2-ylcarbonyl)−4,5,6,7-tetrahydrothieno[3,2 c]pyridine | Chembridge | predicted TK(FLT3) |
| 1-acetyl-4-{4-[1-(2-fluorophenyl)−1H-pyrazol-4-yl]pyrimidin-2-yl}−1,4-diazepane | Chembridge | predicted JNK |
| 4-(4-butyl-1H-1,2,3-triazol-1-yl)−1-{[(1S*,4S*)−3,3-dimethyl-2-methylenebicyclo[2.2.1]hept-1-yl]carbonyl}piperi | Chembridge | predicted liver X receptor |
| 1-(3-methylbenzyl)−4-thieno[2,3-d]pyrimidin-4-yl-2-piperazinone | Chembridge | predicted TK(EGFR, PDGFR, CSFR1); PKC; PKA |
| 1-(2-methoxyphenyl)−2,2-dimethyl-4-(4-methylpentanoyl)piperazine | Chembridge | predicted androgen receptor |
| 5,6-dimethyl-2-[4-({methyl[(2-methylpyridin-4-yl)methyl]amino}methyl)phenyl]pyrimidin-4(3 hr)-one | Chembridge | predicted estrogen receptor |
| N-[1-(1,5-dimethyl-1H-pyrazol-4-yl)ethyl]thieno[2,3-d]pyrimidin-4-amine | Chembridge | predicted EGFR |
| N-(1-cyclohexyl-1H-pyrazol-5-yl)−2-[3-(2-thienyl)−1H-pyrazol-1-yl]acetamide | Chembridge | predicted VEGFR2, EGF/KDR |
| 2-[1-(3-isobutyl-1,2,4-oxadiazol-5-yl)−2-methylbutyl]−1-isoindolinone | Chembridge | predicted RAR(gamma) |
| 1-propyl-N-{1-[4-(1H-pyrazol-1-yl)phenyl]piperidin-4-yl}piperidin-4-amine | Chembridge | predicted estrogen receptor |
| 5-[5-methyl-4-(1-methyl-1H-pyrazol-4-yl)pyrimidin-2-yl]−4,5,6,7-tetrahydrothieno[3,2 c]pyridine | Chembridge | predicted TK(VEGFR, KDR, FLK1) |
| 2-[5-(2,6-dimethylphenyl)−1H-indazol-1-yl]-N-(1,3-dimethyl-1H-pyrazol-5-yl)acetamide | Chembridge | predicted TK(PDGFR, EGFR, FGFR) |
Table 2
Primer sequences.
https://doi.org/10.7554/eLife.29145.057| Use | Gene | Forward | Reverse | Reference |
|---|---|---|---|---|
| qPCR | bactin1 | CGAGCAGGAGATGGGAACC | CAACGGAAACGCTCATTGC | (McCurley and Callard, 2008) |
| qPCR | sox10 | ATATCCGCACCTGCACAA | CGTTCAGCAGTCTCCACAG | |
| qPCR | crestin | AGTGCCTGCCAATGTTCAC | CTGAAAAAGGCCGATGAGTT | |
| qPCR | foxd3 | CATGCAAAACAAGCCCAAG | ATGAGGGCGATGTACGAGTAG | |
| qPCR | mitfa | GGCGGTTTAATATCAATGACAGA | GGTGCCTTTATTCCACCTCA | |
| qPCR | neurog1 | CGTGCCATTATCTTCAACACA | CGATCTCCATTGTTGATAACCTT | |
| qPCR | myf5 | GCTACAACTTTGACGCACAAAA | CACGATGCTGGACAAACACT | |
| qPCR | runx1 | CGTCTTCACAAACCCTCCTCAA | GCTTTACTGCTTCATCCGGCT | |
| ISH | tfap2a | TAATACGACTCACTATAGGGAATCT TCACAGATGTTAGTGCACAGTTTTTCCGCGAT | AATTAACCCTCACTAAAGGTCAC TTTCTGTGCTTCTCATCTT | |
| ISH | tfap2c | TAATACGACTCACTATAGGGACAG AAACAACATGTTGTGGAAATTAGCAGATAA | AATTAACCCTCACTAAAGGTCA CTTTCGGTGTTTGTCCATCTT | |
| ISH | inka1a | AATTAACCCTCACTAAAGGG GAATCGGGTGACTGTCTGC | TAATACGACTCACTATAGGGATGG GTGTTCTGCTCCCAG | |
| ISH | dlx2a | AATTAACCCTCACTAAAGGACAA CAGCATGAACAGCGTC | TAATACGACTCACTATAGGGACAGGC GCATGAAACACAT | |
| ISH | pax7a | AATTAACCCTCACTAAAGGAGAA CTACCCACGAACCGGA | TAATACGACTCACTATAGGTTGATC TGTGAAGCGTGCTG | |
| ISH | myca | TAATACGACTCACTATAGGGCAAG TGTCAAAATGCCGGTGAGTGCGAGTTTGGCGT | AATTAACCCTCACTAAAGGTTAATGTG AACTCCGCAGCTGCTGAA | |
| ISH | ets1 | TAATACGACTCACTATAGGGTGTA CGTTTGAATGCGTGACCATGACGGCAGCTGT | AATTAACCCTCACTAAAGGTCAGGAGC TCCAACAGGAACTGCCAGA | |
| ISH | nr2f2 | TAATACGACTCACTATAGGGTAGATATGGC AATGGTAGTGTGGAGAGGCTCCCA | AATTAACCCTCACTAAAGGCTACTGAAT CGACATATAAGGCCAGTT | |
| ISH | msx1b | TAATACGACTCACTATAGGGGATGGTTAA CGATGAATTCTCCTAAGGGACCCGTT | AATTAACCCTCACTAAAGGTTAAGAC AAATAATACATCCCATA | |
| ISH | dlx5a | TAATACGACTCACTATAGGGTTATCCAA ACTATGACTGGAGTATTCGACAGAAGGA | AATTAACCCTCACTAAAGGTCAGTACAAC GTTCCTGATCCGAGTGCCAA | |
Additional files
-
Transparent reporting form
- https://doi.org/10.7554/eLife.29145.058
Download links
A two-part list of links to download the article, or parts of the article, in various formats.
Downloads (link to download the article as PDF)
Open citations (links to open the citations from this article in various online reference manager services)
Cite this article (links to download the citations from this article in formats compatible with various reference manager tools)
A chemical screen in zebrafish embryonic cells establishes that Akt activation is required for neural crest development
eLife 6:e29145.
https://doi.org/10.7554/eLife.29145


