Major transcriptional changes observed in the Fulani, an ethnic group less susceptible to malaria
- Stockholm University, Sweden
- Centre National de Recherche et de Formation sur le Paludisme, Burkina Faso
- Université Polytechnique de Bobo-Dioulasso, Burkina Faso
- Karolinska Institute, Sweden
- Central European Institute of Technology, Czech Republic
Figures
Figure 1 with 1 supplement
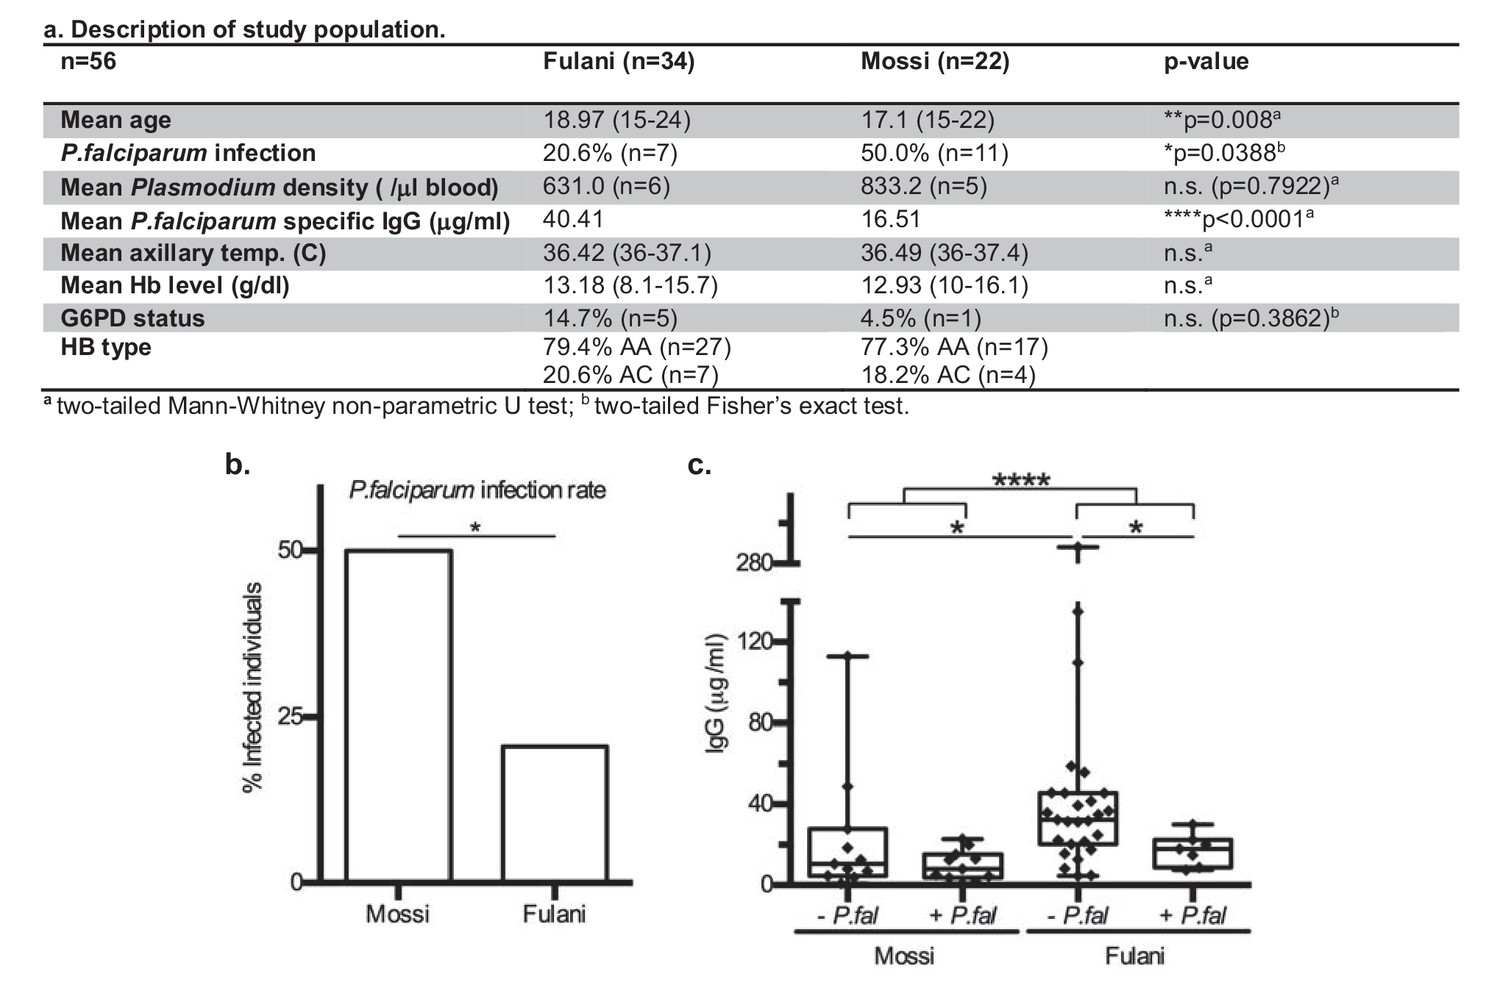
Characteristics of P.falciparum infection in Mossi and Fulani.
(a) Table describing study population. (b) Rate of infection with P.falciparum (Mossi n = 11/22 and Fulani n = 7/34, *p=0.0388). (c) Plasma levels of IgG antibodies to P.falciparum schizont extract antigens. Uninfected (- P.fal) and Infected (+P.fal). n = 11 Mossi – P.falw, 11 Mossi +P.falx, 27 Fulani – P.faly, 7 Fulani +P.falz (median ±min to max; w vs x n.s. p=0.4385, y vs z *p=0.0189, w vs y *p=0.0141, x vs z n.s. p=0.0693, w and x vs y and z ****p<0.001).
Figure 1—figure supplement 1
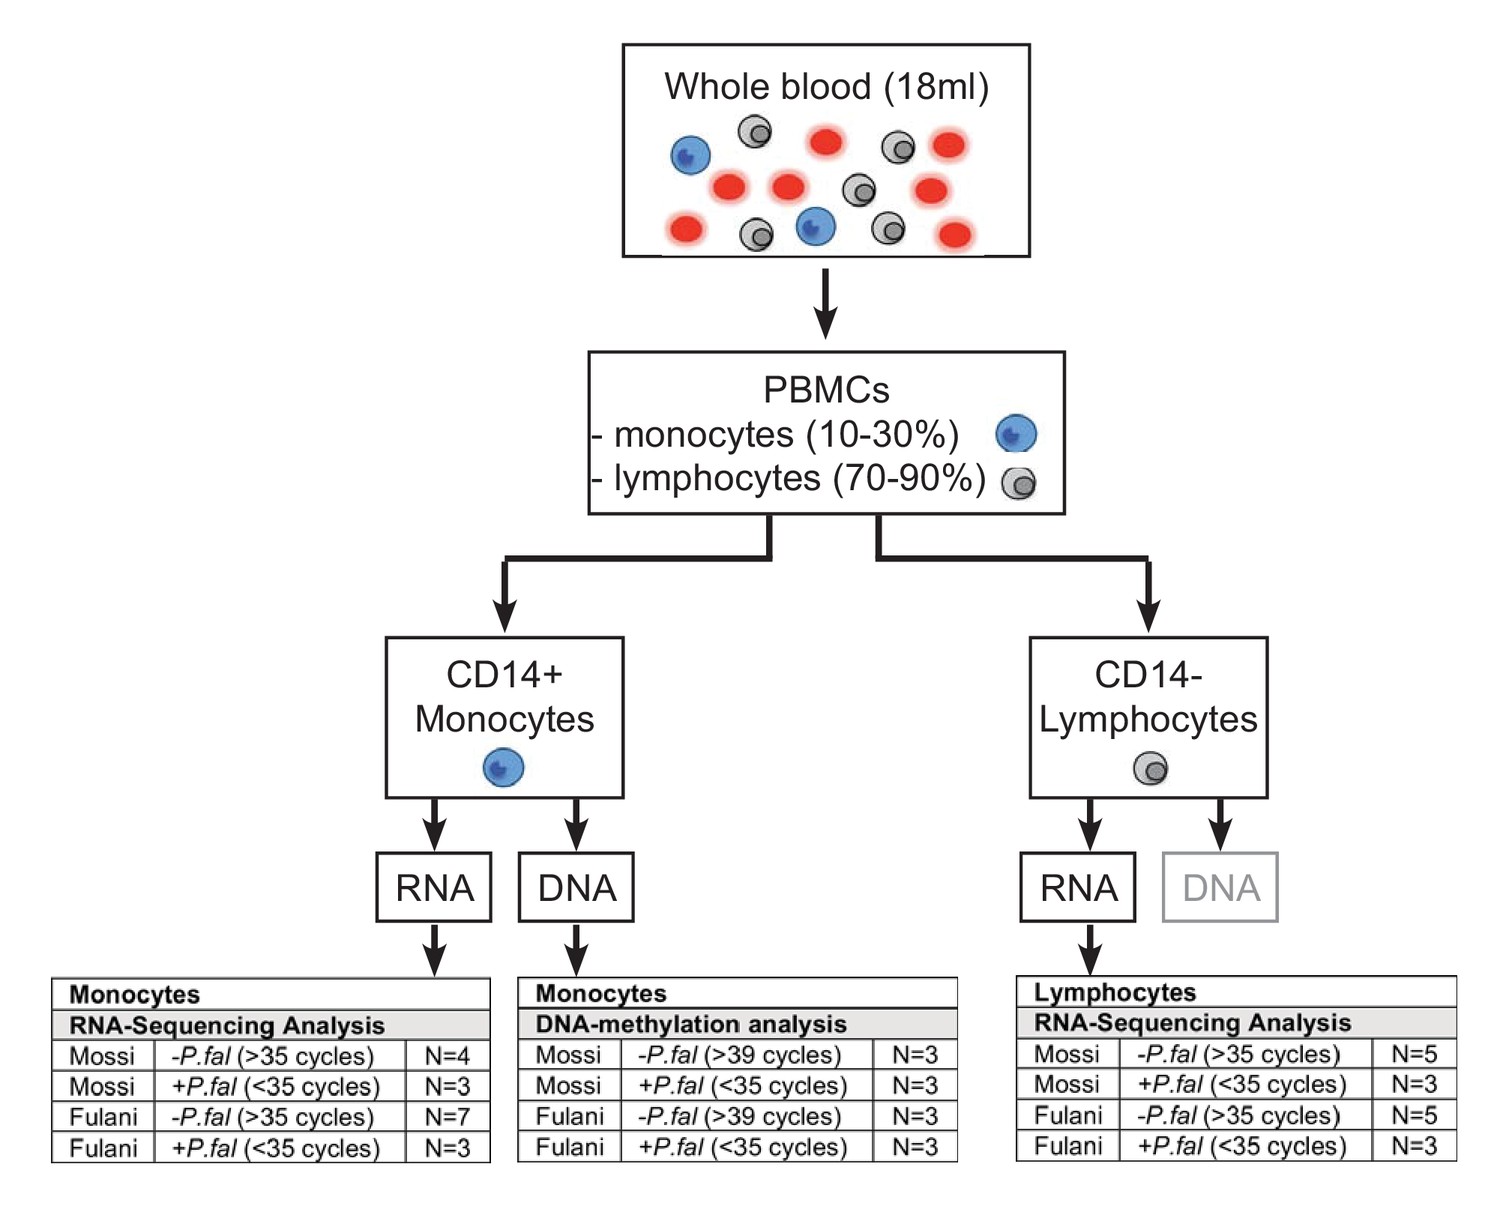
Schematic representation of workflow.
https://doi.org/10.7554/eLife.29156.004
Figure 2 with 2 supplements
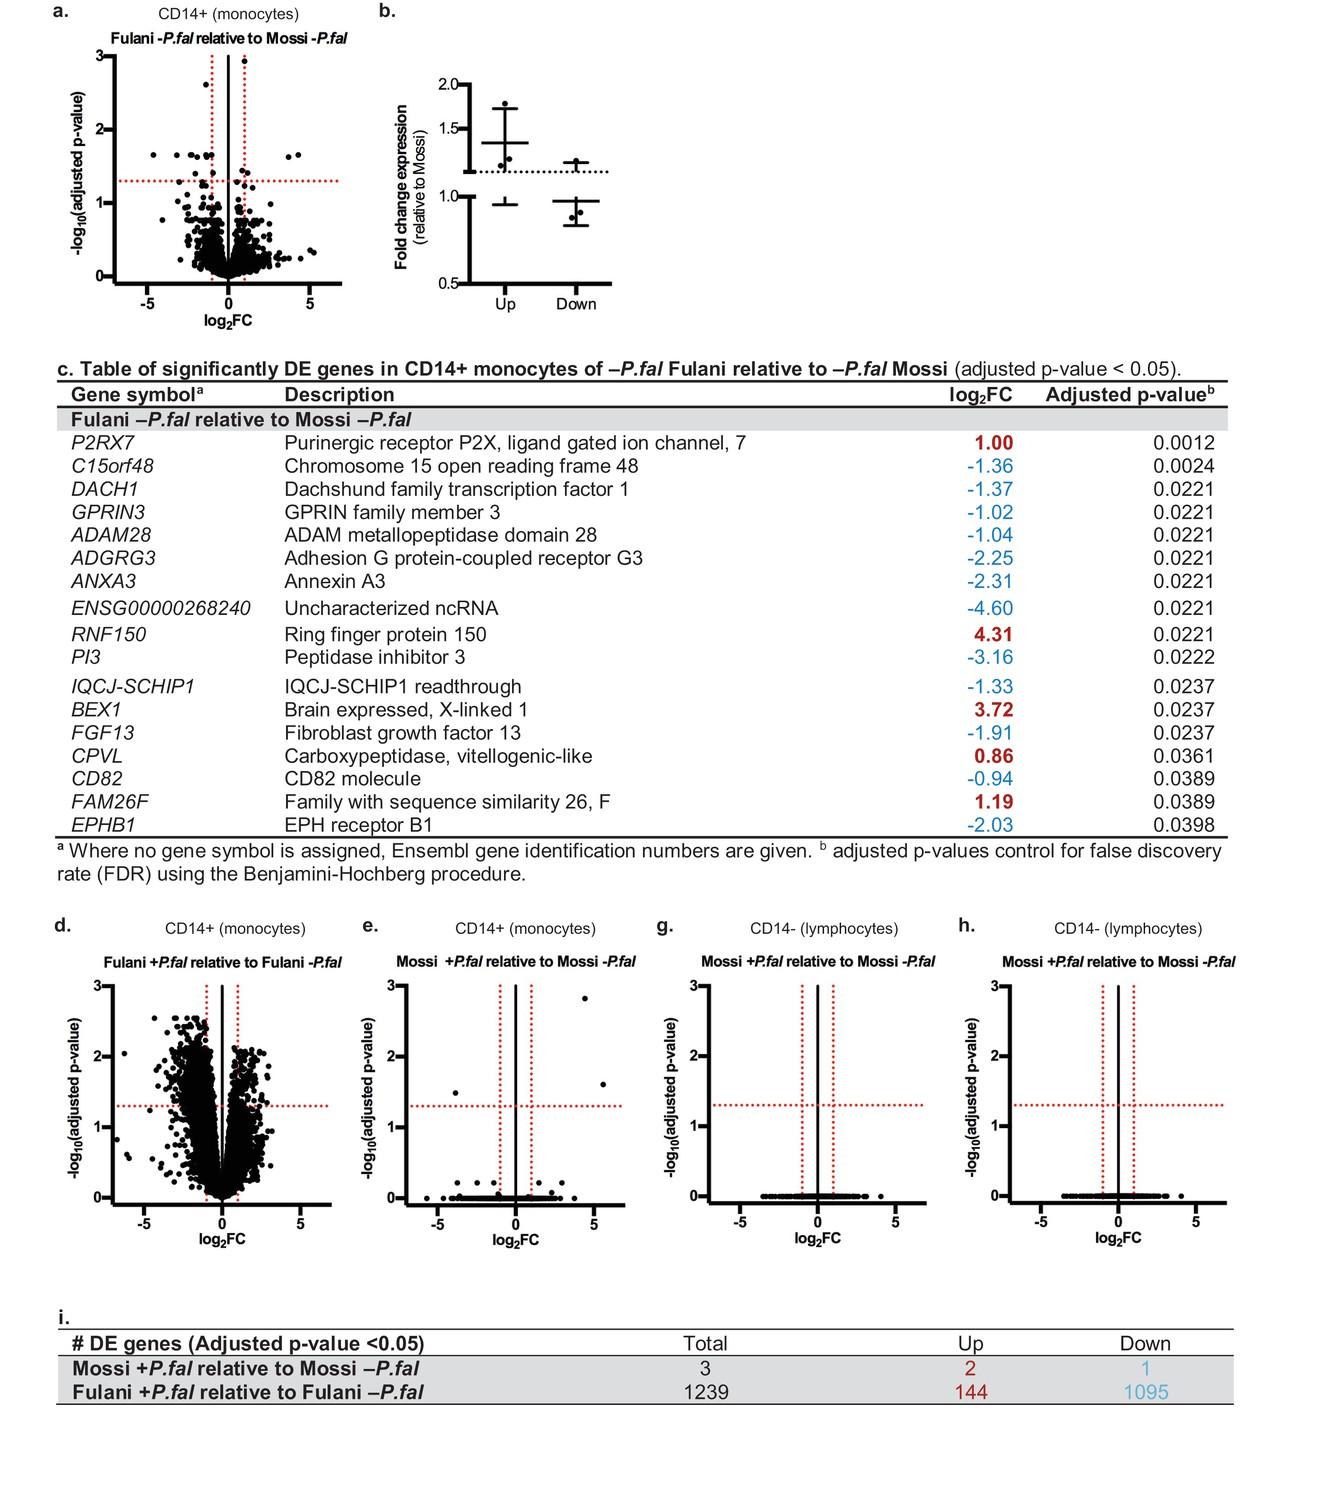
Differential gene expression in Mossi and Fulani following P.falciparum infection.
(a) Volcano plot of expression of individual genes in CD14+ cells (monocytes) of Fulani –P.fal (n = 7) relative to Mossi –P.fal (n = 4). (b) qRT-PCR analysis of selected DE genes (Up: P2RX7, CPVL, FAM26F. Down: ADAM28, ADGRG3, EPBH1) in validation cohort Mossi –P.fal (n = 4) and Fulani –P.fal (n = 10) (mean ±SD). (c) Table of significantly DE genes in CD14+ cells (monocytes) of Fulani –P.fal (n = 7) relative to Mossi –P.fal (n = 4). (d,e) Volcano plot of expression of individual genes in CD14+ cells (monocytes) of Fulani +P.fal (n = 2) relative to Fulani -P.fal (n = 7) (d), and Mossi +P.fal (n = 3) relative to Mossi -P.fal (n = 4) (e). (f) Table of number of DE genes in CD14+ cells (monocytes) of Mossi +P.fal relative to Mossi –P.fal and Fulani +P.fal relative to Fulani –P.fal. (g,h) Volcano plot of expression of individual genes in CD14- cells (lymphocytes) of Fulani +P.fal (n = 3) relative to Fulani -P.fal (n = 5) (g), and Mossi +P.fal (n = 3) relative to Mossi –P.fal (n = 5) (h).
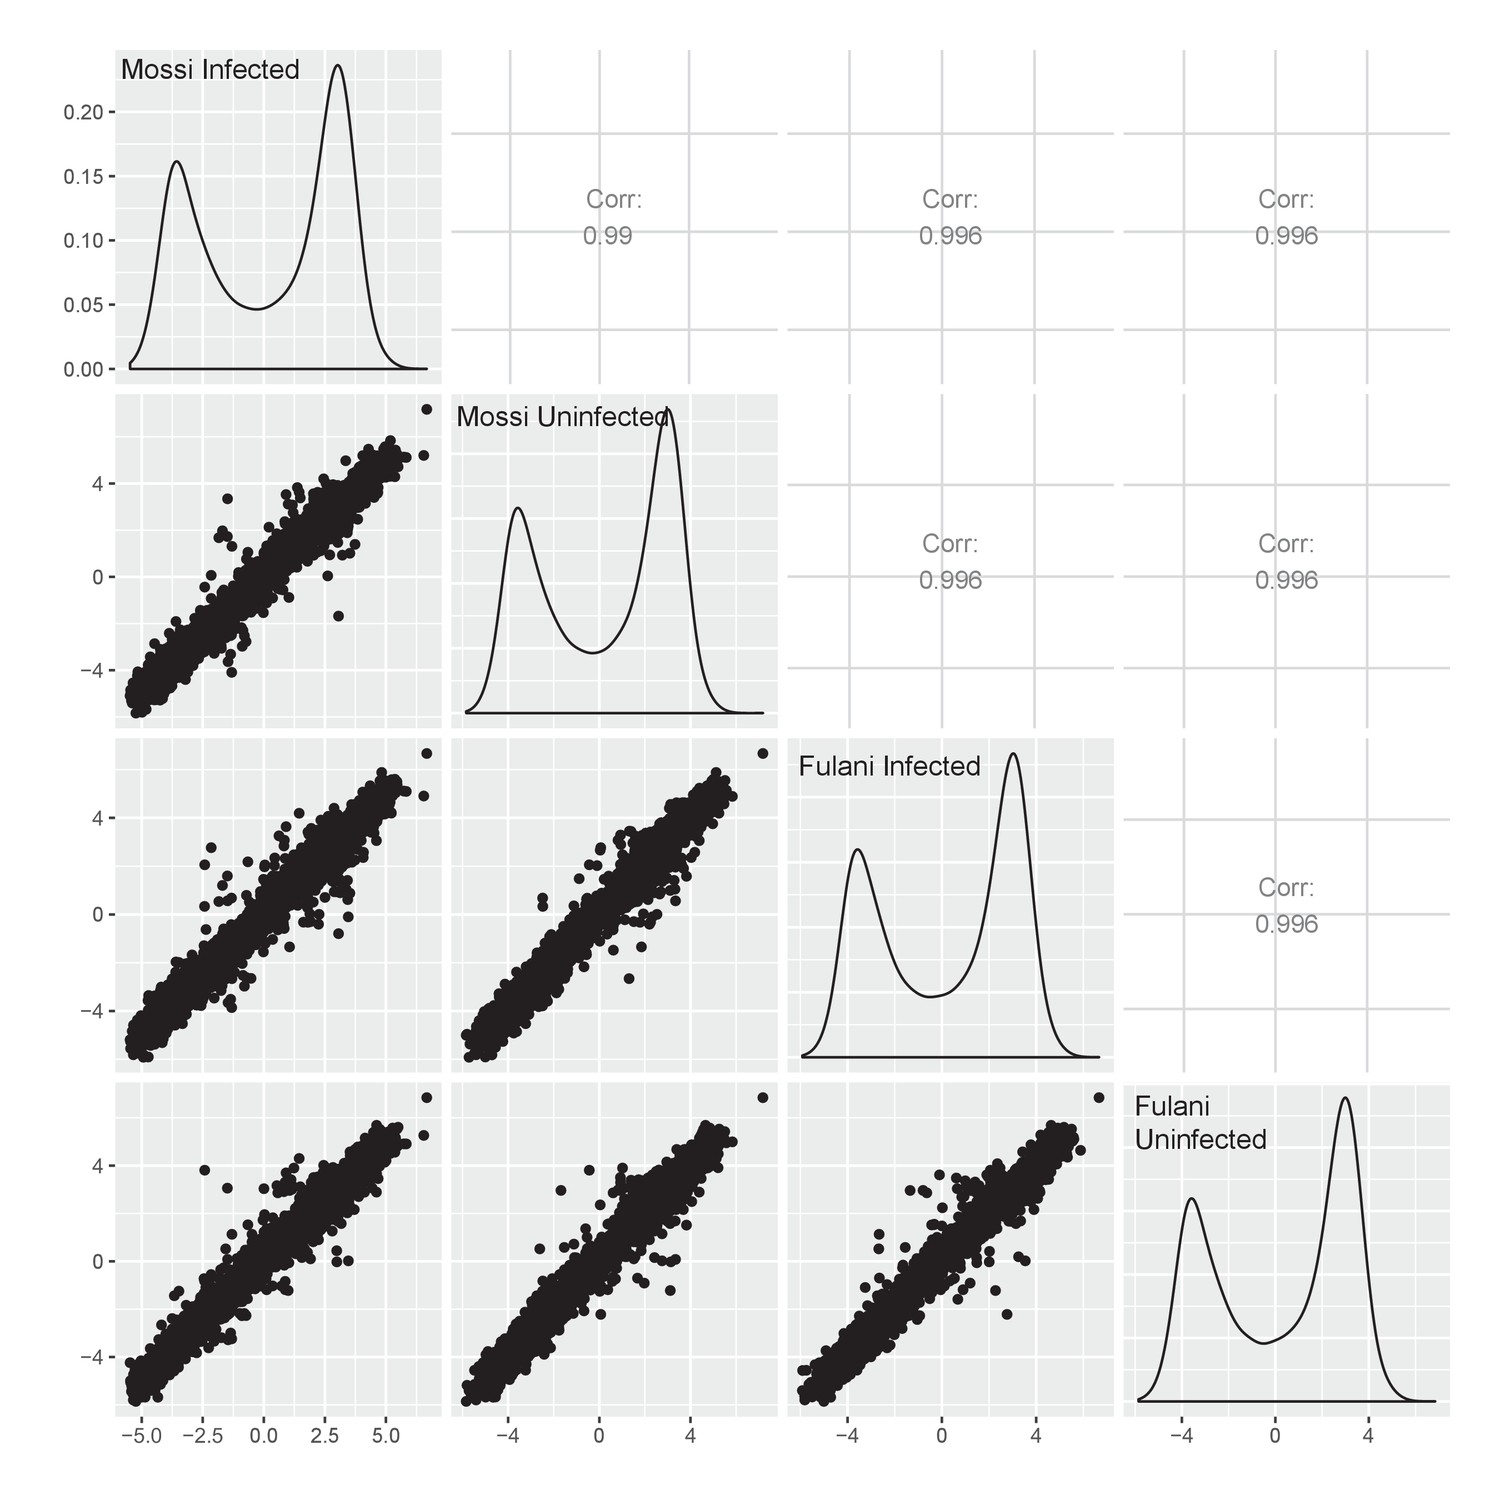
Figure 2—figure supplement 1
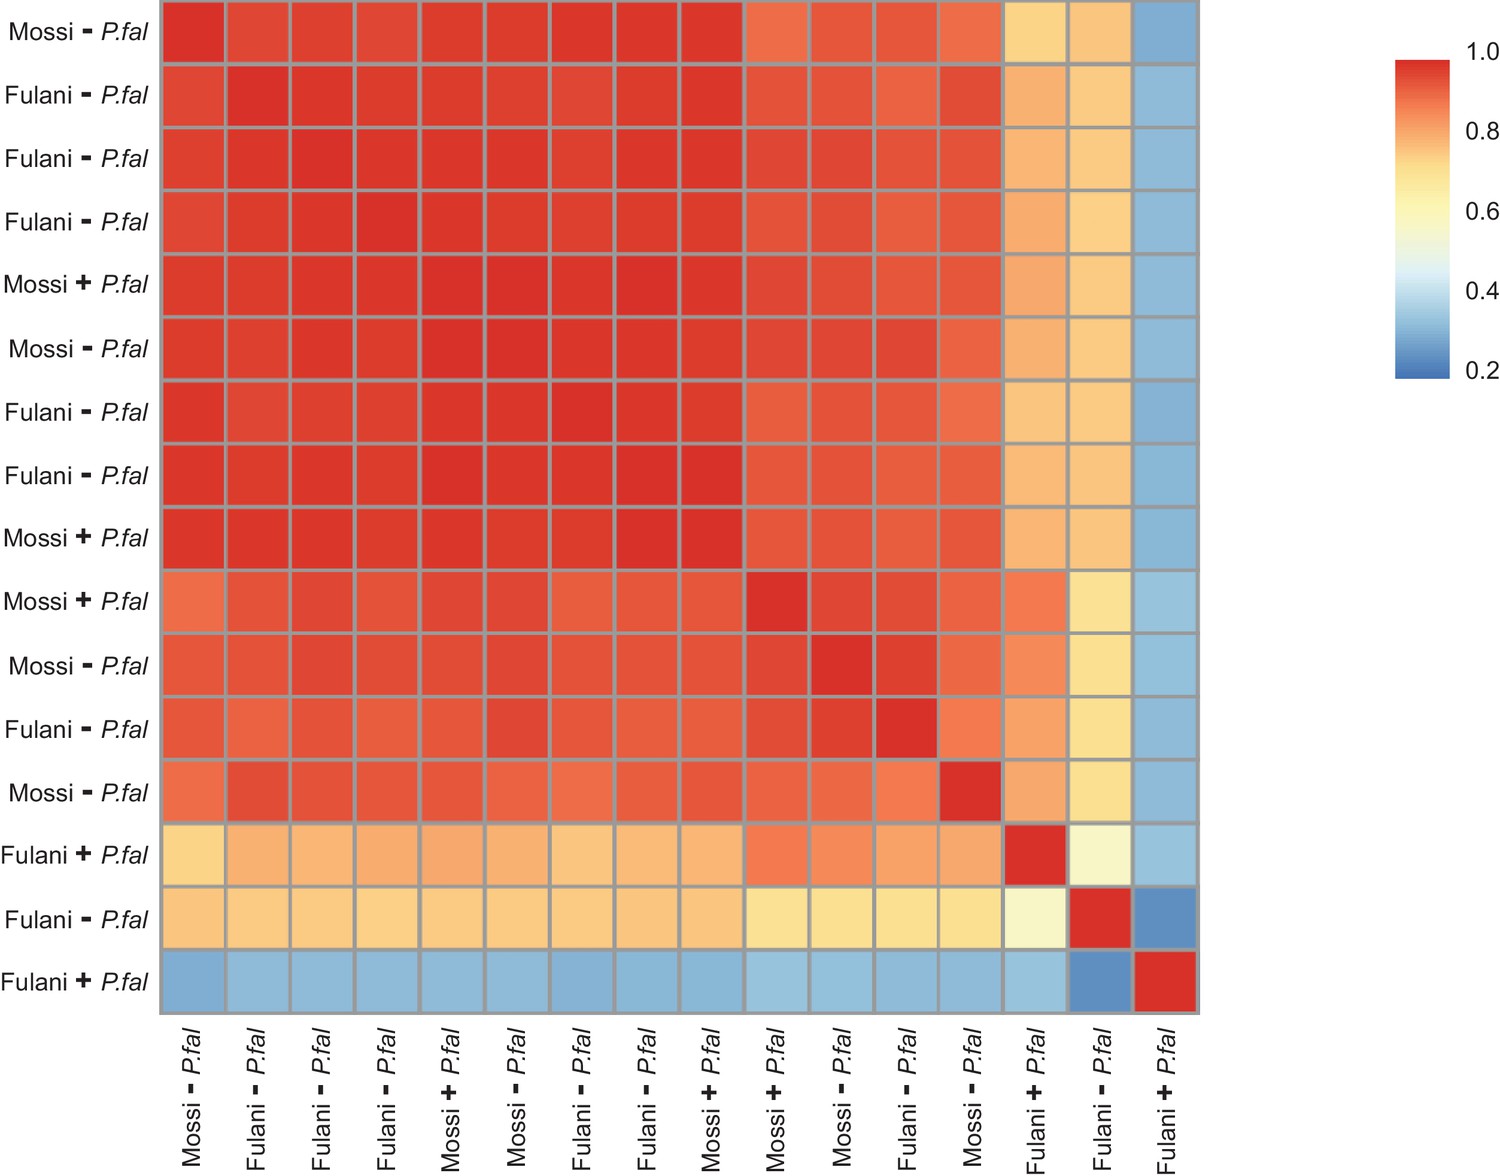
Heat map of Pearson correlation between FPKM (fragments per kilobase of transcript per million mapped reads) values of for all CD14+ (monocytes) samples.
Mossi –P.fal (n = 4), Mossi +P.fal (n = 3), Fulani –P.fal (n = 7), Fulani + P.fal (n = 2).
Figure 2—figure supplement 2
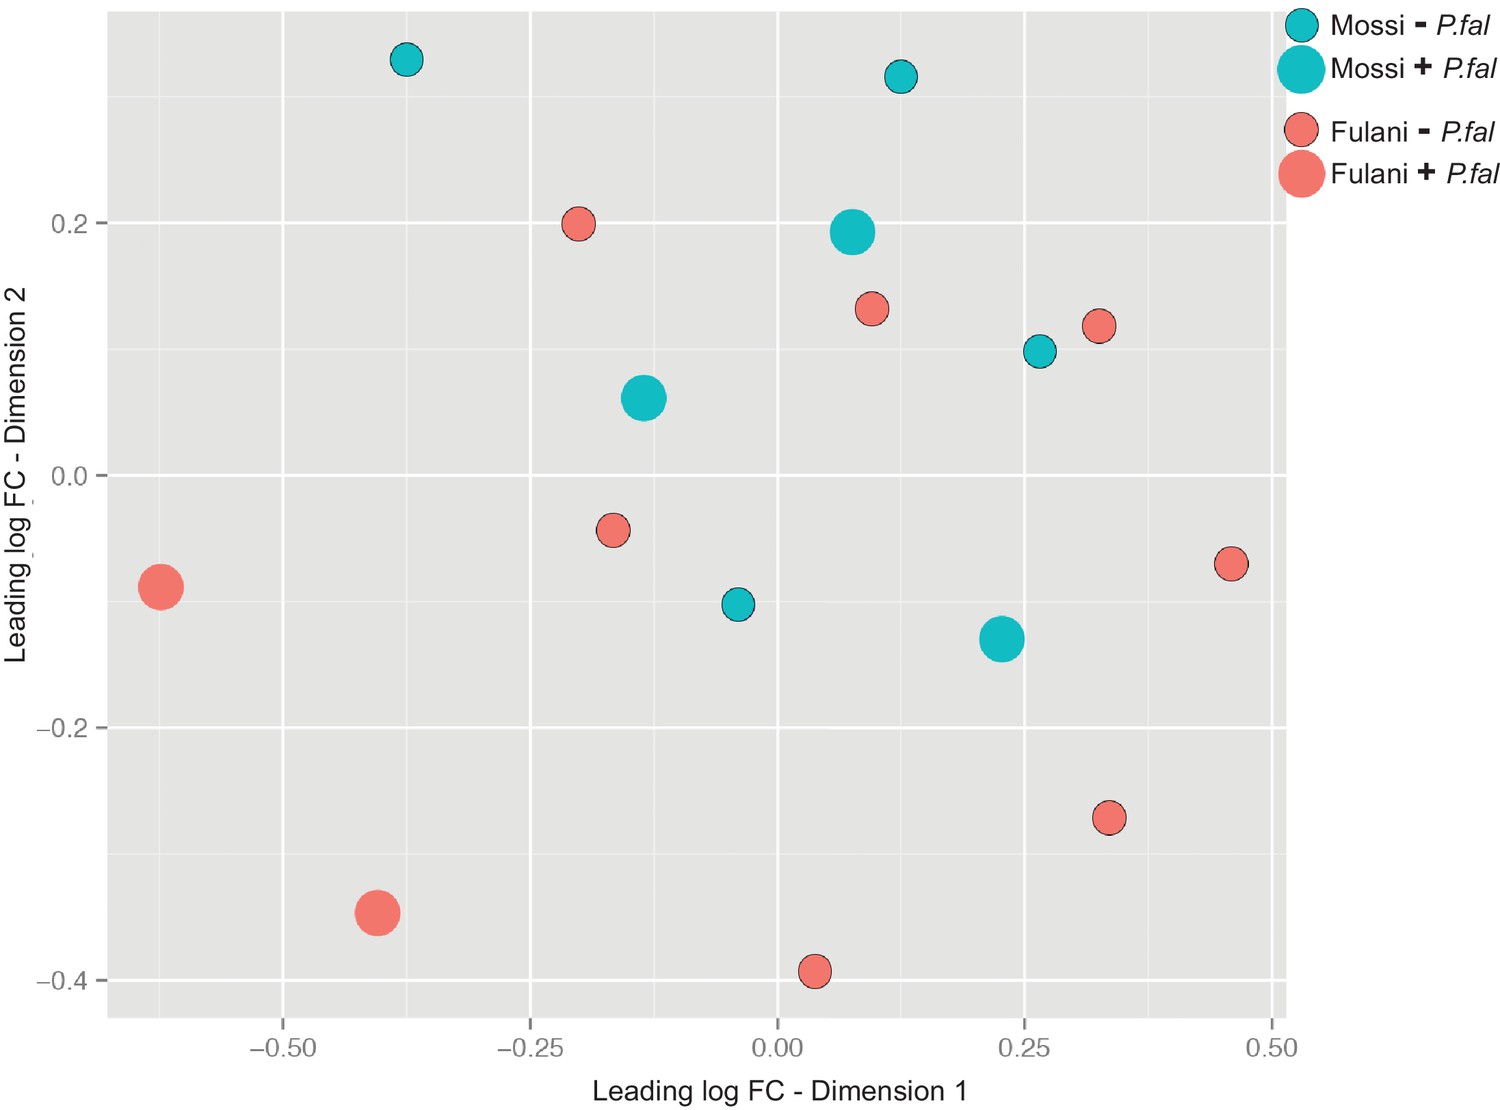
Multidimension scaling for all CD14+ (monocytes) samples.
Mossi –P.fal (n = 4), Mossi +P.fal (n = 3), Fulani –P.fal (n = 7), Fulani + P.fal (n = 2).
Figure 3 with 2 supplements
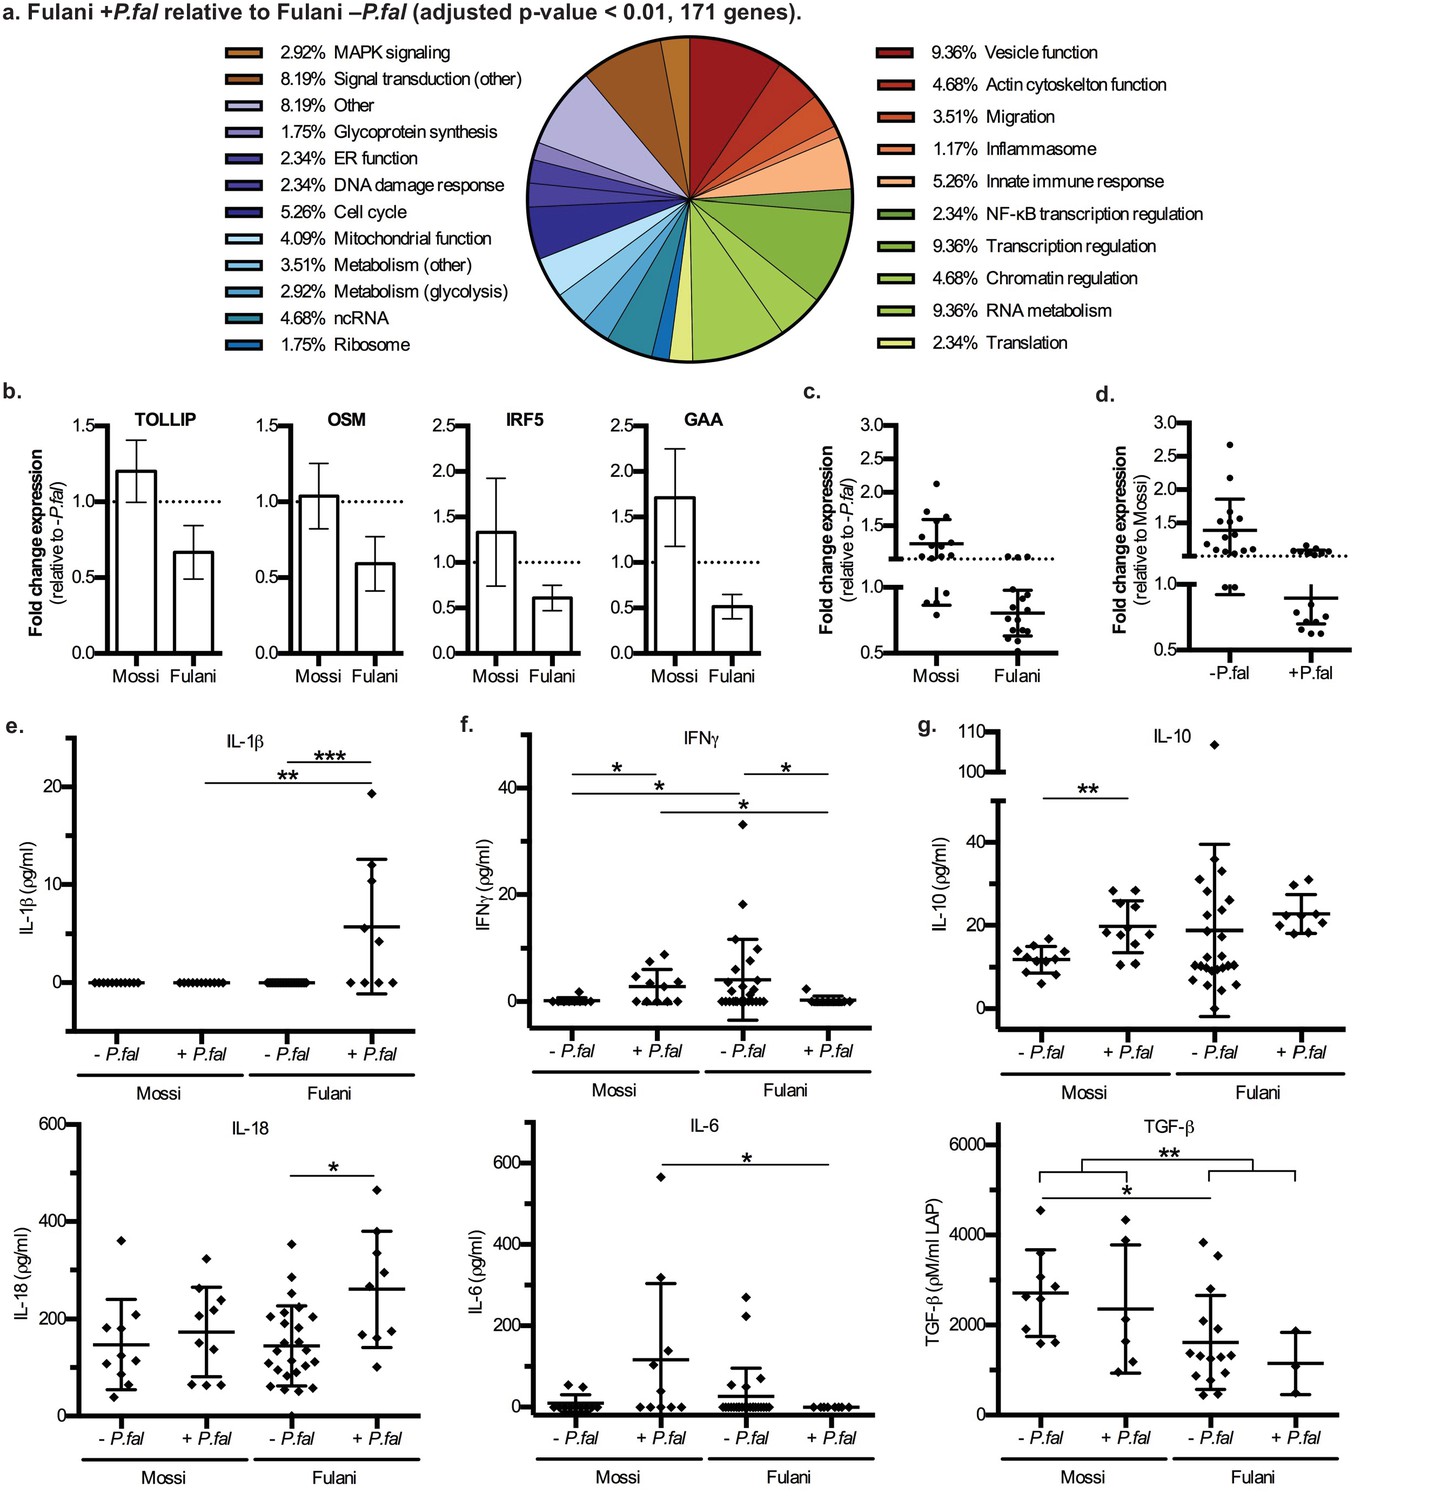
Characteristics and validation of significantly DE genes in CD14+ cells (monocytes) of Fulani+P.fal relative to Fulani -P.fal.
(a) Classification of the most significantly DE genes in CD14+ cells (monocytes) of Fulani +P.fal relative to Fulani –P.fal (adjusted p-value<0.01, 171 genes). (b,c,d) qRT-PCR analysis of selected DE genes, with individual genes relative to –P.fal individuals (b), and combined genes relative to –P.fal (c) or Mossi (d) individuals (Genes: ALDOA, ARID3A, DUSP8, FES, FURIN, GAA, GAPDH, IRF3, IRF5, NFKBIE, OSM, RFXANK, SQSTM1, STRA13, TOLLIP, TRAF7), in validation cohort of Mossi –P.fal (n = 4), Fulani –P.fal (n = 10), Mossi +P.fal (n = 8) and Fulani + P.fal (n = 5) (mean ±SD) (Also see Figure 3—source data 1). (e,f,g) Cytokine levels in blood plasma of Mossi and Fulani individuals following P.falciparum infection. Uninfected (-P.fal) and Infected (+P.fal). n = 11 Mossi –P.falw, 11 Mossi +P.falx, 25 Fulani –P.faly, 9 Fulani + P.falz(e) Inflammasome cytokines IL-1β (mean ±SD; w vs x n.s. p>0.9999, y vs z ***p=0.0005, w vs y n.s. p=0.9285, x vs z **p=0.0081) and IL-18 (mean ±SD; w vs x n.s. p=0.4813, y vs z *p=0.0106, w vs y n.s. p>0.9999, x vs z n.s p=0.0947). (f) Pro-inflammatory cytokines IFNγ (mean ±SD; w vs x *p=0.0456, y vs z *p=0.0343, w vs y *p=0.0409, x vs z *p=0.0243) and IL-6 (mean ±SD; w vs x n.s. p=0.0862, y vs z n.s. p=0.3023, w vs y n.s. p=0.7166, x vs z *p=0.0359) (g) TGFβ (mean ±SD; w vs x n.s. p=0.5287, y vs z n.s. p=0.5735, w vs y *p=0.0122, x vs z n.s. p=0.2619, w and x vs y and z **p=0.0059) and IL-10 (mean ±SD; w vs x **p=0.032, y vs z n.s. p=0.0659, w vs y n.s. p=0.7154, x vs z n.s. p=0.2014)
-
Figure 3—source data 1
qRT-PCR analysis of selected DE genes in monocytes of validation cohort of Mossi –P.fal (n = 4), Fulani –P.fal (n = 10), Mossi +P.fal (n = 8) and Fulani +P.fal (n = 5) (mean ±SD).
- https://doi.org/10.7554/eLife.29156.011
Figure 3—figure supplement 1
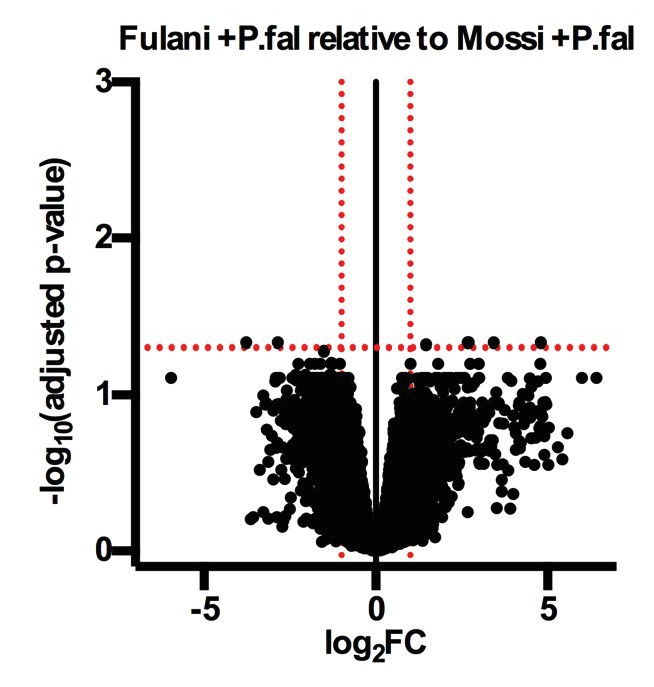
Volcano plot of expression of individual genes in Fulani +P.fal (n = 2) relative to Mossi +P.fal (n = 3) CD14 +PBMCs (monocytes).
https://doi.org/10.7554/eLife.29156.009
Figure 3—figure supplement 2
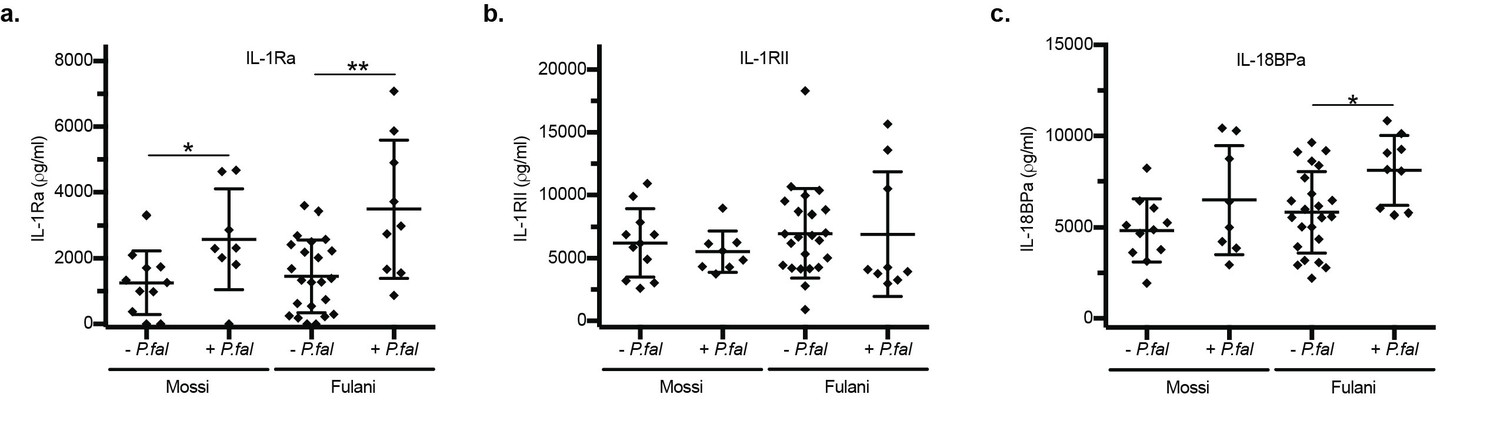
ELISA of blood plasma in Mossi and Fulani individuals following P.falciparum infection.
Uninfected (-P.fal) and Infected (+P.fal). (n = 11 Mossi –P.falw, 8 Mossi +P.falx, 23 Fulani –P.faly, 9 Fulani +P.falz.) a. IL-1Ra (mean ±SD; w vs x *p=0.0257, y vs z **p=0.0048, w vs y n.s. p=0.5673, x vs z n.s. p=0.4807). b. IL-1RII (mean ±SD; w vs x n.s. p=0.5305, y vs z *p=0.0149, w vs y n.s. p=0.6179, x vs z n.s. p=0.4807). c. IL-18BPa (mean ±SD; w vs x n.s. p=0.3100, y vs z *p=0.0149, w vs y n.s. p=0.2038, x vs z n.s. p=0.2766).
Figure 4 with 1 supplement
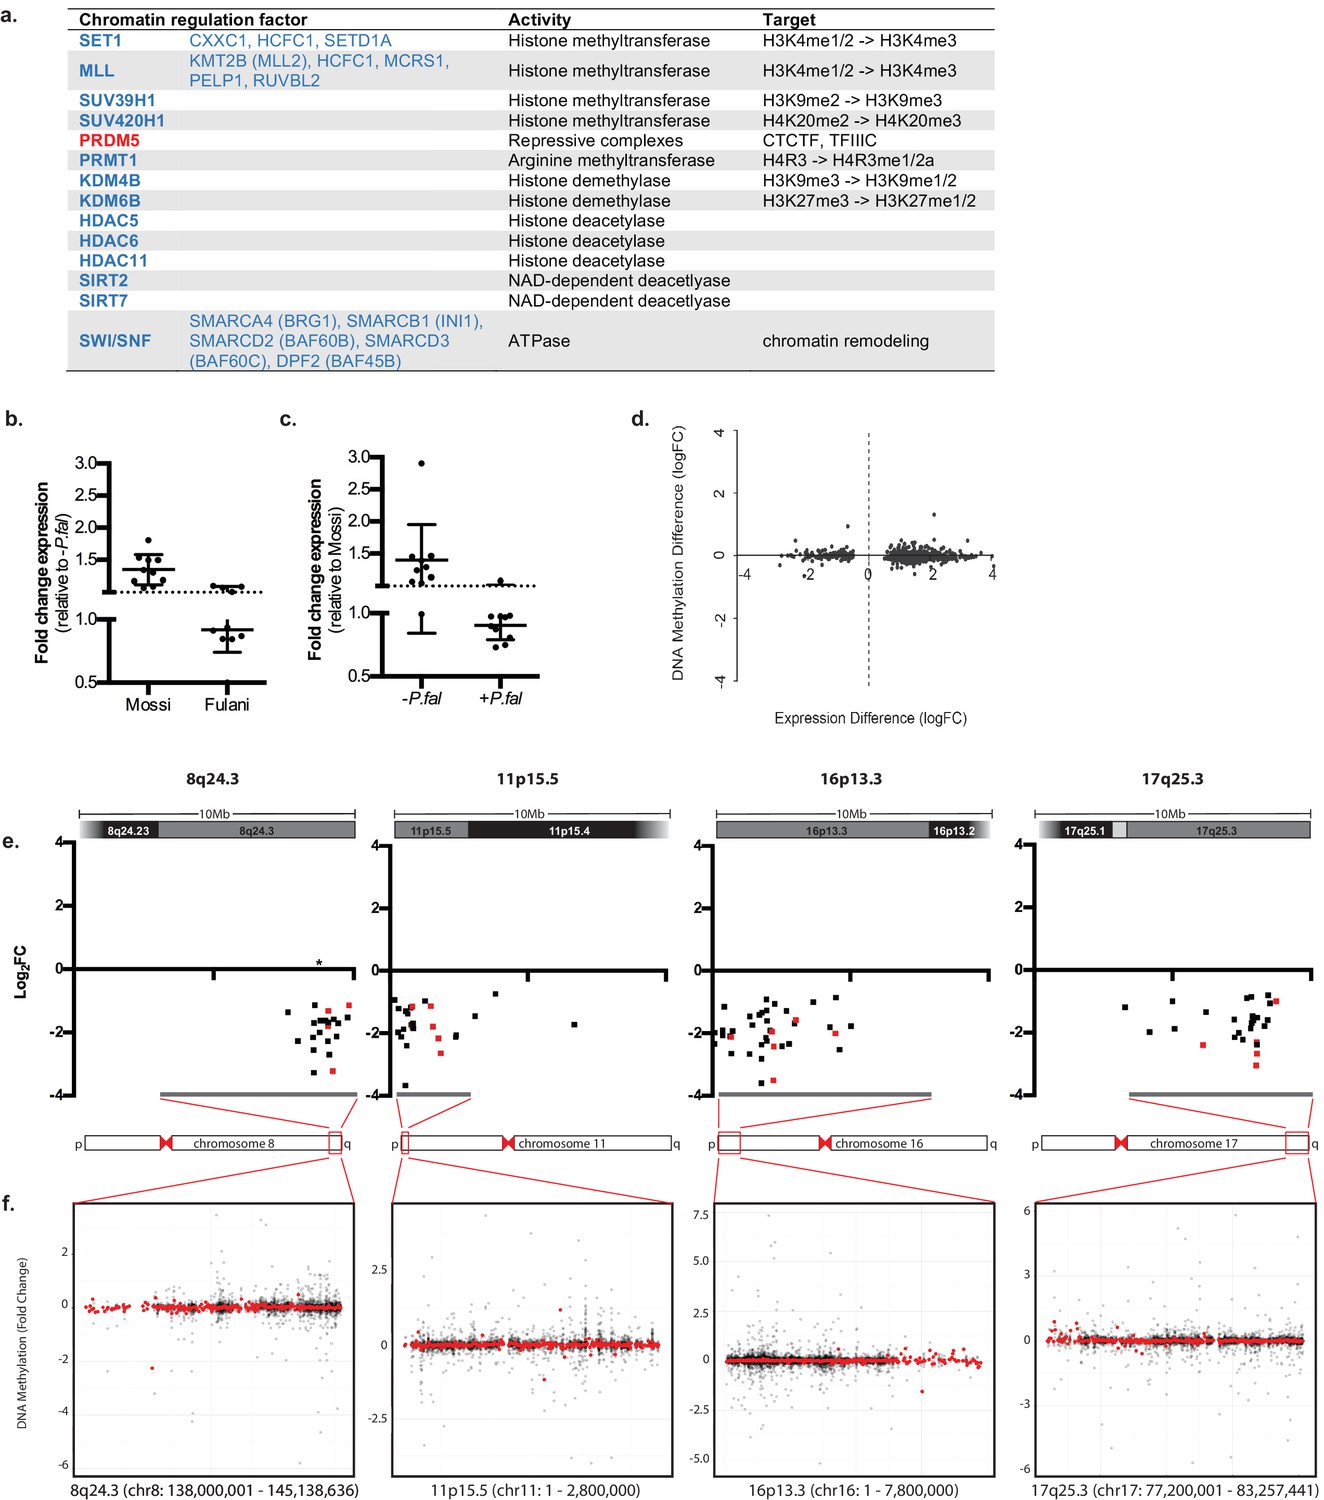
Regulation of chromatin in Mossi and Fulani monocytes.
(a) Table of selected DE chromatin regulation factors. (b and c) qRT-PCR analysis of selected DE chromatin regulation genes (Genes: SETD1A, CXXC1, KDM4B, KDM6B, BRG1, RUVBL2, SUV39H1, SIRT7, PHC2, PPP4C) in validation cohort of Mossi -P.fal (n = 4), Fulani -P.fal (n = 10), Mossi +P.fal (n = 8) and Fulani +P.fal (n = 5) relative to –P.fal (b) and Mossi (c) individuals (mean ±SD). (Also see Figure 4—source data 1). (d) Difference in DNA methylation at DE genes (Fulani +P.fal (n = 3) relative to Fulani –P.fal (n = 3)). (e and f) Examples of clusters of DE genes. (e) Change in expression of all significantly DE genes, in selected regions that include cytobands enriched in DE genes (Fulani +P.fal relative to Fulani –P.fal, adjusted p-valued < 0.05). Genes indicated in red are also DE in Fulani +P.fal relative to Mossi +P.fal (FDR < 0.1). * Indicates location of uncharacterised loci associated with resistance to severe P.falciparum malaria. (f) Difference in DNA methylation in selected regions that include cytobands enriched in DE genes (Fulani +P.fal relative to Fulani –P.fal, adjusted p-valued < 0.05), showing individual probes (black) and binned values (300 probes; red).
-
Figure 4—source data 1
qRT-PCR analysis of selected DE chromatin regulation genes in monocytes of validation cohort of Mossi –P.fal (n = 4), Fulani –P.fal (n = 10), Mossi +P.fal (n = 8) and Fulani +P.fal (n = 5) (mean ±SD).
- https://doi.org/10.7554/eLife.29156.014
Figure 4—figure supplement 1
Difference in DNA methylation at between Mossi –P.fal (n = 3), Mossi +P.fal (n = 3), Fulani –P.fal (n = 3), and Fulani +P.fal (n = 3).
https://doi.org/10.7554/eLife.29156.013Tables
Table 1
Primer sequences used for QRT-PCR analysis
https://doi.org/10.7554/eLife.29156.015| Gene | F | R |
|---|---|---|
| ADGRG3 | CGAAGGGCCAAGAAACACCT | CGTAGTTTAGCCAGTATCTCTGC |
| ALDOA | ATGCCCTACCAATATCCAGCA | GCTCCCAGTGGACTCATCTG |
| ARID3A | AGCTGCAGCCGCCTGACCAC | TGTTGGGAGCAGAGGTTGGC |
| BRG1 (SMARCA4) | AGGCAAAATCCAGAAGCTGA | CGCTTGTCCTTCTTCTGGTC |
| CATSPER2 | ATGGCCGCTTACCAACAAGAA | TGCAAATGCTCAATGAGAGAGAA |
| CPVL | TGGAAGGTGATTGTTTCGCTG | GTCTCCCTTAGGTGGCATGGA |
| CXXC1 | GCAAACCGGACATCAACTGC | GCACTCCCGACAGTACCAC |
| DACH1 | GGGGCTTGCATACGGTCTAC | CGAACTTGTTCCACATTGCACA |
| DUSP8 | CGAACTTGTTCCACATTGCACA | CGAACTTGTTCCACATTGCACA |
| EPBH1 | GGCTGCGATGGAAGAAACG | CTGGTTGGGCTCGAAGACATT |
| FAM26F | TGTCACCCGATGCCTATCTC | TGGCCCTTCGGATTGAAAGTA |
| FES | GGCCGAGCTTCGTCTACTG | GTCCTGCATACTCCCTGTCAC |
| FURIN | CCTGGTTGCTATGGGTGGTAG | AAGTGGTAATAGTCCCCGAAGA |
| GAA | CATCCTACTCCATGATTTCCTGC | AGCTGGGTGAGTCTCCTCC |
| GAPDH | TGCACCACCAACTGCTTAGC | GGCATGGACTGTGGTCATGAG |
| IRF3 | IRF3 Set #VHPS-4629 purchased from Realtimeprimers.com | |
| IRF5 | IRF5 Set #6 purchased from Realtimeprimers.com | |
| KDM4B | KDM4B Set #6 purchased from Realtimeprimers.com | |
| KDM6B | KDM6B Set #1 purchased from Realtimeprimers.com | |
| NFKBIE | TCTGGCATTGAGTCTCTGCG | AGGAGCCATAGGTGGAATCAG |
| OSM | CACAGACTGGCCGACTTAGAG | AGTCCTCGATGTTCAGCCCA |
| P2R × 7 | CTCCCATCTCAACTCCCTGA | TCCTGGTAGAGCAGGAGGAA |
| PHC2 | AGGGAACGGAAACTCTGCCT | TCGATAACATGCGTCAGGATTTG |
| PP1A | AGACAAGGTCCCAAAGAC | ACCACCCTGACACATAAA |
| PPP4C | AAGGTTCGCTATCCTGATCGC | AGCCATAGACCTGCGTGATCT |
| RFXANK | GTGACAACCTCGTCAACAAGC | CGAACGGTCTCAATCTCTCCAA |
| RUVBL2 | RUVBL2 Set #1 purchased from Realtimeprimers.com | |
| SETD1A | SETD1A Set #1 purchased from Realtimeprimers.com | |
| SIRT7 | GTGGACACTGCTTCAGAAG | CACAGTTCTGAGACACCACA |
| SQSTM1 | GCACCCCAATGTGATCTGC | CGCTACACAAGTCGTAGTCTGG |
| STRA13 | CCTCCTGGCCACATTCCTG | GATTTATTGATGTTGCTTTGTGAGAA |
| SUV39H1 | SUC39H1 Set #2 purchased from Realtimeprimers.com | |
| TOLLIP | AGA ATC CCC GCT GGA ATA AG | GCG TAG GAC ATG ACG AGG TT |
| TRAF7 | TCTGCGCTCCACATTCTCAC | ACCGCGATGTTGTTCACCA |
Additional files
-
Supplementary file 1
(A) Significantly differentially DNA methylated genes in monocytes of Fulani -P.fal relative to Mossi –P.fal. (B) Significantly differentially DNA methylated genes in monocytes of Fulani +P.fal relative to Fulani –P.fal.
- https://doi.org/10.7554/eLife.29156.016
-
Supplementary file 2
(A) List of all significantly DE genes in monocytes for all comparisons (adjusted p-value<0.05, shown in red). Where gene symbol is listed in red, gene is not significantly DE in Fulani +P.fal relative to Fulani –P.fal. (B) List of significantly DE genes in monocytes of Fulani +P.fal relative to Fulani –P.fal (adjusted p-value<0.05). (C) List of significantly DE genes in monocytes of Mossi +P.fal relative to Mossi –P.fal (adjusted p-value<0.05). (D) List of significantly DE genes in monocytes of Fulani +P.fal relative to Mossi +P.fal (adjusted p-value<0.05). (E) List of inflammasome related significantly DE genes in monocytes of Fulani + P.fal relative to Fulani –P.fal (adjusted p-value<0.05). (F) List of transcription factor binding sites enriched at significantly DE genes in monocytes of Fulani +P.fal relative to Fulani –P.fal. (G) qRT-PCR analysis of selected DE genes in Fulani cohort for RNA-sequencing analysis. Fulani –P.fal (n=7) and Fulani +P.fal (n=3) (mean ± SD).
- https://doi.org/10.7554/eLife.29156.017
-
Transparent reporting form
- https://doi.org/10.7554/eLife.29156.018
Download links
A two-part list of links to download the article, or parts of the article, in various formats.
Downloads (link to download the article as PDF)
Open citations (links to open the citations from this article in various online reference manager services)
Cite this article (links to download the citations from this article in formats compatible with various reference manager tools)
Major transcriptional changes observed in the Fulani, an ethnic group less susceptible to malaria
eLife 6:e29156.
https://doi.org/10.7554/eLife.29156


