The E3 ubiquitin ligase IDOL regulates synaptic ApoER2 levels and is important for plasticity and learning
- Jie Gao

- Mate Marosi
- Jinkuk Choi
- Jennifer M Achiro
- Sangmok Kim
- Sandy Li
- Klara Otis
- Carlos Portera-Cailliau
- Peter Tontonoz
- David Geffen School of Medicine, University of California, United States
Figures
Figure 1 with 2 supplements
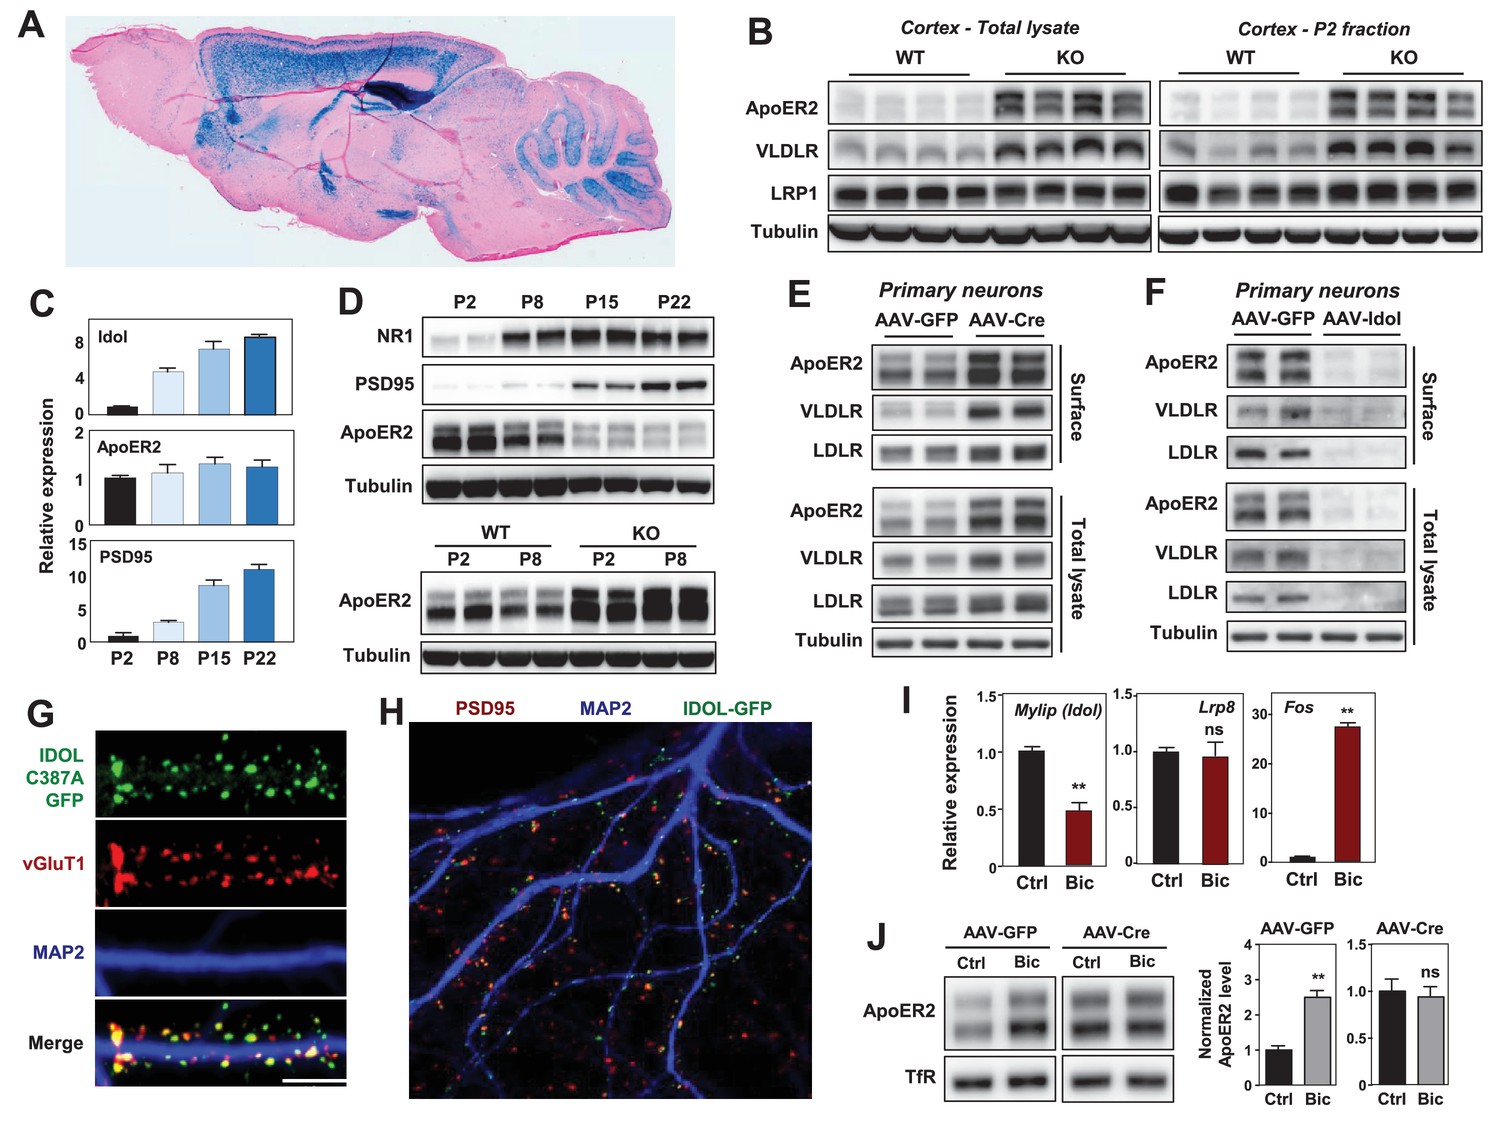
IDOL is a dominant regulator of neuronal ApoE receptor abundance.
(A) Representative image of X-gal staining of sagittal brain sections from 8 week-old IDOL-deficient mice. (B) Immunoblot analysis of total protein lysates (left) and crude synaptic fractions (P2) from cortex of 4 week old wild type and IDOL-deficient mice. Lanes represent samples from individual mice. (C) Real-time PCR analysis of mRNA expression in cortex of WT mice at postnatal day 2, 8, 15, 22. Data points are means ±S.E.M. (D) Immunoblot analysis of total protein lysates from cortex of WT or IDOL-deficient mice at postnatal day 2, 8, 15, 22. Lanes represent samples from individual mice. (E) Immunoblot analysis of total protein and biotin-labeled surface protein from Mylipflox/flox hippocampal neurons. Neurons were transduced with either AAV-CamKII-GFP or AAV-CamKII-CRE-GFP at DIV 5 and harvested at DIV18-20. Representative data are presented from ≥3 independent experiments. (F) Immunoblot analysis of total protein and biotin-labeled surface protein from WT hippocampal neurons. Neurons were transduced with either AAV-hSyn-GFP or AAV-hSyn-IDOL-GFP at DIV 5 and harvested at DIV18-20. Representative data are presented from ≥3 independent experiments. (G) Representative images showing immunofluorescence staining of WT hippocampal neurons transfected with a plasmid expressing a GFP-IDOL (C387A) fusion protein. Neurons were transfected at DIV16, and stained and imaged at DIV18. Green, GFP-IDOL (C387A); red, vesicular glutamate transporter 1 (vGluT1); blue, Microtubule-associated protein 2 (MAP2). Scale bars, 10 µm. Representative images are presented from 2 independent experiments, and 6–10 randomly selected neurons are imaged for each experiment. (H) Representative images showing immunofluorescence staining of WT hippocampal neurons transfected with a plasmid expressing GFP-IDOL fusion protein. Neurons were transfected at DIV16, and stained and imaged at DIV18. MG132 (10 µM) was added to the culture medium 2 hr before fixation. Green, GFP-IDOL; red, PSD95; blue, Microtubule-associated protein 2 (MAP2). Representative images are presented from 2 independent experiments, and 6–10 randomly selected neurons are imaged for each experiment. (I) Real-time PCR analysis of mRNA expression in WT cortical neurons 2 hr after bicuculline (Bic) (40 µM) treatment. Error bars represent SEM. **p<0.01 by Student’s t test. (J) Immunoblot analysis of biotin-labeled surface protein from IDOLflox/flox hippocampal neurons transduced with either AAV-CamKII-GFP or AAV-CamKII-CRE-GFP at DIV 5. Neurons (DIV18) were treated with bicuculline (40 µM) for 2 hr before harvest. Representative data are presented from ≥3 independent experiments. Quantification of ApoER2 levels are shown on the right. Error bars represent SEM. **p<0.01 by Student’s t test.
Figure 1—figure supplement 1
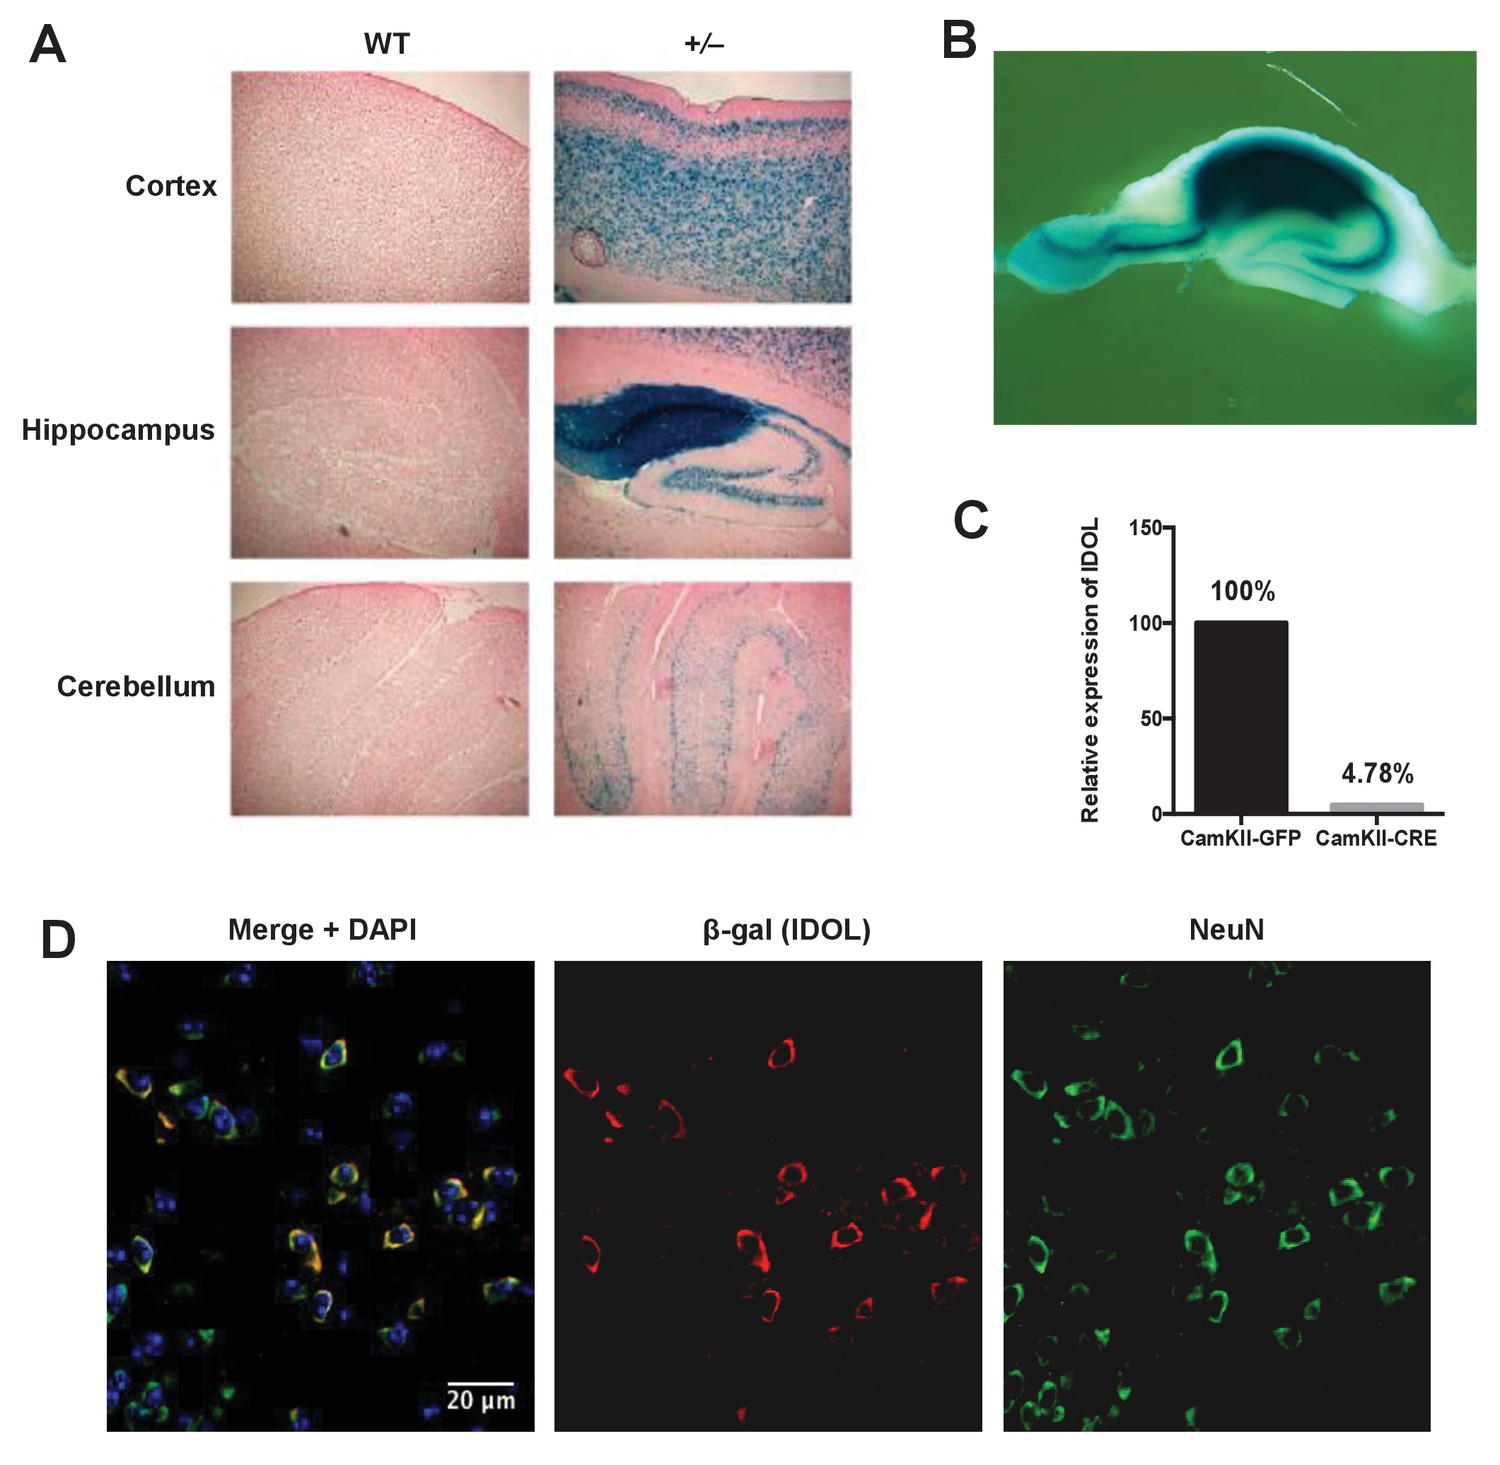
IDOL is a dominant regulator of neuronal ApoE receptor abundance.
(A) X-gal staining of brain sections from 8-week-old WT and IDOL-deficient mice. Representative images of cortex, hippocampus and cerebellum are shown. (B) Whole-mount X-gal staining of hippocampus from IDOL-deficient mice. (C) Real-time PCR analysis of IDOL mRNA expression in Mylipflox/flox cortical neurons transduced with either AAV-CamKII-GFP or AAV-CamKII-CRE-GFP. (D) Representative images showing immunofluorescence staining of brain sections from the frontal cortex of IDOL-deficient mice. Green, NeuN (neuron); red, β-Gal (IDOL); blue, 4′,6-diamidino-2-phenylindole (DAPI; nucleus). Scale bars, 20 μm.
Figure 1—figure supplement 2
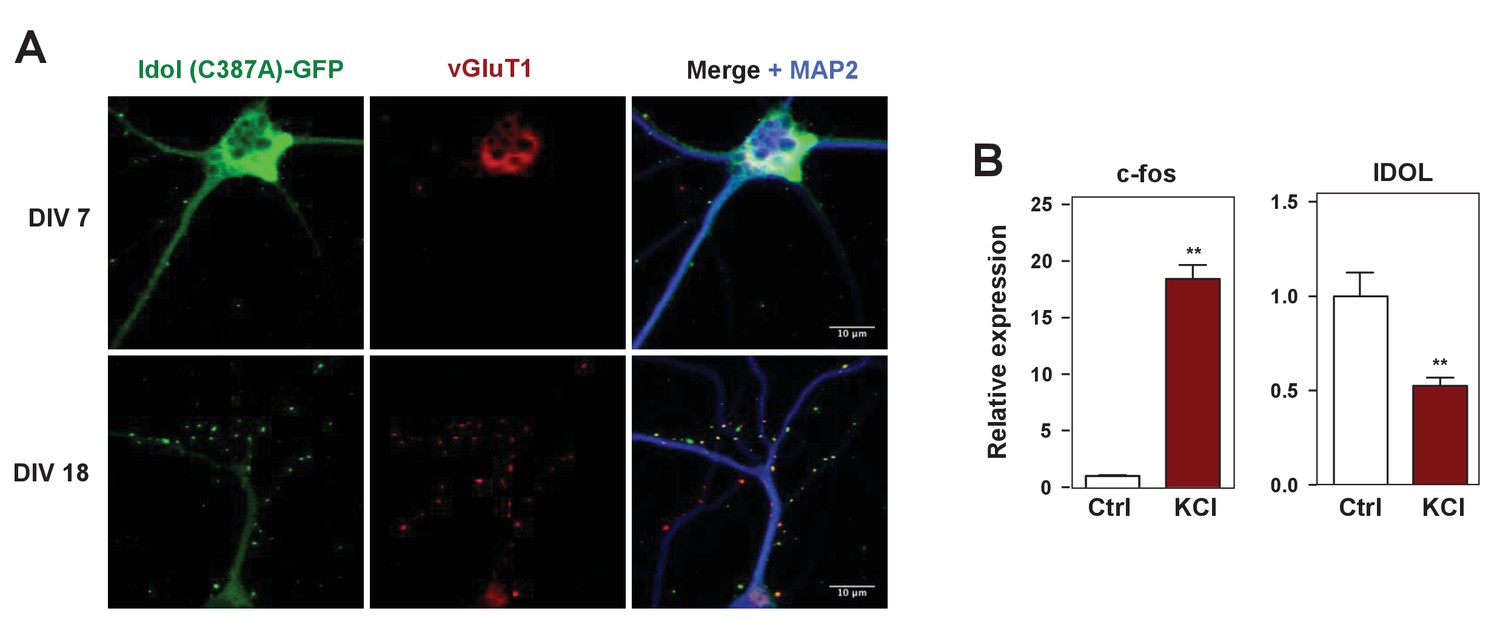
IDOL is a dominant regulator of neuronal ApoE receptor abundance.
(A) Representative images showing immunofluorescence staining of WT hippocampal neurons transfected with a plasmid expressing a GFP-IDOL (C387A) fusion protein. Neurons were transfected at DIV 5, and stained and imaged at DIV7. Green, GFP-IDOL (C387A); red, vesicular glutamate transporter 1 (vGluT1); blue, microtubule-associated protein 2 (MAP2). Scale bars, 10 µm. (B) Real-time PCR analysis of mRNA expression in WT cortical neurons 1 hr after KCl (50 mM) treatment. Error bars represent SEM. **p<0.01 by Student’s t test.
Figure 2
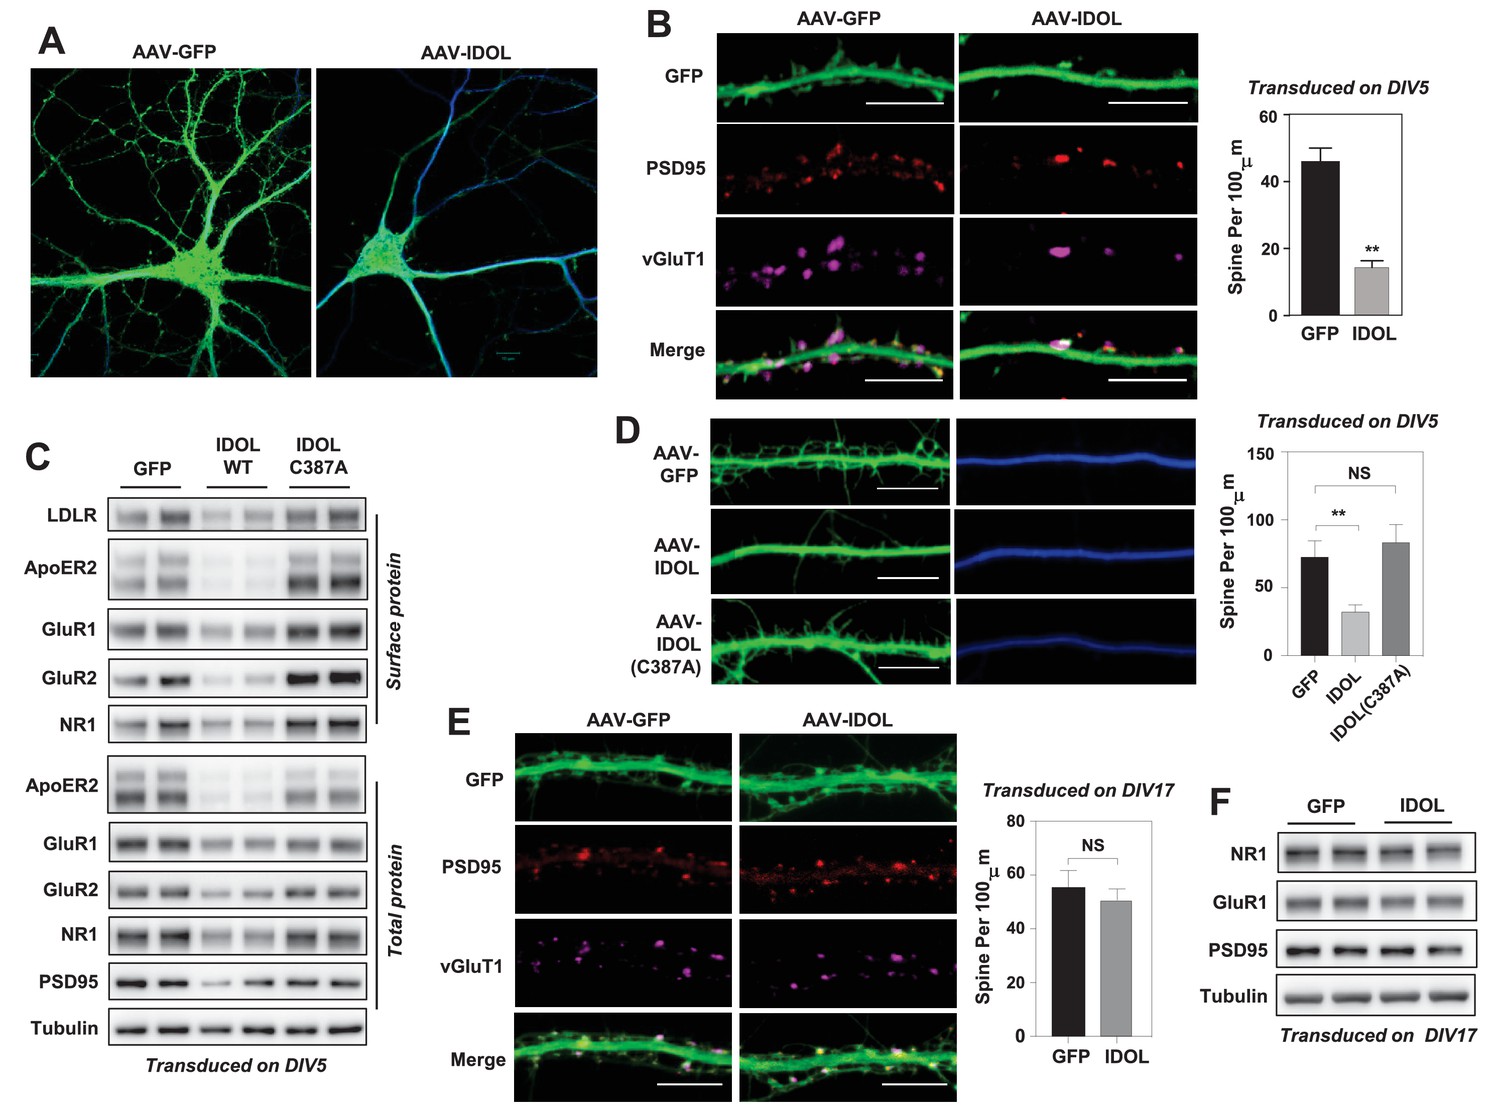
Excess IDOL activity inhibits the initiation of dendritic spinogenesis.
(A) Representative images showing morphology of WT hippocampal neurons transduced with either AAV-hSyn-GFP or AAV-hSyn-IDOL-GFP. Neurons were infected at DIV 5, and fixed and imaged at DIV 20. Images are presented as merged green (GFP) and blue (MAP2) channels. (B) Representative images showing morphology of dendrites from WT hippocampal neurons transduced with either AAV-hSyn-GFP or AAV-hSyn-IDOL-GFP. Neurons were infected at DIV 5, and fixed and imaged at DIV 20. Green, GFP; red, PSD95; magenta, vGluT1. Scale bars, 10 µm. Quantification of spine density is shown on the right (n = 8–10/group). **p<0.01 by Student’s t test. (C) Immunoblot analysis of total and surface protein from WT hippocampal neurons transduced with either AAV-hSyn-GFP, AAV-hSyn-IDOL, or AAV-hSyn-IDOL (C387A). Neurons were infected at DIV 5 and harvested at DIV 20. (D) Representative images showing morphology of dendrites from WT hippocampal neurons transduced with either AAV-hSyn-GFP, AAV-hSyn-IDOL-GFP or AAV-hSyn-IDOL (C387A). Neurons were infected at DIV 5, and fixed and imaged at DIV 9. Scale bars, 10 µm. Quantification of spine density is shown on the right (n = 8–10/group). **p<0.01 by Student’s t test. (E) Representative images showing morphology of dendrites from WT hippocampal neurons transduced with either AAV-hSyn-GFP or AAV-hSyn-IDOL-GFP at DIV 17, and fixed and imaged at DIV 21. Green, GFP; magenta, vGluT1; mlue, MAP2. Scale bars, 10 µm. Quantification of spine density is shown on the right (n = 8–10/group). (F) Immunoblot analysis of total protein from WT hippocampal neurons transduced with either AAV-hSyn-GFP or AAV-hSyn-IDOL-GFP at DIV 17, and fixed and imaged at DIV 21.
Figure 3 with 1 supplement
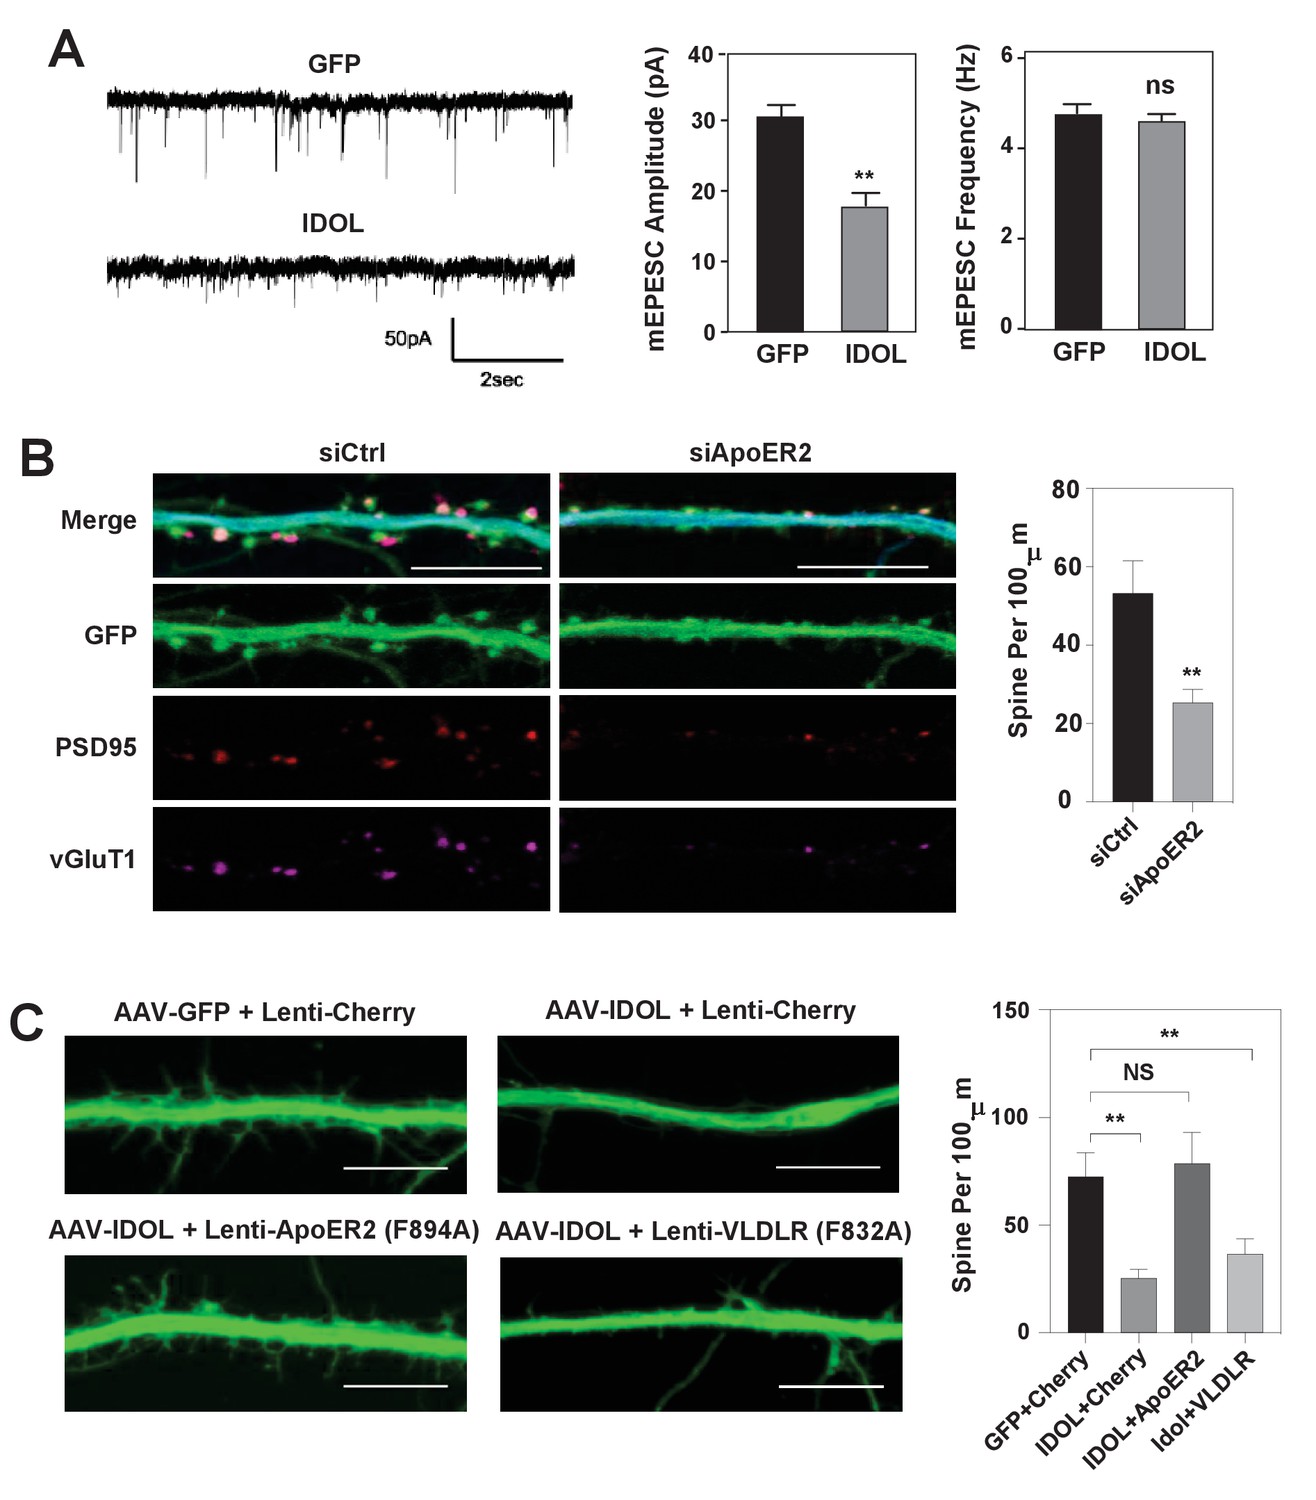
IDOL suppresses dendritic spinogenesis through control of ApoER2.
(A) mEPSC recordings from WT hippocampal neurons transduced with either AAV-hSyn-GFP, or AAV-hSyn-IDOL (right). Neurons were transduced at DIV 5 and recorded between DIV16-18. Quantification of mEPSC amplitude and frequency (n = 7–11) is shown on the right. Error bars represent SEM. **p<0.01 by Student’s t test. ns, not significant. (B) Representative images showing morphology of dendrites from WT hippocampal neurons incubated with control siRNA (1 µM) or ApoER2 siRNA (1 µM) from DIV5 to DIV16. Green, GFP; red, PSD95; magenta, vGluT1. Scale bars, 10 µm. Quantification of spine density is shown on the right (n = 9–12/group). **p<0.01 by Student’s t test. (C) Representative images showing morphology of dendrites from WT hippocampal neurons transduced with Lenti-Cherry, Lenti-ApoER2 or Lenti-VLDLR, as well as AAV-hSyn-GFP or AAV-hSyn-IDOL-GFP as labeled. Neurons were infected at DIV 5, and fixed and imaged at DIV 10. Scale bars, 10 µm. All data presented in Figure 2 are from ≥2 independent experiments. 5–8 randomly selected neurons are imaged for each experiment and used for statistical analysis. Quantification of spine density is shown on the right. **p<0.01 by Student’s t test.
Figure 3—figure supplement 1
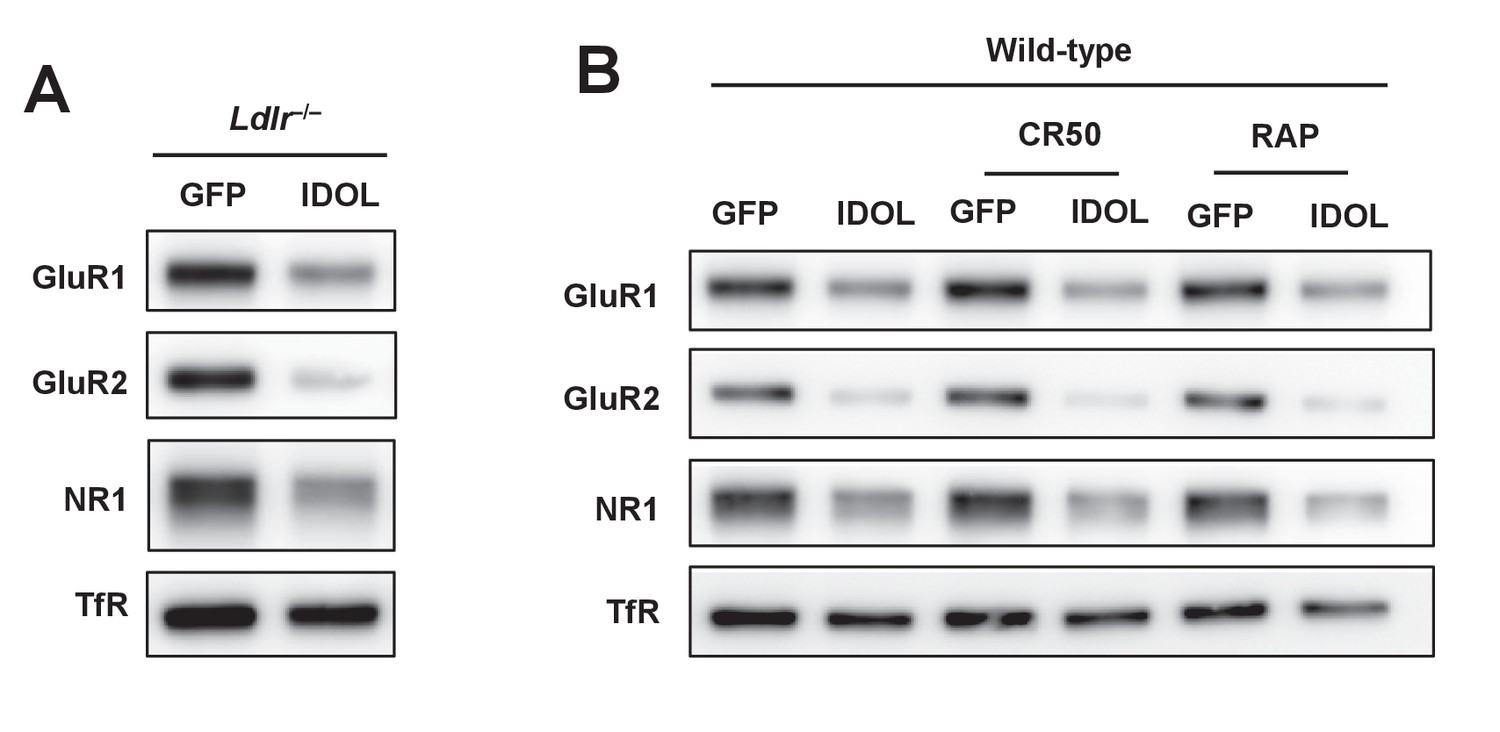
Excess IDOL activity inhibits spinogenesis by limiting ApoER2 protein.
(A) Immunoblot analysis of total protein from Ldlr-/- hippocampal neurons. Neurons were transduced with either AAV-hSyn-GFP or AAV-hSyn-IDOL-GFP at DIV 5 and harvested at DIV18. (B) Immunoblot analysis of total protein from WT hippocampal neurons. Neurons were transduced with either AAV-hSyn-GFP or AAV-hSyn-IDOL-GFP at DIV 5, cultured in medium supplemented with CR50 (2 µg/ml) or RAP (2.5 µg/ml), and harvested at DIV18.
Figure 4 with 1 supplement
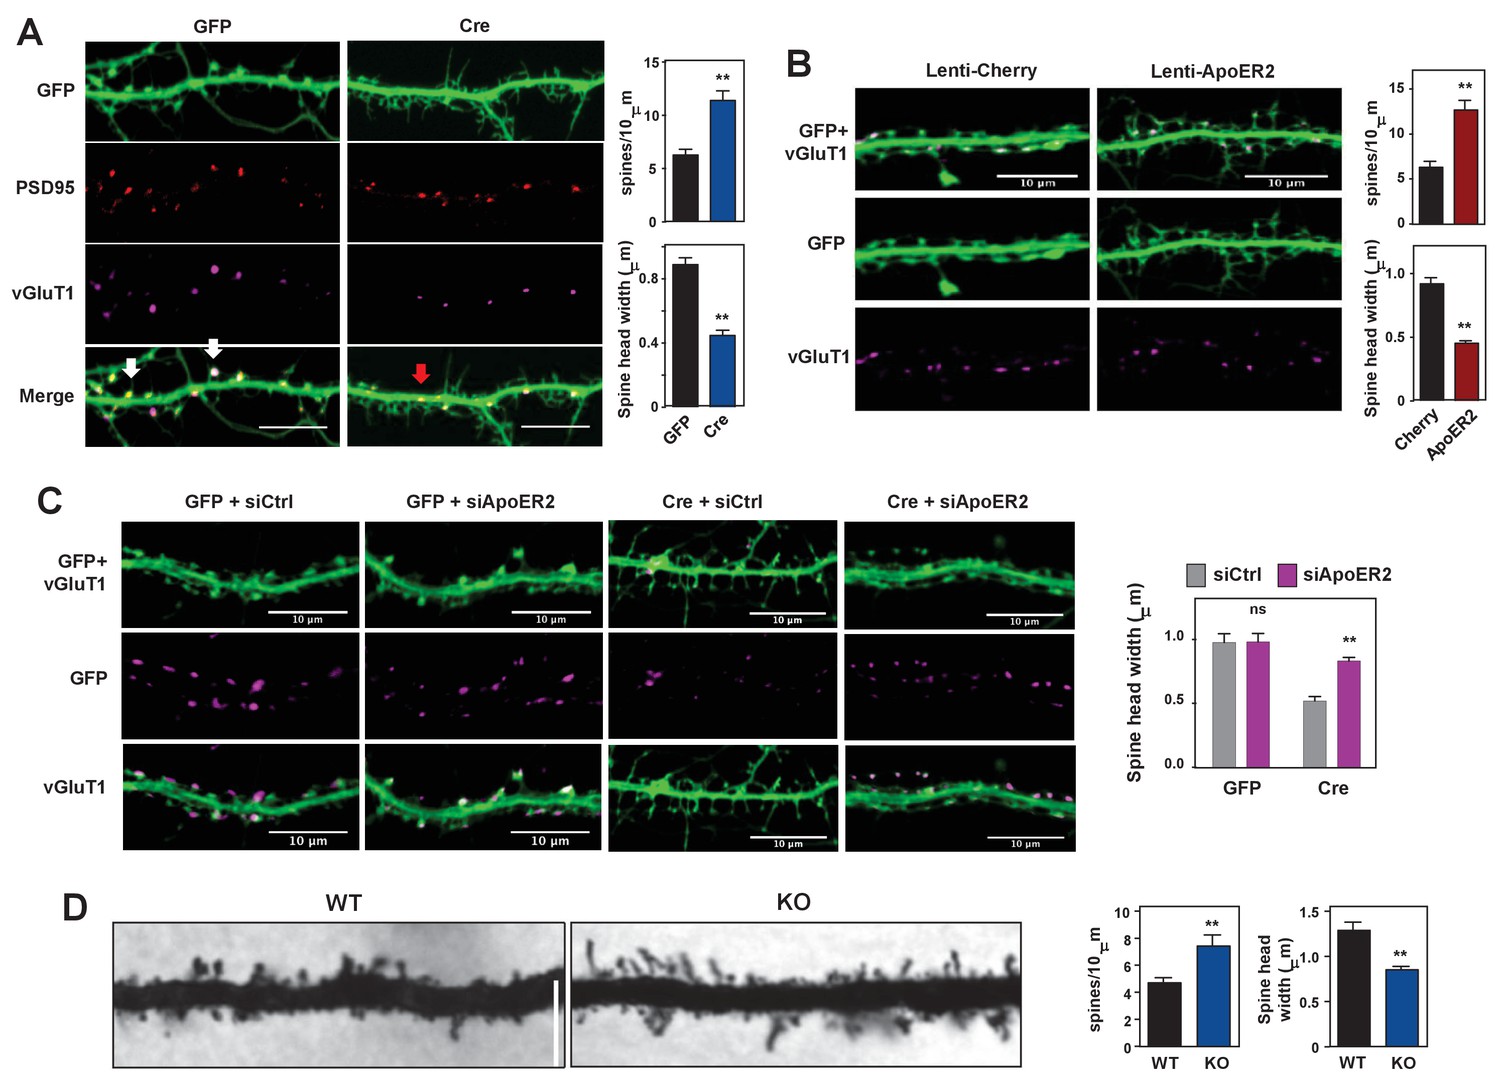
Loss of IDOL impairs dendritic Spine morphogenesis and maturation.
(A) Representative images showing immunofluorescence staining of dendrites from Mylipflox/flox hippocampal neurons transduced with either AAV-CamKII-GFP or AAV-CamKII-CRE-GFP. Neurons were transduced at DIV 5, and fixed and stained at DIV 19–20. Spine synapse, white arrow; Shaft synapse, red arrow; Green, GFP; Red, PSD95; Magenta, vGluT1. Scale bars, 10 µm. Quantification of spine density and spine-head width of neurons (including filopodia-like protrusions) is shown on the right (n = 10–12/group). **p<0.01 by Student’s t test. (B) Representative images showing immunofluorescence staining of dendrites from WT hippocampal neurons transduced with either Lenti-Cherry or Lenti-ApoER2. Neurons were transduced at DIV 10, and fixed and stained at DIV 19–20. Both groups were also transduced with a AAV-CamKII-GFP DIV15 to allow visualization of spines. Green, GFP; magenta, vGluT1. Scale bars, 10 µm. Quantification of spine density and spine-head width of neurons from (including filopodia-like protrusions, n = 10–12/group) is shown on the right. **p<0.01 by Student’s t test. (C) Representative images showing immunofluorescence staining of dendrites from Mylipflox/flox hippocampal neurons transduced with either AAV-CamKII-GFP or AAV-CamKII-CRE-GFP at DIV10. Control siRNA (1 µM) or ApoER2 siRNA (1 µM) were then added to the culture medium at DIV16 and applied again after 48 hr. Neurons were fixed and stained at DIV21. Green, GFP; magenta, vGluT1. Scale bars, 10 µm. Quantification of spine-head width of neurons (including filopodia-like protrusions, n = 10–12/ group) is shown on the right. (D) Representative images of primary CA1 apical dendrites (about 150 µM from the soma) in Golgi-impregnated slices from 5-weeks-old WT and IDOL-deficient mice. Scale bars, 5 µm; quantification of dendritic spine density along the dendrites of Golgi-impregnated CA1 hippocampal neurons obtained from WT (n = 9 total neurons, 3 animals) and IDOL-deficient mice (n = 10 total neurons, 3 animals) is shown on the right. Error bars represent SEM. **p<0.01 by Student’s t test. Primary neuron images presented in this figure are from ≥2 independent experiments, 5–8 randomly selected neurons are imaged for each experiment and used for statistical analysis.
Figure 4—figure supplement 1
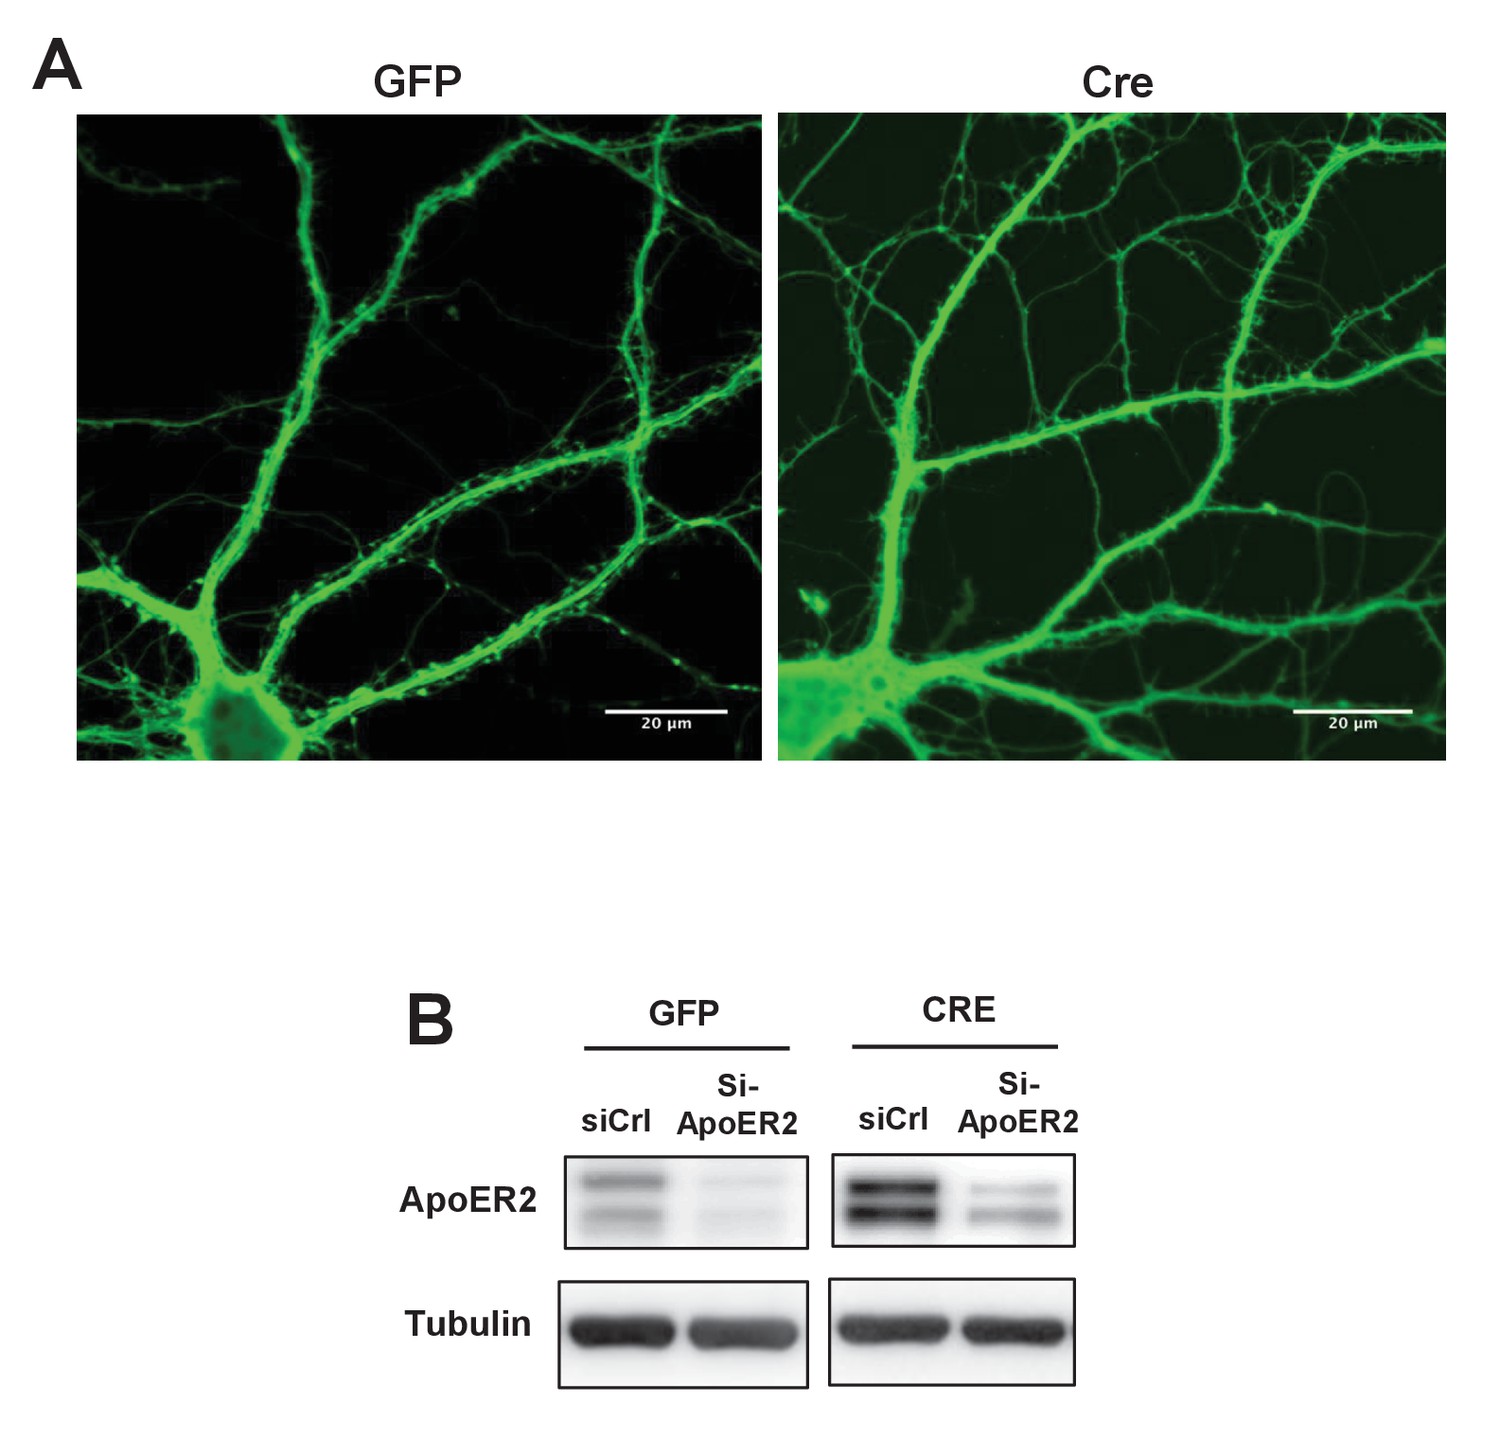
Loss of IDOL impairs dendritic Spine morphogenesis and maturation.
(A) Representative images showing morphology of Mylipflox/flox hippocampal neurons transduced with either AAV-CamKII-GFP or AAV-CamKII-CRE-GFP. Neurons were transduced at DIV 5, and fixed and stained at DIV 19–20. Scale bars, 20 µm. (B) Immunoblot analysis of total proteins from Mylipflox/flox hippocampal neurons transduced with either AAV-CamKII-GFP or AAV-CamKII-CRE-GFP, and treated with control siRNA (1 µM) or ApoER2 siRNA (1 µM). Knockdown efficiency was evaluated 72 hr after transfection.
Figure 5 with 1 supplement
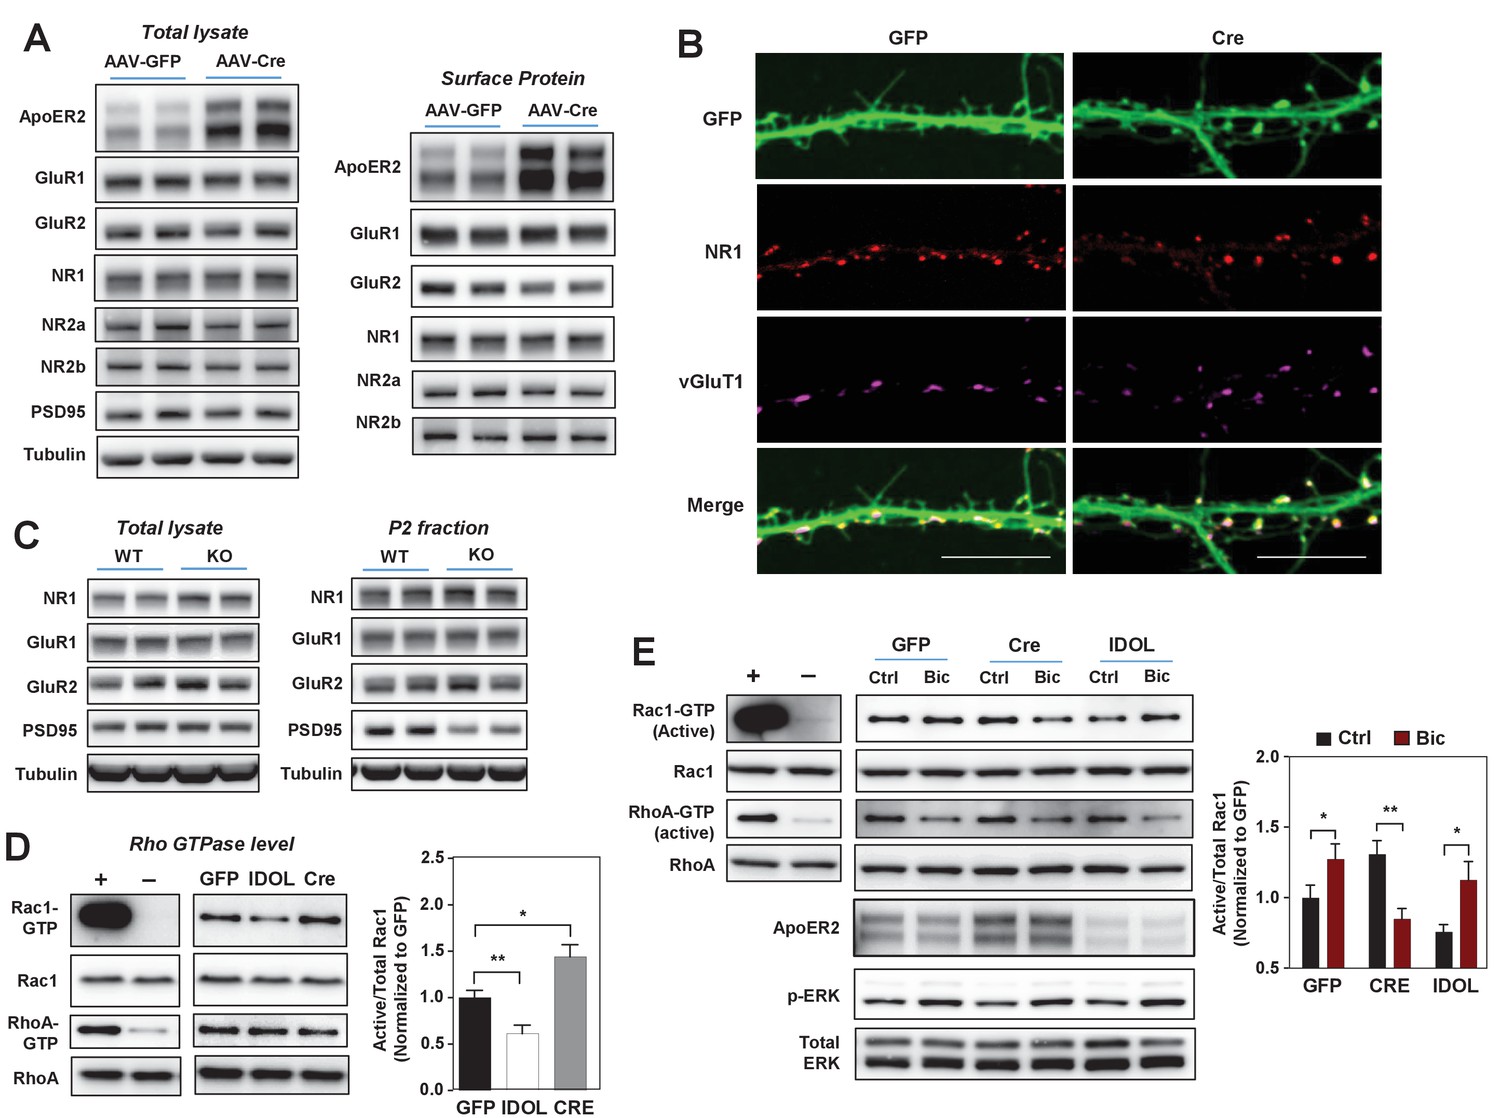
The IDOL-ApoER2 axis modulates the coupling between synaptic activity and Rac1.
(A) Immunoblot analysis of total protein and biotin-labeled surface protein from Mylipflox/flox hippocampal neurons transduced with either AAV-CamKII-GFP or AAV-CamKII-CRE-GFP. Neurons were transduced at DIV 5 and harvested at DIV 18. Each lane represents pooled samples from two wells of a 12-well-plate. Representative data are presented from ≥3 independent experiments. (B) Representative images showing immunofluorescence staining of dendrites from Mylipflox/flox hippocampal neurons transduced with either AAV-CamKII-GFP or AAV-CamKII-CRE-GFP. Neurons were transduced at DIV 5, and fixed and stained at DIV 20. Green, GFP; red, NR1. Scale bars, 10 µm. (C) Immunoblot analysis of total protein lysates (left) and crude synaptic fractions (P2) from cortex of 4-week-old WT and IDOL–/– mice. Lanes represent samples from individual mice. Representative data are presented from samples of four individual mice per group. (D) Immunoblot analysis of endogenous GTP-bound (active) Rac1 and Rho, and total Rac1 and Rho in the protein lysate from Mylipflox/flox cortical neurons transduced with AAV vectors expressing GFP, CRE or IDOL. Neurons were transduced at DIV 5 and harvested at DIV 16–18. Each lane represents pooled samples from three wells of a 12-well-plate. Representative data are presented from ≥2 independent experiments. Quantification of endogenous GTP-bound (active) Rac1 levels is shown on the right. *p<0.05 **p<0.01 by Student’s t test. (E) Immunoblot analysis of endogenous GTP-bound (active) Rac1 and Rho, and total Rac1 and Rho in the protein lysates from Mylipflox/flox cortical neurons transduced with either AAV-CamKII-GFP, AAV-CamKII-CRE-GFP or AAV-CamKII-IDOL-GFP. Neurons were transduced at DIV 5 and harvested at DIV 16–18. Neurons were treated with bicuculline (40 µM) for 10 min before harvest. Each lane represents pooled samples from three wells of a 12-well-plate. Representative data are presented from ≥2 independent experiments. Quantification of endogenous GTP-bound (active) Rac1 in the protein lysates is shown on the right. *p<0.05 **p<0.01 by Student’s t test. Primary neuron images presented in this figure are from ≥2 independent experiments, 5–8 randomly selected neurons are imaged for each experiment and used for statistical analysis.
Figure 5—figure supplement 1
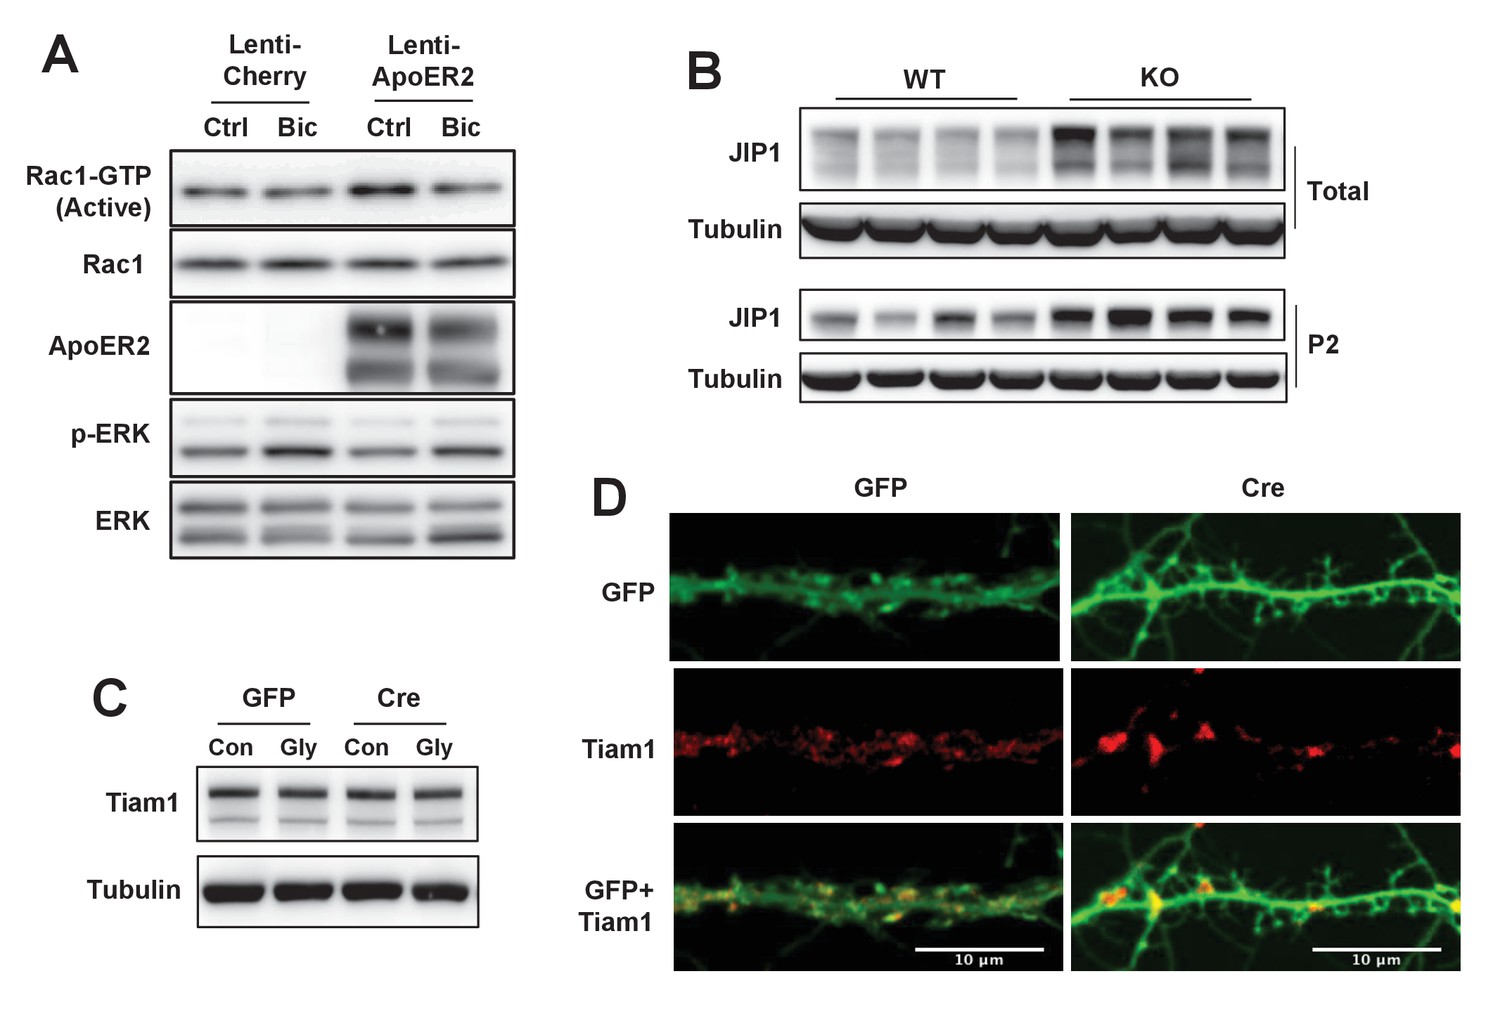
IDOL effects on Rac1 activity involve JIP1 and TIAM1.
(A) Immunoblot analysis of endogenous GTP-bound (active) Rac1 and total Rac1 in the protein lysates from Mylipflox/flox cortical neurons transduced with either Lenti-Cherry, or Lenti-ApoER2. Neurons were transduced at DIV 5 and harvested at DIV 16–18. Neurons were treated with bicuculline (40 µM) for 10 min before harvest. Each lane represents pooled samples from three wells of a 12-well-plate. Representative data are presented from 2 independent experiments. (B) Immunoblot analysis of total protein lysates (upper) and P2 fractions (lower) from cortex of 4-week-old wild type and IDOL-deficient mice. Lanes represent samples from individual mice. (C) Immunoblot analysis of total protein lysates from Mylipflox/flox hippocampal neurons transduced with either AAV-CamKII-GFP or AAV-CamKII-CRE-GFP and treated with/without glycine. (D) Representative images showing immunofluorescence staining of dendrites from Mylipflox/flox hippocampal neurons transduced with either AAV-CamKII-GFP or AAV-CamKII-CRE-GFP. Neurons were transduced at DIV 5, and fixed and stained at DIV 20. Green, GFP; red, Tiam1. Scale bars, 10 µm.
Figure 6 with 1 supplement
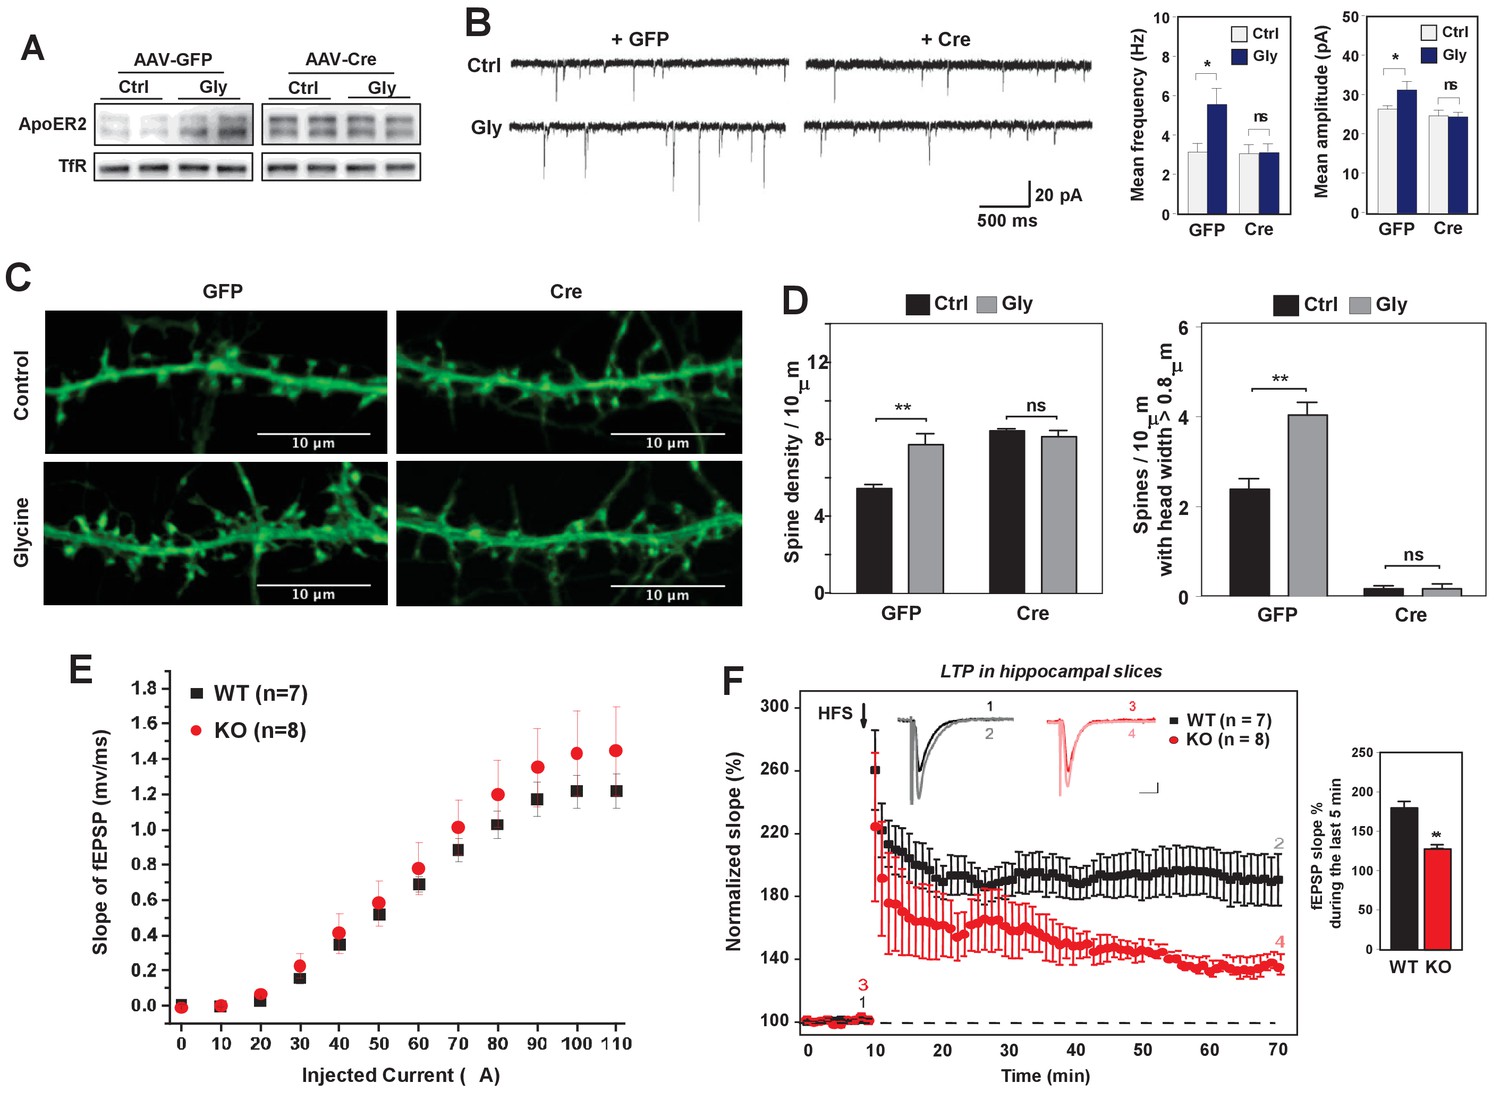
Loss of IDOL impairs LTP in neurons and hippocampal slices.
(A) Immunoblot analysis of total proteins from Mylipflox/flox hippocampal neurons transduced with either AAV-CamKII-GFP or AAV-CamKII-CRE-GFP at DIV 5. At DIV21, neurons were briefly treated with glycine (200 µM) followed by 30–40 min resting before harvest (cLTP protocol in Materials and Methods). Each lane represents pooled samples from two wells of a 12-well-plate. Representative data are presented from 2 independent experiments. (B) (Left) mEPSC recordings from Mylipflox/flox hippocampal neurons with/without glycine treatment (cLTP protocol). Neurons were transduced with either AAV-CamKII-GFP or AAV-CamKII-CRE-GFP at DIV 5 and recorded between DIV19-21. (Right) Quantification of mEPSC amplitude and frequency (n = 9–15/group). Error bars represent SEM. *p<0.05 by Student’s t test. ns, not significant. (C) Representative images showing morphology change of dendritic spines with/without glycine treatment (cLTP protocol). (D) Quantification of spine density and number of spines with big head width (>0.8 µM) of neurons before and after cLTP protocol in Figure 6C. n = 10–12/ group. (E) Input–output curves of fEPSP slopes in the WT group (■),IDOL-deficient group (●). Data points are means ±S.E.M. (WT n = 7 and IDOL-deficient n = 8 slices). (F) (Left) LTP induced by HFS (arrow) was reduced in the SC-CA1 synapses of IDOL-deficient mice (●) compared to WT mice (■). Data points are means ±S.E.M. of normalized slopes of fEPSPs in every minute (3 traces/min). Insets show representative traces of evoked EPSPs recorded in hippocampal slices of WT and IDOL-deficient mice before (black, red) and after HFS (gray, light red) respectively. Calibration: 0.2 mV, 10 msec. Numbers (1, 2, 3, 4) show the origin of the representative traces. (Right) Summary of magnitude of LTP (% baseline EPSP slope; means ±S.E.M.) during the last 5 min (between 55 and 60 min) of the recording (n = 7 slices from 6 WT mice and n = 8 slices from 6 IDOL-deficient mice). **p<0.01 by Mann–Whitney U-test.
Figure 6—figure supplement 1

Loss of IDOL impairs LTP in neurons and hippocampal slices.
(A) Immunoblot analysis of total proteins from Mylipflox/flox hippocampal neurons transduced with either AAV-CamKII-GFP or AAV-CamKII-CRE-GFP at DIV 5. At DIV21, neurons were stimulated in a cLTP protocol (see Materials and Methods). Neurons were harvested 10 min after glycine stimulation. Each lane represents pooled samples from two wells of a 12-well-plate.
Figure 7 with 1 supplement
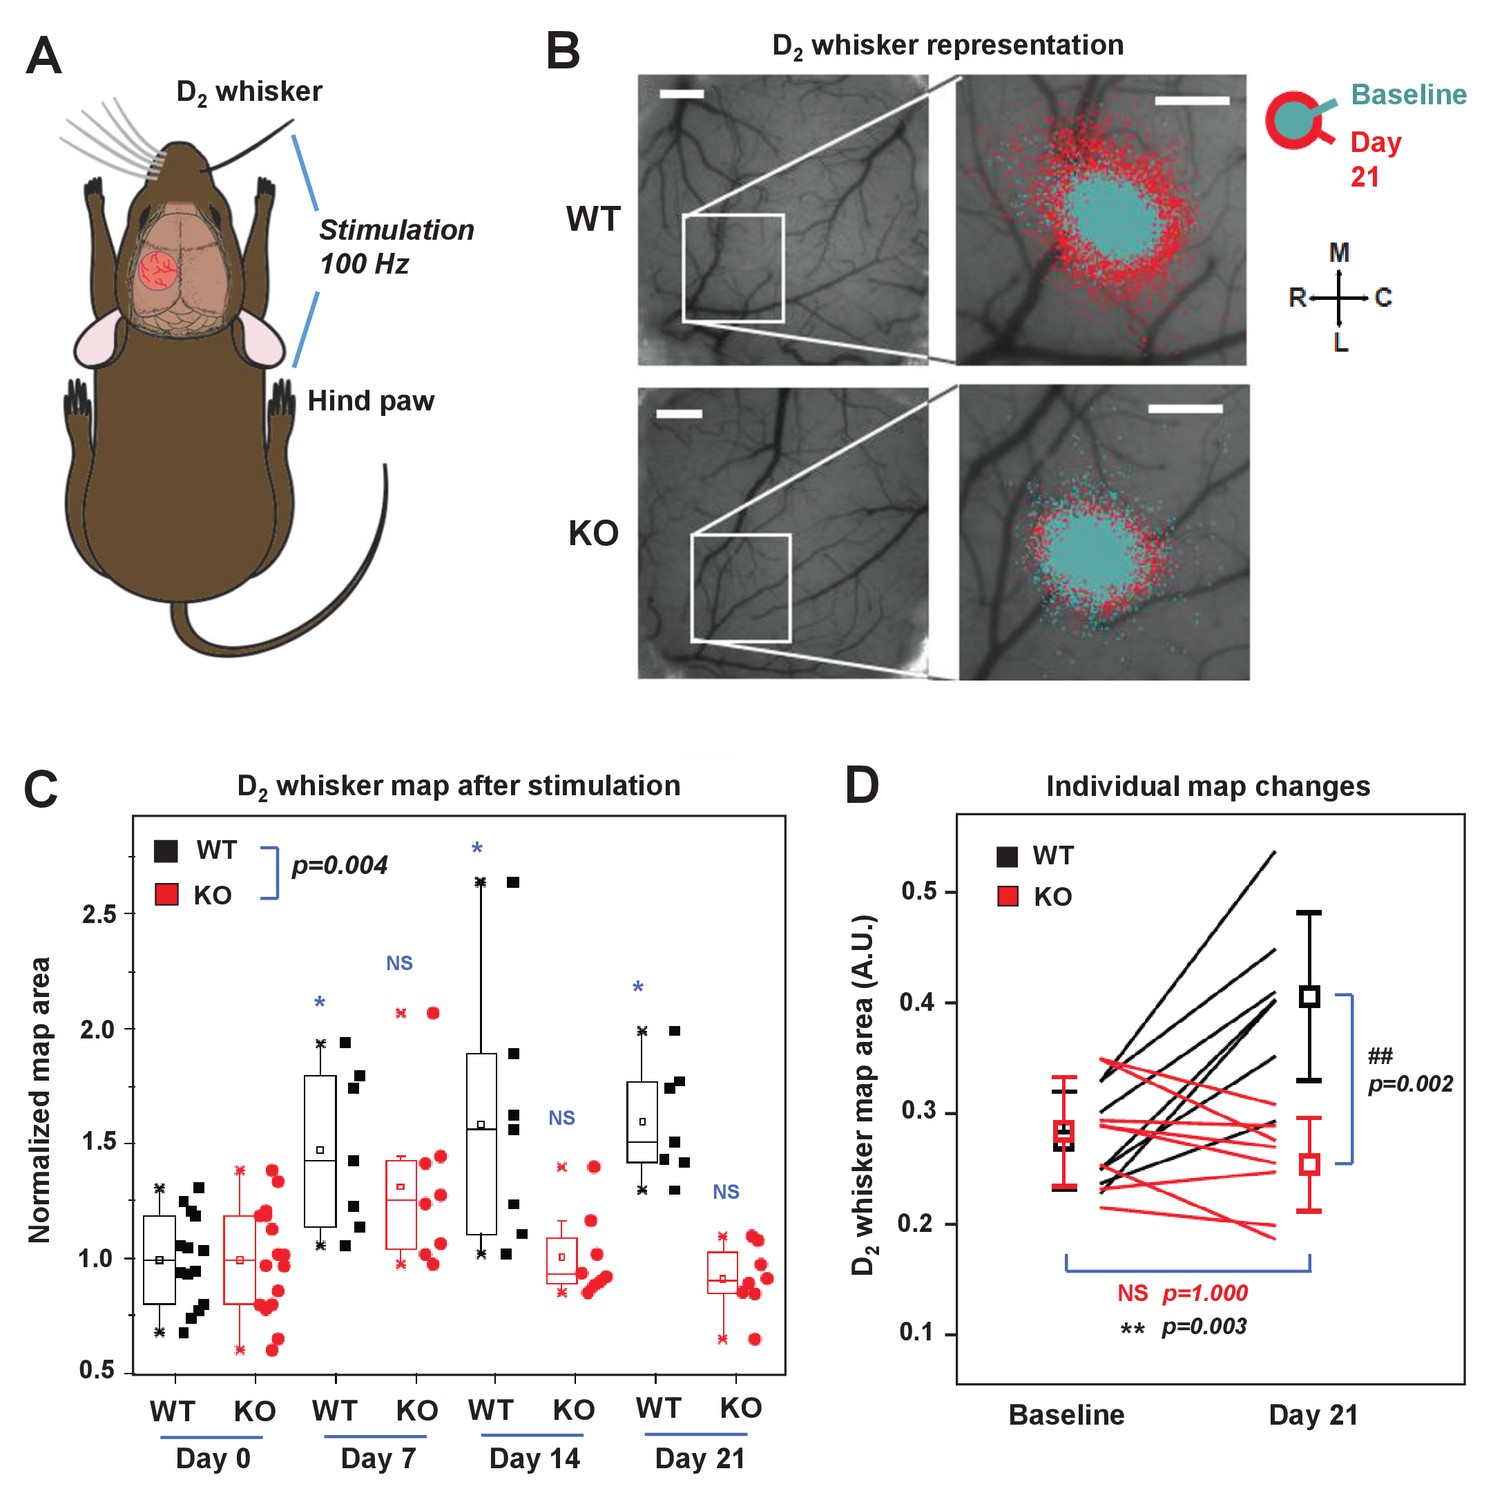
IDOL is required for experience-dependent neural plasticity.
(A) Schematic of experimental design for Optical Intrinsic Signal (OIS) experiments. We mechanically stimulated (piezoelectric square deflections, t = 1.5 s, f = 100 Hz, anterior-posterior deflections) the contralateral D2 whisker (D2W), and hindpaw (HP). (B) OIS images showing the functional representation of the D2W map at baseline (cyan) and at +21 d after plucking all whiskers except the D2W (red) for both WT mice (top row) and IDOL-deficient mice (bottom row). Scale bars: 0.5 mm. Orientation: M – medial, L – lateral, R – rostral, C – caudal. (C) Box-plot graph (95% CI) showing the differences between normalized sensory map size of D2W at baseline (see Materials and Methods), and at +7 days,+14 days and +21 days after whisker deprivation in WT (n = 7) and knockout (n = 8) mice. Each symbol represents an individual animal. -: median, □: mean. (*p<0.05; **p<0.01 vs. control within genotypes; # p<0.05; ## p<0.01 between experimental groups – Two-way ANOVA with repeated measures followed by Bonferroni’s multiple comparison test). There was a significant difference between groups with time as a factor (Two-way ANOVA with repeated measures, interaction between genotype and time p=0.0034). (D) Comparison of the average size of the D2W functional representation maps between WT (black) and IDOL-deficient mice (red) at baseline and over 21 days after whisker plucking. Lines represent individual mice. □: averages ± S.D. **p=0.003, for the baseline vs. whisker deprivation in WT mice. ##p=0.00199 for comparison between WT and knockout mice.
Figure 7—figure supplement 1
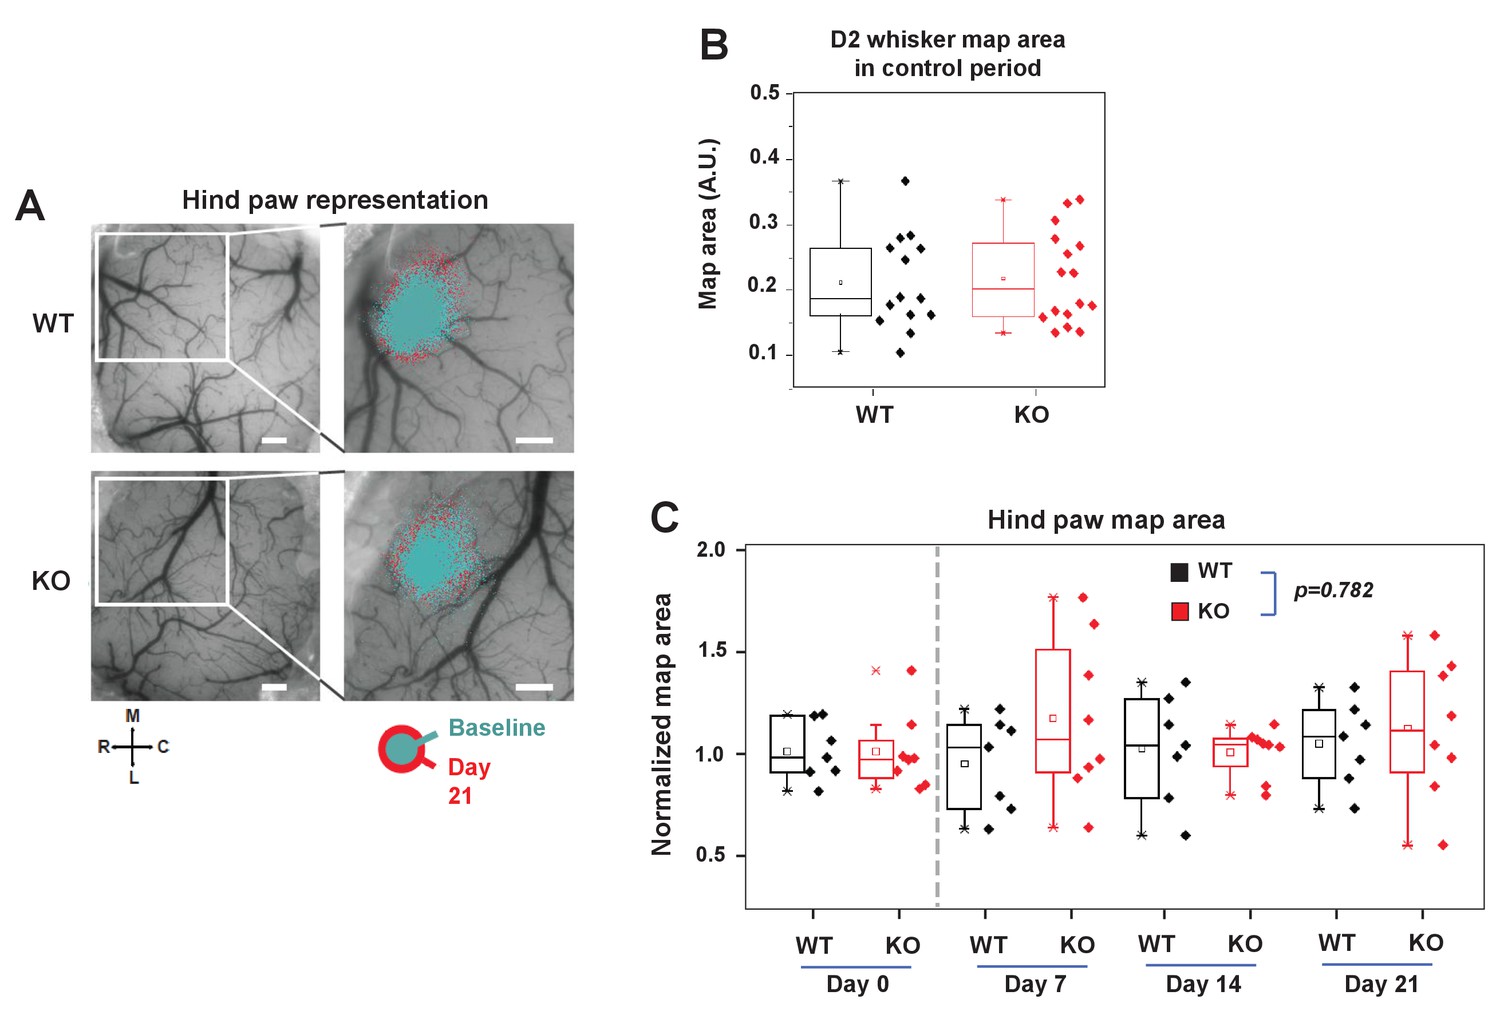
IDOL is required for experience-dependent neural plasticity.
(A) Box-plot graph showing sensory map size of D2W at baseline in WT (n = 7) and IDOL-deficient (n = 8) mice. Baseline OIS imaging was acquired in 2 separate sessions (1 week apart) and averaged. (B) Functional representation of the contralateral hindpaw (HP) before and after sensory deprivation. OIS response maps were overlaid on a photograph of the surface vasculature (left panels) to create regional maps of HP activation (right panels). White square indicates field of view in right images in WT (top) and IDOL-deficient (bottom) in control (cyan) and 21 days after whisker removal (red) except one (the spared whisker – D2). Scale bar: 0.5 mm. Orientation: M – medial, L – lateral, R – rostral, C – caudal. (C) Comparison of normalized HP functional representation map size in WT (black) and knockout (red) mice over time. WT (n = 7) and knockout (n = 8). The HP maps remained relatively stable over time. There is no significant difference between WT knockout groups with time as a factor (Two-way ANOVA with repeated measures, interaction between genotype and time; p=0.78193).
Figure 8
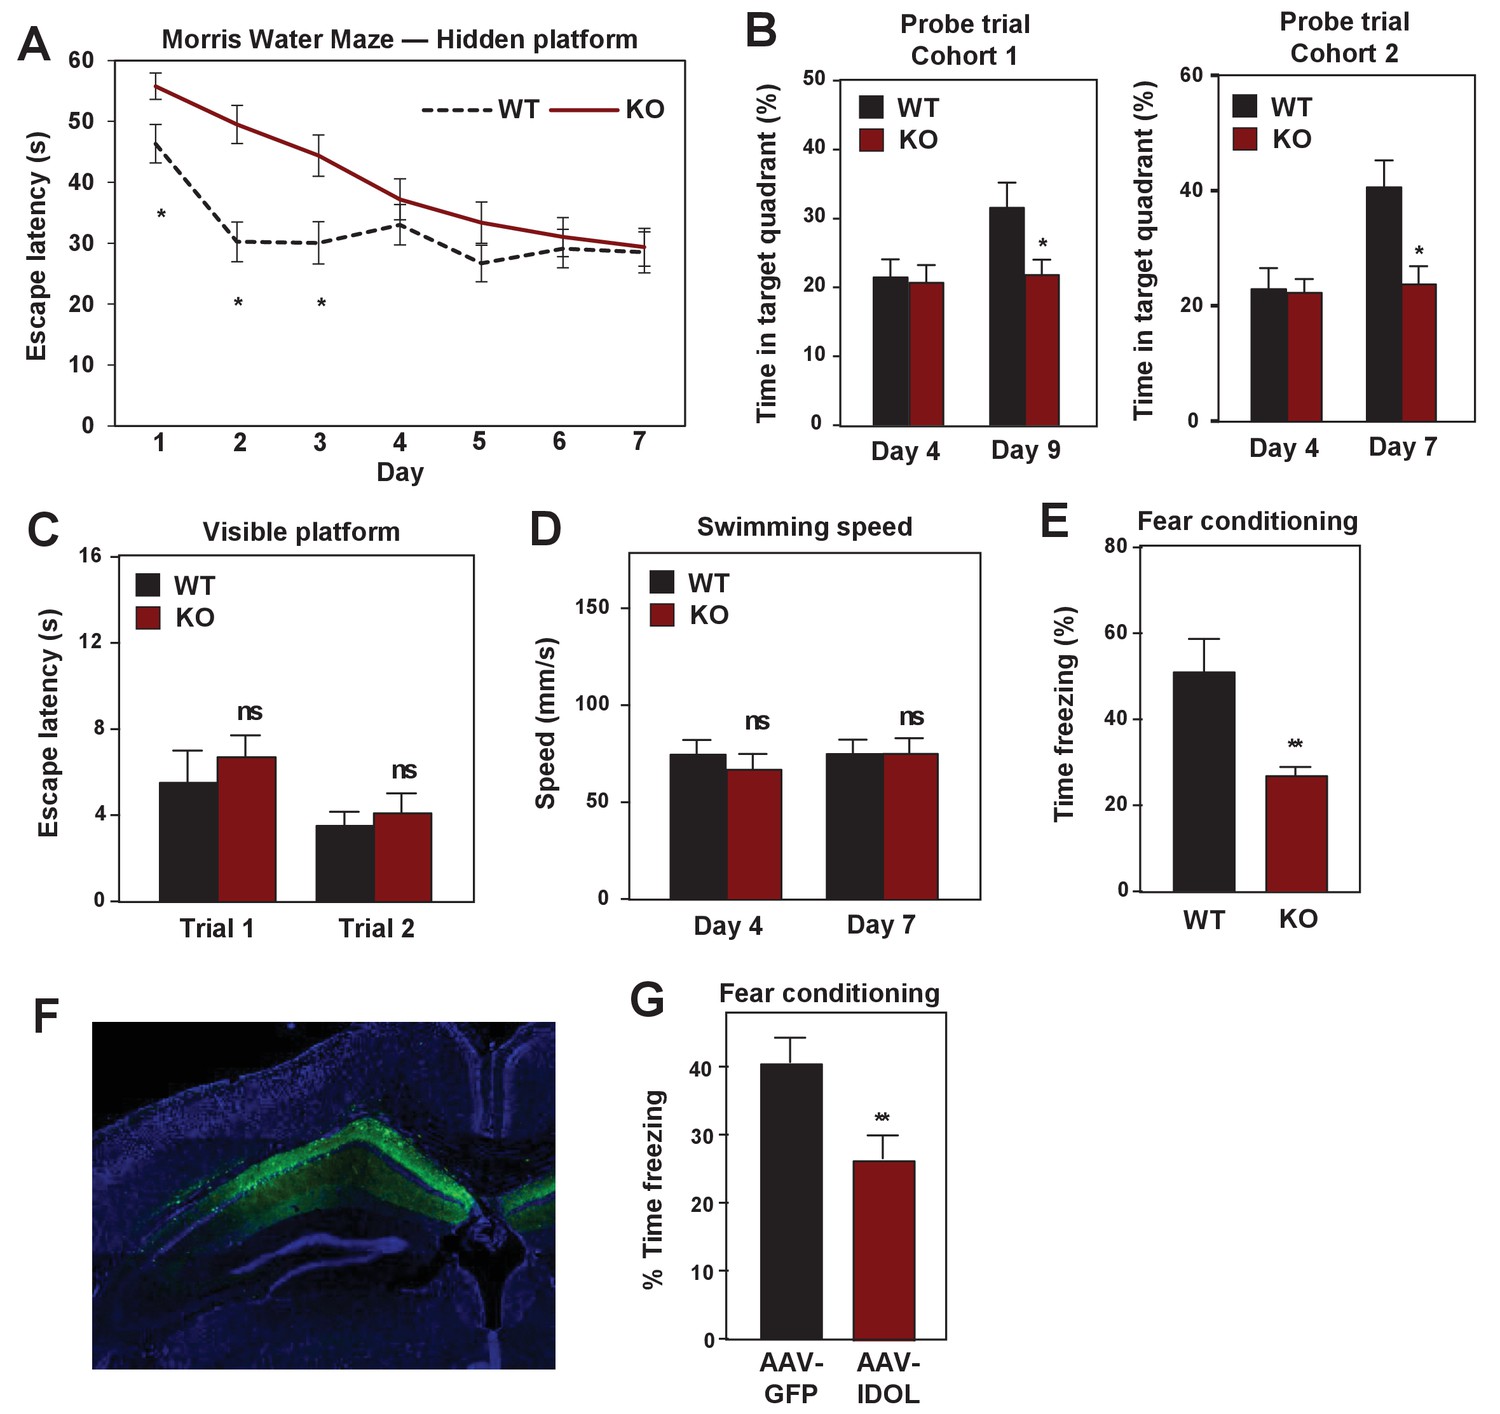
IDOL deficiency impairs hippocampal-dependent learning and memory.
(A) Escape latency to find the hidden platform during training trials of male adult (≥8 month-old) WT and IDOL-deficient mice in the Morris water maze (n = 9/group). *p<0.05 by One-way ANOVA with repeated measures. (B) Time spent in the target quadrant searching for the hidden platform after the fourth (first probe trial), seventh or ninth (second probe trial) training trials. (n = 8 for the first cohort; n = 9–10 for the second cohort). *p<0.05 by Student’s t test. (C) Escape latency to find the visible platform of male adult (≥8 month old) wild type and IDOL-deficient mice in the Morris Water Maze (n = 9–10/group). ns, not significant. (D) Swimming speed of male adult (≥8 months old) WT and IDOL-deficient mice. (E) Average freezing behavior over 5 min, 24 hr after training, in the same context was measured in female adult (≥8 month old) WT and IDOL-deficient mice (n = 8–10/group). **p<0.01 by Student’s t test. (F) Representative image of GFP expression in hippocampus two months after stereotaxic vector delivery (AAV-Syn-GFP or AAV-Syn-GFP-IDOL) into the hippocampus of adult mice. (G) Contextual memory consolidation was measured by freezing frequency at 24 hr after training in mice injected with AAV-Syn-GFP or AAV-Syn-GFP-IDOL (12 weeks old, n = 10/group). **p<0.01 by Student’s t test.
Additional files
-
Source code 1
MATLAB script for CameraSetUp.
Activates DALSA camera.
- https://doi.org/10.7554/eLife.29178.017
-
Source code 2
MATLAB script for OISpreview.
Live camera feed used to find cortical surface.
- https://doi.org/10.7554/eLife.29178.018
-
Source code 3
MATLAB script for OIS vasculature.
Grabs photo of vasculature on cortical surface.
- https://doi.org/10.7554/eLife.29178.019
-
Source code 4
MATLAB script for OISMultitrialPaw.
OIS acquisition protocol for whisker/paw stimulation.
- https://doi.org/10.7554/eLife.29178.020
-
Source code 5
MATLAB script for OISAnalysis Average.
Calculates average data from 30 trials ad subtracts the baseline.
- https://doi.org/10.7554/eLife.29178.021
-
Source code 6
MATLAB script for OISOISDisplay.
Displays map as MATLAB figure.
- https://doi.org/10.7554/eLife.29178.022
-
Transparent reporting form
- https://doi.org/10.7554/eLife.29178.023
Download links
A two-part list of links to download the article, or parts of the article, in various formats.
Downloads (link to download the article as PDF)
Open citations (links to open the citations from this article in various online reference manager services)
Cite this article (links to download the citations from this article in formats compatible with various reference manager tools)
The E3 ubiquitin ligase IDOL regulates synaptic ApoER2 levels and is important for plasticity and learning
eLife 6:e29178.
https://doi.org/10.7554/eLife.29178


