Rift Valley fever phlebovirus NSs protein core domain structure suggests molecular basis for nuclear filaments
- University of St Andrews, United Kingdom
- MRC-University of Glasgow Centre for Virus Research, United Kingdom
Figures
Figure 1 with 1 supplement
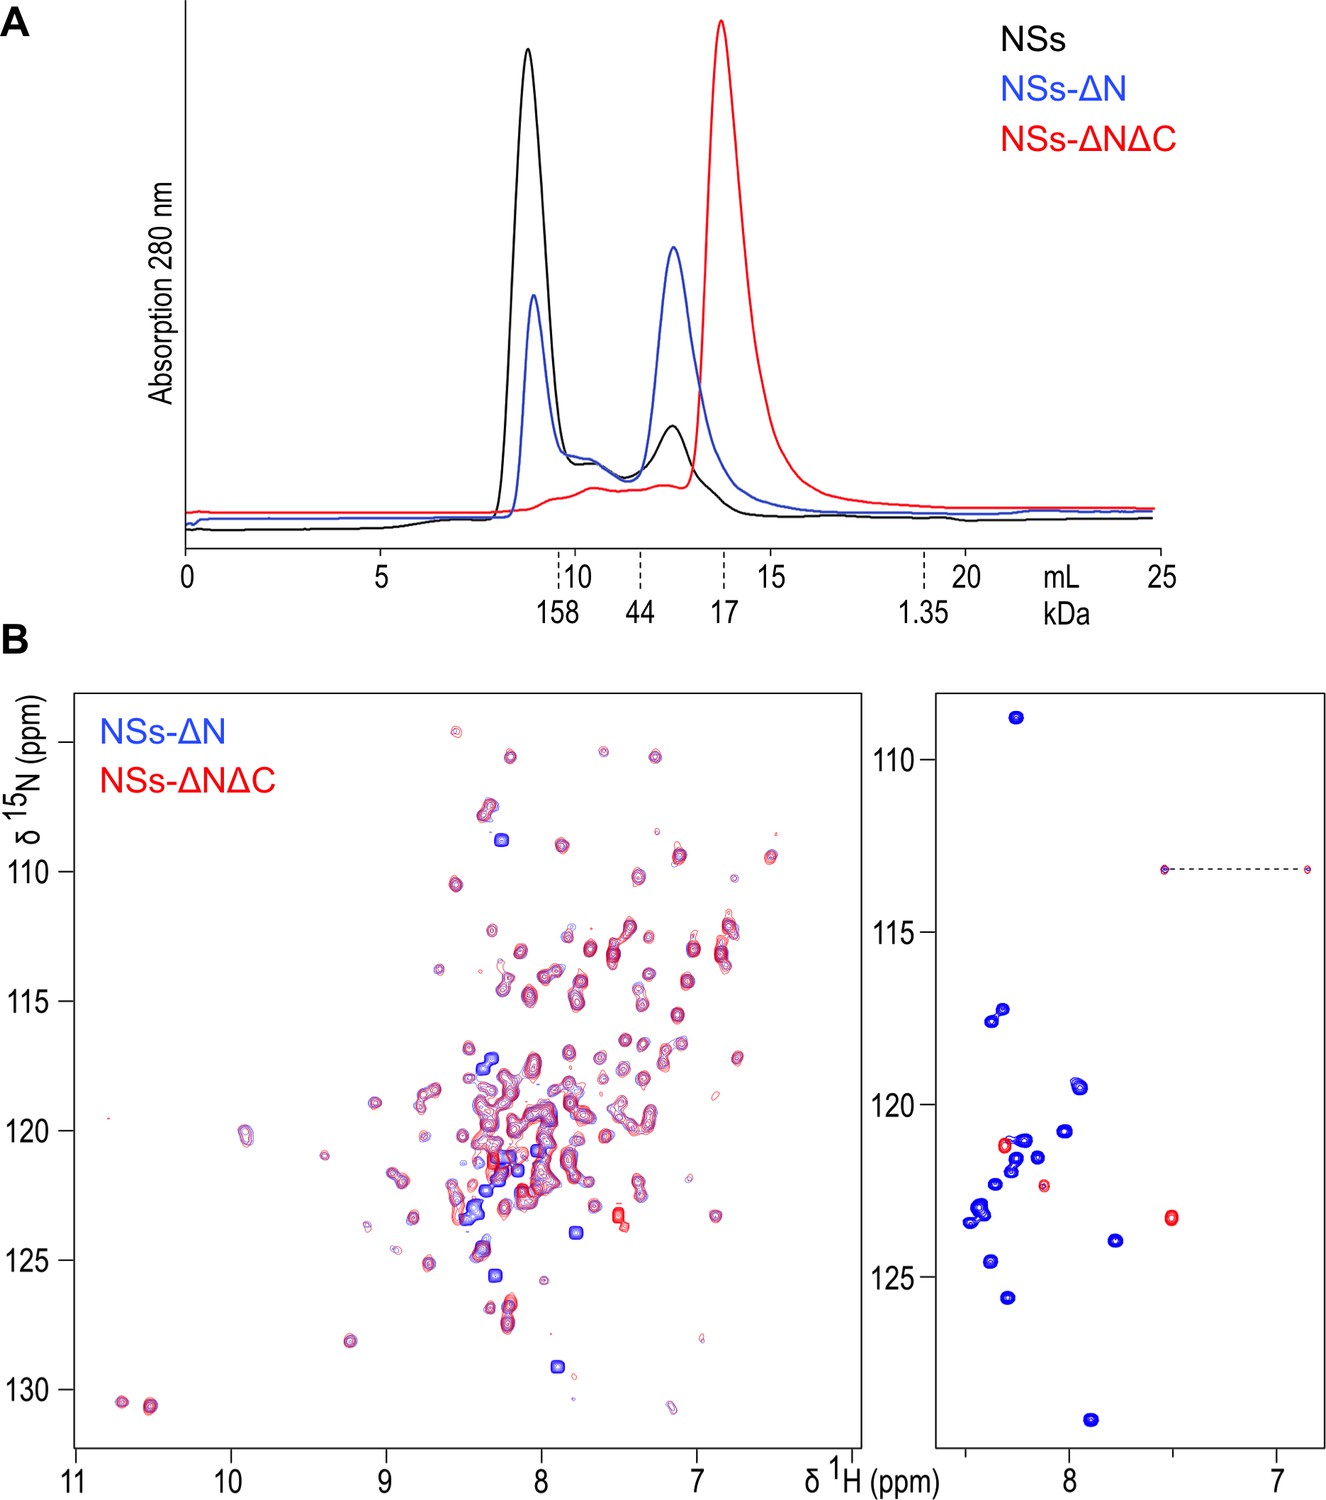
(A) Size exclusion chromatography elution traces of recombinantly expressed NSs variants, detected by UV absorption at 280 nm.
Elution volumes for molecular mass markers used for calibration of the column are indicated with dashed lines. (B) 1H-15N HSQC NMR spectra of NSs-ΔN (blue) and NSs-ΔNΔC (red) overlaid. The right-hand panel shows the central region of the spectra plotted at high contour levels, selecting a subset of intense crosspeaks representing highly dynamic amino acid residues, most of which are not present in NSs-ΔNΔC. The dashed line connects crosspeaks of one side-chain amide.
Figure 1—figure supplement 1
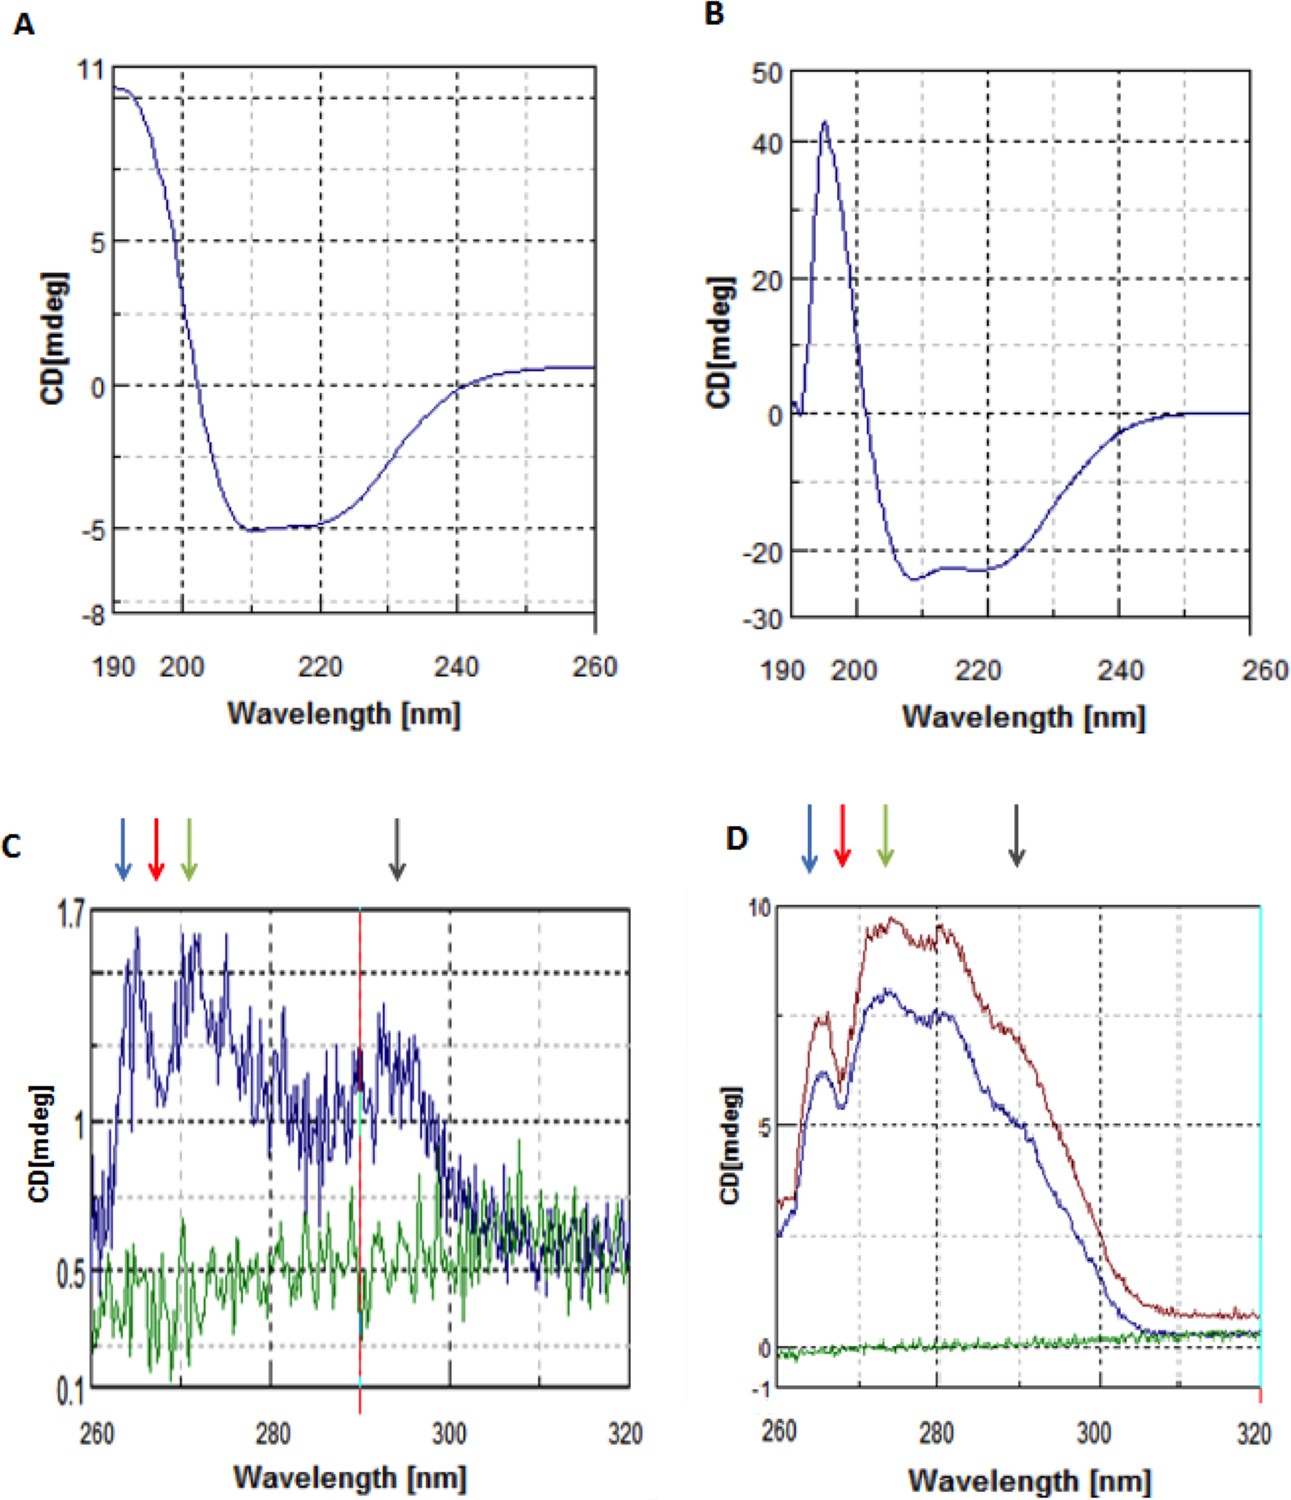
CD spectra of NSs.
(A) Far-UV CD spectrum of FL-NSs. (B) Far-UV CD spectrum of NSs-ΔN. (C) Near-UV CD of FL-NSs shows a weak but distinctive signal (blue) as compared with buffer (green), indicating presence of tertiary structure. (D) Near-UV CD of NSs-ΔN (blue), NSs-ΔNΔC (maroon) and buffer (green). Matching minima and maxima observed in spectra of all three NSs variants are indicated by colored arrows.
Figure 2 with 1 supplement
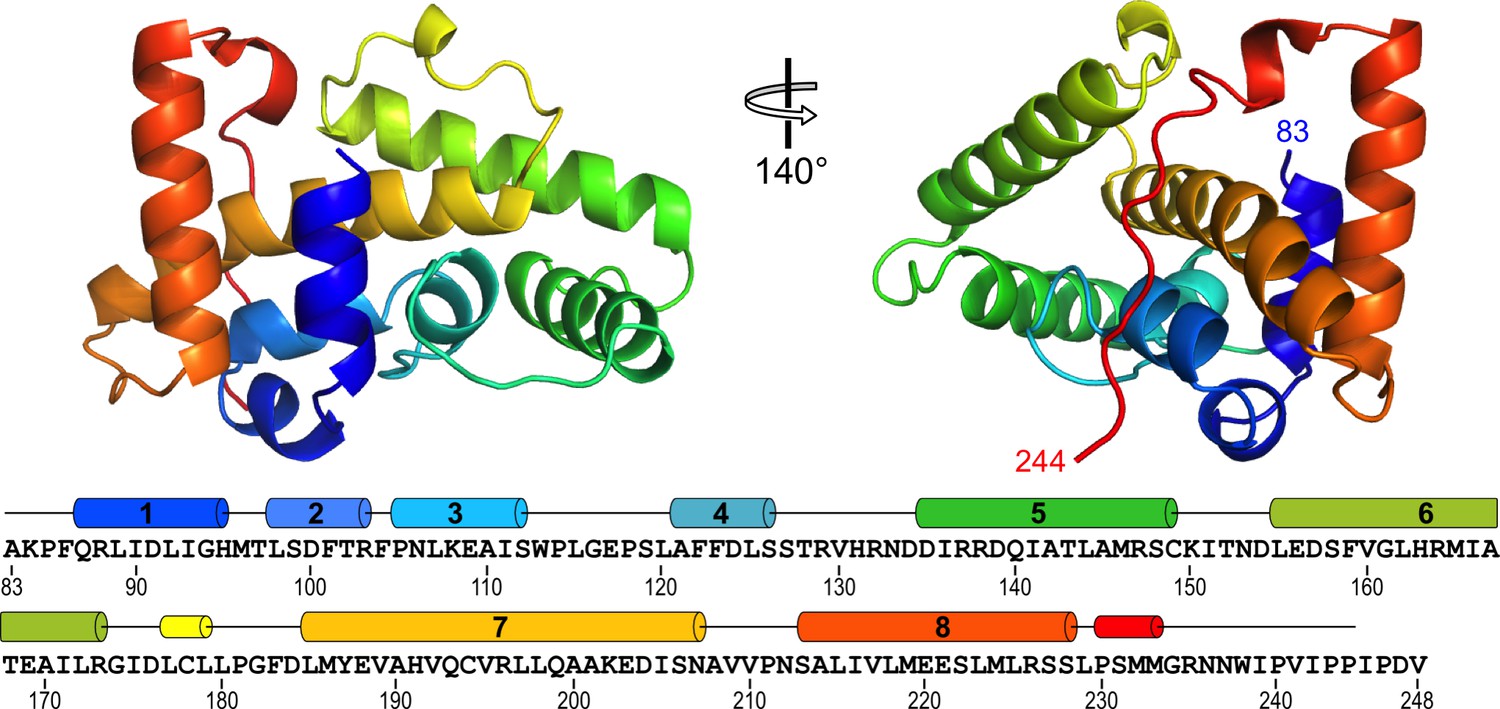
Structure of RVFV NSs-ΔNΔC.
The helical arrangement of NSs shows a novel fold, comprised mainly of eight α-helices. The protein chain is colored in a rainbow spectrum from the N-terminus to the C-terminus. At the bottom, secondary structure elements are matched with the sequence of NSs-ΔNΔC (residues 83–248 of NSs). Numbered cylinders represent α-helices; narrower cylinders represent 310 helices. Residues 244–248 are not defined in the crystal structure.
Figure 2—figure supplement 1
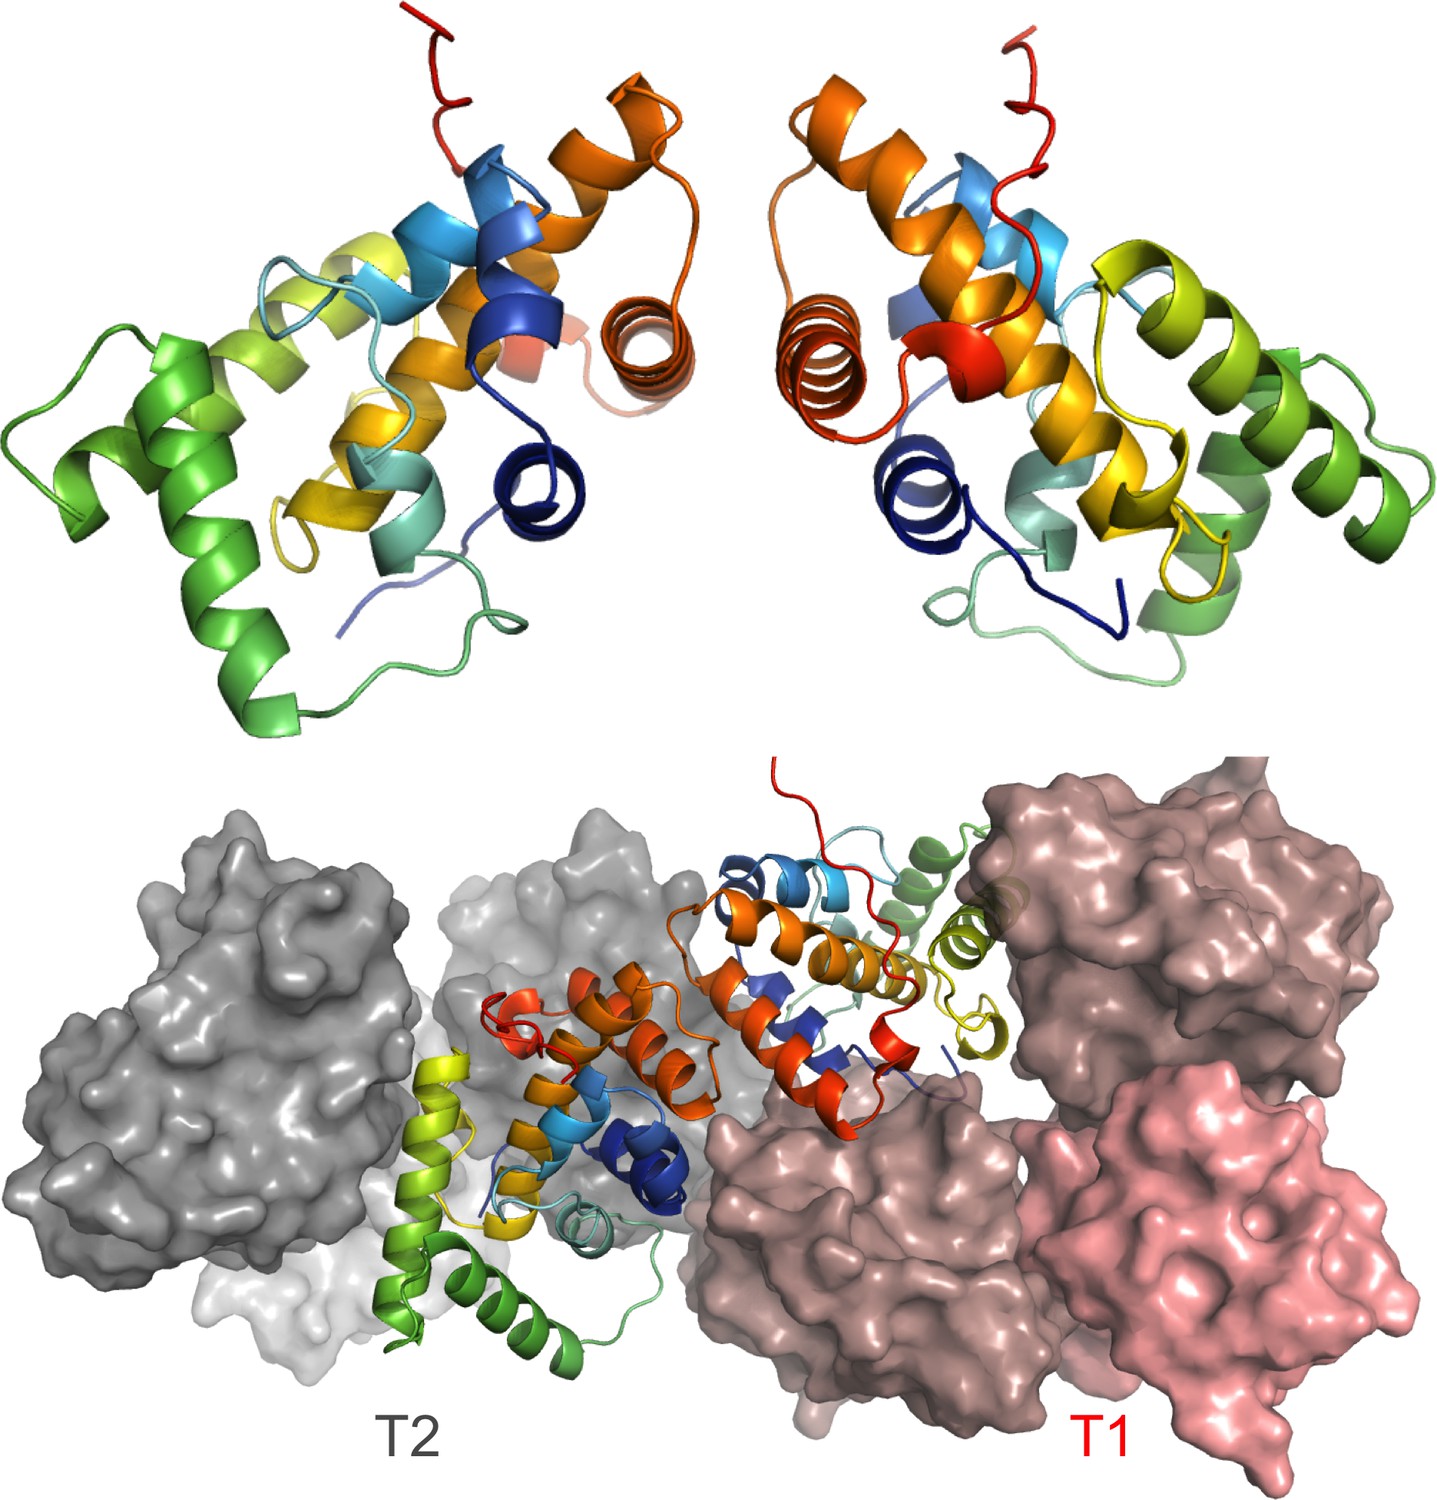
Asymmetric unit formed by two NSs molecules (colors as in Figure 2).
The bottom image shows the asymmetric unit in the context of the interface between F1 and F2 fibrils.
Figure 3 with 3 supplements
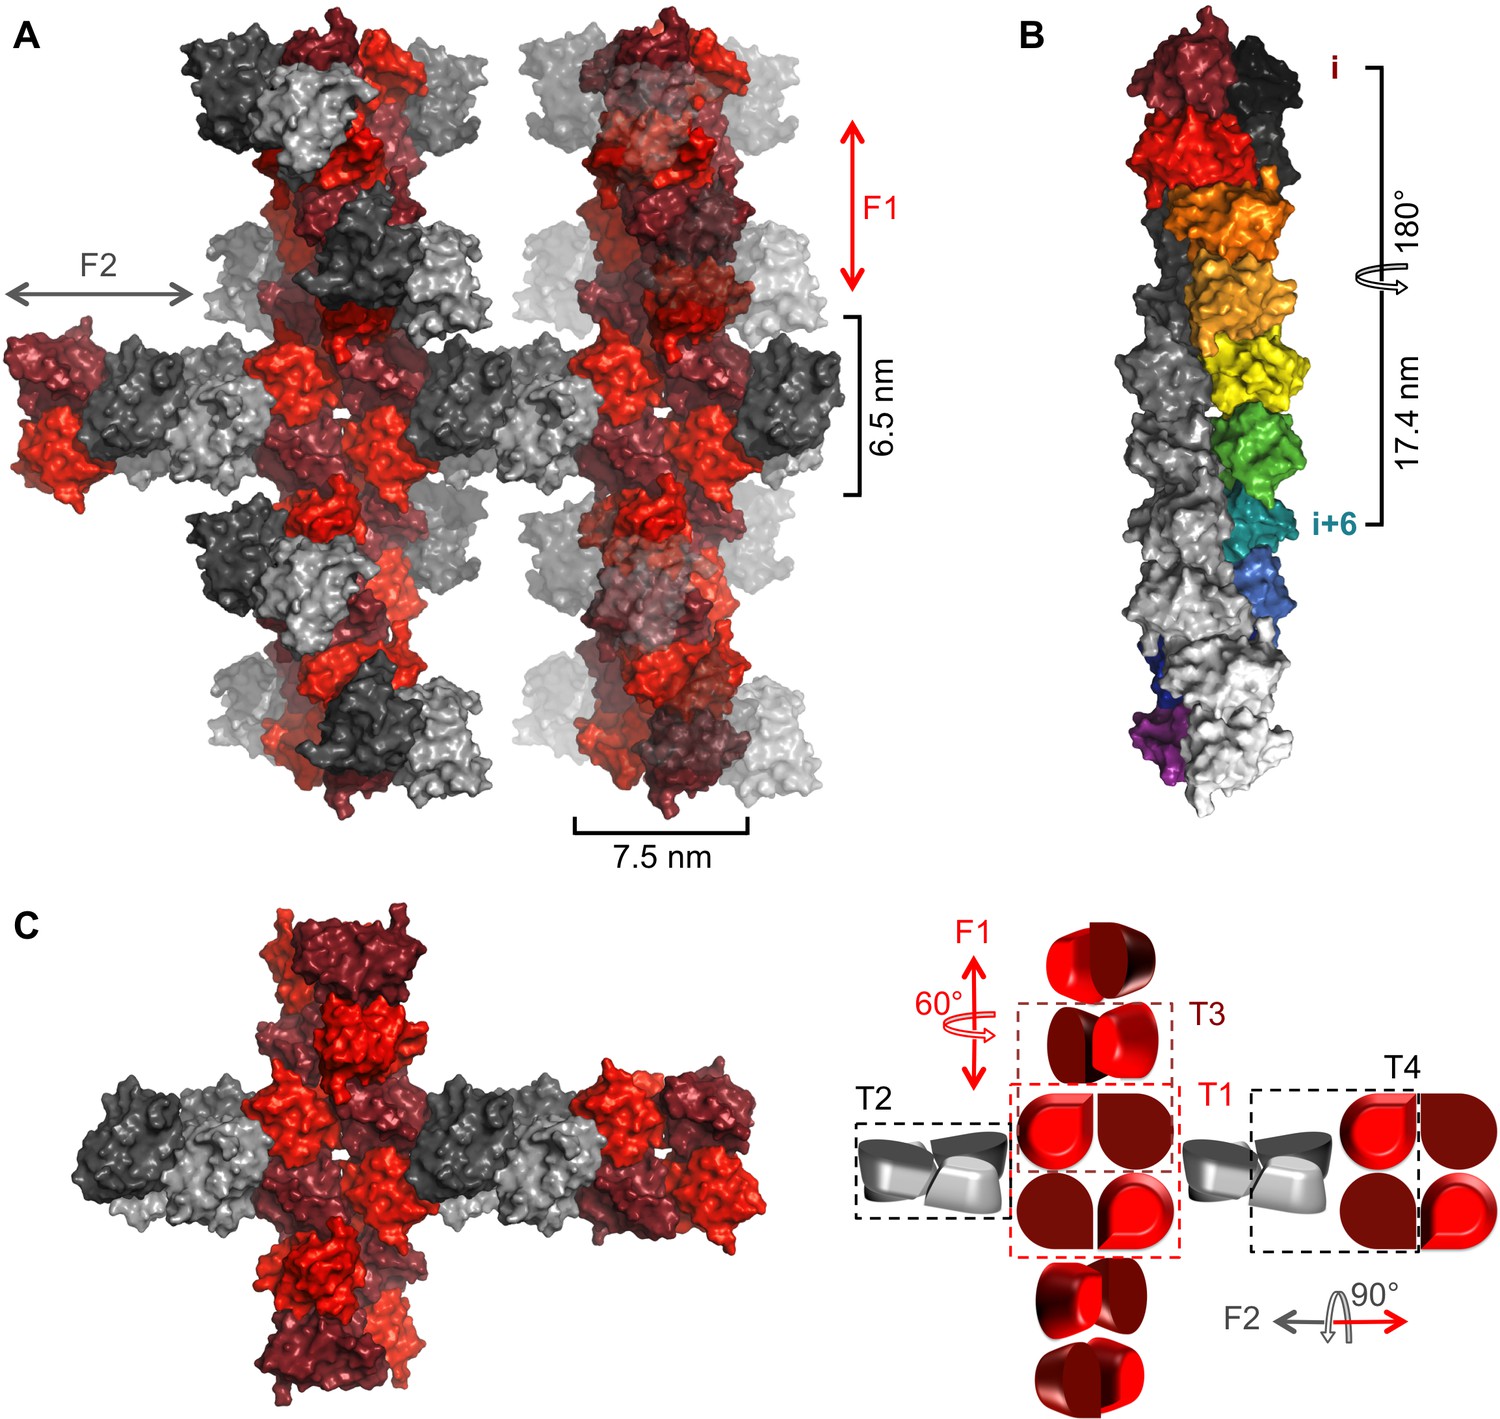
Crystal packing of NSs-ΔNΔC.
(A) Two fibrillar arrangements, F1 and F2, result from assemblies of alternative tetramers. Two F1 fibrils (vertical) are shown with alternating shades of red for individual molecules. One F2 fibril (horizontal) is shown with alternating shades of gray for individual molecules in F2-specific tetramers (T2, T4). F2 fibrils emerge from each F1 tetramer (T1) but for clarity only two F2 (gray) NSs-ΔNΔC molecules are shown at each node. F2 units are shown in transparent mode on the right hand side F1 fibril to highlight the architecture of F1 fibrils. (B) The F1 fibril is a double helix of NSs-ΔNΔC monomers with 2-fold symmetry around the fibril axis and 6 molecules per 180° turn. A section of the F1 fibril containing five T1 tetramers is shown. One half of the double helix resulting from tetramer stacking is rainbow-colored, the other half is shown in shades of grey. (C) A simplified representation of a node between F1 and F2 fibrils highlights the architecture of F1 and F2 fibrils and the four different tetramers T1-T4.
Figure 3—figure supplement 1
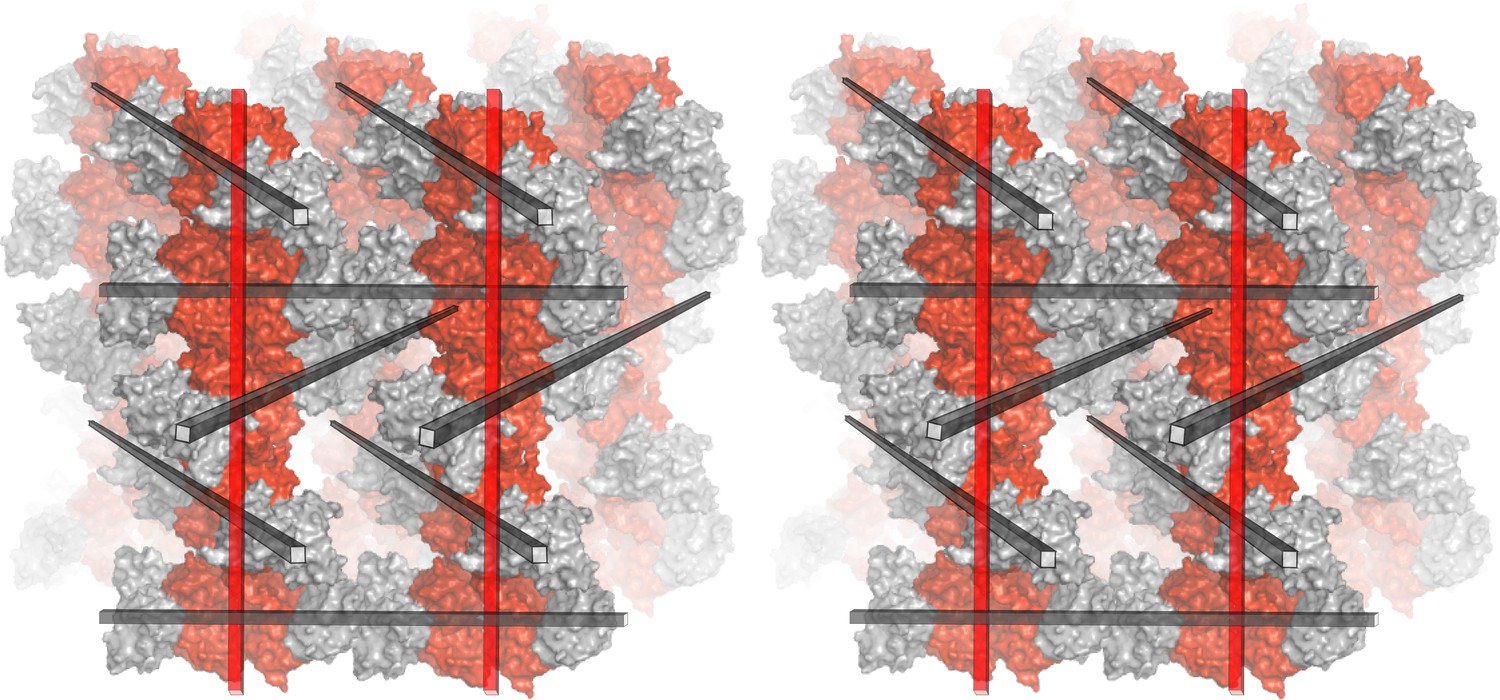
Molecular packing in the NSs-ΔNΔC crystal lattice (wall-eye stereo image).
T1 and T2 tetramers are shown in red and gray surface representation, respectively. Parallel F1 fibers (indicated by red rods) are perpendicular to F2 fibers (indicated by gray rods) which are arranged at 60° angles with respect to each other.
Figure 3—figure supplement 2
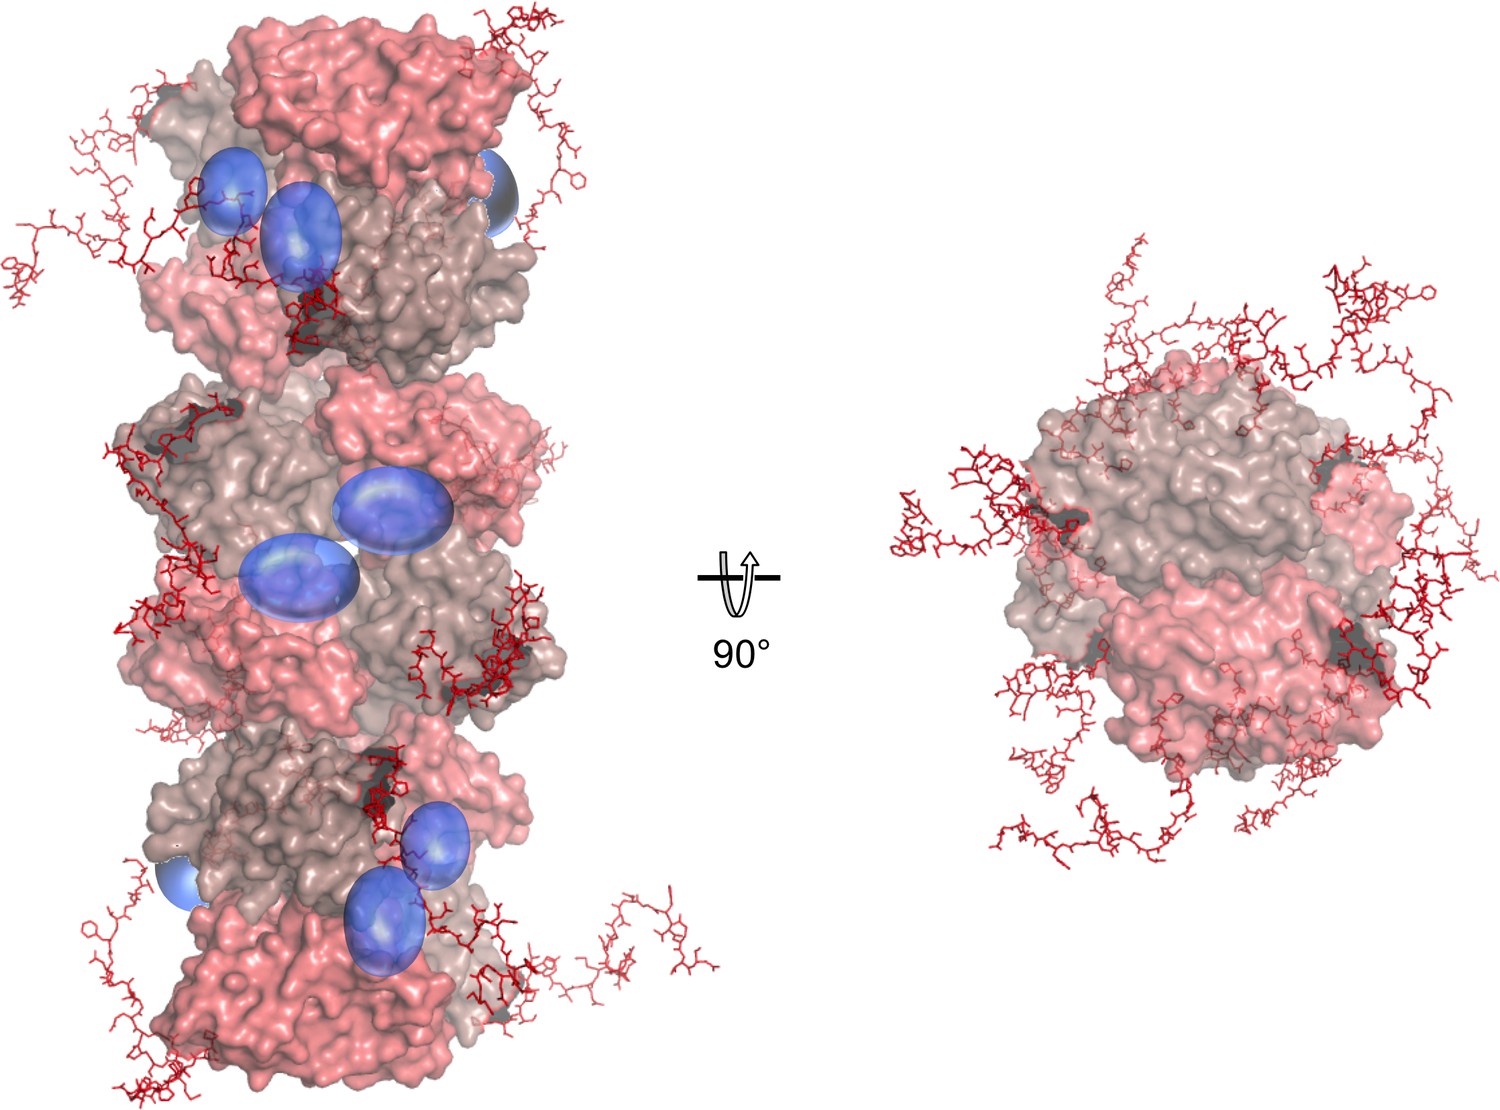
Model of a full-length NSs fibril with the NSs-ΔNΔC F1 assembly as core (shown in surface representation).
The C-terminal extensions are modeled in as natively unfolded regions in random orientations (red sticks). N-terminal regions are shown as blue transparent spheres.
Figure 3—figure supplement 3
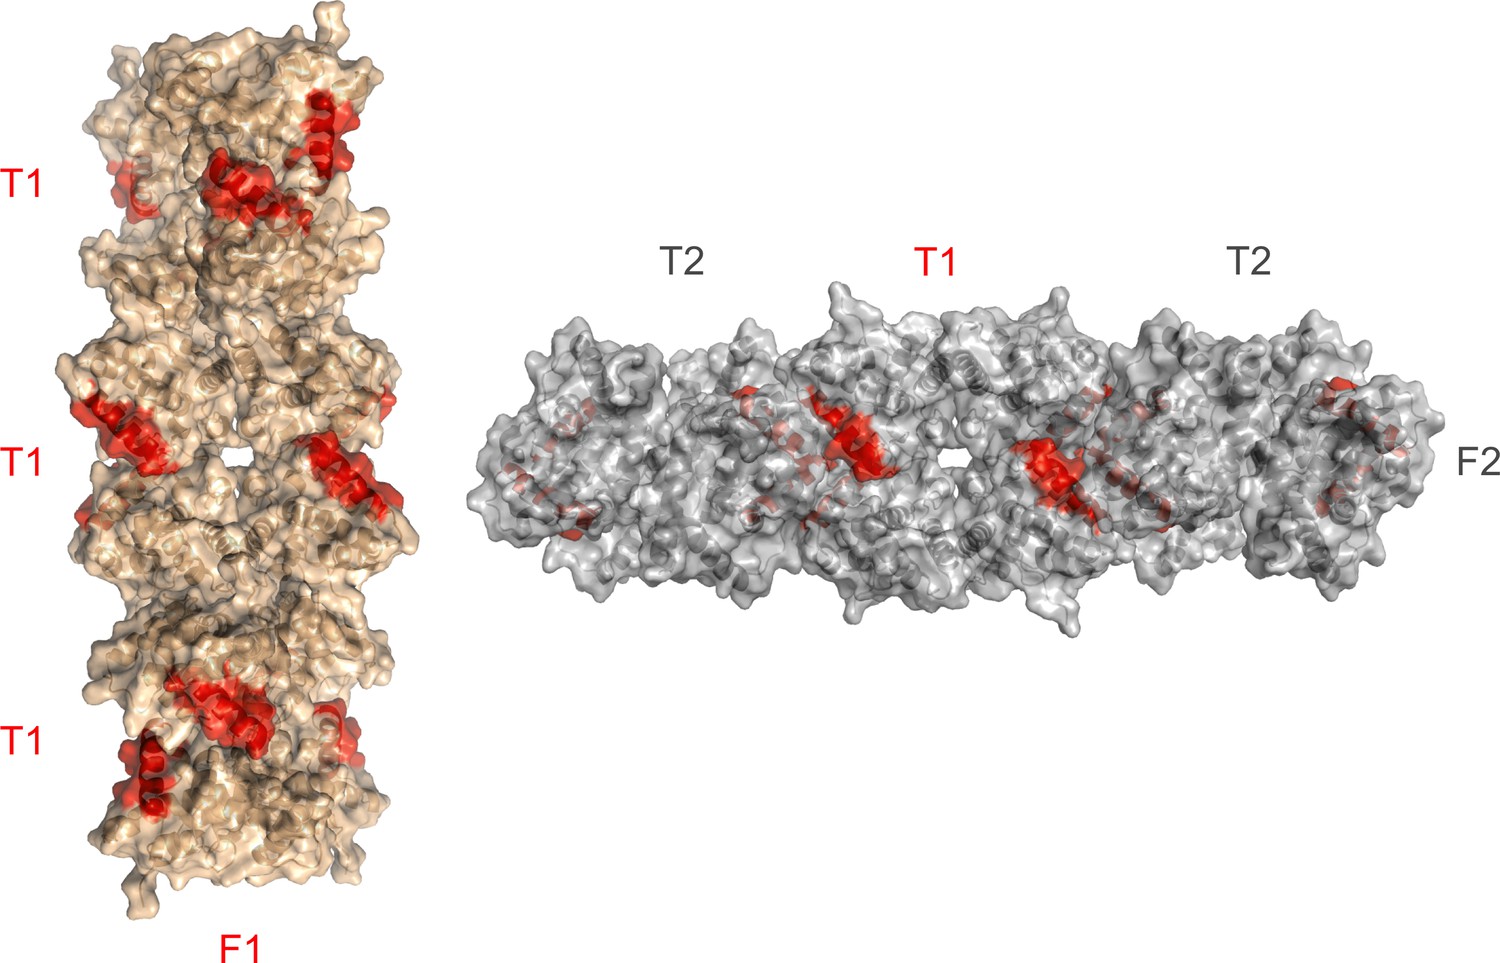
Accessibility of the α8 helix (red) in F1 and F2 fibrillar crystal assemblies.
The helix is partially buried at the T1-T2 interface in F2.
Figure 4 with 2 supplements
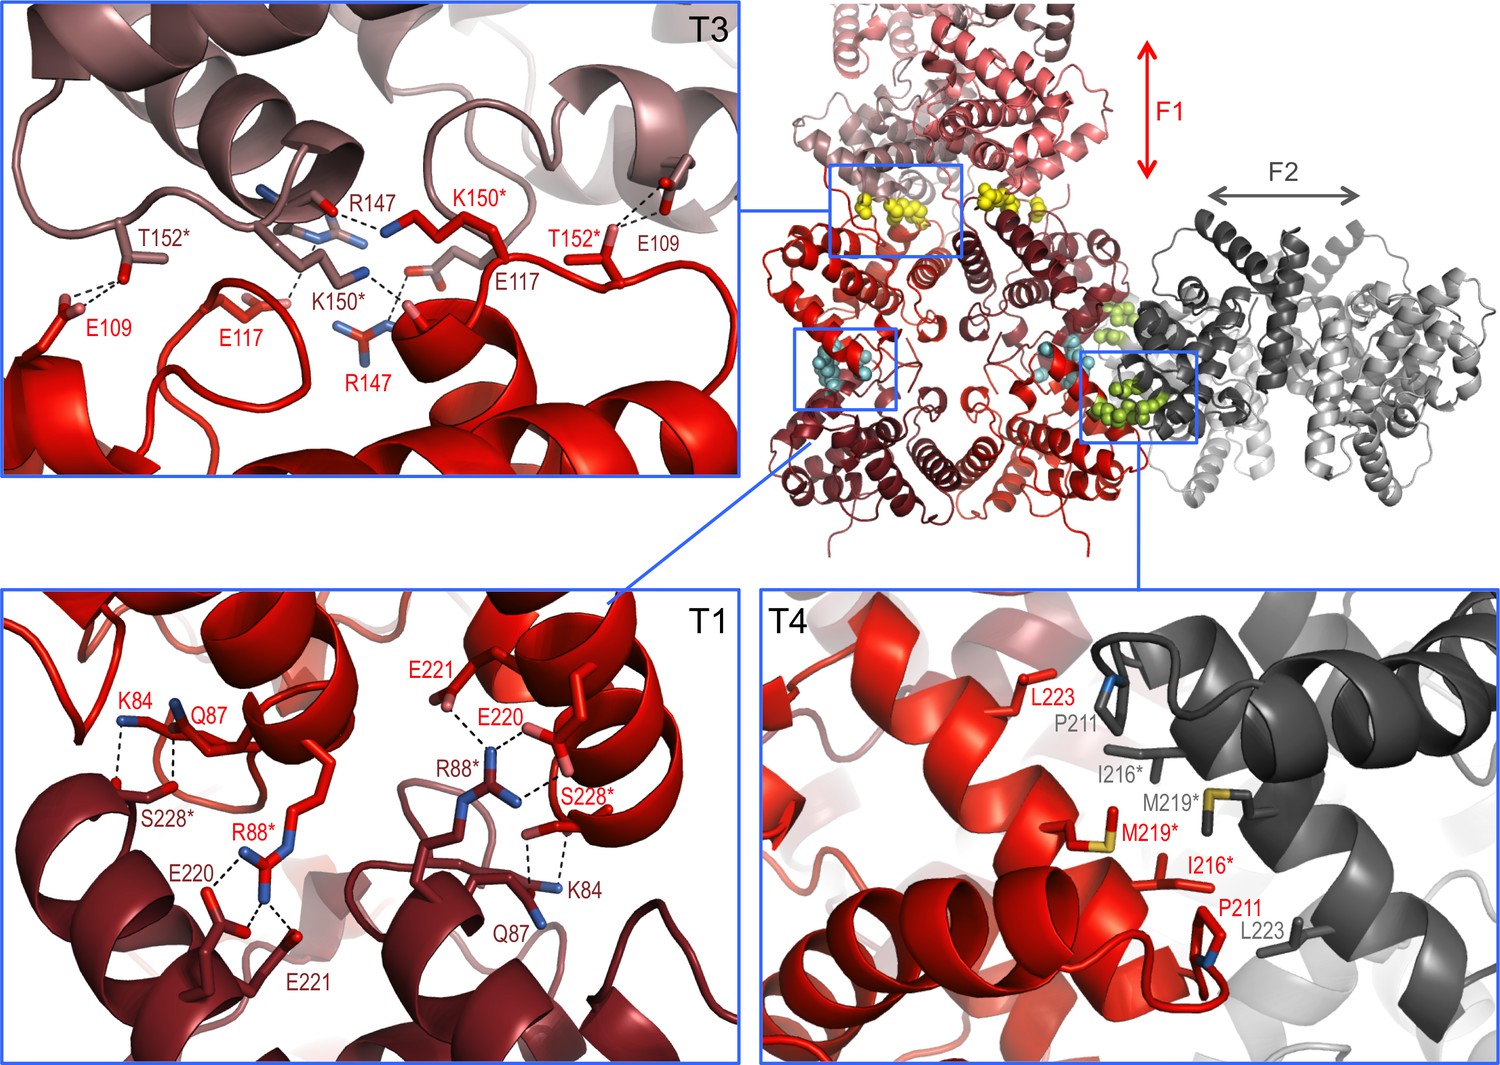
Interaction interfaces within the F1 and F2 fibrils observed in the NSs-ΔNΔC crystal.
In the overview of an F1/F2 node (top right) key interface residues targeted by mutagenesis are shown as cyan, yellow and lime spheres for interfaces in T1, T3 and T4, respectively. Expanded regions highlight the residues involved in the three different interfaces. H-bond networks and salt bridges (dashed black lines) stabilize the interfaces for T3 and T1. The α8-α8 interface in T4 is defined by hydrophobic interactions. Residues changed by mutagenesis are marked by asterisks.
Figure 4—figure supplement 1
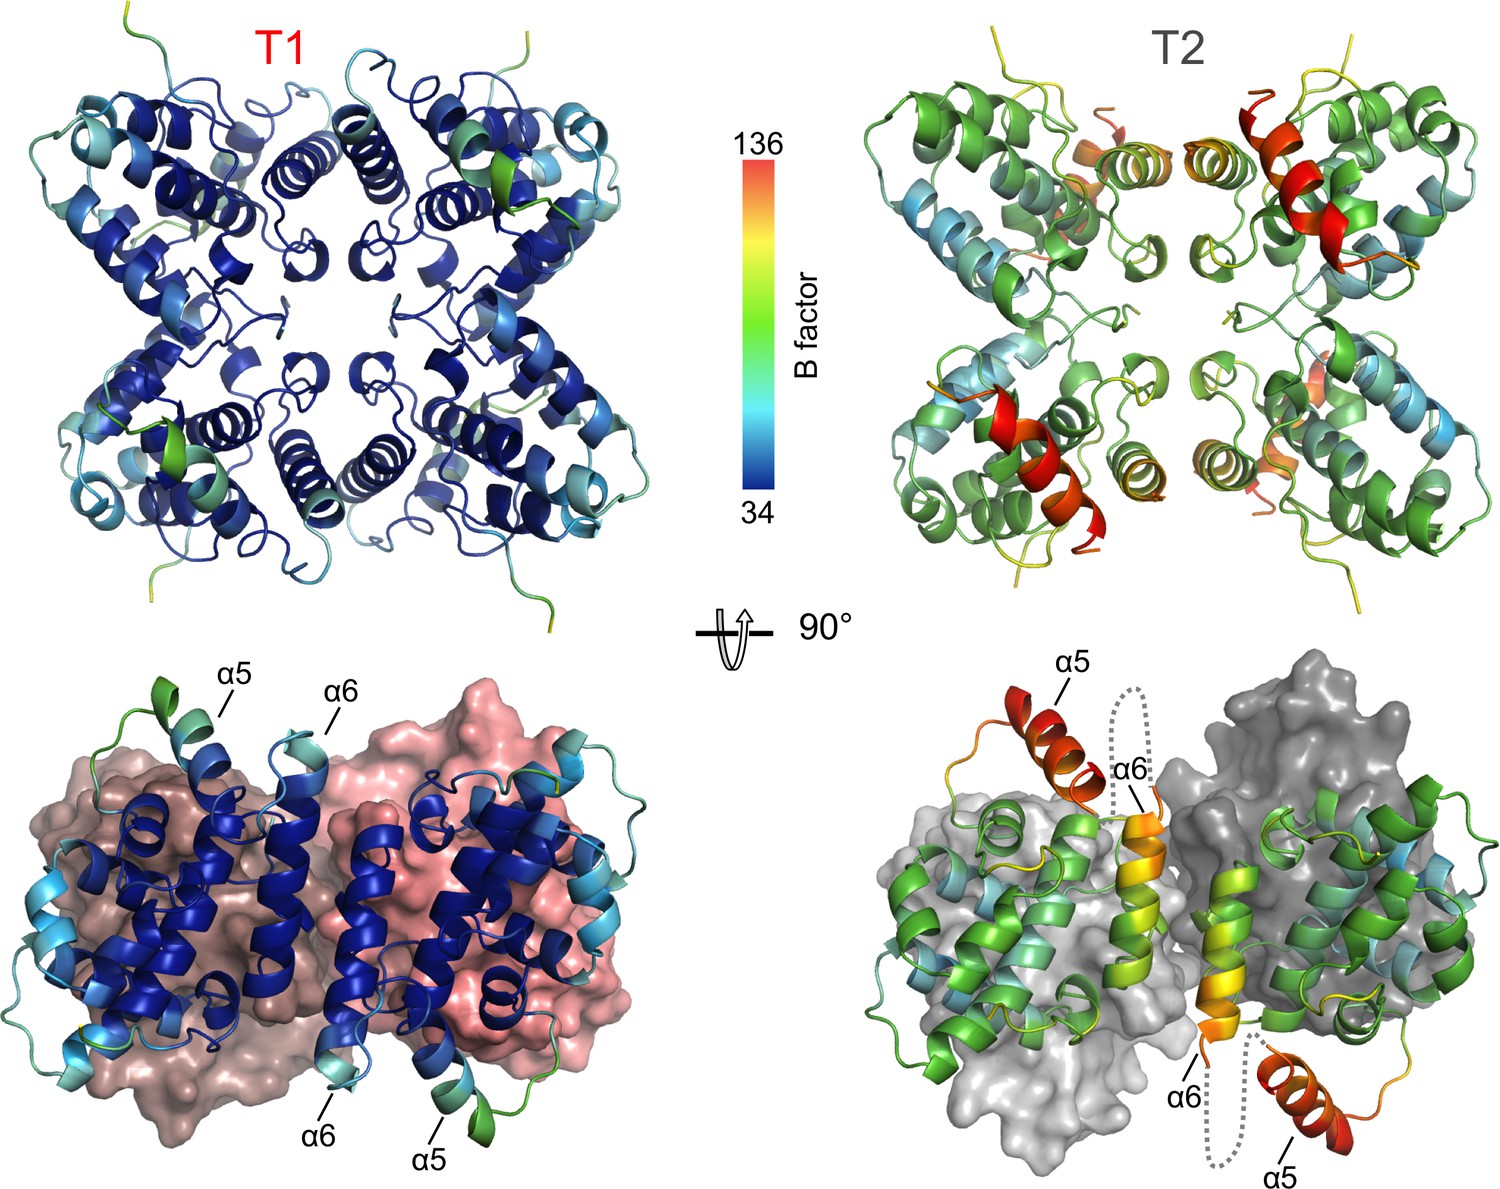
Comparison of T1 and T2 tetramers.
The ribbon diagrams are rainbow colored according to B factors. The α5-α6 loop is not visible in the crystal structure for the T2 assembly.
Figure 4—figure supplement 2
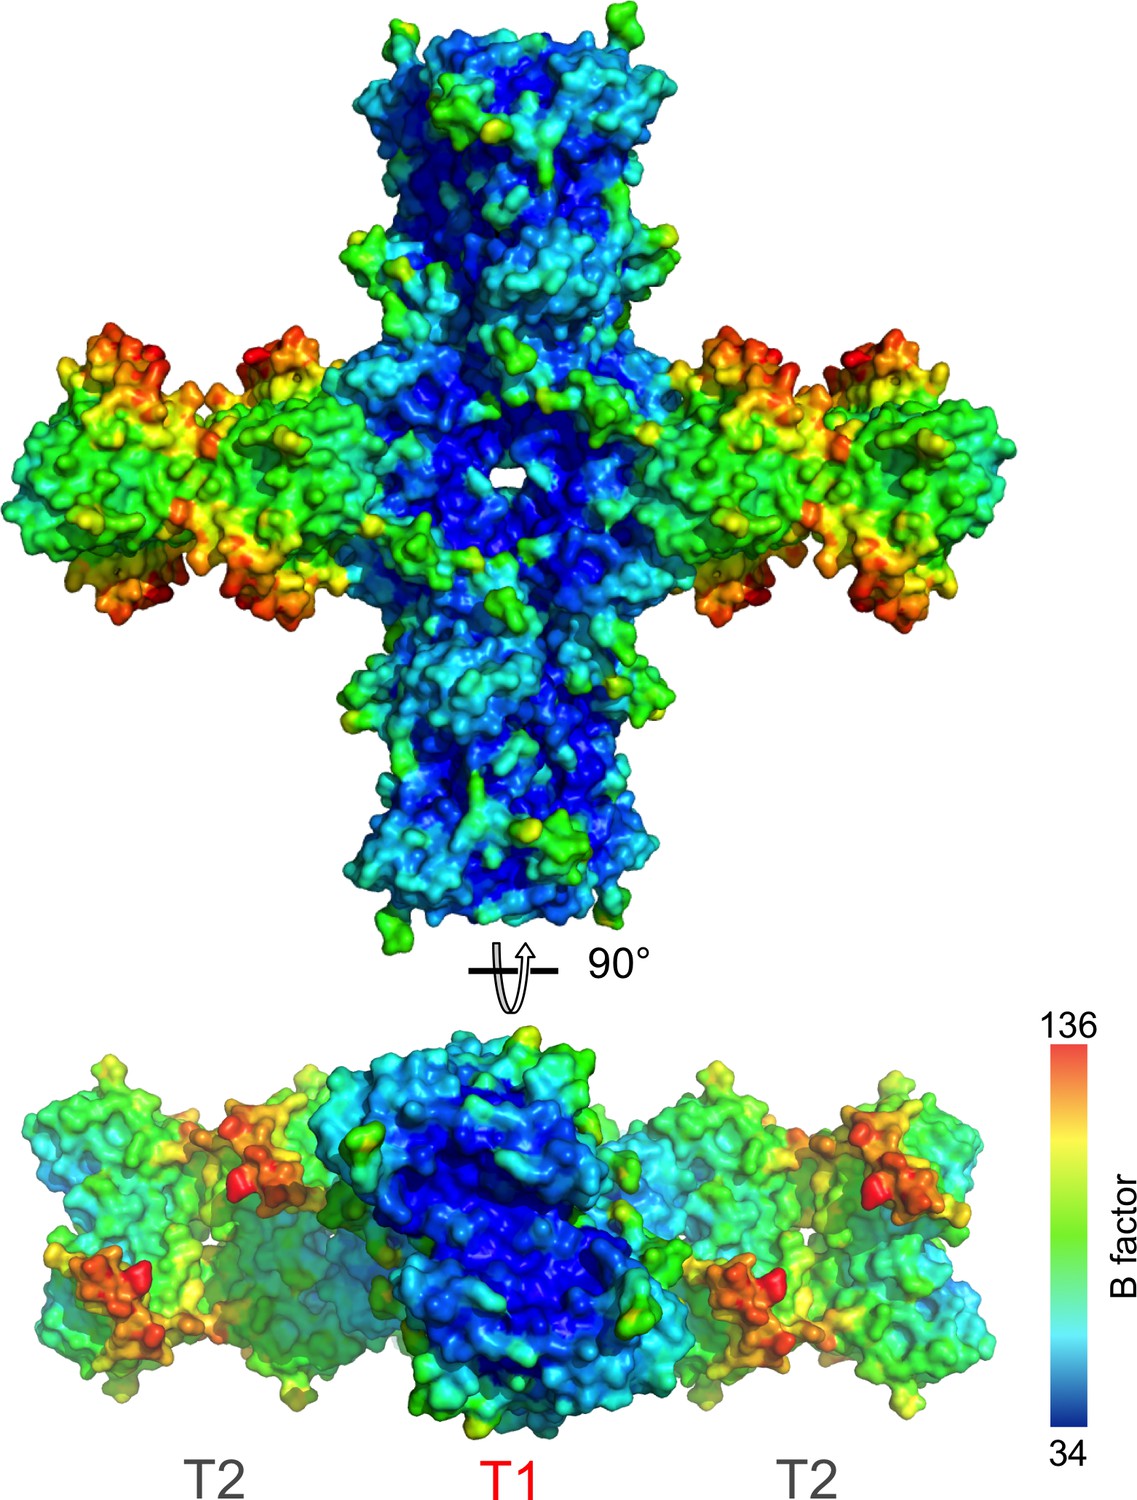
B-factor distribution in the NSs fibrillar crystal assembly.
https://doi.org/10.7554/eLife.29236.014
Figure 5
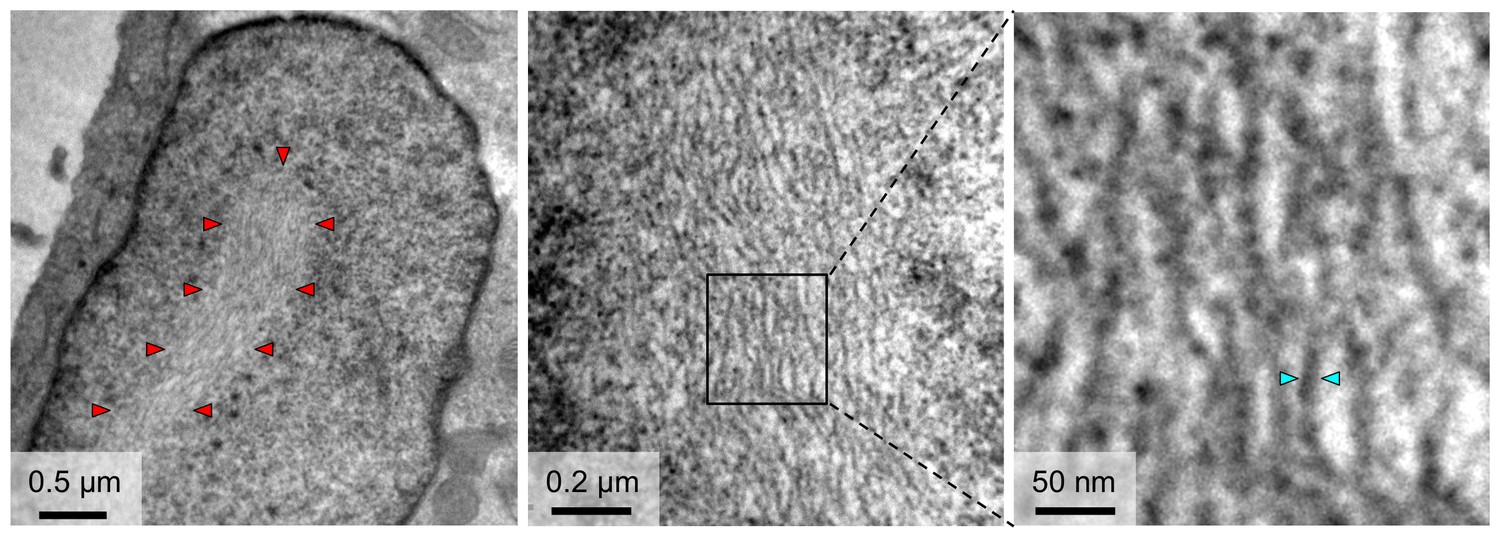
TEM observations of fibrils formed in the nuclei of cells infected with RVFV.
The outline of an NSs filament within a cell nucleus is indicated in the left panel by red arrowheads. Higher magnifications (middle and right panels) reveal a substructure of NSs filaments, which are composed of bundles of parallel fibrils with estimated widths of 8–15 nm. Cyan arrowheads in the right panel indicate one fibril with a width of 10 nm.
Figure 6
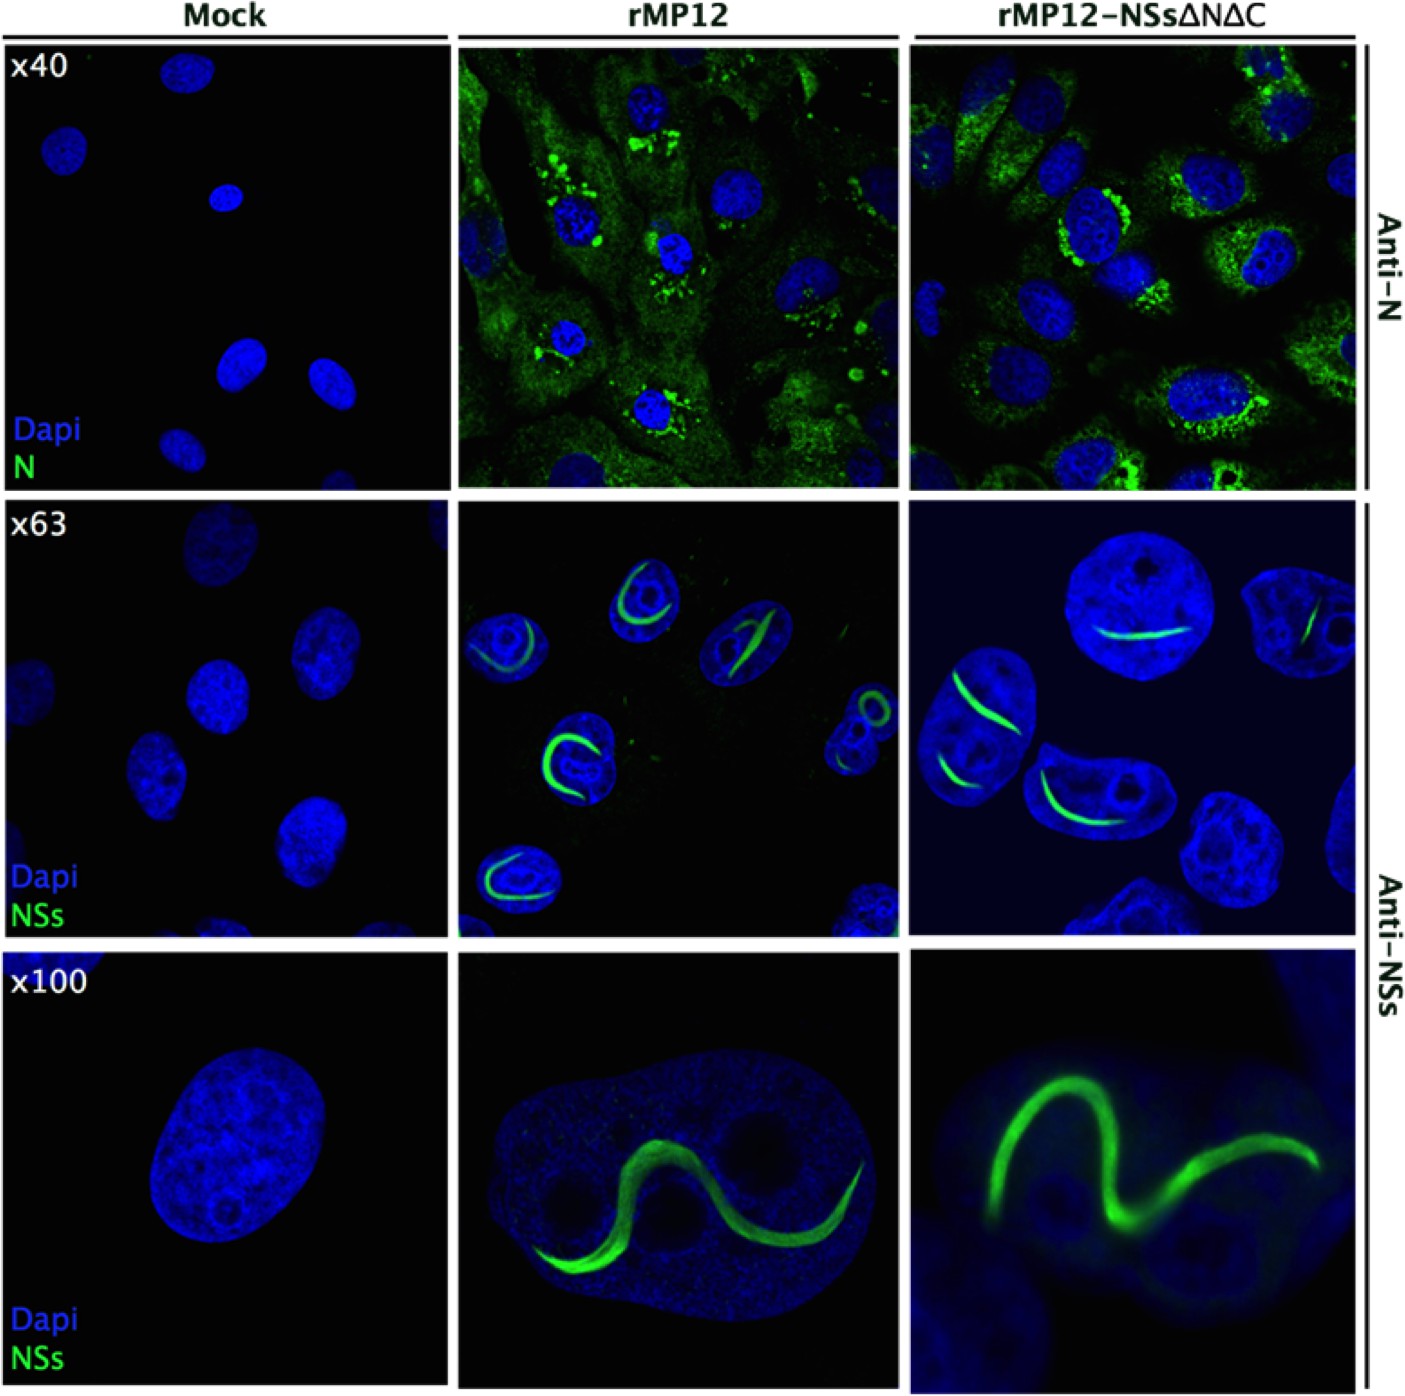
Intracellular localization of NSs in rMP12- or rMP12NSs-ΔNΔC-infected Vero-E6 cells.
Cells were fixed 24 h p.i. and co-stained with either anti-N or anti-NSs antibodies (green) as indicated and DAPI (blue).
Figure 7 with 1 supplement
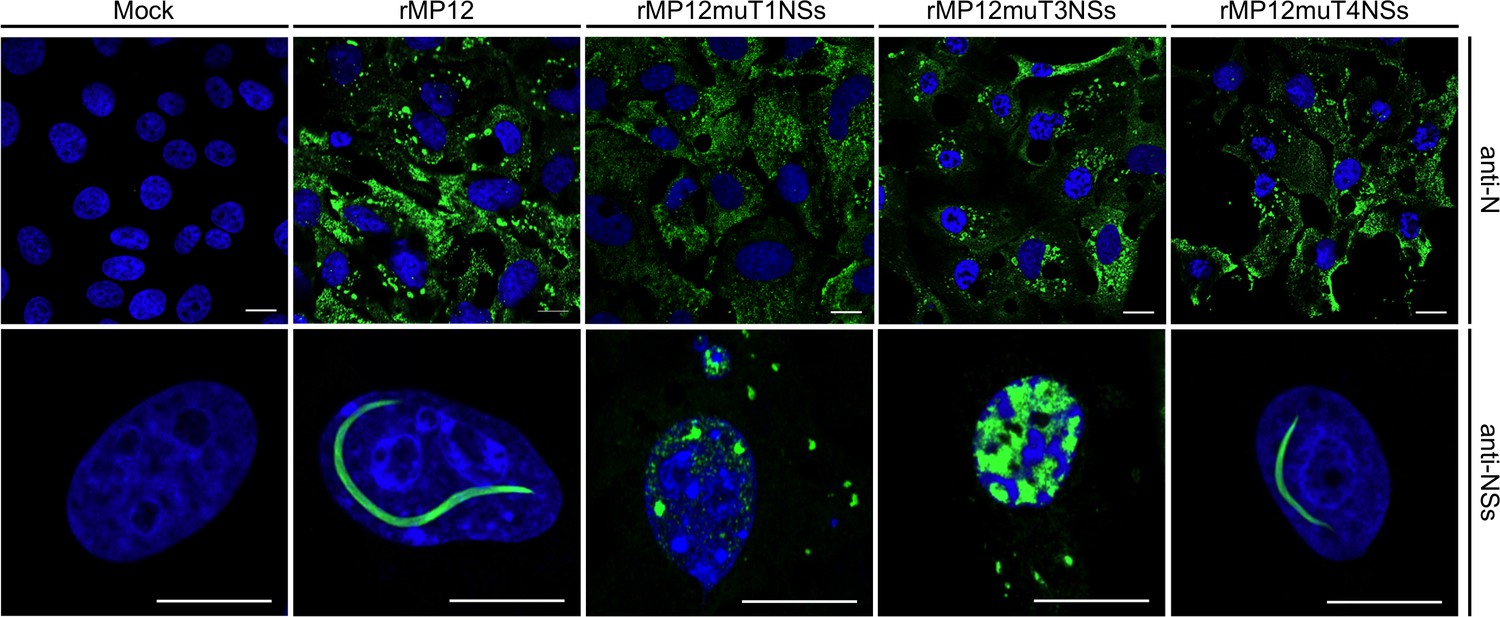
Intracellular localization of NSs in Vero-E6 cells infected with rMP12 or rMP12 variants encoding NSs variants with interface residue mutations (muT1, muT3, muT4).
Cells were fixed 24 h p.i. and co-stained with either anti-N or anti-NSs antibodies (green) as indicated and DAPI (blue).
Figure 7—figure supplement 1
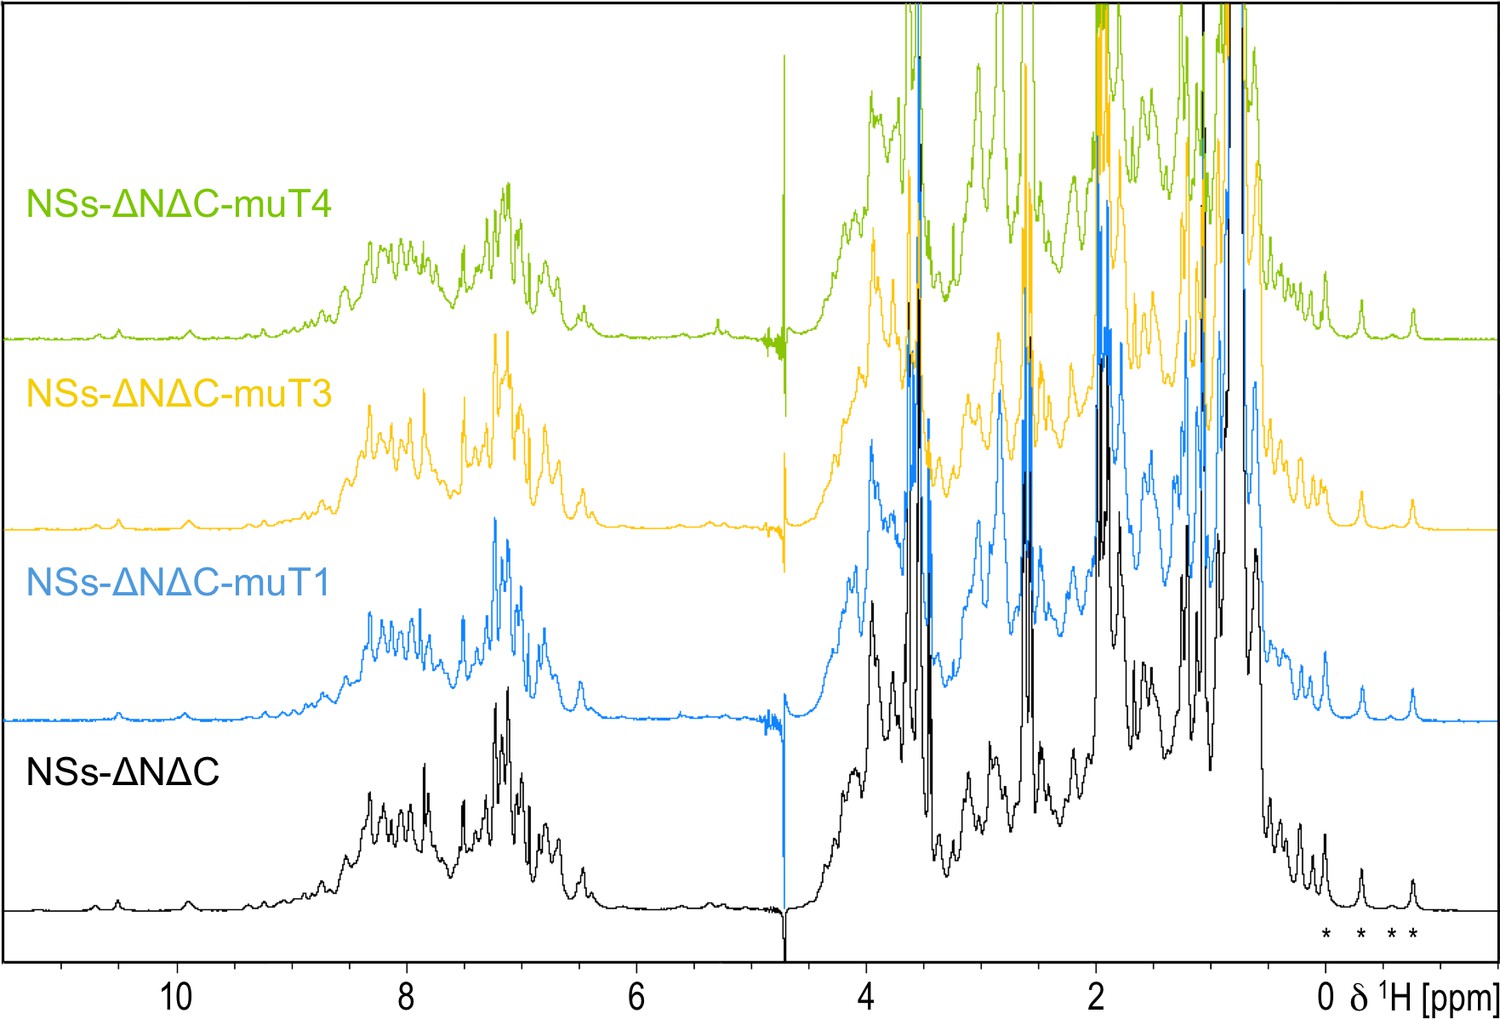
1D 1 hr NMR spectra of NSs-ΔNΔC and interface mutation variants.
Asterisks indicate distinct high-field shifted methyl resonances with conserved chemical shifts in all variants.
Figure 8
Sequence alignment of NSs proteins from human-pathogenic phleboviruses (SFTS, severe fever with thrombocytopenia syndrome virus).
Secondary structure elements for RVFV-NSs are shown on top of the alignment panels. For the N-terminal domain (top panel) these are based on secondary structure prediction by JPred4 (Drozdetskiy et al., 2015) (dashed lines). Sequence similarity is indicated by gray shading for residues conserved or similar in at least 80% of sequences. Regions displayed in gray font are not aligned. Secondary structure predictions are also shown below each panel for Toscana virus and SFTS virus NSs.
Tables
Table 1
Data collection and refinement statistics
https://doi.org/10.7554/eLife.29236.005| Data collection | |
|---|---|
| Space group | P6422 |
| Cell dimensions a, b, c (Å) α, β, γ (°) | 123.8, 123.8, 174.0 90, 90, 120 |
| Beamline | Diamond i03 |
| Wavelength (Å) | 2.0 |
| Resolution (Å) | 107.83–2.19 (2.25–2.19) |
| Number of observed reflections | 1877448 |
| Number of unique reflections | 41684 |
| Completeness (%) | 99.9 (99.9) |
| Rmerge (%) * | 9.8 (223.4) |
| I/δ | 32.3 (1.6) |
| Multiplicity | 45.0 (18.2) |
| Anomalous completeness (%) | 99.9 (99.8) |
| Anomalous multiplicity | 23.7 (9.4) |
| Anomalous slope | 1.169 |
| Refinement statistics | |
| Rwork (%) † | 20.1 |
| Rfree (%) ‡ | 21.6 |
| Ramachandran favored (%) | 97.24 |
| Ramachandran allowed (%) | 99.08 |
| MolProbity score/percentile § | 1.61/97 |
| Averaged B-factor (Å2) | 63.47 |
| Rmsd bond length (Å) | 0.905 |
| Rmsd bond angles (°) | 1.007 |
-
The values in parenthesis refer to the highest resolution shell.
* where is the intensity of an individual measurement of a reflection and is the average intensity of that reflection.
-
† where are the observed and calculated structure factors, respectively.
‡ Rfree is Rwork with 5% of the observed reflections removed before refinement.
-
§ MolProbity score combines the clashscore, rotamer, and Ramachandran evaluations into a single score, normalized to be on the same scale as X-ray resolution. 100th percentile is the best among structures of comparable resolution; 0th percentile is the worst. For clashscore the comparative set of structures was selected in 2004, for MolProbity score in 2006 (Chen et al., 2010).
Table 2
Summary of PISA analyses of buried surface areas and ΔG values of the four unique NSs-ΔNΔC tetramers present in the crystal lattice. ΔGsol and ΔGdiss are free energy of solvation (negative values indicate favorable process), and free energy of dissociation of assembly (positive values indicate stable association), respectively.
https://doi.org/10.7554/eLife.29236.015| Buried surface [Å2] | ΔGsol [kcal/mol] | ΔGdiss [kcal/mol] | |
|---|---|---|---|
| T1 | 5631 | −33.1 | 10.6 |
| T2 | 4654 | −26.4 | 1.6 |
| T3 | 4358 | −25.2 | −3.0 |
| T4 | 4892 | −23.9 | 2.6 |
Additional files
-
Transparent reporting form
- https://doi.org/10.7554/eLife.29236.021
Download links
A two-part list of links to download the article, or parts of the article, in various formats.
Downloads (link to download the article as PDF)
Open citations (links to open the citations from this article in various online reference manager services)
Cite this article (links to download the citations from this article in formats compatible with various reference manager tools)
Rift Valley fever phlebovirus NSs protein core domain structure suggests molecular basis for nuclear filaments
eLife 6:e29236.
https://doi.org/10.7554/eLife.29236


