Dual function of the PI3K-Akt-mTORC1 axis in myelination of the peripheral nervous system
- Institute of Molecular Health Sciences, Swiss Federal Institute of Technology, Switzerland
Figures
Figure 1 with 2 supplements
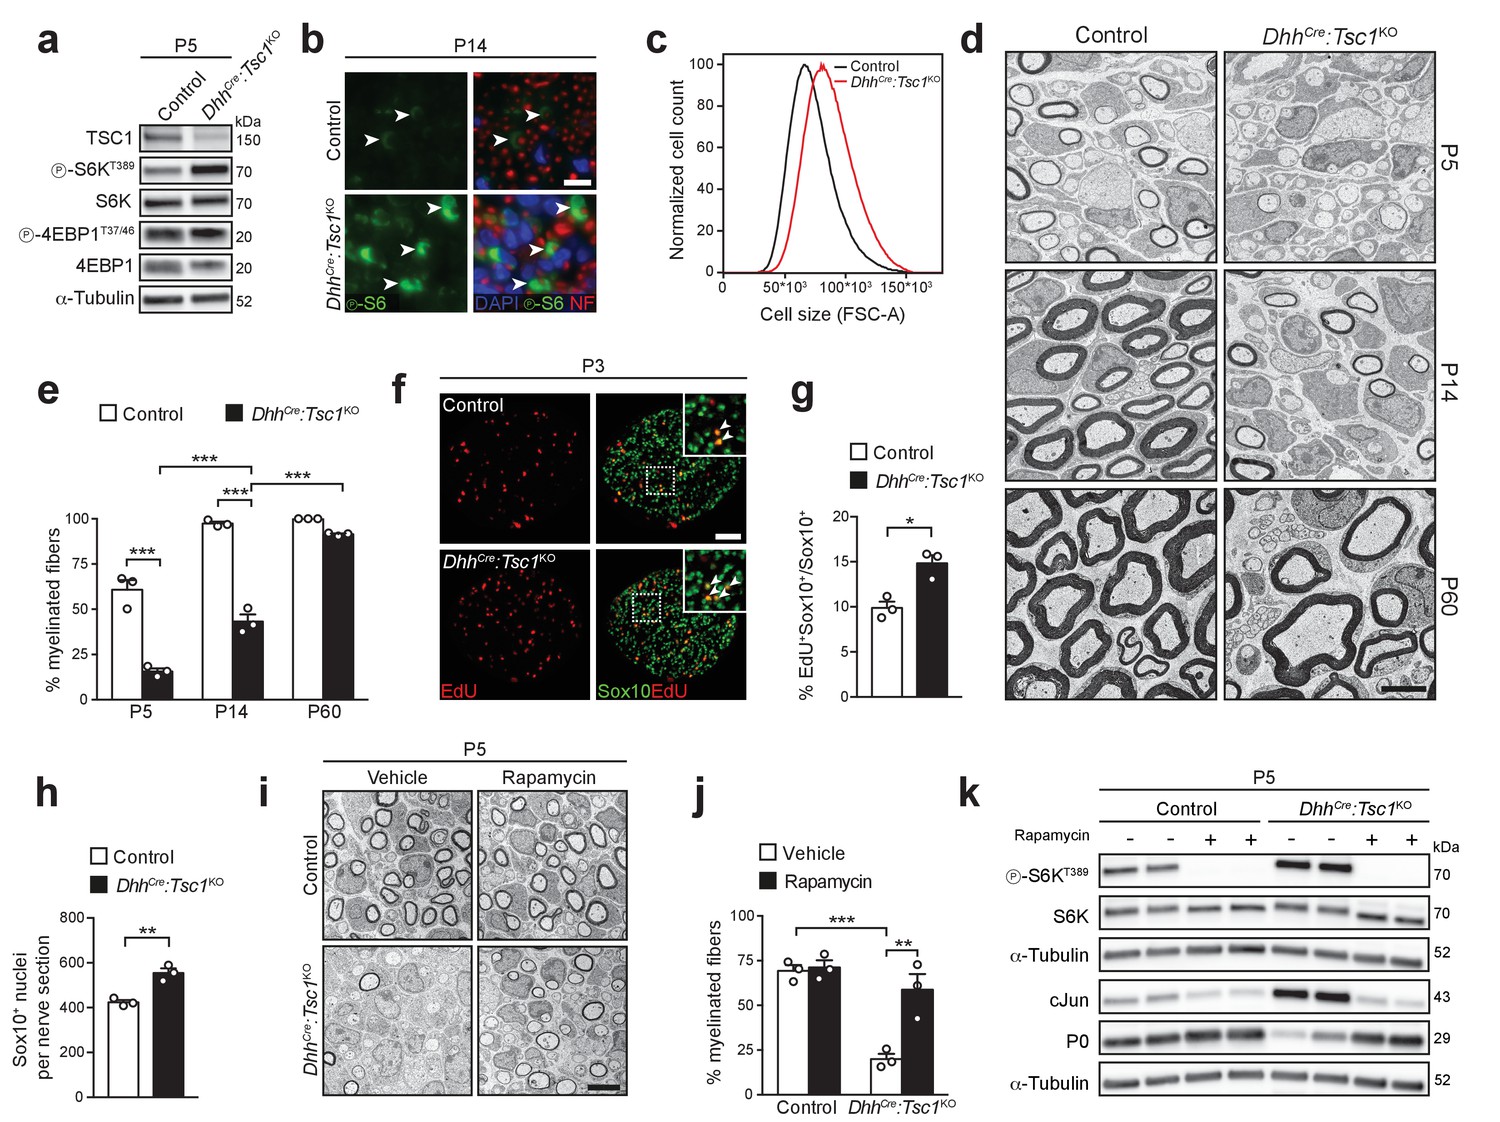
High mTORC1 signaling following TSC1 deletion delays SC myelination.
(a) Western blot analysis, sciatic nerve lysates of P5 controls and littermates DhhCre:Tsc1KO (mutant) animals (n = 3 mice/genotype). Quantification: Figure 1—figure supplement 1a. (b) Immunostaining, P14 sciatic nerve cross sections (n = 3 control/4 mutant mice). Arrowheads indicate phospho-S6 positive cells. NF: neurofilament. Nuclei: DAPI. Scale bar: 10 μm, refers to whole panel. (c) Flow-cytometry profile of DRG-derived SCs (n = 4 individual experiments with four independent cell preparations). A representative experiment is shown. FSC-A: Forward Scatter Area. (d) Electron micrographs of sciatic nerve cross sections of controls and littermate mutants at different time points (n = 3 mice/genotype). Scale bar: 4 μm, refers to whole panel. (e) Myelinated fibers relative to all sorted fibers. Bar heights: Mean; error bars: s.e.m. (n = 3 mice/genotype, two-way ANOVA with Tukey’s multiple comparisons test, F(2,12) = 37.09, p<0.0001; pP5 control vs KO <0.0001, pP14 control vs KO <0.0001, pP5 vs P14 KO = 0.0002, pP14 vs P60 KO < 0.0001). At least 150 sorted fibers per sample were counted (random EM fields). (f) EdU-labeling and Sox10 immunostaining on P3 sciatic nerve cross sections (n = 3 mice/genotype). Arrowheads indicate Sox10/EdU double-positive SC nuclei. Scale bar: 50 μm, refers to whole panel. (g,h) Quantifications of f. Sox10/EdU double-positive of Sox10-positive nuclei (g), Sox10-positive nuclei per sciatic nerve cross section (h). Bar heights: Mean; error bars: s.e.m. (n = 3 mice/genotype; two-tailed unpaired Student’s t-test; g, t(4) = 4.407, p=0.0116; h, t(4) = 5.77, p=0.0045). (i) Electron micrographs of P5 sciatic nerves from control and mutants treated with vehicle or rapamycin. Scale bar: 4 μm, refers to whole panel. (j) Quantification of i. Myelinated fibers relative to all sorted fibers. At least 150 sorted fibers per sample were counted (random EM fields). Bar heights: Mean; error bars: s.e.m. (n = 3 mice/condition, two-way ANOVA with Tukey’s multiple comparisons test, F(1,8) = 12.22, p=0.0081; pcontrol vs KO vehicle = 0.0008, pKO vehicle vs rapamycin = 0.0037). (k) Western blot analysis, P5 sciatic nerve lysates from controls and mutants treated with vehicle or rapamycin (n = 4 mice/condition). Quantification: Figure 1—figure supplement 1b. *p<0.05, **p<0.01, ***p<0.001.
Figure 1—figure supplement 1
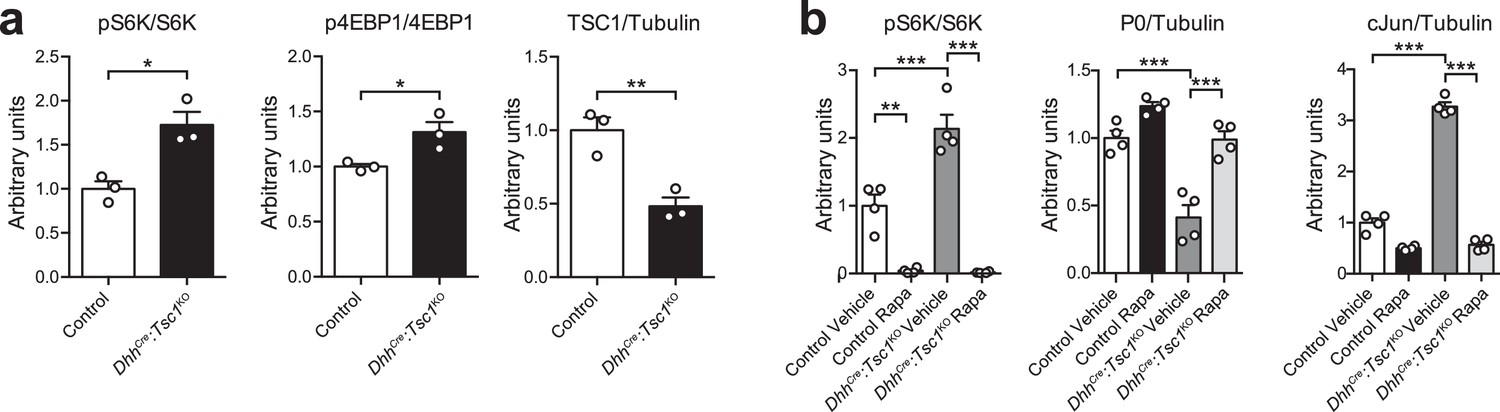
Quantification of western blots.
Bar height: mean; error bars: s.e.m. (a) Quantification referring to Figure 1a. Control average is set to 1 (n = 3 mice/genotype, including the biological replicates representatively shown in Figure 1a, two-tailed unpaired Student’s t-test; pS6K/S6K, t(4) = 4.233, p=0.0133; p4EBP1/4EBP1, t(4) = 3.26, p=0.0311; TSC1/Tubulin, t(4) = 4.854, p=0.0083). (b) Quantification referring to Figure 1k. Vehicle-treated control average is set to 1 (n = 4 mice/condition, including the biological replicates representatively shown in Figure 1k, one-way ANOVA with Tukey’s multiple comparisons test; pS6K/S6K, F(3,12) = 56.94, p<0.0001, pcontrol vehicle vs rapamycin = 0.0013, pcontrol vehicle vs TSC1KO vehicle = 0.0003, pTSC1KO vehicle vs rapamycin <0.0001; P0/Tubulin, F(3,12) = 31.28, p<0.0001, pcontrol vehicle vs TSC1KO vehicle = 0.0001, pTSC1KO vehicle vs rapamycin = 0.0002; cJun/Tubulin, F(3,12) = 366.2, p<0.0001, pcontrol vehicle vs TSC1KO vehicle <0.0001, pTSC1KO vehicle vs rapamycin <0.0001). *p<0.05, **p<0.01, ***p<0.001.
Figure 1—figure supplement 2
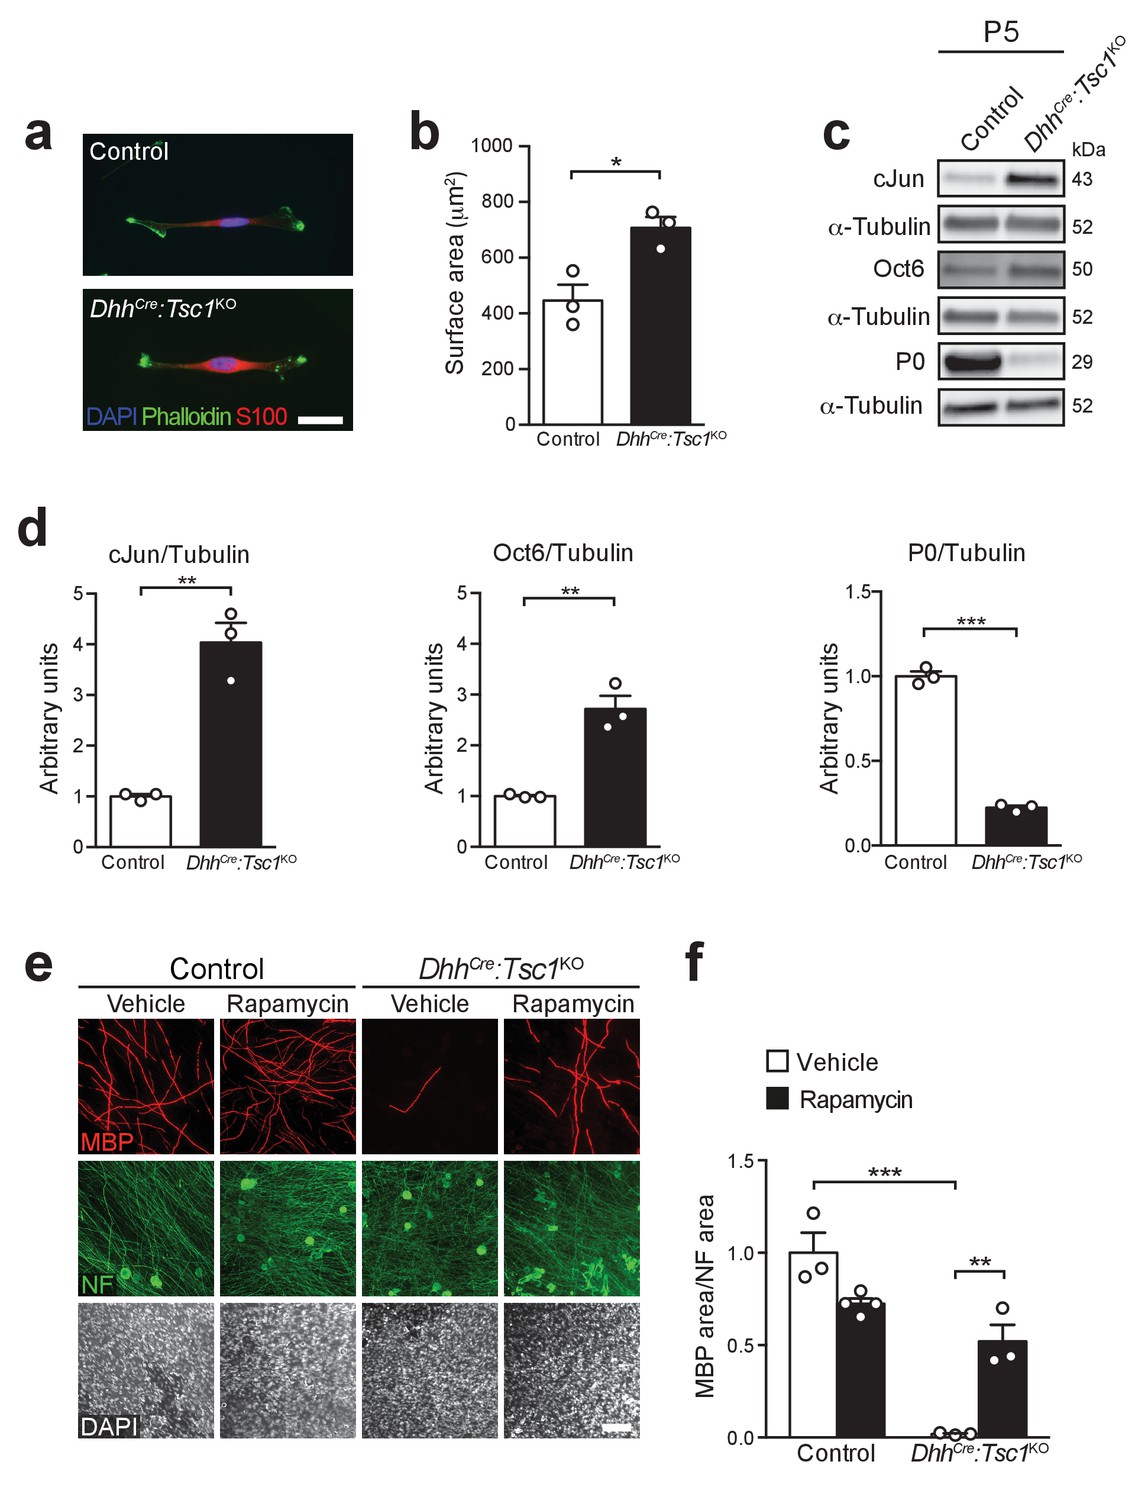
Deletion of TSC1 inhibits the onset of SC myelination by hyperactivating mTORC1.
(a) Immunostaining of neonatal SCs at P2 (n = 3 mice/genotype). Scale bar: 20 μm, refers to whole panel. (b) Surface area of control and mutant cells based on the phalloidin-stained cell contour as shown in a. At least 20 cells per sample were analyzed. Bar height: mean; error bars: s.e.m. (n = 3 mice/genotype, two-tailed unpaired Student’s t-test, t(4) = 3.804, p=0.019). (c) Western blot analysis, P5 sciatic nerve lysates from control and mutant mice (n = 3 mice/genotype). (d) Quantification referring to c. Bar height: mean; error bars: s.e.m. Control average is set to 1 (n = 3 mice/genotype, including the biological replicates representatively shown in c, two-tailed unpaired Student’s t-test; cJun/Tubulin, t(4) = 7.715, p=0.0015; Oct6/Tubulin, t(4) = 6.636, p=0.0027; P0/Tubulin, t(4) = 25.04, p<0.0001). (e) Immunostaining of DRG-explant cultures from control or DhhCre:Tsc1KO embryos. Vehicle (DMSO) or rapamycin (20 nM) were added for 48 hr upon induction of myelination. Three independent experiments performed, one representative experiment shown. MBP: myelin basic protein. NF: neurofilament. Scale bar: 100 μm, refers to whole panel. (f) Quantification referring to e. Data are expressed as average ratio between the MBP-positive area and the corresponding NF-positive area. The vehicle-treated control average is set to 1. Bar height: mean; error bars: s.e.m. (n = 4 coverslips for rapamycin-treated controls, n = 3 coverslips for the other conditions, two-way ANOVA with Dunnett’s multiple comparisons test, F(1,9) = 33.43, p=0.0003; pvehicle control vs TSC1KO = 0.0001, pTSC1KO vehicle vs rapamycin = 0.0017). *p<0.05, **p<0.01, ***p<0.001.
Figure 2 with 2 supplements
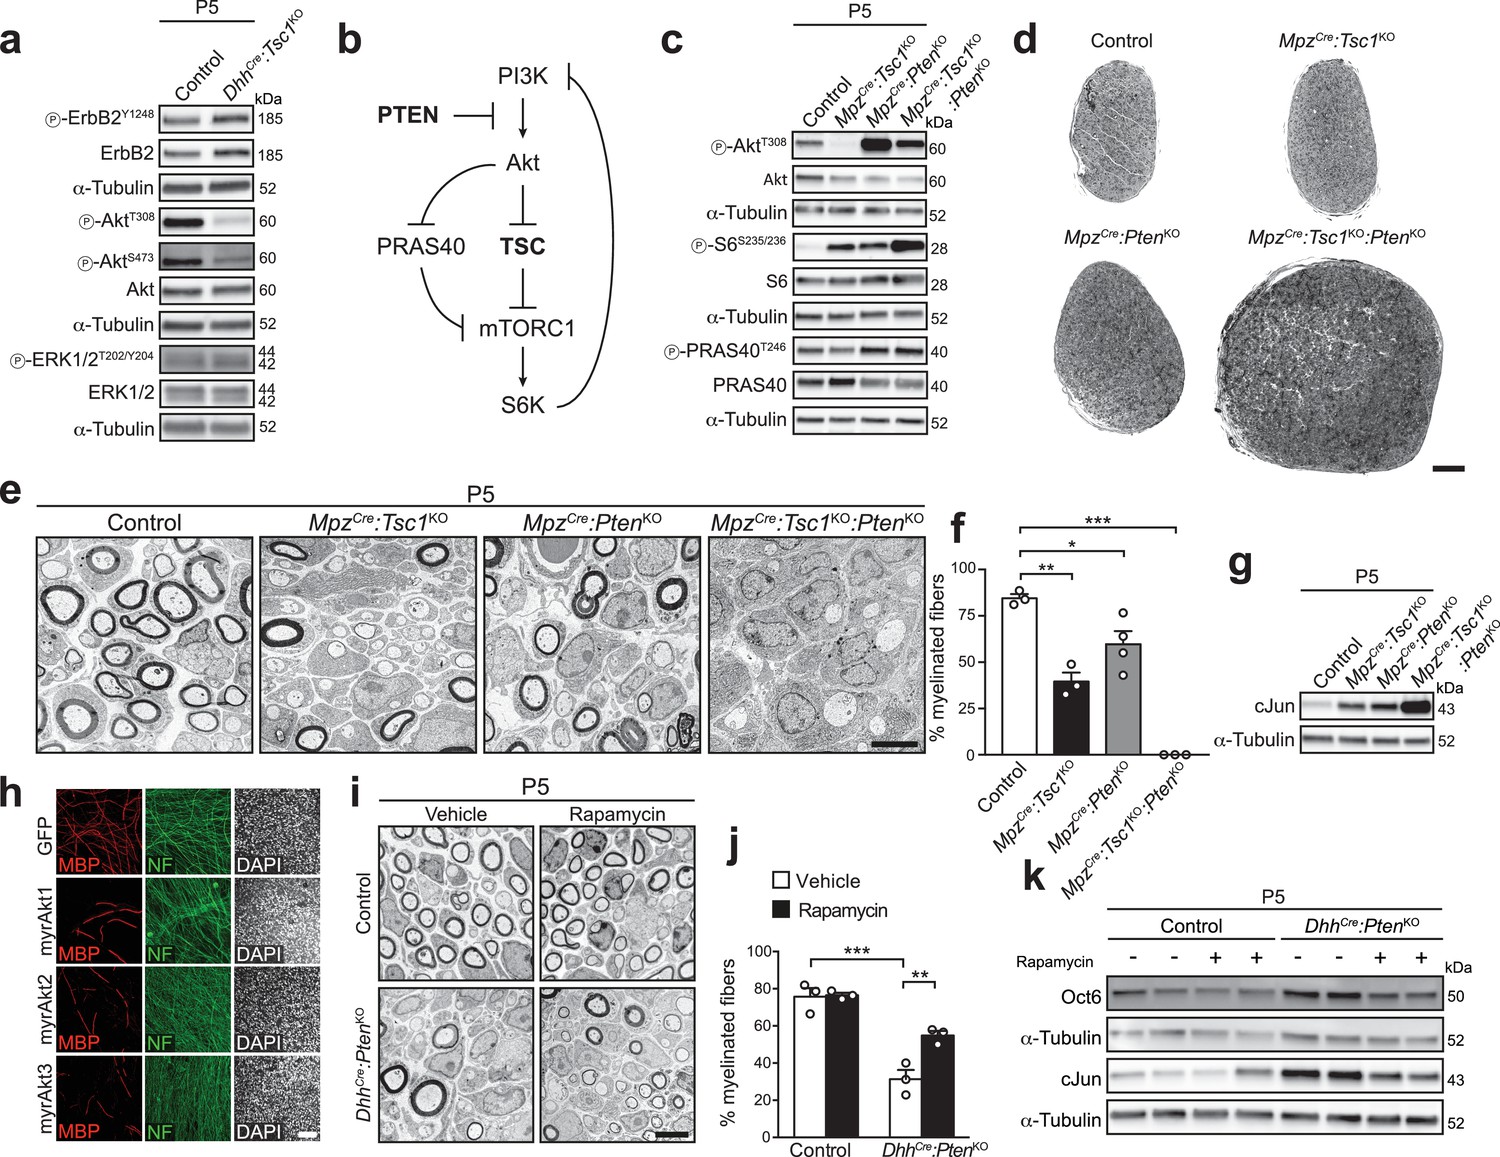
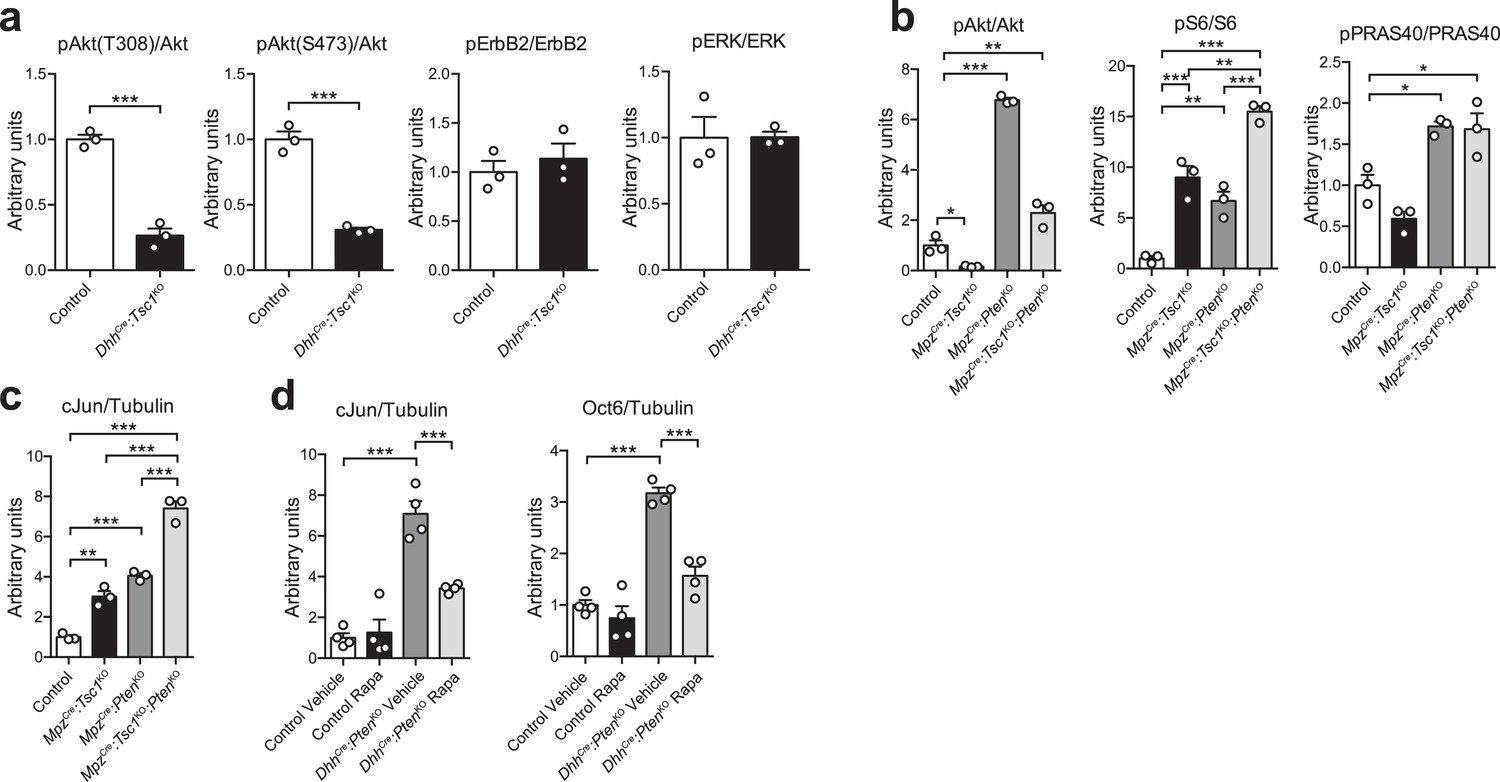
Deletion of PTEN restores Akt activity, but does not rescue the differentiation delay in TSC1-mutant mice.
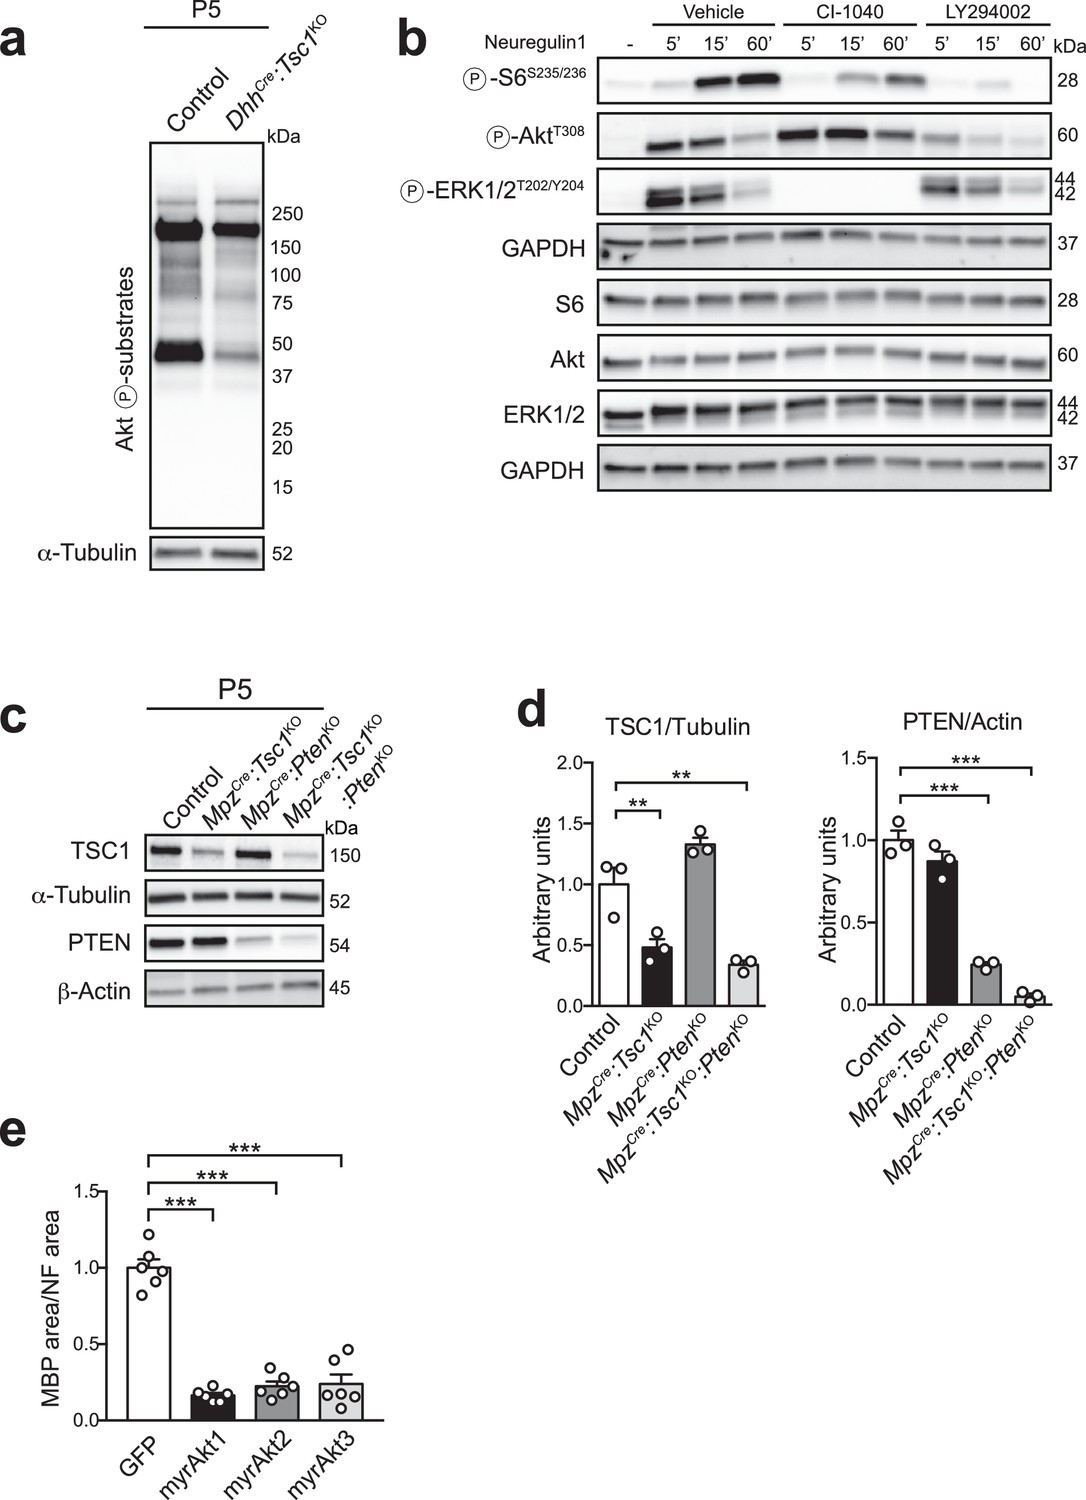
(a) Western blot analysis, P5 sciatic nerve lysates from control and DhhCre:Tsc1KO mice (n = 3 mice/genotype). Quantification: Figure 2—figure supplement 1a. (b) Scheme of roles of PTEN and the TSC complex within the PI3K-Akt-mTORC1 axis. (c) Western blot analysis, P5 sciatic nerve lysates from control, MpzCre:Tsc1KO, MpzCre:PtenKO, and MpzCre:Tsc1KO:PtenKO mice (n = 3 mice/genotype). Quantification: Figure 2—figure supplement 1b. (d) Semithin cross sections of P5 control and mutant sciatic nerves (n = 3 mice/genotype). Scale bar: 100 μm. (e) Electron micrographs of P5 control and mutant sciatic nerves (n = 3 mice/genotype). Scale bar: 4 μm, refers to whole panel. (f) Myelinated fibers relative to all sorted fibers. Bar height: Mean; error bars: s.e.m. (n = 3 controls, TSC1-mutants, double-mutants and n = 4 PTEN-mutants, one-way ANOVA with Tukey’s multiple comparisons test, F(3,9) = 44.98, p<0.0001; pcontrol vs TSC1KO = 0.001, pcontrol vs PTENKO = 0.028, pcontrol vs doubleKO <0.0001). At least 150 sorted fibers per sample were counted (random EM fields). (g) Western blot analysis, P5 sciatic nerve lysates from controls and mutants (n = 3 mice/genotype). Quantification: Figure 2—figure supplement 1c. (h) Immunostainings of DRG-explant cultures infected with GFP- or Akt-expressing lentiviruses at day in vitro (DIV) 3. Quantification: Figure 2—figure supplement 2e. Three independent experiments performed, one representative experiment shown. MBP: myelin basic protein. NF: neurofilament. Scale bar: 100 μm, refers to whole panel. (i) Electron micrographs of P5 sciatic nerves from control and DhhCre:PtenKO mice treated with vehicle or rapamycin (n = 3 mice/condition). Scale bar: 4 μm, refers to whole panel. (j) Quantification referring to i. Myelinated fibers relative to all sorted fibers. At least 150 sorted fibers per sample were counted (random EM fields). Bar height: Mean; error bars: s.e.m. (n = 3 mice/condition, two-way ANOVA with Tukey’s multiple comparisons test, F(1,8) = 9.485, p=0.0151; pcontrol vs KO vehicle = 0.0001, pKO vehicle vs rapamycin = 0.0085). (k) Western blot analysis, P5 sciatic nerve lysates from controls and mutants treated with vehicle or rapamycin (n = 4 mice/condition). Quantification: Figure 2—figure supplement 1d. *p<0.05, **p<0.01, ***p<0.001.
Figure 2—figure supplement 1
Quantification of western blots.
Bar height: mean; error bars: s.e.m. (a) Quantification referring to Figure 2a. Control average is set to 1 (n = 3 mice/genotype, including the biological replicates representatively shown in Figure 2a, two-tailed unpaired Student’s t-test; pAkt(T308)/Akt, t(4) = 11.43, p=0.0003; pAkt(S473)/Akt, t(4) = 11.19, p=0.0004; pErbB2/ErbB2, t(4) = 0.7119, p=0.5158; pERK/ERK, t(4) = 0.02554, p=0.9808). (b) Quantification referring to Figure 2c. Control average is set to 1 (n = 3 mice/genotype, including the biological replicates representatively shown in Figure 2c; pAkt/Akt, one-way ANOVA with Dunnett’s multiple comparisons test, F(3,8) = 251.6, p<0.0001, pcontrol vs TSC1KO = 0.0313, pcontrol vs PTENKO = 0.0001, pcontrol vs doubleKO = 0.0030; pS6/S6, one-way ANOVA with Tukey’s multiple comparisons test, F(3,8) = 58.58, p<0.0001, pcontrol vs TSC1KO = 0.0004, pcontrol vs PTENKO = 0.0040, pcontrol vs doubleKO <0.0001, pTSC1KO vs doubleKO = 0.0017, pPTENKO vs doubleKO = 0.0002; pPRAS40/PRAS40, one-way ANOVA with Dunnett’s multiple comparisons test, F(3,8) = 18.5, p=0.0006, pcontrol vs PTENKO = 0.0103, pcontrol vs doubleKO = 0.0134). (c) Quantification referring to Figure 2g. Control average is set to 1 (n = 3 mice/genotype, including the biological replicates representatively shown in Figure 2g, one-way ANOVA with Tukey’s multiple comparisons test, F(3,8) = 123.4, p<0.0001; pcontrol vs TSC1KO = 0.0016, pcontrol vs PTENKO <0.0001, pcontrol vs doubleKO <0.0001, pTSC1KO vs doubleKO <0.0001, pPTENKO vs doubleKO <0.0001). (d) Quantification referring to Figure 2k. Vehicle-treated control average is set to 1 (n = 4 mice/condition, including the biological replicates representatively shown in Figure 2k, one-way ANOVA with Tukey’s multiple comparisons test; cJun/Tubulin, F(3,12) = 37.14, p<0.0001, pvehicle control vs PTENKO <0.0001, pPTENKO vehicle vs rapamycin = 0.0006; Oct6/Tubulin, F(3,12) = 45.07, p<0.0001, pvehicle control vs PTENKO <0.0001, pPTENKO vehicle vs rapamycin <0.0001). *p<0.05, **p<0.01, ***p<0.001.
Figure 2—figure supplement 2
Reciprocal interactions between the mTORC1 pathway and the PI3K-Akt pathway in SCs.
(a) Western blot analysis for proteins with a phosphorylated consensus motif for Akt phosphorylation (RXXS/T) from P5 control and DhhCre:Tsc1KO nerves (n = 3 mice/genotype). A representative blot is shown. (b) Western blot analysis, rat SCs treated with neuregulin-1 in the presence of vehicle (DMSO), 5 μM CI-1040 (MEK inhibitor), or 20 μM LY294002 (PI3K inhibitor). Two independent experiments performed, one representative experiment shown. (c) Western blot analysis, sciatic nerve lysates from P5 control, MpzCre:Tsc1KO, MpzCre:PtenKO, and MpzCre:Tsc1KO:PtenKO mice (n = 3 mice/genotype). (d) Quantification referring to c. Bar height: mean; error bars: s.e.m. Control average is set to 1 (n = 3 mice/genotype, including the biological replicates representatively shown in c, one-way ANOVA with Dunnett’s multiple comparisons test; TSC1/Tubulin, F(3,8) = 30.56, p<0.0001, pcontrol vs TSC1KO = 0.0057, pcontrol vs doubleKO = 0.0013; PTEN/Actin, F(3,8) = 115.4, p<0.0001, pcontrol vs PTENKO = 0.0001, pcontrol vs doubleKO = 0.0001). (e) Quantification referring to Figure 2h. Data are expressed as average ratio between the MBP-positive area and the corresponding NF-positive area. The average of GFP-infected controls is set to 1. Bar height: mean; error bars: s.e.m. (n = 6 coverslips/condition, one-way ANOVA with Dunnett’s multiple comparisons test, F(3,20) = 76, p<0.0001; pGFP vs Akt1 = 0.0001, pGFP vs Akt2 = 0.0001, pGFP vs Akt3 = 0.0001). **p<0.01, ***p<0.001.
Figure 3 with 2 supplements
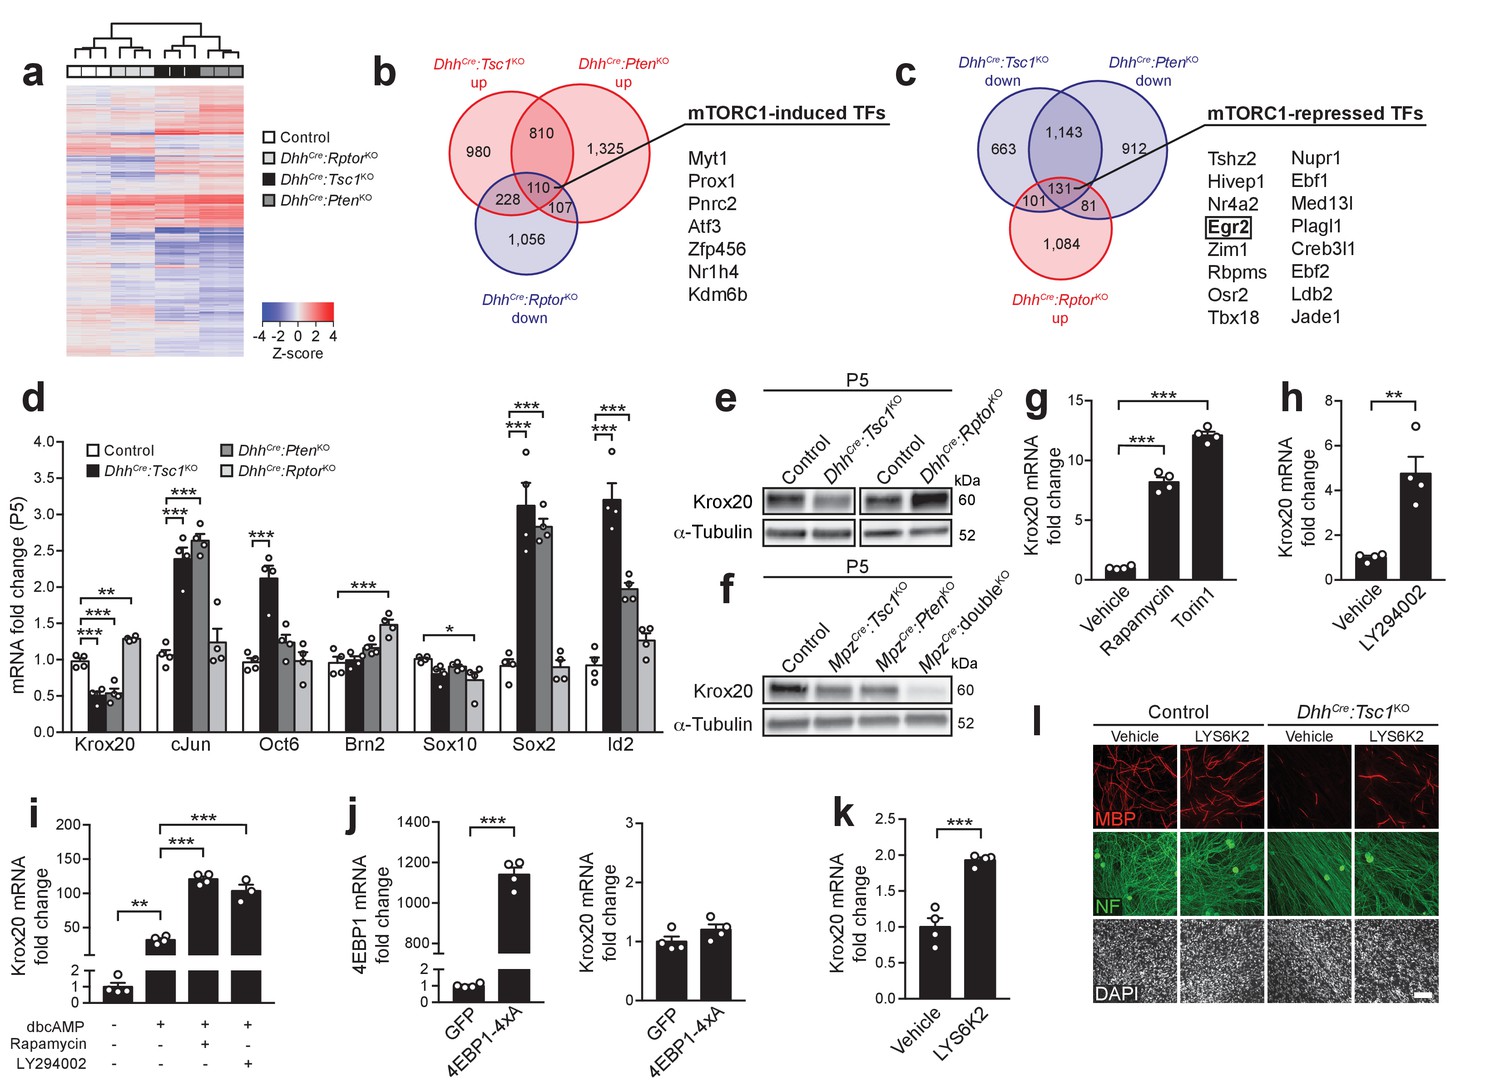
mTORC1 negatively regulates Krox20 expression via S6K.
(a) Cluster analysis and heatmap of transcriptome profiles from P5 control, DhhCre:RptorKO, DhhCre:Tsc1KO, and DhhCre:PtenKO sciatic nerves (n = 3 mice/genotype). (b,c) Venn diagrams of differentially expressed genes relative to controls (fold change >1.2, FDR < 0.05). (d) qRT-PCR analysis from P5 sciatic nerves. Transcript levels relative to control, after normalization to β-actin. Bar height: Mean; error bars: s.e.m. (n = 4 mice/genotype, one-way ANOVA with Dunnett’s multiple comparisons test, F(3,12)Krox20 = 61.75, F(3,12)cJun = 34.14, F(3,12)Oct6 = 19.85, F(3,12)Brn2 = 13.11, F(3,12)Sox10 = 3.747, F(3,12)Sox2 = 44.76, F(3,12)Id2 = 49.23, pKrox20 <0.0001, pcJun <0.0001, pOct6 <0.0001, pBrn2 <0.0001, pSox10 = 0.0414, pSox2 <0.0001, pId2 <0.0001; Krox20, pcontrol vs TSC1KO = 0.0001, pcontrol vs PTENKO = 0.0001, pcontrol vs RaptorKO = 0.0017; cJun, pcontrol vs TSC1KO = 0.0001, pcontrol vs PTENKO = 0.0001; Oct6, pcontrol vs TSC1KO = 0.0001; Brn2, pcontrol vs RaptorKO = 0.0003; Sox10, pcontrol vs RaptorKO = 0.0212; Sox2, pcontrol vs TSC1KO = 0.0001, pcontrol vs PTENKO = 0.0001; Id2, pcontrol vs TSC1KO = 0.0001, pcontrol vs PTENKO = 0.0006). (e,f) Western blot analysis, P5 sciatic nerve lysates (n = 3 mice/genotype). Quantification: Figure 3—figure supplement 2a,b. (g) qRT-PCR from primary rat SCs in growth medium treated with vehicle (DMSO), rapamycin (20 nM), or torin-1 (20 nM) for 24 hr. Transcript levels relative to vehicle, after normalization to GAPDH. Bar height: Mean; error bars: s.e.m. (n = 4 biological replicates/condition, one-way ANOVA with Dunnett’s multiple comparisons test, F(2,9) = 378, p<0.0001; pvehicle vs rapamycin = 0.0001, pvehicle vs torin1 = 0.0001). Three independent experiments performed, one exemplary experiment shown. (h) qRT-PCR from primary rat SCs in growth medium treated with vehicle (DMSO) or LY294002 (20 μM) for 24 hr. Transcript levels relative to vehicle, after normalization to GAPDH. Bar height: Mean; error bars: s.e.m. (n = 4 biological replicates/condition, two-tailed unpaired Student’s t-test, t(6) = 4.969, p=0.0025). Three independent experiments performed, one exemplary experiment shown. (i) qRT-PCR from primary rat SCs in defined medium with or without dbcAMP and treated with vehicle (DMSO), rapamycin (20 nM), or LY294002 (20 μM) for 24 hr. Transcript levels relative to defined medium-treated cells, after normalization to GAPDH. Bar height: Mean; error bars: s.e.m. (n = 3 biological replicates for LY294002 treated cells, n = 4 biological replicates for the other conditions, one-way ANOVA with Tukey’s multiple comparisons test, F(3,11) = 179.5, p<0.0001; pdefined medium vs dbcAMP vehicle = 0.0012, pdbcAMP vehicle vs dbcAMP rapamycin <0.0001, pdbcAMP vehicle vs dbcAMP LY294002 <0.0001). Three independent experiments performed, one exemplary experiment shown. (j) qRT-PCR from primary rat SCs in growth medium 48 hr after transfection with plasmids expressing GFP or constitutively active 4EBP1 (4EBP1-4xA). Transcript levels relative to GFP-transfected cells, after normalization to GAPDH. Bar height: Mean; error bars: s.e.m. (n = 4 biological replicates/condition, two-tailed unpaired Student’s t-test; 4EBP1, t(6) = 33.37, p<0.0001; Krox20, t(6) = 1.641, p=0.1519). Three independent experiments performed, one representative experiment shown. (k) qRT-PCR from primary rat SCs in growth medium treated with vehicle (DMSO) or LYS6K2 (3 μM) for 24 hr. Transcript levels relative to vehicle, after normalization to GAPDH. Bar height: Mean; error bars: s.e.m. (n = 4 biological replicates/condition, two-tailed unpaired Student’s t-test, t(6) = 7.171, p=0.0004). Three independent experiments performed, one representative experiment shown. (l) Immunostaining of DRG-explant cultures from control or DhhCre:Tsc1KO embryos. Vehicle (DMSO) or LYS6K2 (3 μM) were added upon induction of myelination. Quantification: Figure 3—figure supplement 1e. Three independent experiments performed, one representative experiment shown. MBP: myelin basic protein. NF: neurofilament. Scale bar: 100 μm, refers to whole panel. *p<0.05, **p<0.01, ***p<0.001.
-
Figure 3—source data 1
Transcriptomes of TSC1-, PTEN-, and Raptor-mutant nerves at P5 compared to controls.
- https://doi.org/10.7554/eLife.29241.012
Figure 3—figure supplement 1
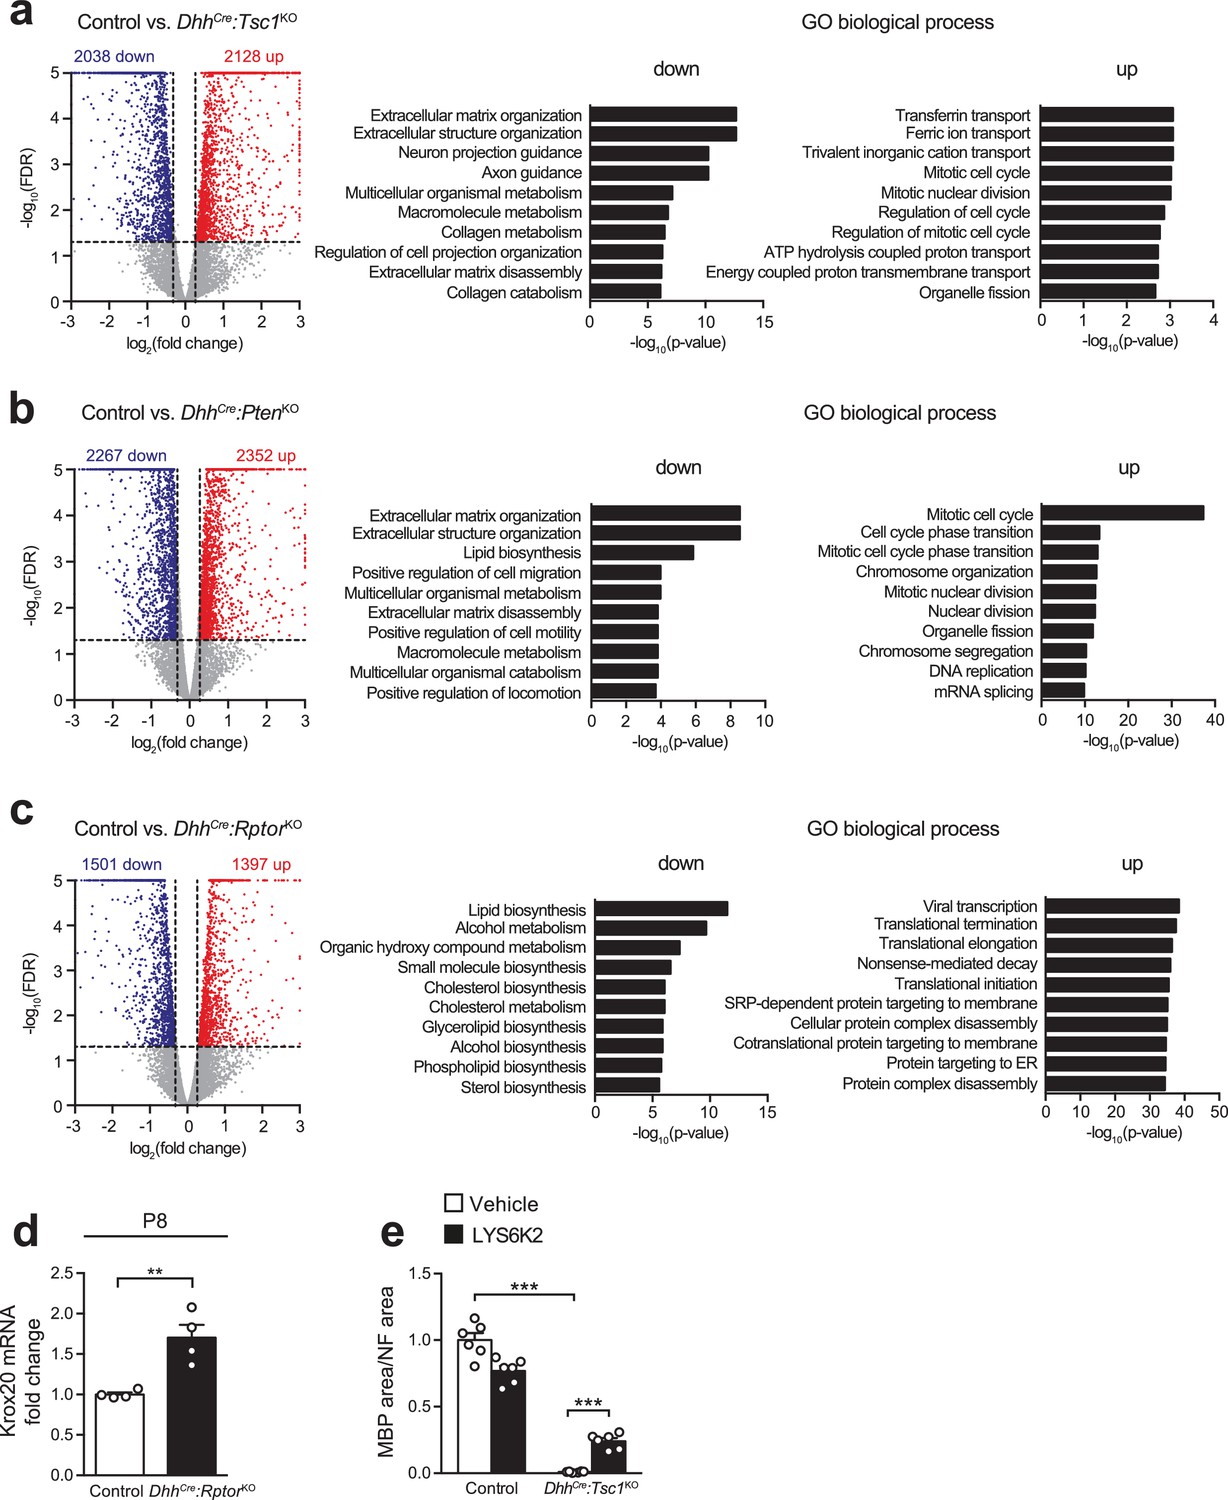
Transcriptome profile of P5 sciatic nerves in various conditions of mTORC1 activation.
(a–c) Volcano plots (left) and gene-ontology analysis (right) of significantly (fold change >1.2, FDR < 0.05) upregulated (red) and downregulated (blue) genes in DhhCre:Tsc1KO, DhhCre:PtenKO, and DhhCre:RptorKO compared to control nerves at P5. (d) qRT-PCR from P8 control and DhhCre:RptorKO sciatic nerves. Transcript levels relative to control, after normalization toβ-actin. Bar height: mean; error bars: s.e.m. (n = 4 mice/genotype, two-tailed unpaired Student’s t-test, t(6) = 4.401, p=0.0046). (e) Quantification referring to Figure 3l. Data are expressed as average ratio between the MBP-positive area and the corresponding NF-positive area. The vehicle-treated control average is set to 1. Bar height: mean; error bars: s.e.m. (n = 6 coverslips/condition, two-way ANOVA with Dunnett’s multiple comparisons test, F(1,20) = 45.18, p<0.0001; pvehicle control vs TSC1KO = 0.0001, pTSC1KO vehicle vs LYS6K2 = 0.0004). **p<0.01, ***p<0.001.
Figure 3—figure supplement 2

Quantification of western blots.
Bar height: mean; error bars: s.e.m. (a) Quantification referring to Figure 3e. Control average is set to 1 (n = 3 mice/genotype, including the biological replicates representatively shown in Figure 3e, two-tailed unpaired Student’s t-test, t(4)control vs TSC1KO = 5.054, t(4)control vs RaptorKO = 5.637, pcontrol vs TSC1KO = 0.0072, pcontrol vs RaptorKO = 0.0049). (b) Quantification referring to Figure 3f. Control average is set to 1 (n = 3 mice/genotype, including the biological replicates representatively shown in Figure 3f, one-way ANOVA with Tukey’s multiple comparisons test, F(3,8) = 95.35, p<0.0001; pcontrol vs TSC1KO = 0.0036, pcontrol vs PTENKO = 0.0011, pcontrol vs doubleKO <0.0001, pTSC1KO vs doubleKO <0.0001, pPTENKO vs doubleKO <0.0001). *p<0.05, **p<0.01, ***p<0.001.
Figure 4
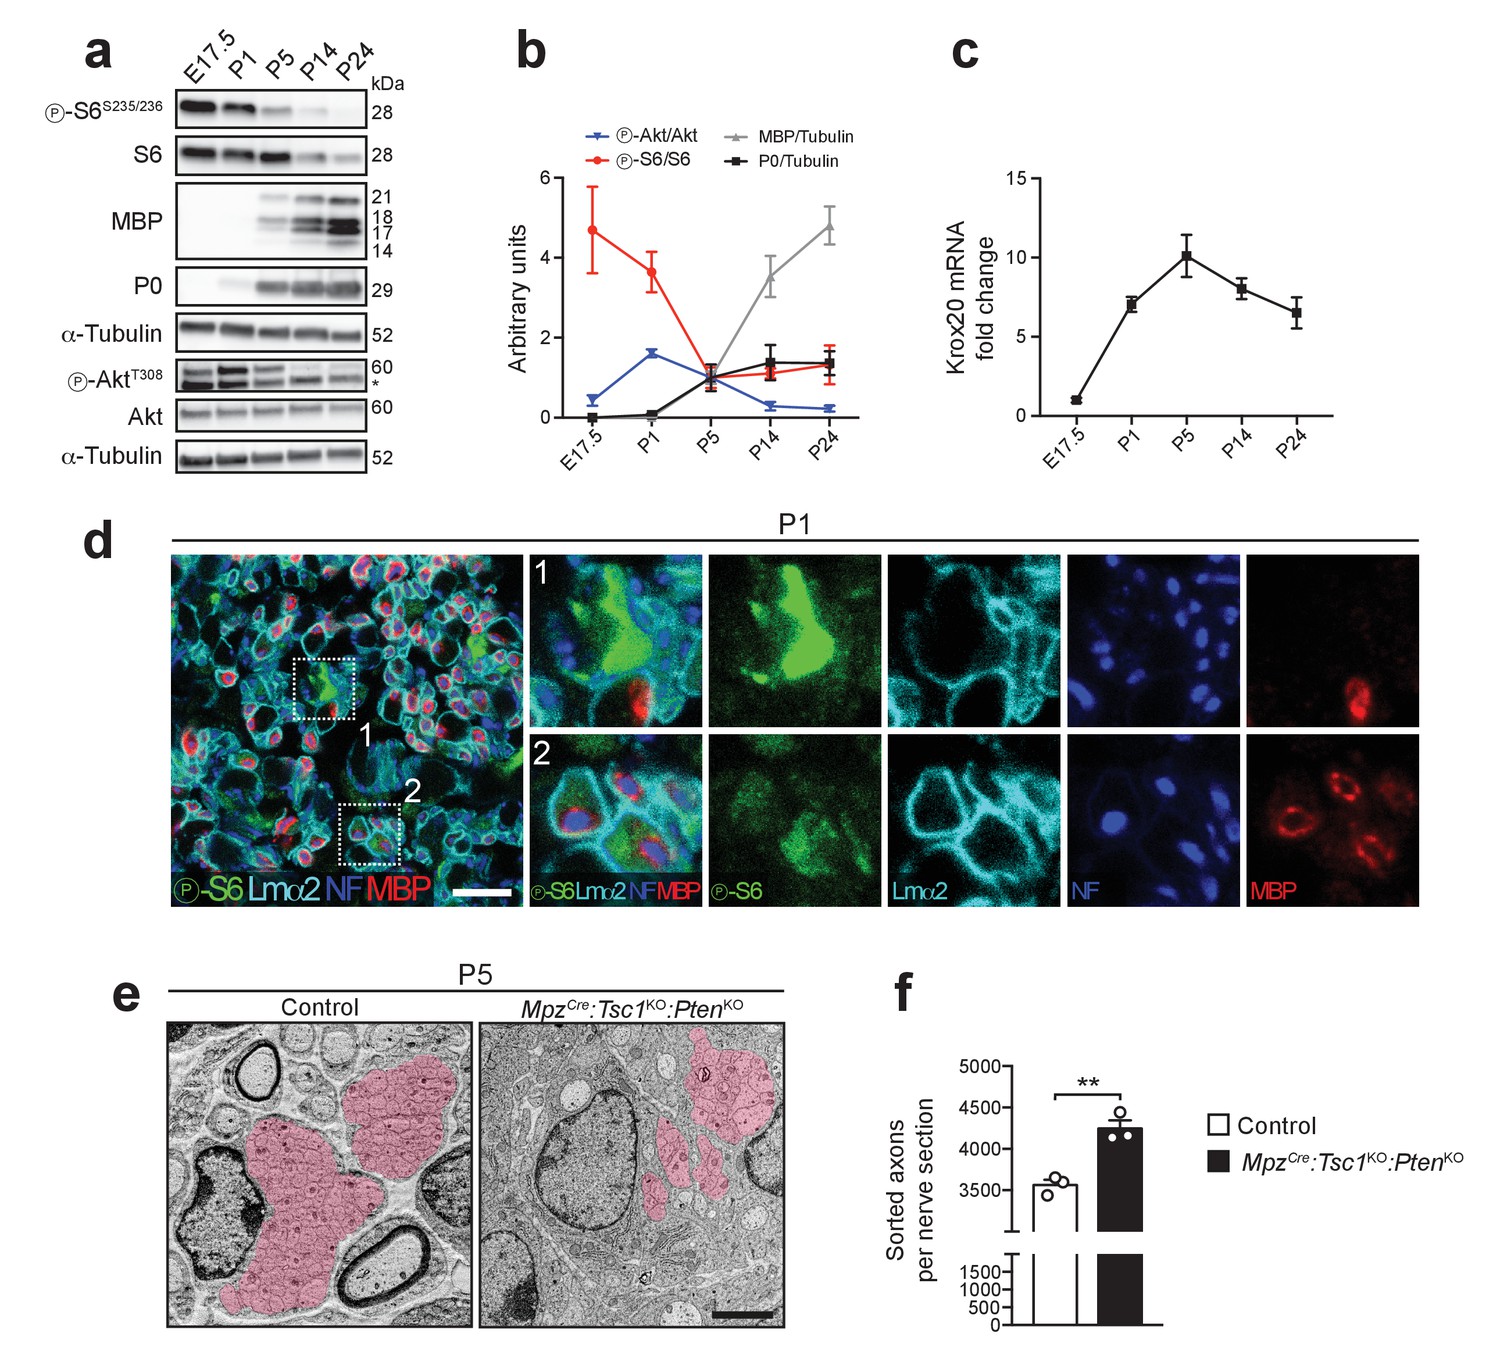
Akt and mTORC1 activities are high before onset of myelination and decline as myelination proceeds.
(a) Western blot analysis of wild-type sciatic nerves (n = 3 mice/time point; for E17.5, three pools of sciatic nerves were used). Asterisk: Unspecific band. (b) Quantification referring to a, with P5 average set to 1. Symbols: Mean; error bars: s.e.m. (c) qRT-PCR from wild-type sciatic nerves. Transcript levels relative to E17.5, after normalization to α-tubulin. Symbols: Mean; error bars: s.e.m. (n = 6 mice at E17.5, n = 3 mice at P5, n = 4 mice for other time points). (d) Confocal microscopy images of immunostained sciatic nerve cross sections from P1 wild-type mice (n = 4 mice). Insets 1 and 2 show cells strongly or weakly positive for phospho-S6, in contact with axons, and surrounded by a basal lamina. Lmα2: laminin-α2. NF: neurofilament. MBP: myelin basic protein. Scale bar: 10 μm. (e) Electron micrographs of P5 control and MpzCre:Tsc1KO:PtenKO sciatic nerves. Area covered by bundles of unsorted axons highlighted in red (n = 3 mice/genotype). Scale bar: 2 μm, refers to whole panel. (f) Sorted axons per sciatic nerve cross section from P5 control and MpzCre:Tsc1KO:PtenKO mice. Bar height: Mean; error bars: s.e.m. (n = 3 mice/genotype, two-tailed unpaired Student’s t-test, t(4) = 5.806, p=0.0044). **p<0.01.
-
Figure 4—source data 1
Timeline of PI3K-Akt-mTORC1 activity in mouse nerve development (data referring to Figure 4b)
- https://doi.org/10.7554/eLife.29241.014
-
Figure 4—source data 2
Timeline of Krox20 expression in mouse nerve development (data referring to Figure 4c)
- https://doi.org/10.7554/eLife.29241.015
Figure 5 with 3 supplements
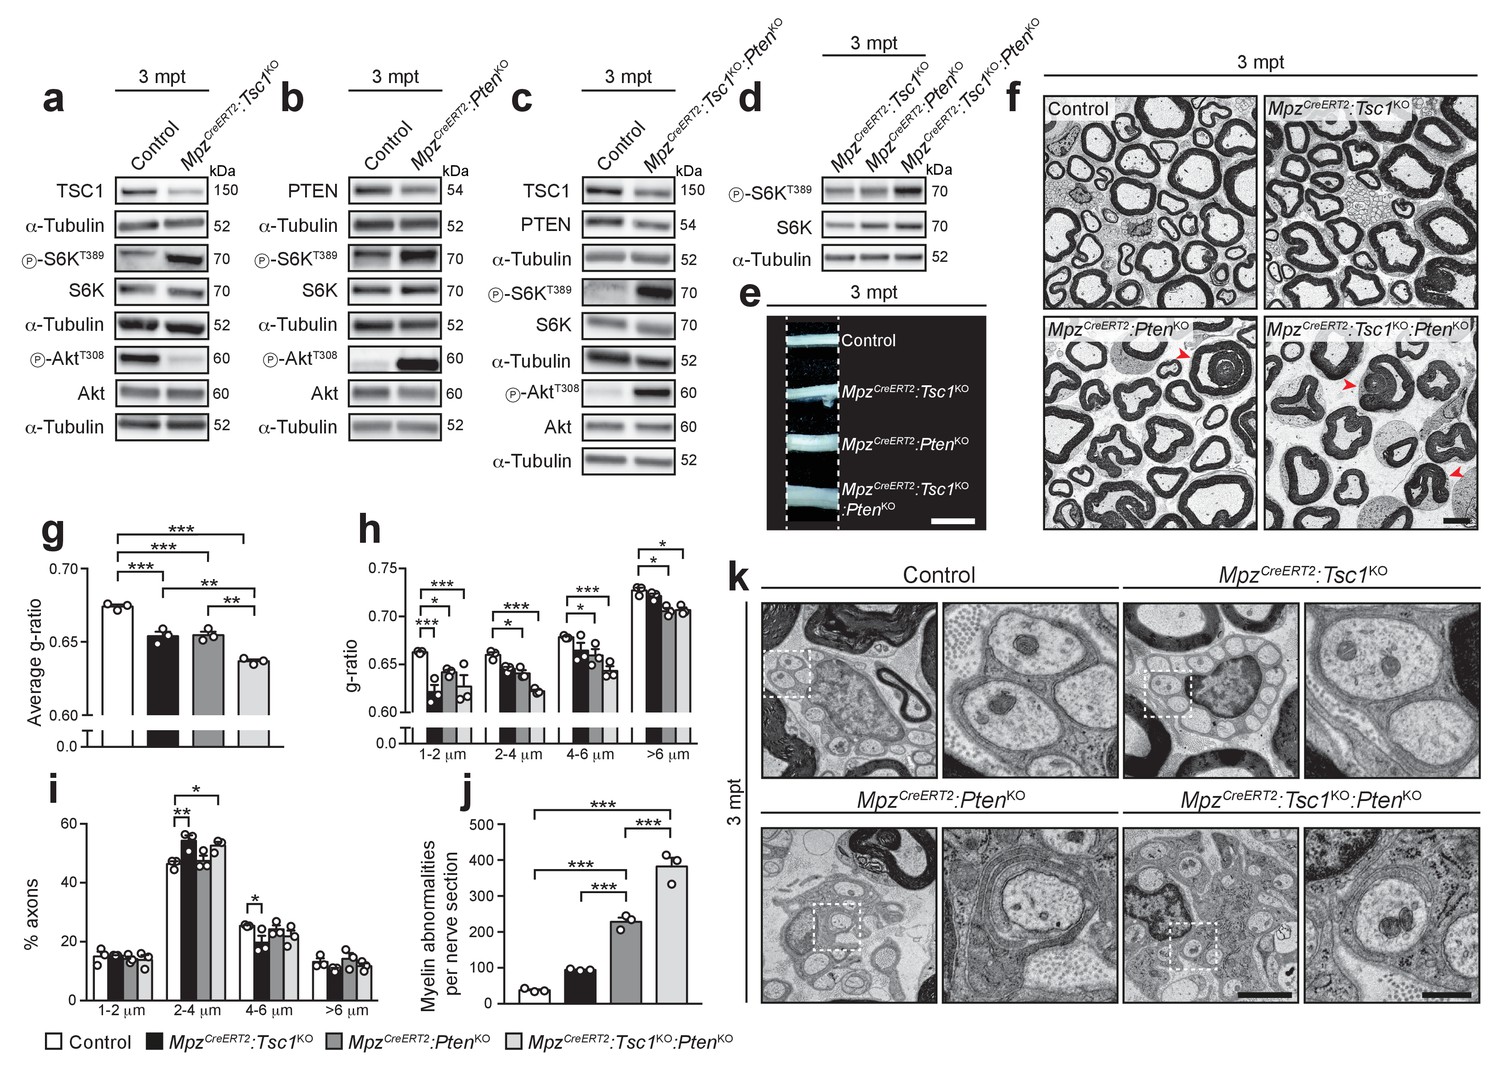
Inducible deletion of TSC1 and/or PTEN in adult mice reactivates myelin growth.
(a–d) Western blot analysis, 3 mpt sciatic nerve lysates from control, MpzCreERT2:Tsc1KO, MpzCreERT2:PtenKO, and MpzCreERT2:Tsc1KO:PtenKO mice (n = 3 mice/genotype). Quantification: Figure 5—figure supplement 1a–d. Note that exposure times for the three phospho-AktT308 western blots in a, b, and c were adjusted per membrane to avoid saturation of signals. (e) Macroscopic appearance of 3 mpt sciatic nerves from controls and mutants. Scale bar: 2.5 mm. (f) Electron micrographs of sciatic nerve cross sections from 3 mpt controls and mutants (n = 3 mice/genotype). Scale bar: 4 μm, refers to whole panel. (g–i) G-ratio, g-ratio distribution, and axon diameter distribution of 3 mpt control and mutant sciatic nerves. At least 400 sorted fibers per sample were analyzed (random EM fields). Bar height: Mean; error bars: s.e.m. (n = 3 mice/genotype; g, one-way ANOVA with Tukey’s multiple comparisons test, F(3,8) = 52.91, p<0.0001, pcontrol vs TSC1KO = 0.0006, pcontrol vs PTENKO = 0.0008, pcontrol vs doubleKO <0.0001, pTSC1KO vs doubleKO = 0.0018, pPTENKO vs doubleKO = 0.0014; h, two-way ANOVA with Tukey’s multiple comparisons test, F(9,32) = 2.699, p=0.0185, p1-2 μm control vs TSC1KO <0.0001, p1-2 μm control vs PTENKO = 0.0269, p1-2 μm control vs doubleKO <0.0001, p2-4 μm control vs PTENKO = 0.0453, p2-4 μm control vs doubleKO <0.0001, p4-6 μm control vs PTENKO = 0.0485, p4-6 μm control vs doubleKO = 0.0001, p>6 μm control vs PTENKO = 0.0212, p>6 μm control vs doubleKO = 0.0299; (i), two-way ANOVA with Tukey’s multiple comparisons test, F(9,32) = 4.055, p=0.0015, p2-4 μm control vs TSC1KO = 0.0022, p2-4μm control vs doubleKO = 0.0188, p4-6 μm control vs TSC1KO = 0.0357). (j) Myelin abnormalities per sciatic nerve cross sections at 3 mpt. Bar height: Mean; error bars: s.e.m. (n = 3 mice/genotype, one-way ANOVA with Tukey’s multiple comparisons test, F(3,8) = 123.3, p<0.0001; pcontrol vs PTENKO <0.0001, pcontrol vs doubleKO <0.0001, pPTENKO vs TSC1KO = 0.0006, pPTENKO vs doubleKO = 0.0002). (k) Electron micrographs of 3 mpt sciatic nerves showing exemplary Remak bundles and enlarged details (dashed square). (n = 3 mice/genotype). Scale bar: 2 μm (left), 500 nm (right). *p<0.05, **p<0.01, ***p<0.001.
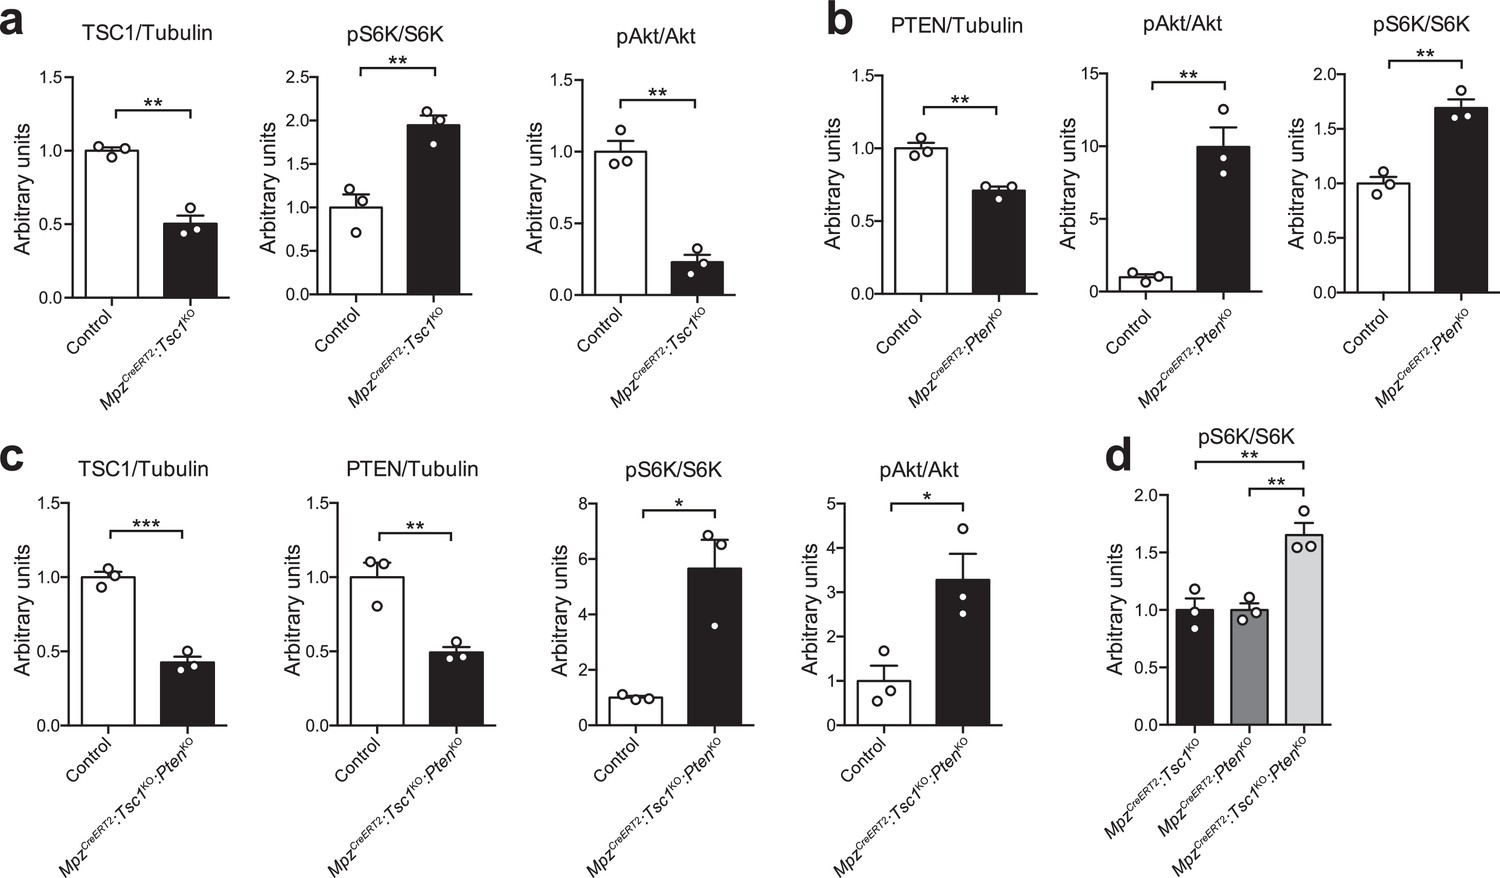
Figure 5—figure supplement 1
Quantification of western blots.
Bar height: mean; error bars: s.e.m. (a) Quantification referring to Figure 5a. Control average is set to 1 (n = 3 mice/genotype, including the biological replicates representatively shown in Figure 5a, two-tailed unpaired Student’s t-test; TSC1/Tubulin, t(4) = 8.457, p=0.0011; pS6K/S6K, t(4) = 5.062, p=0.0072; pAkt/Akt, t(4) = 8.401, p=0.0011). (b) Quantification referring to Figure 5b. Control average is set to 1 (n = 3 mice/genotype, including the biological replicates representatively shown in Figure 5b, two-tailed unpaired Student’s t-test; PTEN/Tubulin, t(4) = 6.185, p=0.0035; pAkt/Akt, t(4) = 6.662, p=0.0026; pS6K/S6K, t(4) = 6.837, p=0.0024). (c) Quantification referring to Figure 5c. Control average is set to 1 (n = 3 mice/genotype, including the biological replicates representatively shown in Figure 5c, two-tailed unpaired Student’s t-test; TSC1/Tubulin, t(4) = 10.76, p=0.0004; PTEN/Tubulin, t(4) = 4.879, p=0.0082; pS6K/S6K, t(4) = 4.477, p=0.011; pAkt/Akt, t(4) = 3.353, p=0.0285). (d) Quantification referring to Figure 5d. MpzCreERT2:Tsc1KO average is set to 1 (n = 3 mice/genotype, including the biological replicates representatively shown in Figure 5d, one-way ANOVA with Tukey’s multiple comparisons test, F(2,6) = 17.6, p=0.0031; pTSC1KO vs doubleKO = 0.0051, pPTENKO vs doubleKO = 0.0051). *p<0.05, **p<0.01, ***p<0.001.
Figure 5—figure supplement 2
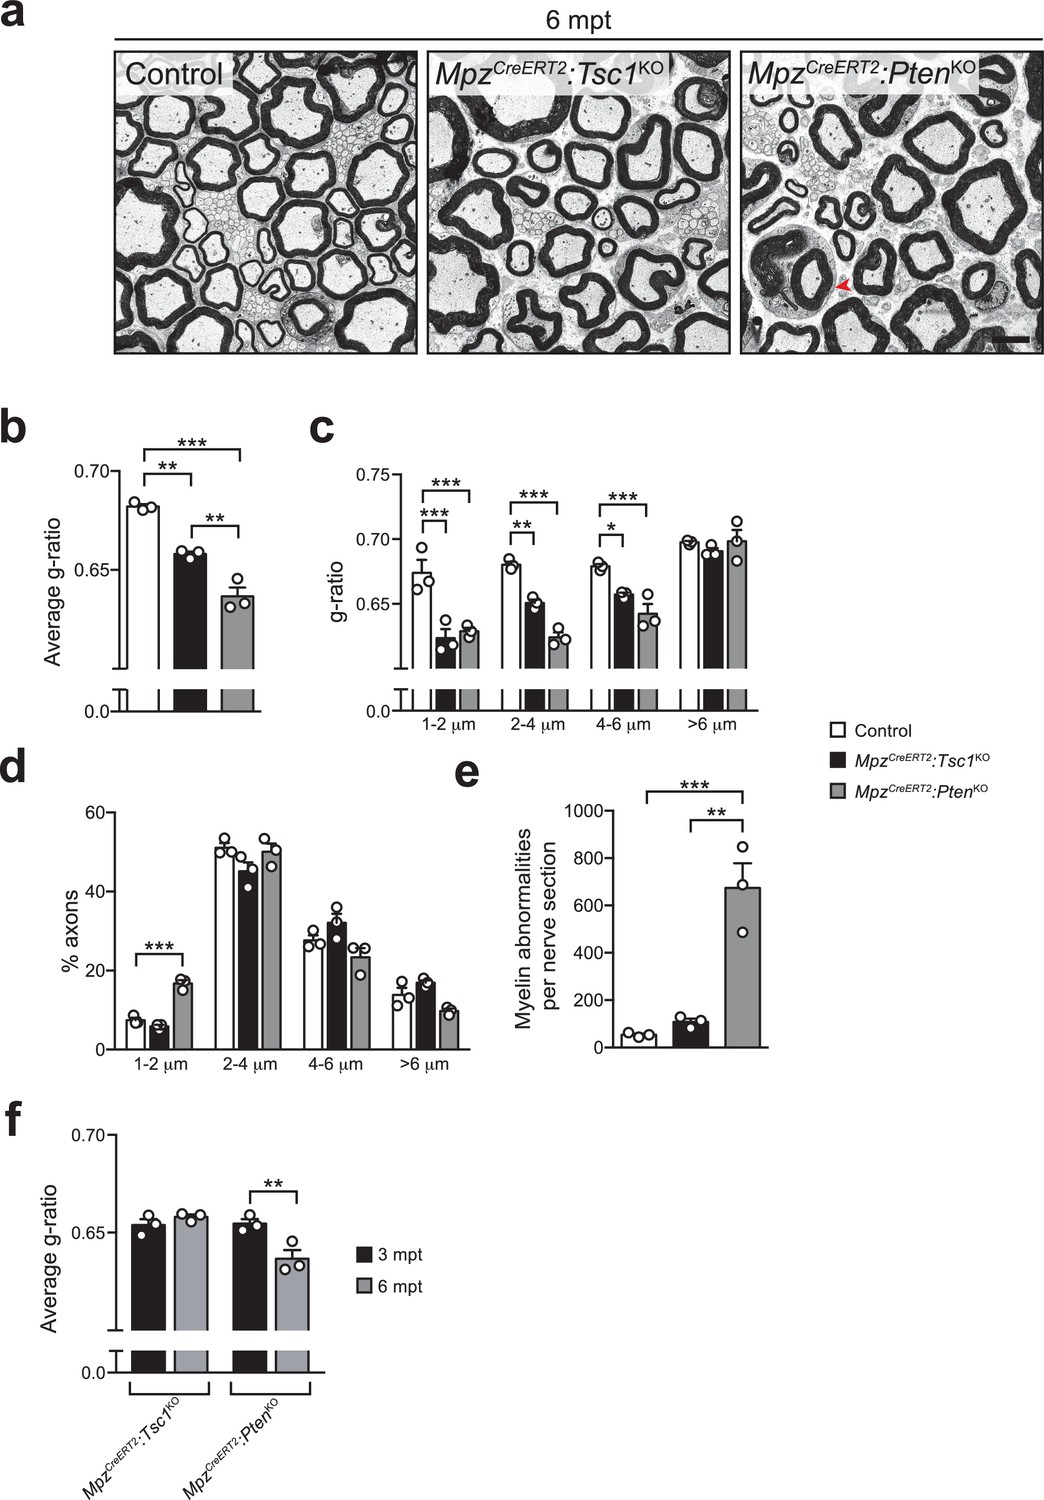
Radial hypermyelination in inducible knockout mice for TSC1 or PTEN is persistent at 6 mpt.
(a) Electron micrographs of 6 mpt control, MpzCreERT2:Tsc1KO, and MpzCreERT2:PtenKO sciatic nerves (n = 3 mice/genotype). Arrowhead: myelin outfolding. Scale bar: 4 μm, refers to whole panel. (b–d) G-ratios, g-ratio distribution, and axon diameter distribution of 6 mpt sciatic nerves from control and mutant mice. At least 200 myelinated fibers per sample were analyzed (random EM fields). Bar height: mean; error bars: s.e.m. (n = 3 mice/genotype; b, one-way ANOVA with Tukey’s multiple comparisons test, F(2,6) = 67.33, p<0.0001, pcontrol vs TSC1KO = 0.0021, pcontrol vs PTENKO <0.0001, pTSC1KO vs PTENKO = 0.0038; c, two-way ANOVA with Tukey’s multiple comparisons test, F(6,24) = 7.359, p=0.0002, p1-2 μm control vs TSC1KO<0.0001, p1-2 μm control vs PTENKO <0.0001, p2-4 μm control vs TSC1KO = 0.0015, p2-4 μm control vs PTENKO <0.0001, p4-6 μm control vs TSC1KO = 0.0191, p4-6 μm control vs PTENKO = 0.0001; d, two-way ANOVA with Tukey’s multiple comparisons test, F(6,24) = 10.91, p<0.0001, p1-2 μm control vs PTENKO = 0.0007). (e) Myelin abnormalities per sciatic nerve cross section in 6 mpt controls and mutants. Bar height: mean; error bars: s.e.m. (n = 3 mice/genotype, one-way ANOVA with Tukey’s multiple comparisons test, F(2,6) = 31.83, p=0.0006; pcontrol vs PTENKO = 0.0009, pTSC1KO vs PTENKO = 0.0014). (f) Comparison between average g-ratios of MpzCreERT2:Tsc1KO and MpzCreERT2:PtenKO mice at 3 and 6 mpt. Bar height: mean; error bars: s.e.m. (n = 3 mice/genotype, two-way ANOVA with Sidak’s multiple comparisons test, F(1,8) = 13.6, p=0.0062; pPTENKO 3 mpt vs 6 mpt = 0.0057). *p<0.05, **p<0.01, ***p<0.001.
Figure 5—figure supplement 3
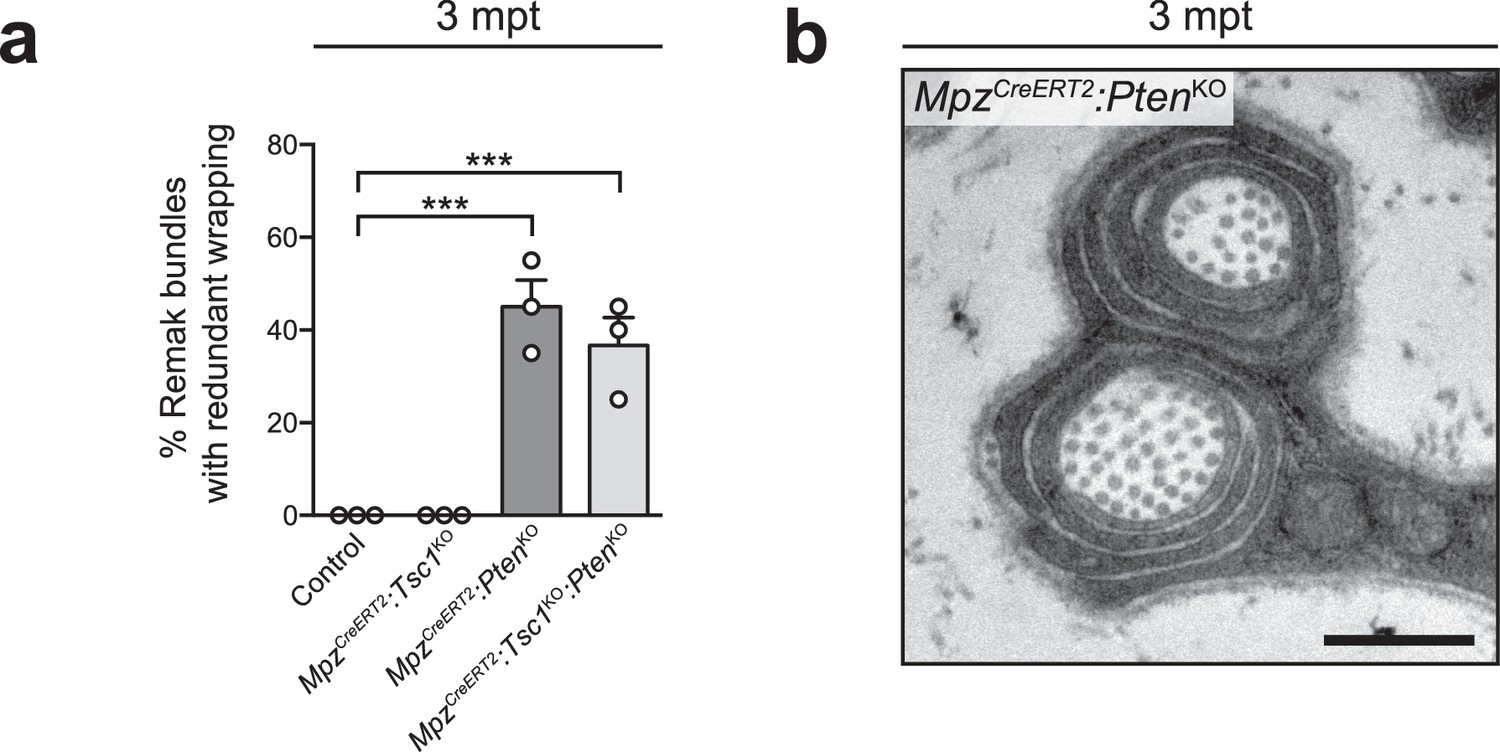
Redundant membrane wrapping in inducible knockout mice for PTEN, alone or in combination with TSC1.
(a) Quantification referring to Figure 5k. For each nerve, 20 Remak bundles were randomly selected, imaged, and the percentage of bundles containing at least one fiber with at least 1.5 wraps of Remak cell membrane was calculated. Bar height: mean; error bars: s.e.m. (n = 3 mice/genotype, one-way ANOVA with Dunnett’s multiple comparisons test, F(3,8) = 32.68, p<0.0001; pcontrol vs PTENKO = 0.0002, pcontrol vs doubleKO = 0.0007). (b) Electron micrograph showing a Remak cell membrane wrapping around collagen fibers in inducible PTEN mutants (n = 3 mice). Scale bar: 500 nm. ***p<0.001.
Figure 6 with 1 supplement
The differentiation status of SCs determines the outcome of mTORC1 hyperactivation.
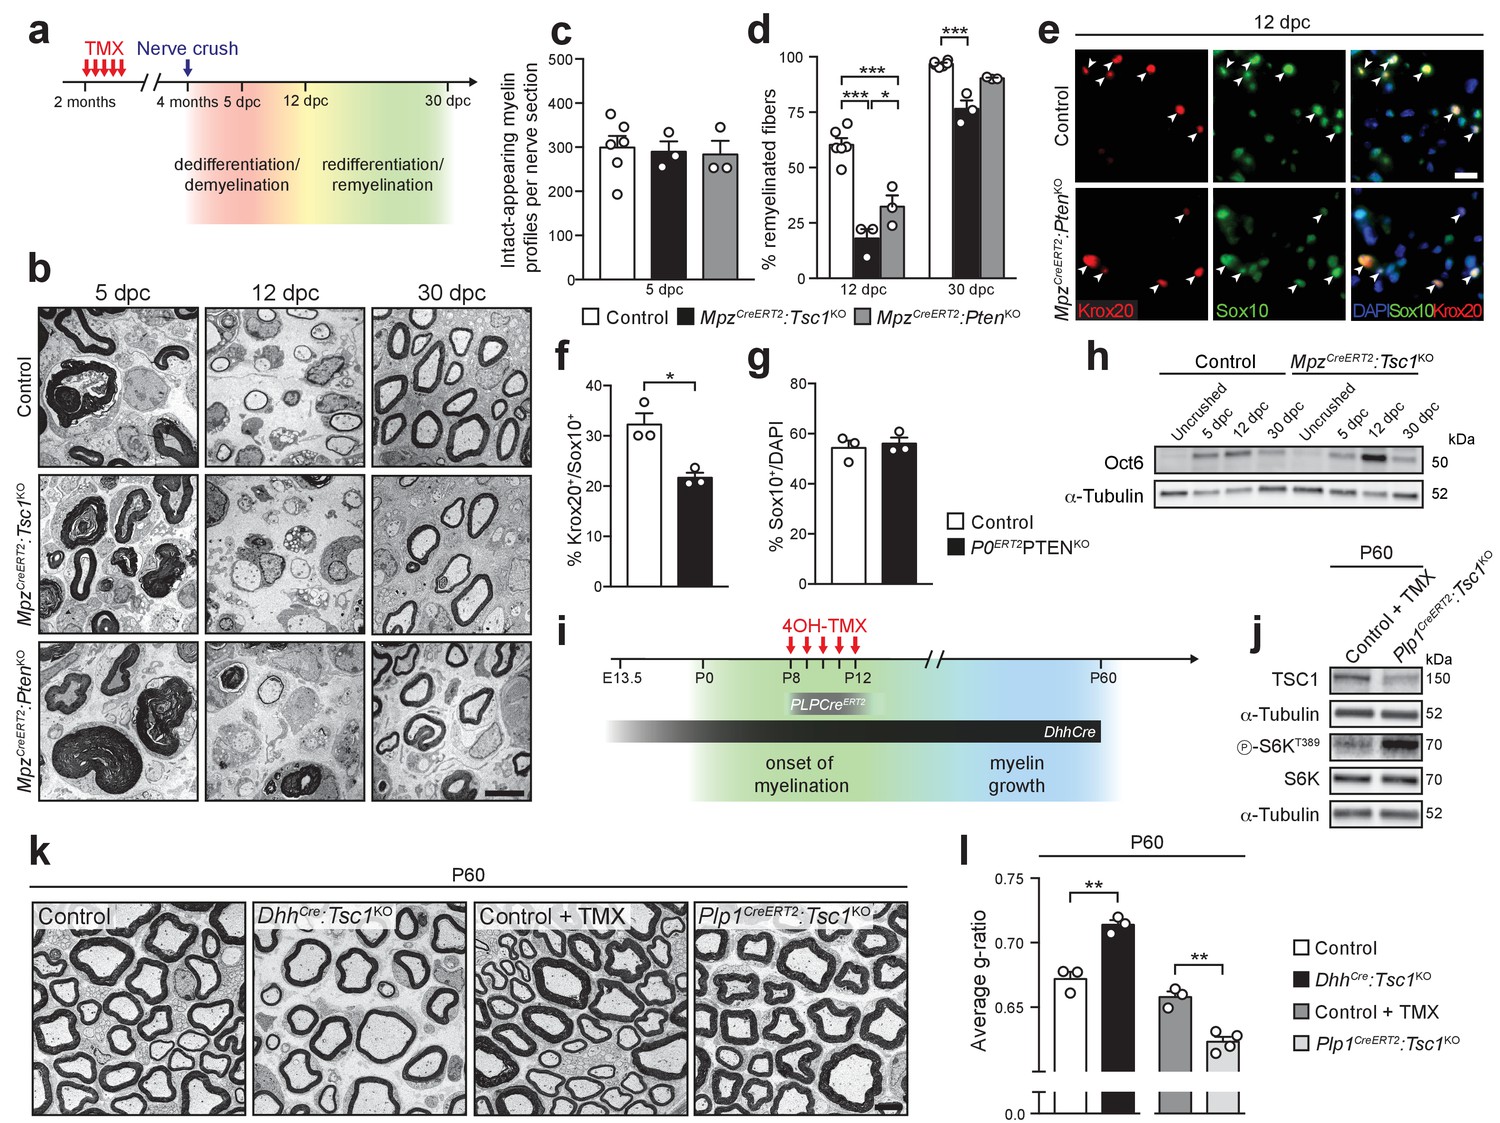
(a) Nerve crush injury outline. TMX: Tamoxifen. (b) Electron micrographs of control, MpzCreERT2:Tsc1KO, and MpzCreERT2:PtenKO sciatic nerves at 5, 12, and 30 dpc (n = 6 control mice and 3 mice for each mutant group/time point). Scale bar: 5 μm, refers to whole panel. (c) Intact-appearing myelin profiles per sciatic nerve at 5 dpc. Bar height: Mean; error bars: s.e.m. (n = 6 control mice and 3 mice for each mutant group, one-way ANOVA, F(2,9) = 0.08361, p=0.9205). (d) Remyelinated fibers relative to all sorted fibers. At least 100 sorted fibers per sample were counted (random EM fields). Bar height: mean; error bars: s.e.m. (n = 6 control mice and 3 mice for each mutant group, two-way ANOVA with Tukey’s multiple comparisons test, F(2,18) = 10.37, p=0.0010; 12 dpc, pcontrol vs TSC1KO<0.0001, pcontrol vs PTENKO <0.0001, pTSC1KO vs PTENKO = 0.0196; 30 dpc, pcontrol vs TSC1KO = 0.0003). (e) Immunostaining of sciatic nerves at 12 dpc (n = 3 mice/genotype). Nuclei: DAPI. Arrowheads: Krox20/Sox10 double-positive nuclei. Scale bar: 10 μm, refers to whole panel. (f,g) Quantification referring to e. Krox20/Sox10 double-positive of Sox10-positive nuclei (f), percentage of Sox10-positive nuclei (g). Bar height: Mean; error bars: s.e.m. (n = 3 mice/genotype, two-tailed unpaired Student’s t-test; f, t(4) = 4.366, p=0.012; g, t(4) = 0.4453, p=0.6792). (h) Western blot analysis of lysates of contralateral and crushed sciatic nerves (n = 3 mice/genotype for every time point). Quantification: Figure 6—figure supplement 1a. (i) Scheme depicting Cre activity in DhhCre+ animals or Plp1CreERT2+ animals treated with 4-hydroxytamoxifen (4OH-TMX) from P8 to P12. (j) Western blot analysis, P60 sciatic nerve lysates from 4-hydroxytamoxifen injected control (Control +TMX) and Plp1CreERT2:Tsc1KO animals (n = 3 mice/genotype). Quantification: Figure 6—figure supplement 1b. (k) Electron micrographs of P60 sciatic nerve cross sections from control, DhhCre:Tsc1KO, Control +TMX and Plp1CreERT2:Tsc1KO animals (n = 4 Plp1CreERT2:Tsc1KO animals, n = 3 for other conditions). Scale bar: 4 μm, refers to whole panel. (l) G-ratio analysis referring to k. At least 200 sorted fibers per sample were analyzed (random EM fields). Bar height: Mean; error bars: s.e.m. (n = 4 Plp1CreERT2:Tsc1KO animals, n = 3 for the other conditions, two-tailed unpaired Student’s t-test, t(4)control vs DhhCre:Tsc1KO = 6.346, t(5)control+TMX vs Plp1CreERT2:Tsc1KO = 5.917, pcontrol vs DhhCre:Tsc1KO = 0.0032, pcontrol+TMX vs Plp1CreERT2:Tsc1KO = 0.002). *p<0.05, **p<0.01, ***p<0.001.
Figure 6—figure supplement 1

Quantification of western blots.
Bar height: mean; error bars: s.e.m. (a) Quantification referring to Figure 6h. Uncrushed control average is set to 1 (n = 3 mice/genotype for every time point, including the biological replicates representatively shown in Figure 6h, two-way ANOVA with Sidak’s multiple comparisons test, F(3,16) = 11.62, p=0.0003; p12dpc = 0.0003). (b) Quantification referring to Figure 6j. Control average is set to 1 (n = 3 mice/genotype, including the biological replicates representatively shown in Figure 6j, two-tailed unpaired Student’s t-test; pS6K/S6K, t(4) = 7.29, p=0.0019; TSC1/Tubulin, t(4) = 11.34, p=0.0003). **p<0.01, ***p<0.001.
Figure 7
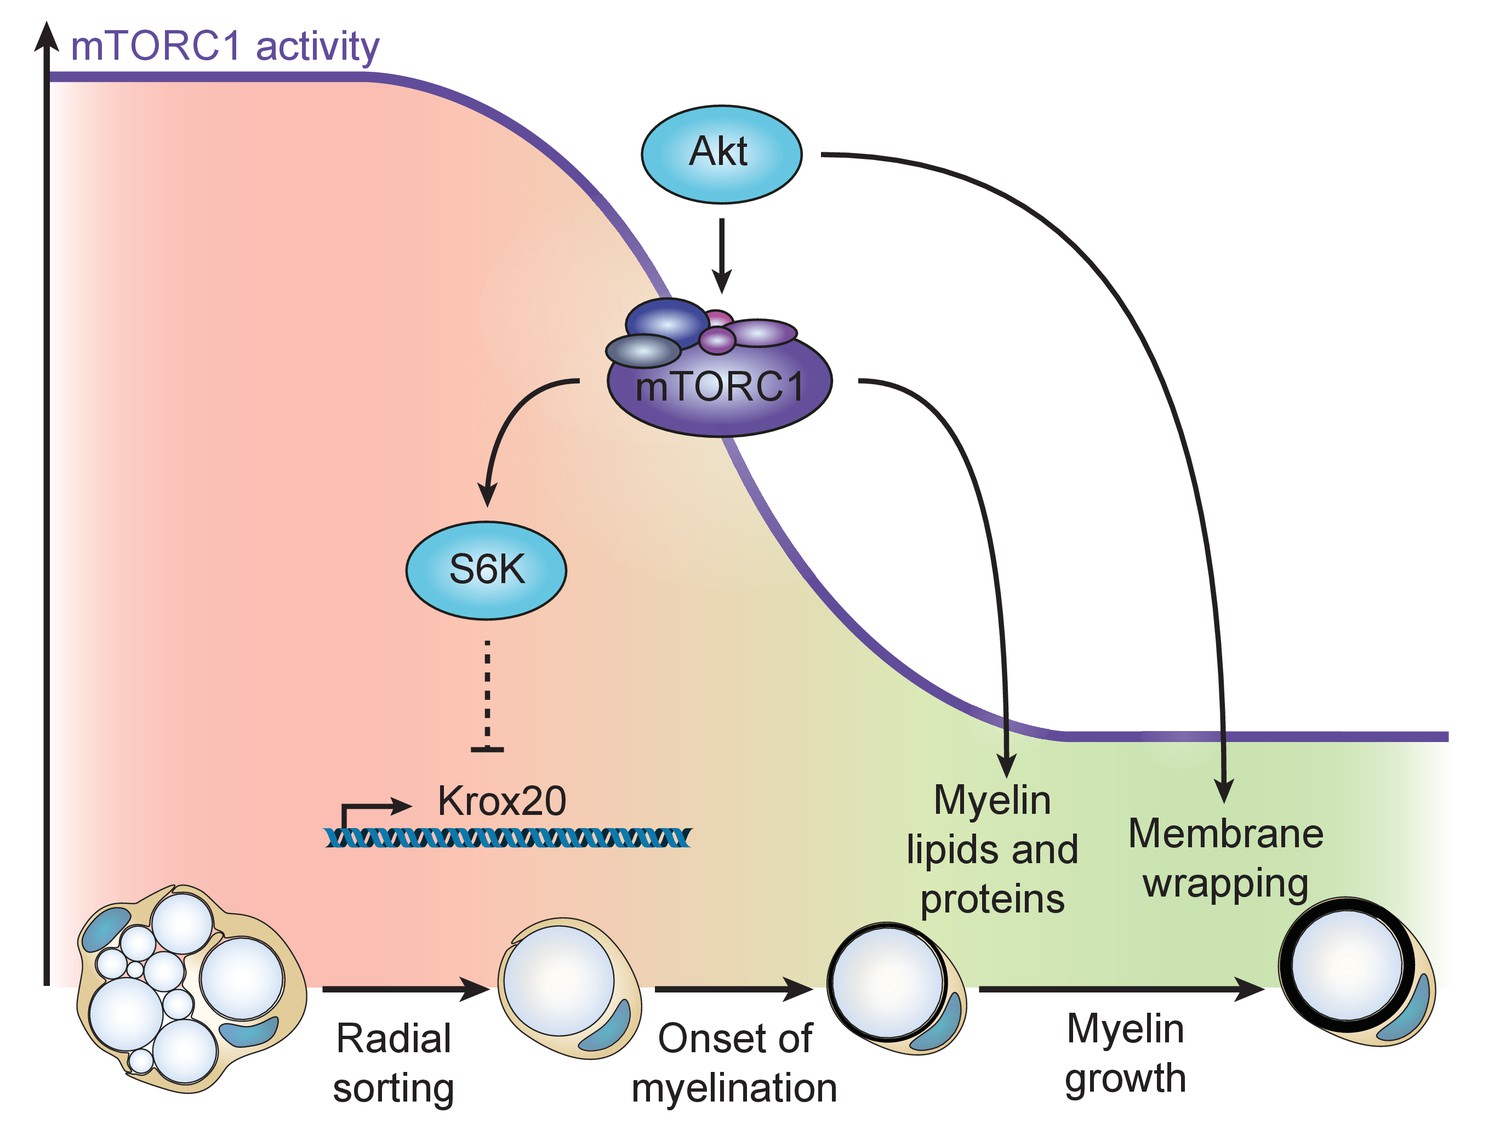
Model of the dual role of the PI3K-Akt-mTORC1 axis in SC myelination.
Before onset of myelination, high activity of the pathway inhibits the differentiation of SCs by negatively regulating Krox20 transcription via S6K. After SCs have started myelinating, mTORC1 and Akt synergize to promote myelin growth: mTORC1 enhances lipid synthesis, while Akt, additionally to activating mTORC1, is likely to drive membrane wrapping largely independent of mTORC1.
Additional files
-
Supplementary file 1
Full-length western blot images overlaid with the corresponding membranes.
- https://doi.org/10.7554/eLife.29241.023
-
Supplementary file 2
Full-length western blot images overlaid with the corresponding membranes.
(a) Western blot in Figure 1—figure supplement 2c. (b) Western blot in Figure 2a. The membrane was cut as indicated by the continuous line and probed with the indicated antibodies.
- https://doi.org/10.7554/eLife.29241.024
-
Supplementary file 3
Full-length western blot images overlaid with the corresponding membranes.
Western blot in Figure 2c. The membrane was cut as indicated by the continuous line and probed with the indicated antibodies.
- https://doi.org/10.7554/eLife.29241.025
-
Supplementary file 4
Full-length western blot images overlaid with the corresponding membranes.
(a) Western blot in Figure 2—figure supplement 2a. (b) Western blot in Figure 2—figure supplement 2c. The membrane was cut as indicated by the continuous line and probed with the indicated antibodies. (c) Western blot in Figure 2—figure supplement 2b. (d) Western blot in Figure 2g.
- https://doi.org/10.7554/eLife.29241.026
-
Supplementary file 5
Full-length western blot images overlaid with the corresponding membranes.
- https://doi.org/10.7554/eLife.29241.027
-
Supplementary file 6
Full-length western blot images overlaid with the corresponding membranes.
- https://doi.org/10.7554/eLife.29241.028
-
Supplementary file 7
Full-length western blot images overlaid with the corresponding membranes.
- https://doi.org/10.7554/eLife.29241.029
-
Supplementary file 8
Full-length western blot images overlaid with the corresponding membranes.
- https://doi.org/10.7554/eLife.29241.030
-
Transparent reporting form
- https://doi.org/10.7554/eLife.29241.031
Download links
A two-part list of links to download the article, or parts of the article, in various formats.
Downloads (link to download the article as PDF)
Open citations (links to open the citations from this article in various online reference manager services)
Cite this article (links to download the citations from this article in formats compatible with various reference manager tools)
Dual function of the PI3K-Akt-mTORC1 axis in myelination of the peripheral nervous system
eLife 6:e29241.
https://doi.org/10.7554/eLife.29241


