Multiple conserved cell adhesion protein interactions mediate neural wiring of a sensory circuit in C. elegans
- Albert Einstein College of Medicine, United States
Figures
Figure 1 with 3 supplements
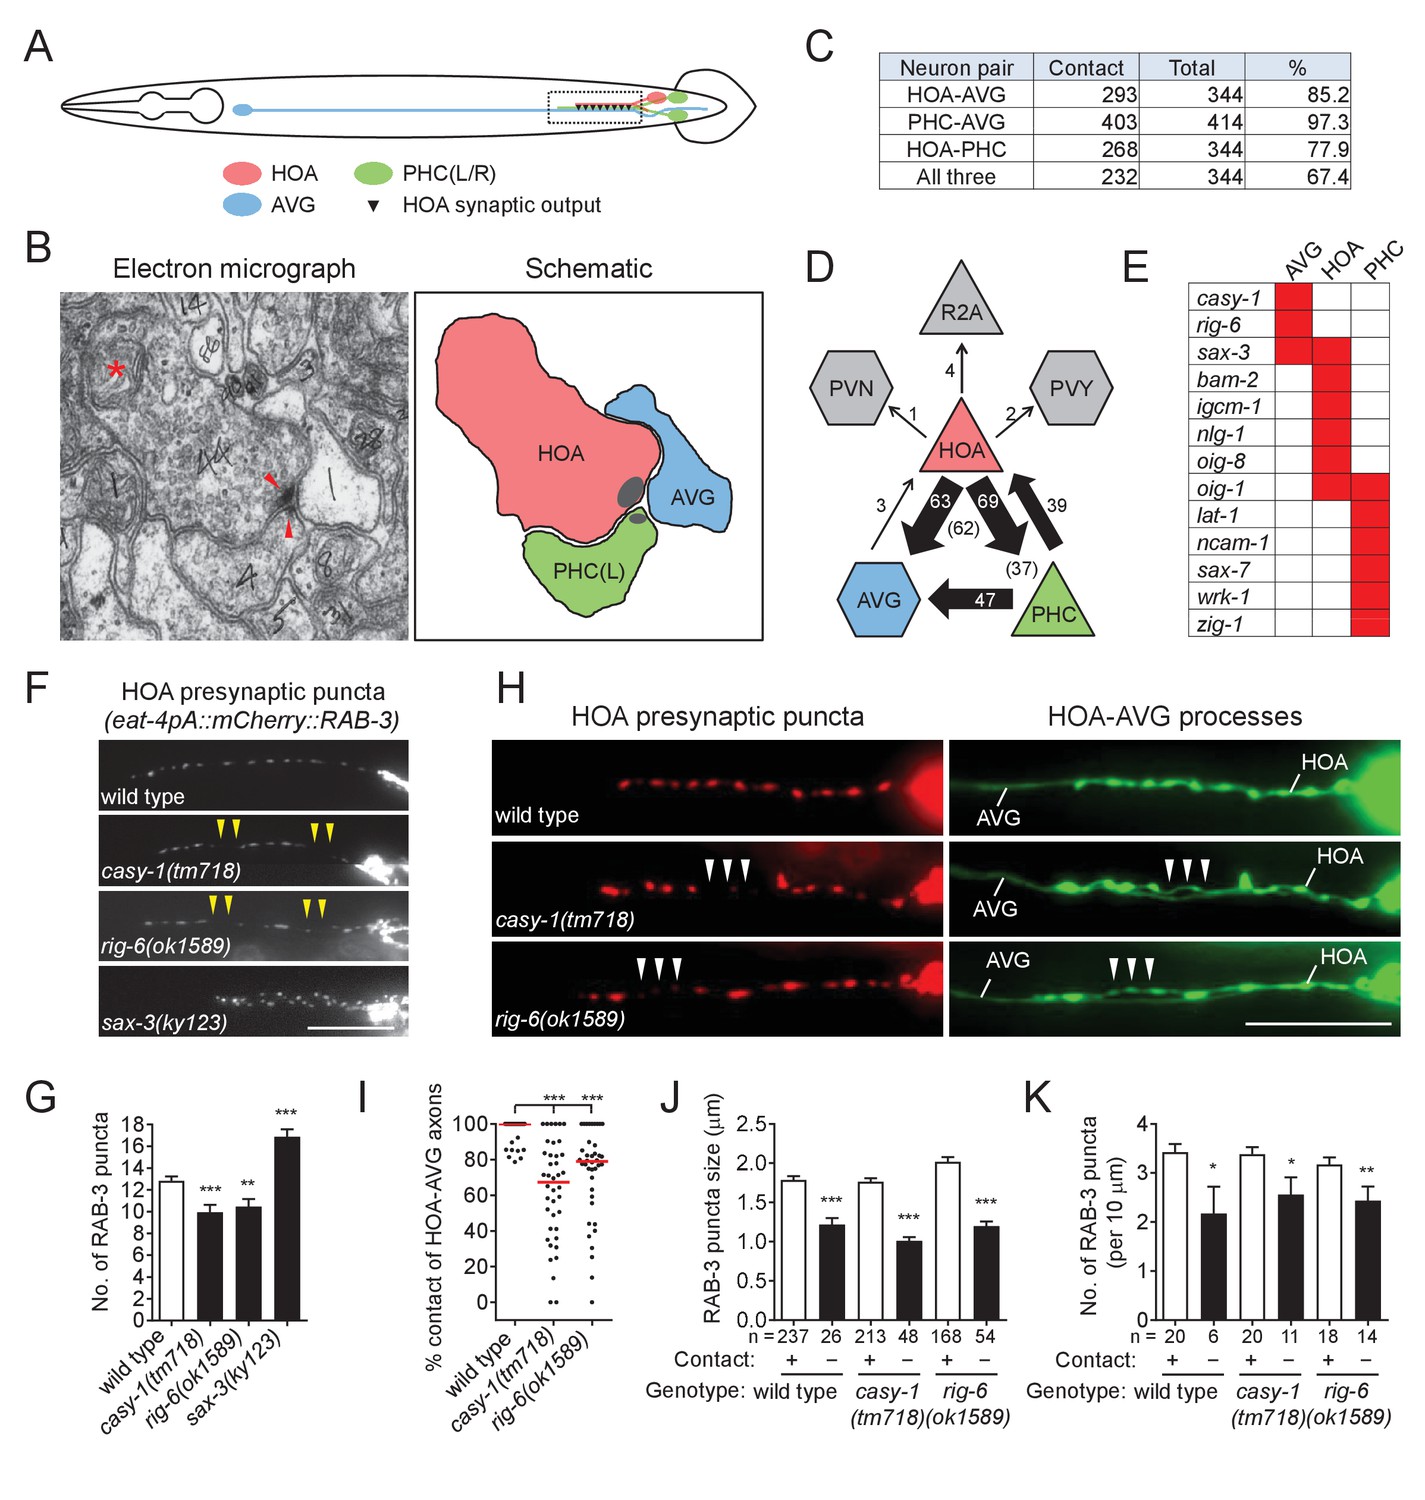
Cell adhesion protein genes casy-1 and rig-6 are required for axon fasciculation.
(A) Schematic of the position of cell bodies and axons of three neurons HOA (red), AVG (blue) and a pair of PHC (green) in the male (ventral view). The dashed box indicates the axons and HOA synaptic output analyzed in (C and D) and imaged in (F and H). (B) Electron micrograph showing the axons and synapses of HOA, PHC and AVG. Arrowheads indicate presynaptic density of dyadic synapses of HOA and PHC. Asterisk indicates a mitochondrion. In the schematic, axons are colored as in (A), and presynaptic density is indicated as gray. (C) The number of electron micrograph sections for axon-axon contact between neuron pairs. N2Y series were analyzed from section #13906 to #14249, except for the PHC-AVG (from #13836 to #14249) (WormWiring: http://wormwiring.org). See also Supplementary file 1. (D) Synaptic output of HOA and the connectivity of HOA, AVG and PHC in the boxed region shown in (A). (HOA makes additional connections outside this region.) Synaptic weight determined by electron micrograph section numbers is indicated. The number of sections that contain dyadic synapses (HOA > AVG,PHC or PHC > HOA,AVG) is indicated in parenthesis. (E) Expression of transcriptional reporters for neural cell adhesion genes in the three neurons. One hundred out of 106 neural cell adhesion genes (94%) have been examined and the genes having expression in the three neurons are shown. (F) Distribution of a mCherry-tagged presynaptic marker RAB-3 in HOA axon of wild type or indicated mutants. Arrowheads indicate gaps between the presynaptic puncta. (G) Number of mCherry::RAB-3 puncta in mutants was counted and compared to wild type (n = 30). Error bars are SEM. (H) HOA presynaptic puncta (mCherry::RAB-3; red) were simultaneously visualized with GFP-labeled HOA and AVG axons (green) in wild type, or casy-1 or rig-6 mutant animals. Arrowheads indicate the gap region containing smaller or fewer presynaptic puncta. (I) Percentage of axon-axon contact between HOA and AVG in wild type or mutant animals (n = 40). Each dot represents individual animal. Red bar represents the median. (J and K) The mCherry::RAB-3 puncta size (J) or number (K) was measured and compared in the contacting and non-contacting axonal segments between HOA and AVG for the indicated genotypes. The number of the puncta (J) or of axon segments (K) analyzed is indicated below each column. Error bars are SEM. Scale bars, 20 μm. *p<0.05; **p<0.01; ***p<0.001 (by Mann-Whitney test). For the data and statistics, see Figure 1—source data 1.
-
Figure 1—source data 1
Source data for Figure 1, Figure 1—figure supplement 1, and Figure 1—figure supplement 2.
- https://doi.org/10.7554/eLife.29257.006
Figure 1—figure supplement 1
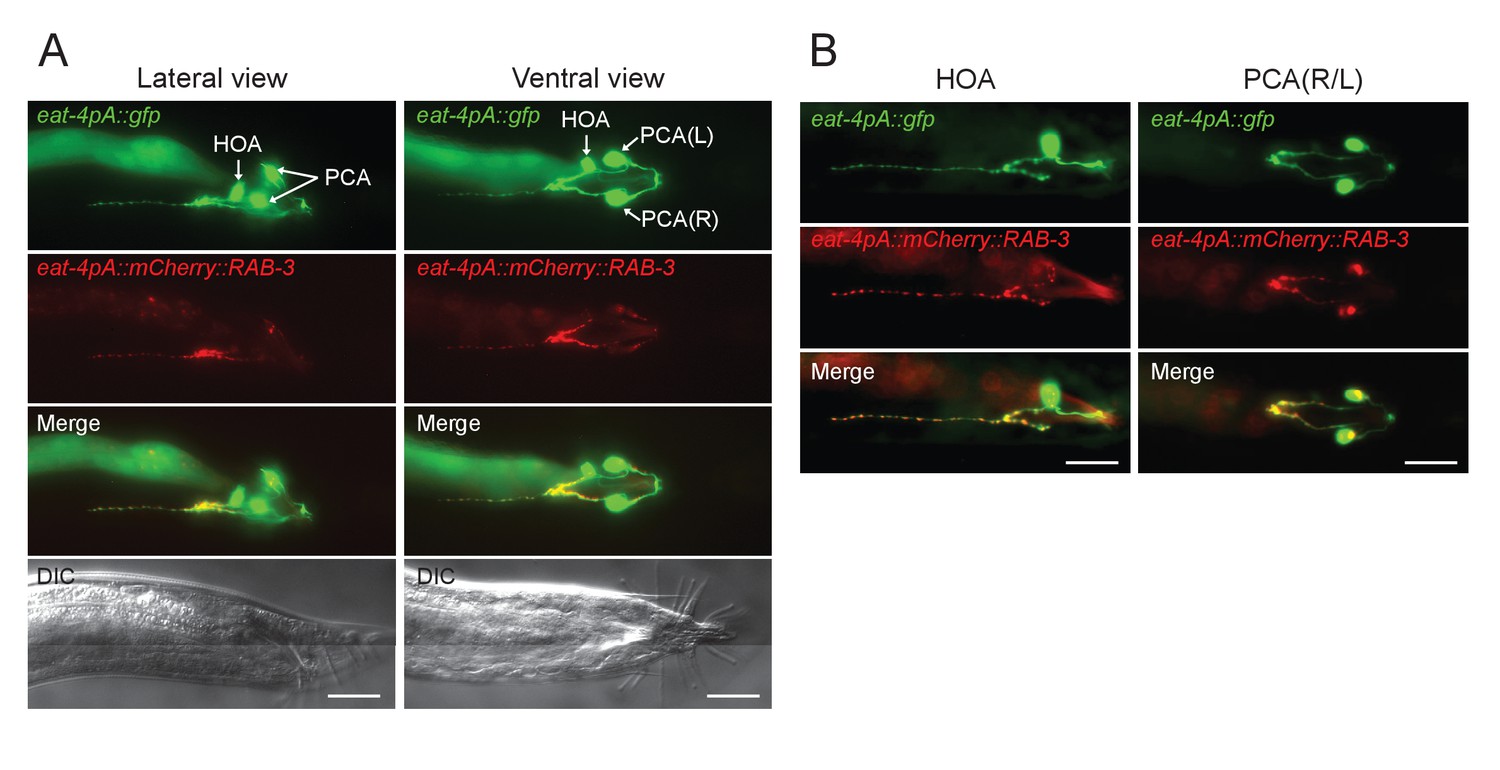
Visualizing HOA presynapses.
(A) Lateral and ventral views of the tail region of animals carrying eat-4pA::gfp (green) and eat-4pA::mcherry::RAB-3 (red). The eat-4pA is a fragment of eat-4 promoter and drives expression only in HOA and PCA in the male tail. (B) Images of mosaic expression in HOA or PCA in transgenic animals used in (A). HOA, but not PCA, has an anteriorly-oriented projection with discrete RAB-3 puncta. Scale bars, 20 μm.
Figure 1—figure supplement 2
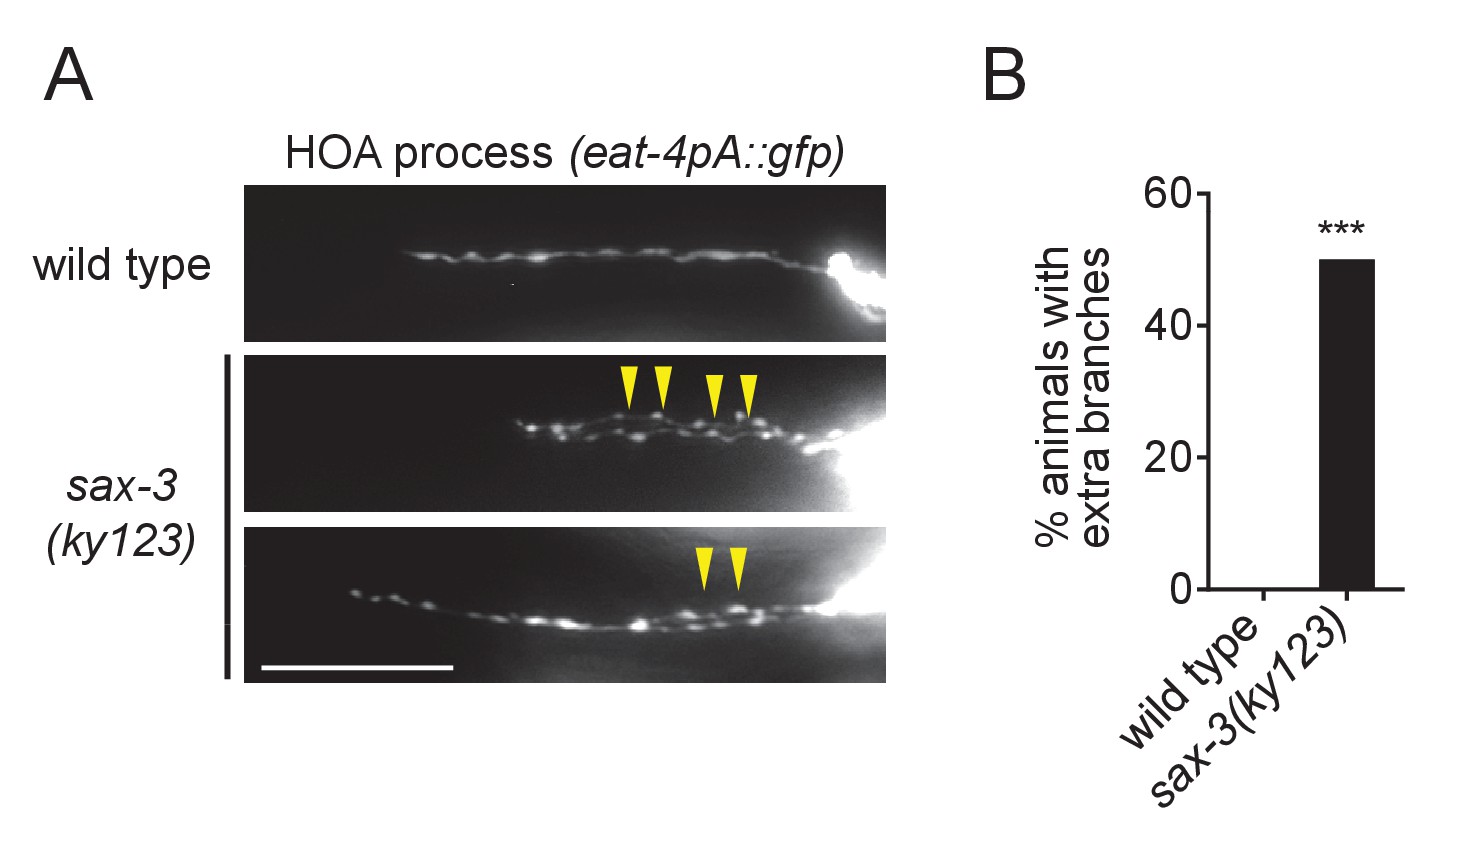
Extra branching of HOA in sax-3(ky123) mutants.
(A) HOA axon of wild type or sax-3(ky123) mutants. Arrowheads indicate extra branches of HOA. Scale bar, 20 μm. Percentage of animals with extra branches of HOA was measured and compared to wild type (n = 50). ***p<0.001 (by Fisher’s exact test). For the data and statistics, see Figure 1—source data 1.
Figure 1—figure supplement 3
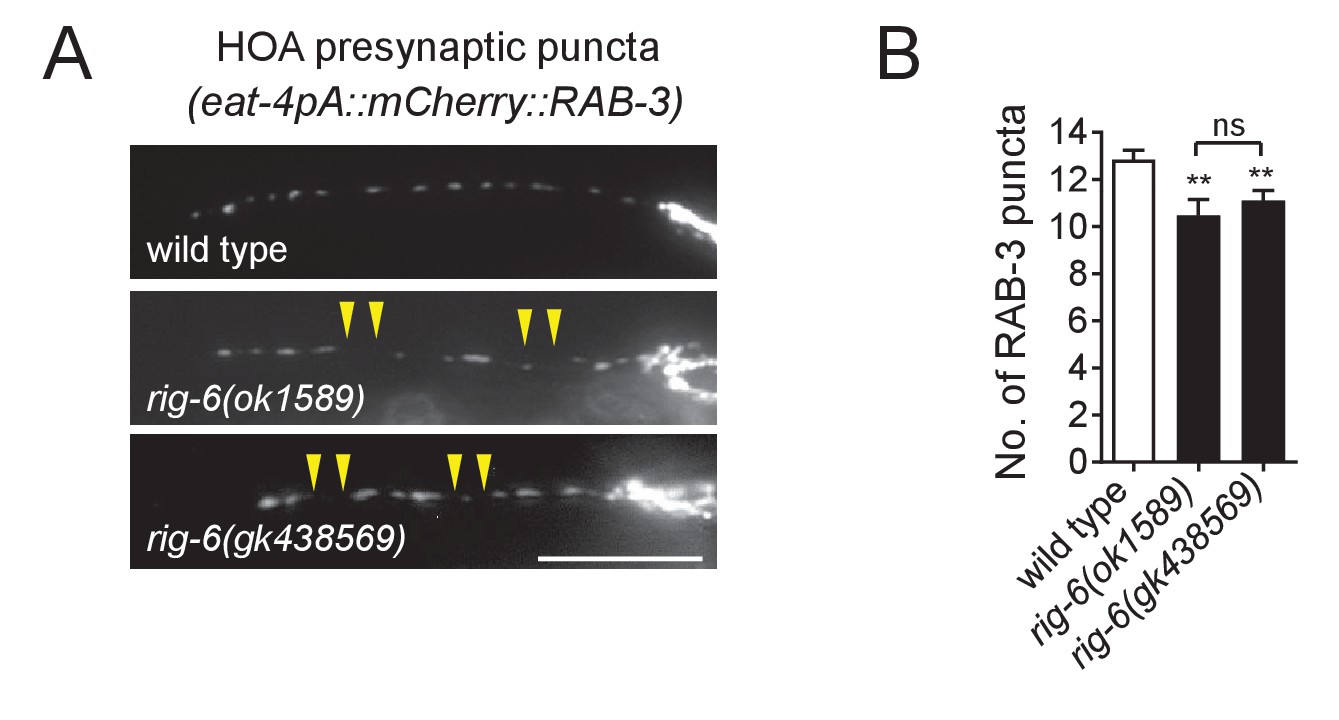
Phenotypes of rig-6(gk438569) mutants.
(A) Distribution of a mCherry-tagged presynaptic marker RAB-3 in HOA axon of rig-6(gk438569) mutants. Arrowheads indicate gaps between the presynaptic puncta. Scale bar, 20 μm. (B) Number of mCherry::RAB-3 puncta in mutants was counted and compared to wild type (n = 30). Error bars are SEM. The data for wild type and rig-6(ok1589) mutants are identical to those in Figure 1 and are shown for comparison. **p<0.01; ns, not significant (by Mann-Whitney test). For the data and statistics, see Figure 1—source data 1.
Figure 2 with 2 supplements
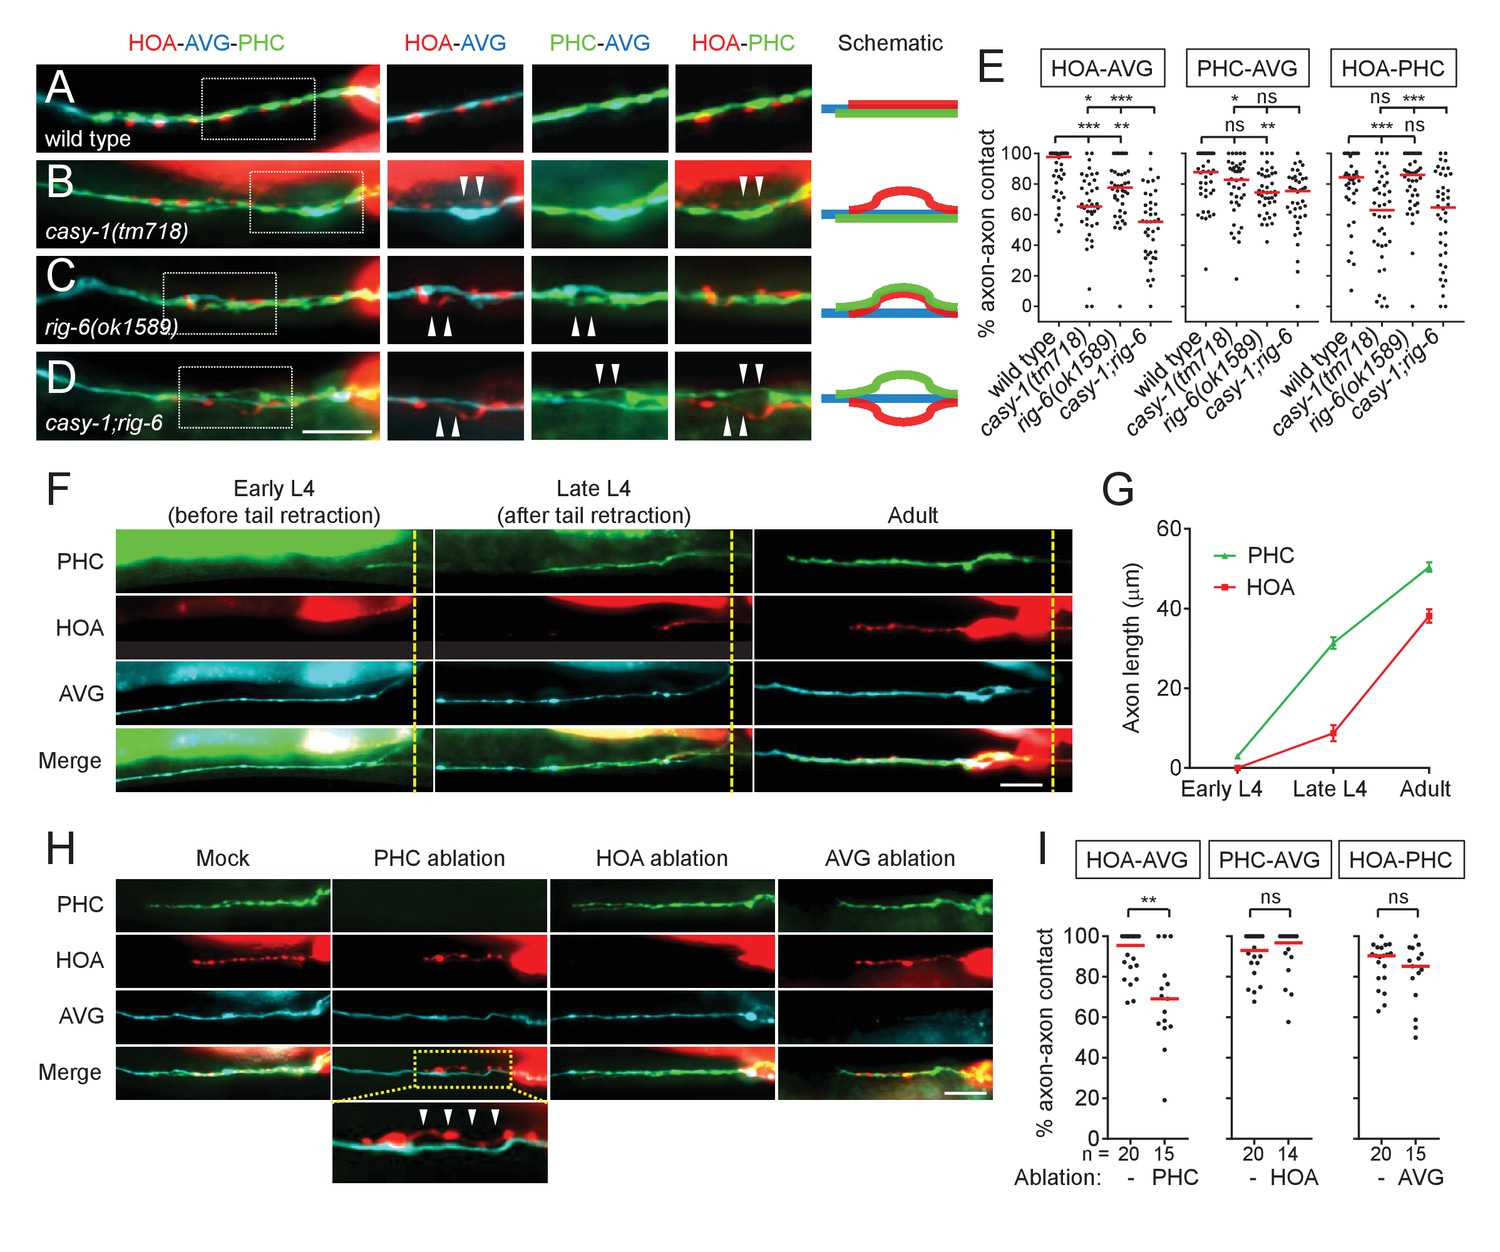
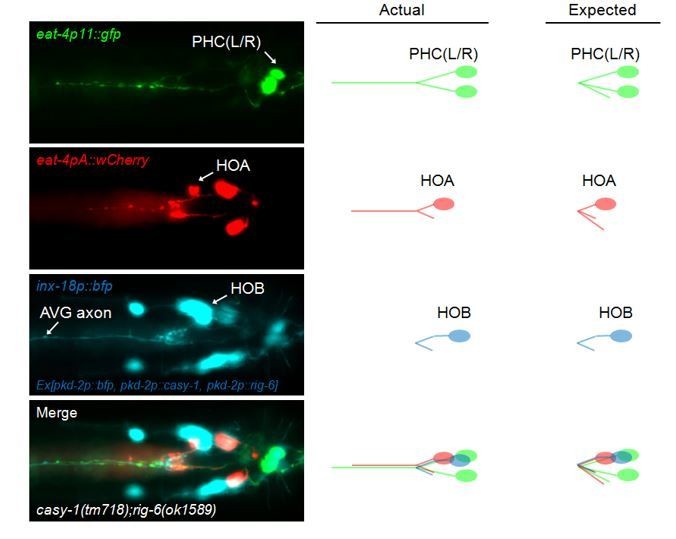
Axon fasciculation defects of casy-1 and rig-6 are distinguishable.
(A–D) The axons of the three neurons were individually labeled with wCherry (HOA; red), TagBFP (AVG; blue), and GFP (PHC; green) in wild type (A), casy-1(tm718) (B), rig-6(ok1589) (C), or casy-1;rig-6 double mutants (D). Axon fasciculation between each neuronal pair in the dashed box region and schematic of axon fasciculation are shown on the right. Arrowheads indicate the region where two axons are detached from each other. (E) Percentage of axon-axon contact between each neuronal pair in wild type or mutant animals (n = 40). Each dot represents individual animal. Red bar represents the median. (F) Developmental timing of axon extension of the three neurons in males. Each developmental stage was determined by the tail morphology of the male. Dashed lines indicate the posterior end of the intestine. (G) Axon length was measured from the point where the AVG axon makes a turn in the pre-anal ganglion (n = 15). Error bars are SEM. (H) Axon fasciculation of the three neurons in mock-, PHC-, HOA-, or AVG-ablated animal. Arrowheads indicate the region where HOA and AVG axons are detached from each other. (I) Percentage of axon-axon contact between each neuronal pair in mock-, PHC-, HOA-, or AVG-ablated animals. The number of animals analyzed is indicated. Scale bars, 20 μm. *p<0.05; **p<0.01; ***p<0.001; ns, not significant (by Mann-Whitney test). For the data and statistics, see Figure 2—source data 1.
-
Figure 2—source data 1
Source data for Figure 2 and Figure 2—figure supplement 2.
- https://doi.org/10.7554/eLife.29257.010
Figure 2—figure supplement 1
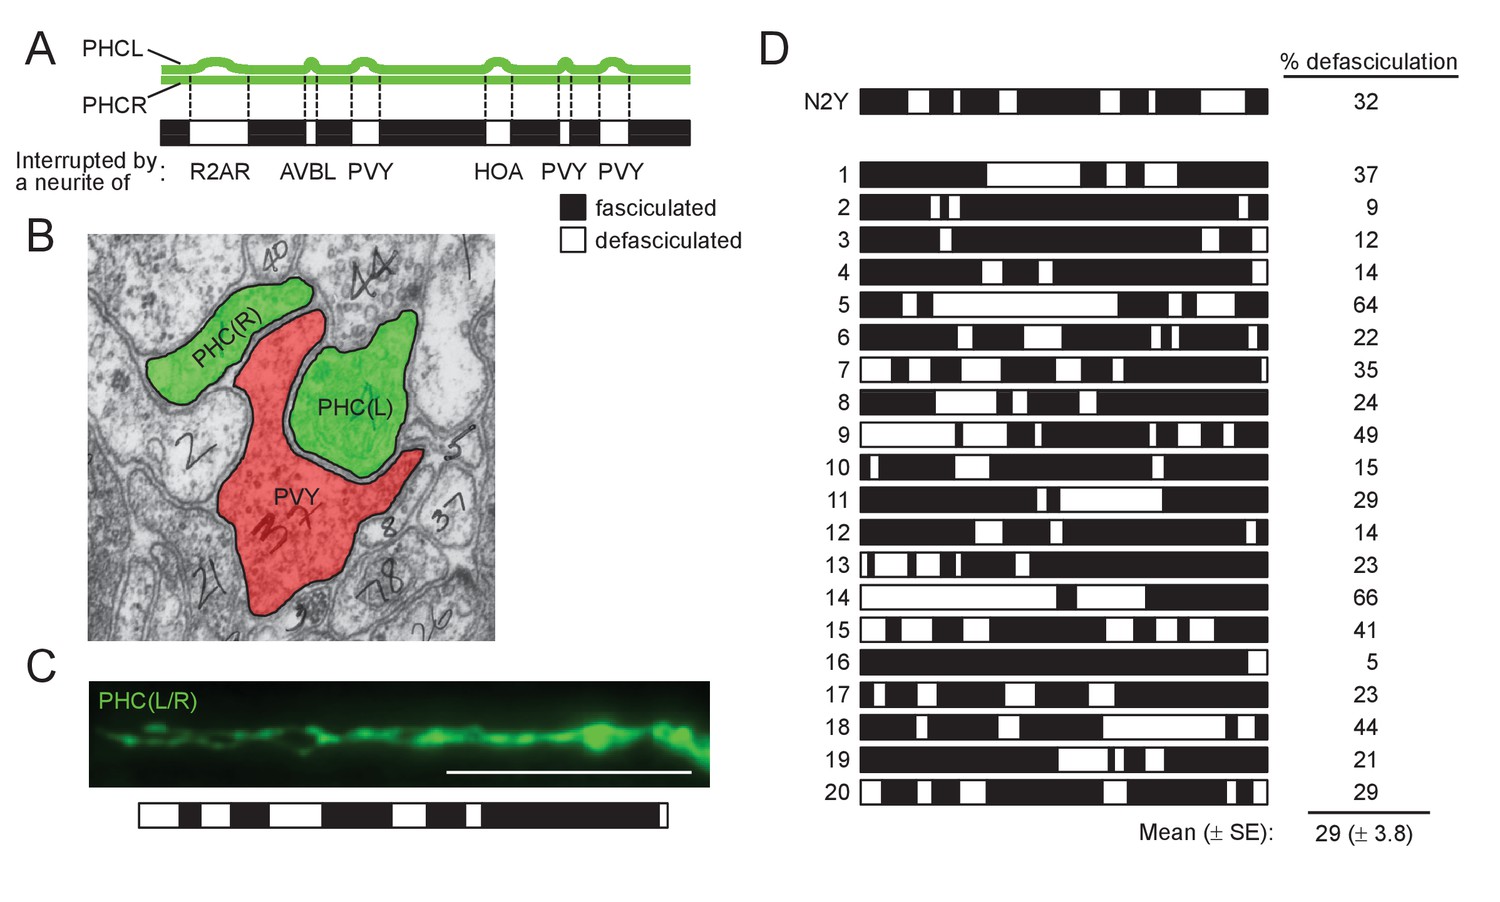
Comparison of PHCL-PHCR defasciculation in electron micrographs and fluorescence images.
(A) Schematic of axon fasciculation between PHCL and PHCR neurons reconstructed from electron micrographs of an adult male N2Y (from section #13883 to #14249). Note that fasciculation of these axons is interrupted by single neurites of other neurons indicated. (B) Electron micrograph showing defasciculation of PHCL and PHCR axons with one-neurite distance (by a PVY neurite). (C) Fluorescence image of PHCL and PHCR axons (eat-4p11::gfp) was used to measure the length of fasciculation or defasciculation and this was summarized as a bar graph as in (A). Scale bar, 20 μm. (D) Summary of measurement of PHCL-PHCR fasciculation using fluorescence images obtained from 20 individual animals. The N2Y animal is shown for comparison.
Figure 2—figure supplement 2

Phenotypes of rig-6(gk438569) mutants.
(A) Images of axon placement of HOA, AVG and PHC in rig-6(gk438569) mutants. Axon fasciculation between each neuronal pair in the dashed box region and schematic of axon fasciculation are shown on the right. Arrowheads indicate the region where two axons are detached from each other. Scale bar, 20 μm. (B) Percentage of axon-axon contact between each neuronal pair in rig-6(gk438569) mutant animals (n = 40). Each dot represents individual animal. Red bar represents the median. The data for wild type and rig-6(ok1589) mutants are identical to those in Figure 2 and are shown for comparison. *p<0.05; **p<0.01; ns, not significant (by Mann-Whitney test). For the data and statistics, see Figure 2—source data 1.
Figure 3
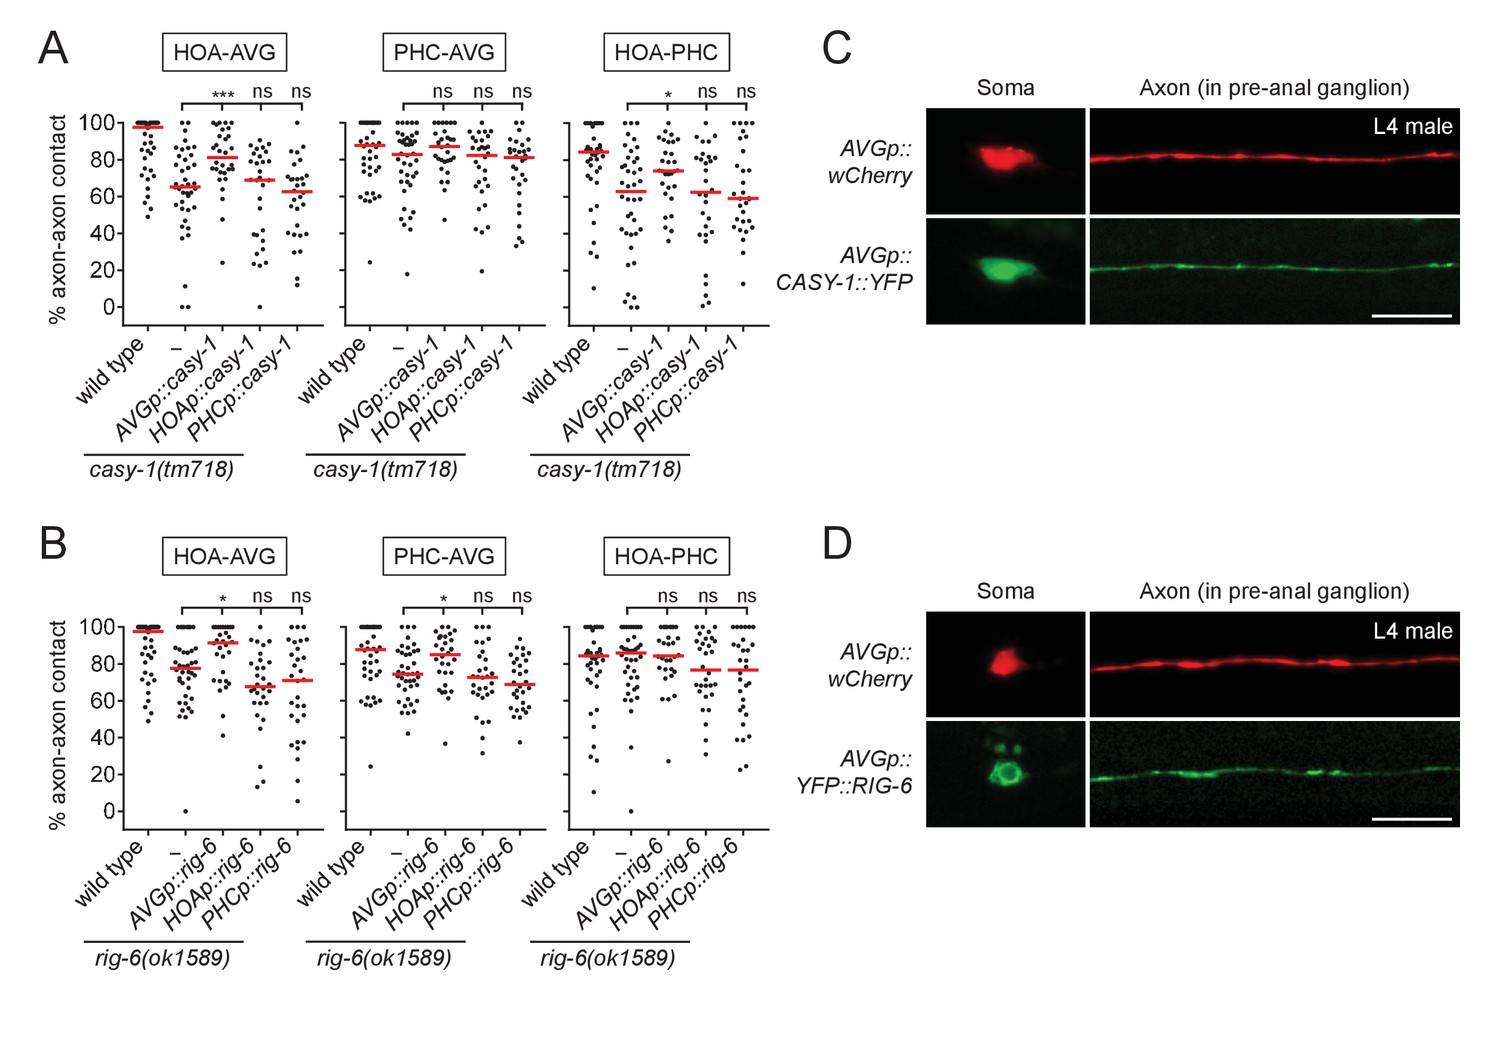
CASY-1 and RIG-6 act in postsynaptic AVG for axon fasciculation.
(A and B) Percentage of axon-axon contact between each neuronal pair in animals expressing a full-length casy-1 (A) or rig-6 cDNA (B) in postsynaptic AVG or presynaptic HOA or PHC in a respective mutant background (n = 30). The data for wild type and casy-1 and rig-6 mutants are identical to those in Figure 2 and are shown for comparison. Each dot represents individual animal. Red bar represents the median. *p<0.05; ***p<0.001; ns, not significant (by Mann-Whitney test). For the data and statistics, see Figure 3—source data 1. (C and D) Subcellular localization of YFP-tagged CASY-1 (C) or RIG-6 (D) in AVG (green) with the cytoplasmic marker wCherry (red) in L4 males. Scale bars, 20 μm. AVGp, inx-18p (Oren-Suissa et al., 2016); HOAp, eat-4pA (this study; see Figure 1—figure supplement 1 for expression); PHCp, eat-4p11 (Serrano-Saiz et al., 2017a).
-
Figure 3—source data 1
Source data for Figure 3.
- https://doi.org/10.7554/eLife.29257.012
Figure 4
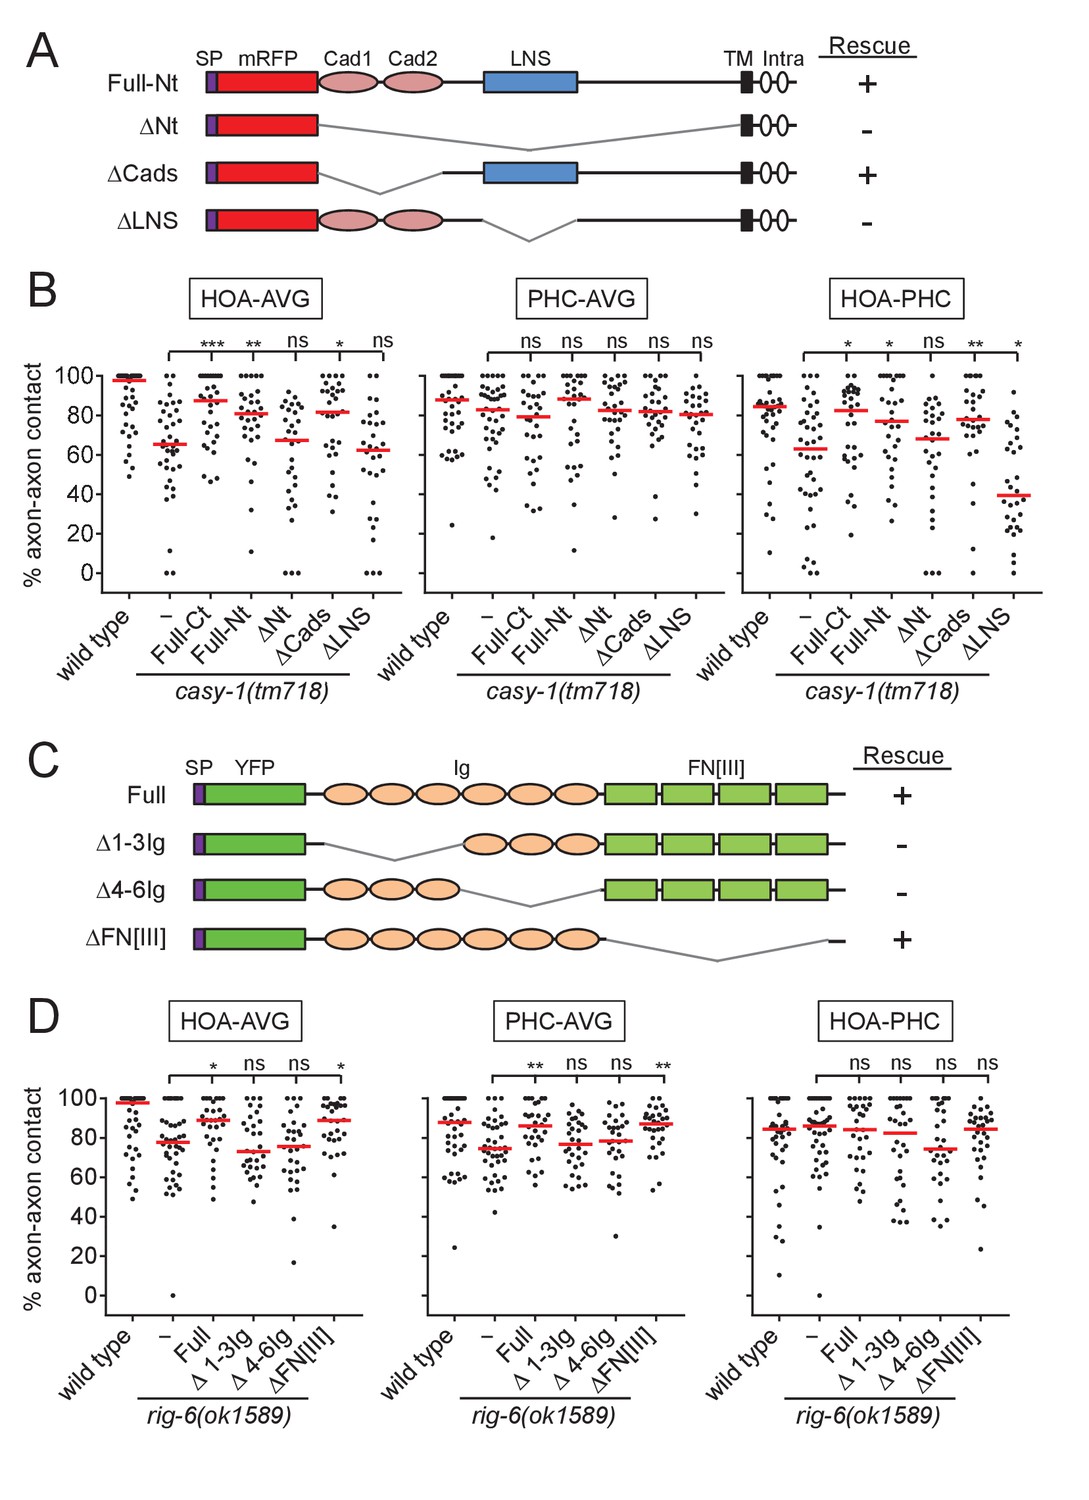
Structure-function analysis for CASY-1 and RIG-6.
(A and C) Domain structure of mRFP::CASY-1 and its deletion constructs (A) or of YFP::RIG-6 and its deletion constructs (C) with the summary of rescue activity when expressed in AVG of casy-1 or rig-6 mutant animals. SP, signal peptide; Cad, cadherin domain; LNS, laminin neurexin sex hormone binding protein domain; TM, transmembrane; Intra, intracellular domain; Ig, immunoglobulin domain; FN[III], fibronectin type III domain. (B and D) Percentage of axon-axon contact between each neuronal pair in animals expressing the indicated deletion constructs for CASY-1 (B) or RIG-6 (D) in AVG of casy-1 or rig-6 mutant animals (n = 30). Note that Full-Ct (CASY-1::YFP) in (B) and Full (YFP::RIG-6) in (D) were the same transgenes used for protein localization in Figure 3, and rescued axon fasciculation defects in mutants. The data for wild type and casy-1 and rig-6 mutants are the same as shown in Figure 2. Each dot represents individual animal. Red bar represents the median. *p<0.05; **p<0.01; ***p<0.001; ns, not significant (by Mann-Whitney test). For the data and statistics, see Figure 4—source data 1.
-
Figure 4—source data 1
Source data for Figure 4.
- https://doi.org/10.7554/eLife.29257.014
Figure 5 with 2 supplements
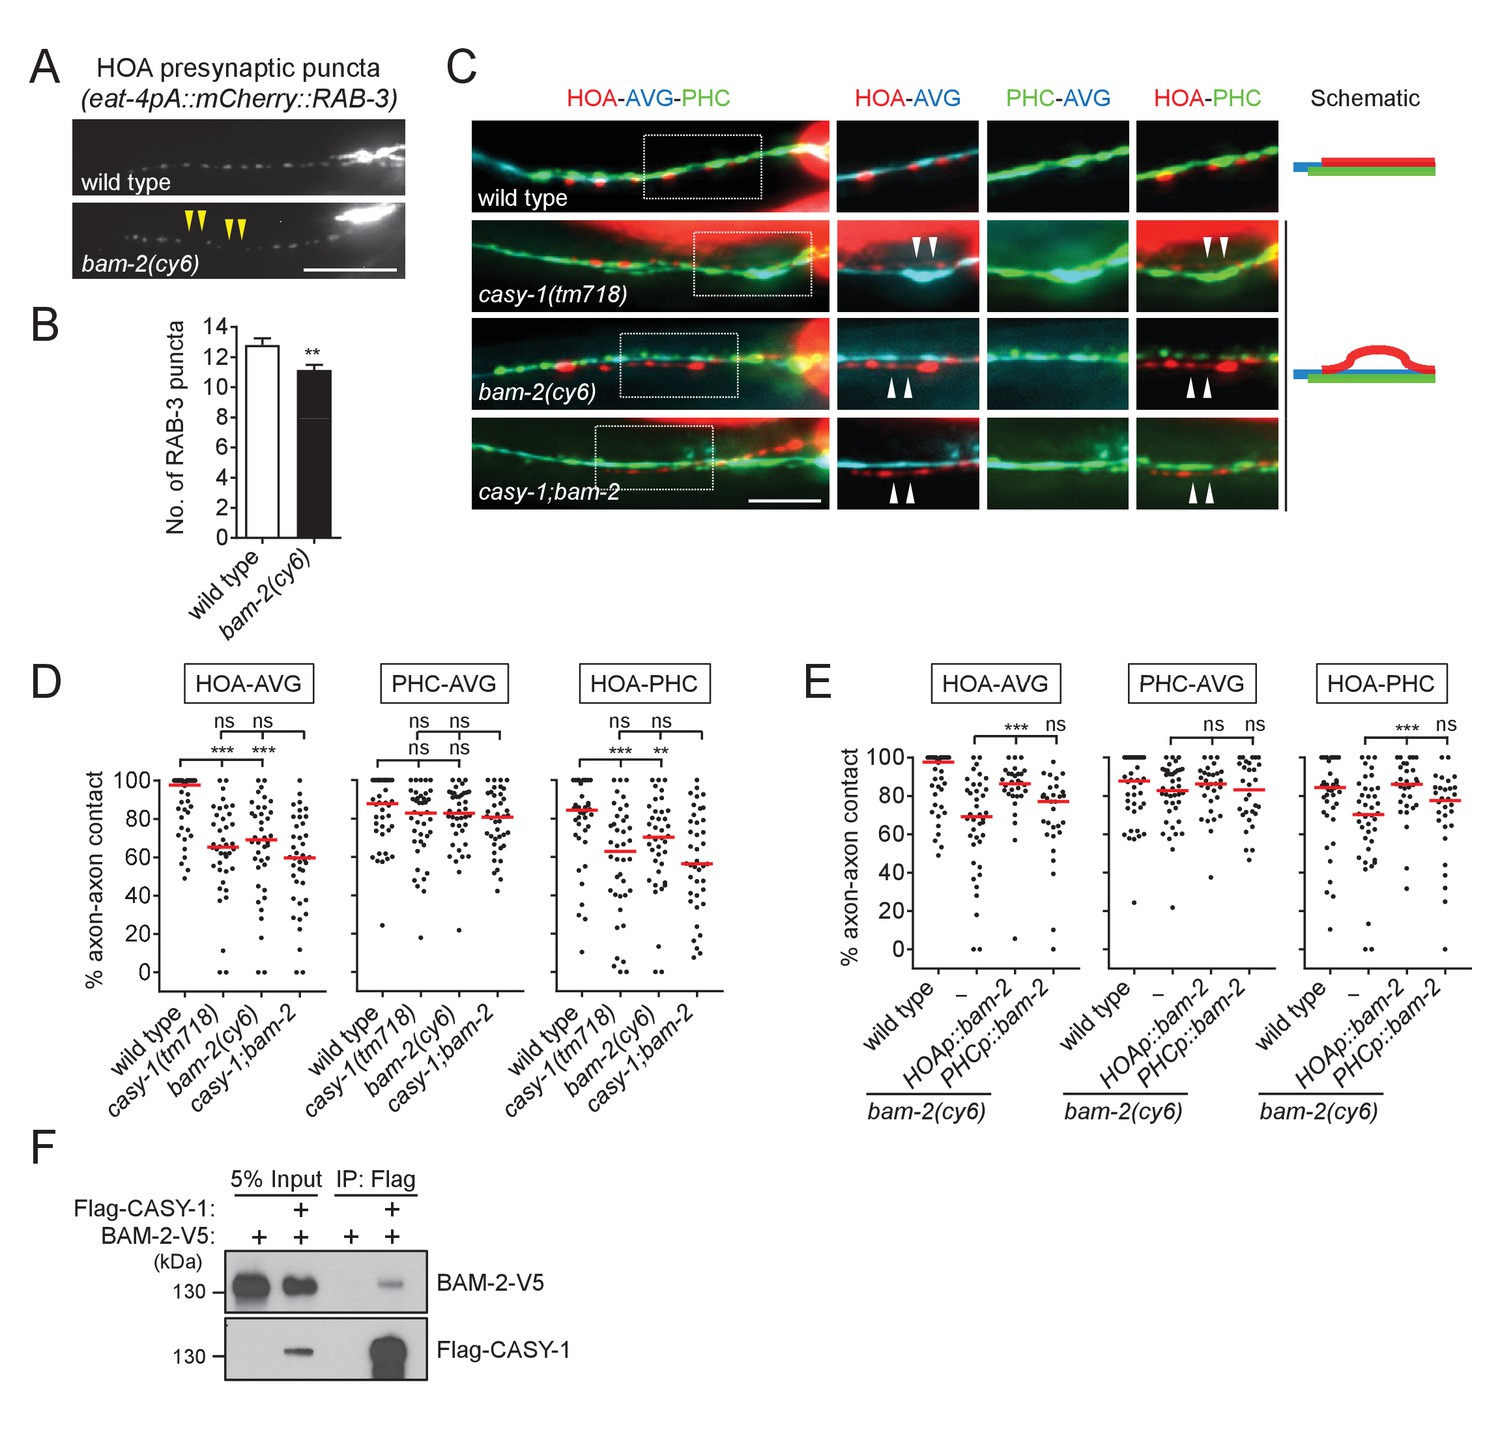
BAM-2 interacts with CASY-1.
(A) Distribution of a mCherry-tagged presynaptic marker RAB-3 in HOA axon of wild type or bam-2(cy6) mutants. Arrowheads indicate gaps between the presynaptic puncta. (B) Number of mCherry::RAB-3 puncta in bam-2 mutants was counted and compared to wild type (n = 30). Error bars are SEM. (C) Images of axon placement of HOA, AVG and PHC in bam-2 and casy-1;bam-2 double mutants. Axon fasciculation between each neuronal pair in the dashed box region and schematic of axon fasciculation are shown on the right. Arrowheads indicate the region where two axons are detached from each other. (D) Percentage of axon-axon contact between each neuronal pair in wild type or mutant animals (n = 40). Each dot represents individual animal. Red bar represents the median. (E) Percentage of axon-axon contact between each neuronal pair in animals expressing a full-length bam-2 cDNA in HOA or PHC in bam-2 mutant background (n = 30). In (C–E), the data for wild type and casy-1 mutants are the same as shown in Figure 2. (F) Co-immunoprecipitation of CASY-1 and BAM-2. Scale bars, 20 μm. **p<0.01; ***p<0.001; ns, not significant (by Mann-Whitney test). For the data and statistics, see Figure 5—source data 1.
-
Figure 5—source data 1
Source data for Figure 5, Figure 5—figure supplement 1, and Figure 5—figure supplement 2.
- https://doi.org/10.7554/eLife.29257.018
Figure 5—figure supplement 1

HOA presynaptic puncta phenotypes of mutants for cell adhesion genes.
(A) Distribution of a mCherry-tagged presynaptic marker RAB-3 in HOA axon of mutants for cell adhesion genes expressed in HOA (red box) or PHC (green box). Expression pattern of these genes is shown in Figure 1E. Asterisks indicate diffused puncta. Scale bar, 20 μm. (B) Number of mCherry::RAB-3 puncta in mutants was counted and compared to wild type (n = 30). Error bars are SEM. ***p<0.001 (by Mann-Whitney test). In oig-1 and oig-8 mutants, the puncta numbers were decreased due to the diffused puncta, of which cause is still elusive. For the data and statistics, see Figure 5—source data 1. The data for wild type are the same as shown in Figure 5.
Figure 5—figure supplement 2

NRX-1 does not interact with CASY-1.
(A) Distribution of a mCherry-tagged presynaptic marker RAB-3 in HOA axon of a hypomorphic nrx-1(ok1649) and a null nrx-1(wy778) mutants. Scale bar, 20 μm. (B) Number of mCherry::RAB-3 puncta in mutants was counted and compared to wild type (n = 30). Error bars are SEM. ns, not significant (by Mann-Whitney test). For the data and statistics, see Figure 5—source data 1. (C) Co-immunoprecipitation assay for CASY-1 and NRX-1. The data for wild type are the same as shown in Figure 5.
Figure 6 with 1 supplement
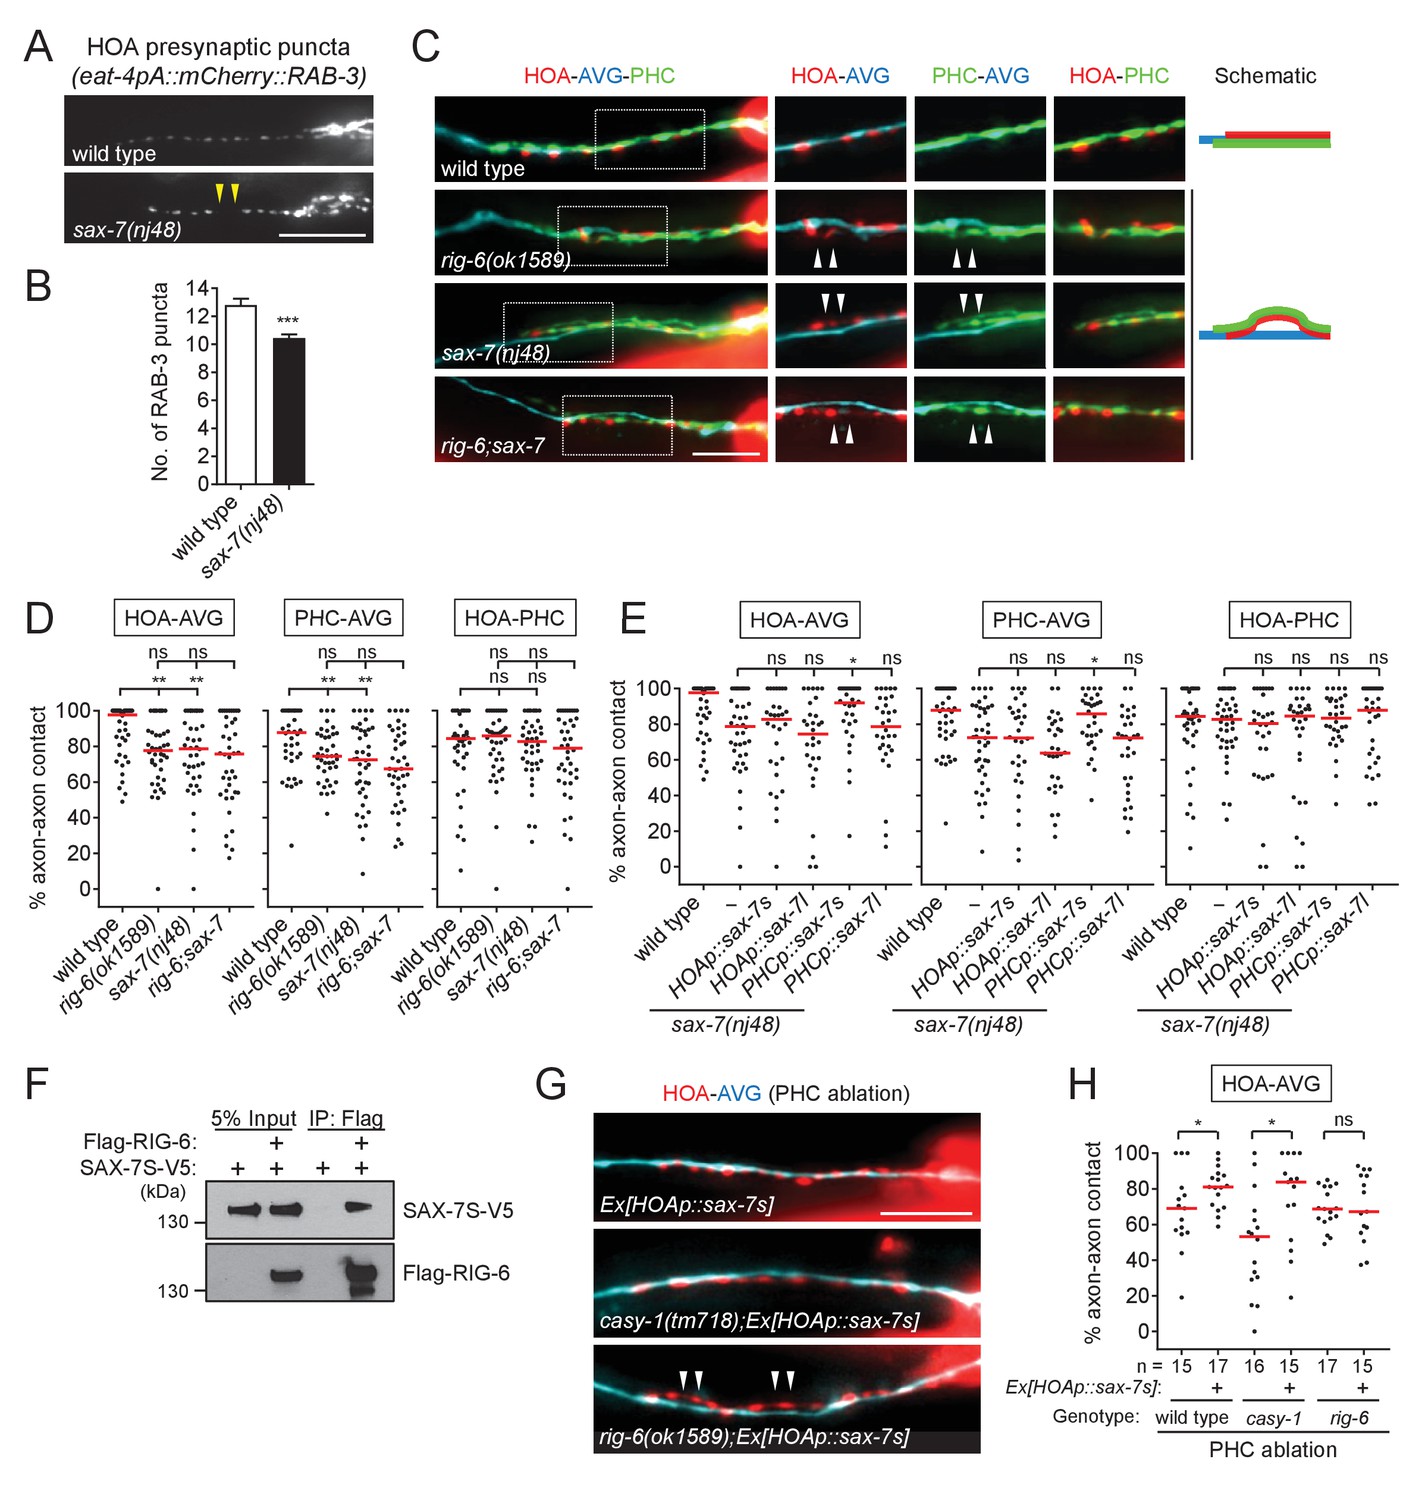
SAX-7 interacts with RIG-6.
(A) Distribution of a mCherry-tagged presynaptic marker RAB-3 in HOA axon of wild type or sax-7(nj48) mutants. Arrowheads indicate gaps between the presynaptic puncta. (B) Number of mCherry::RAB-3 puncta in sax-7 mutants was counted and compared to wild type (n = 30). Error bars are SEM. (C) Images of axon placement of HOA, AVG and PHC in sax-7 and rig-6;sax-7 double mutants. Axon fasciculation between each neuronal pair in the dashed box region and schematic of axon fasciculation are shown on the right. Arrowheads indicate the region where two axons are detached from each other. (D) Percentage of axon-axon contact between each neuronal pair in wild type or mutant animals (n = 40). Each dot represents individual animal. Red bar represents the median. (E) Percentage of axon-axon contact between each neuronal pair in animals expressing the short isoform sax-7s or long isoform sax-7l cDNA in HOA or PHC in sax-7 mutant background (n = 30). In (C–E), the data for wild type and rig-6 mutants are the same as shown in Figure 2. (F) Co-immunoprecipitation of RIG-6 and SAX-7S. (G) Images of axon placement of HOA and AVG in PHC-ablated animals expressing sax-7s cDNA in HOA (Ex[HOAp::sax-7s]). Arrowheads indicate the region where the HOA axon is detached from the AVG axon. (H) Percentage of axon-axon contact between HOA and AVG in PHC-ablated animals either expressing or not expressing sax-7s cDNA in HOA. The number of animals analyzed is indicated. The data for PHC-ablated wild type animals are the same as shown in Figure 2I. Scale bars, 20 μm. *p<0.05; **p<0.01; ***p<0.001; ns, not significant (by Mann-Whitney test). For the data and statistics, see Figure 6—source data 1.
-
Figure 6—source data 1
Source data for Figure 6.
- https://doi.org/10.7554/eLife.29257.021
Figure 6—figure supplement 1
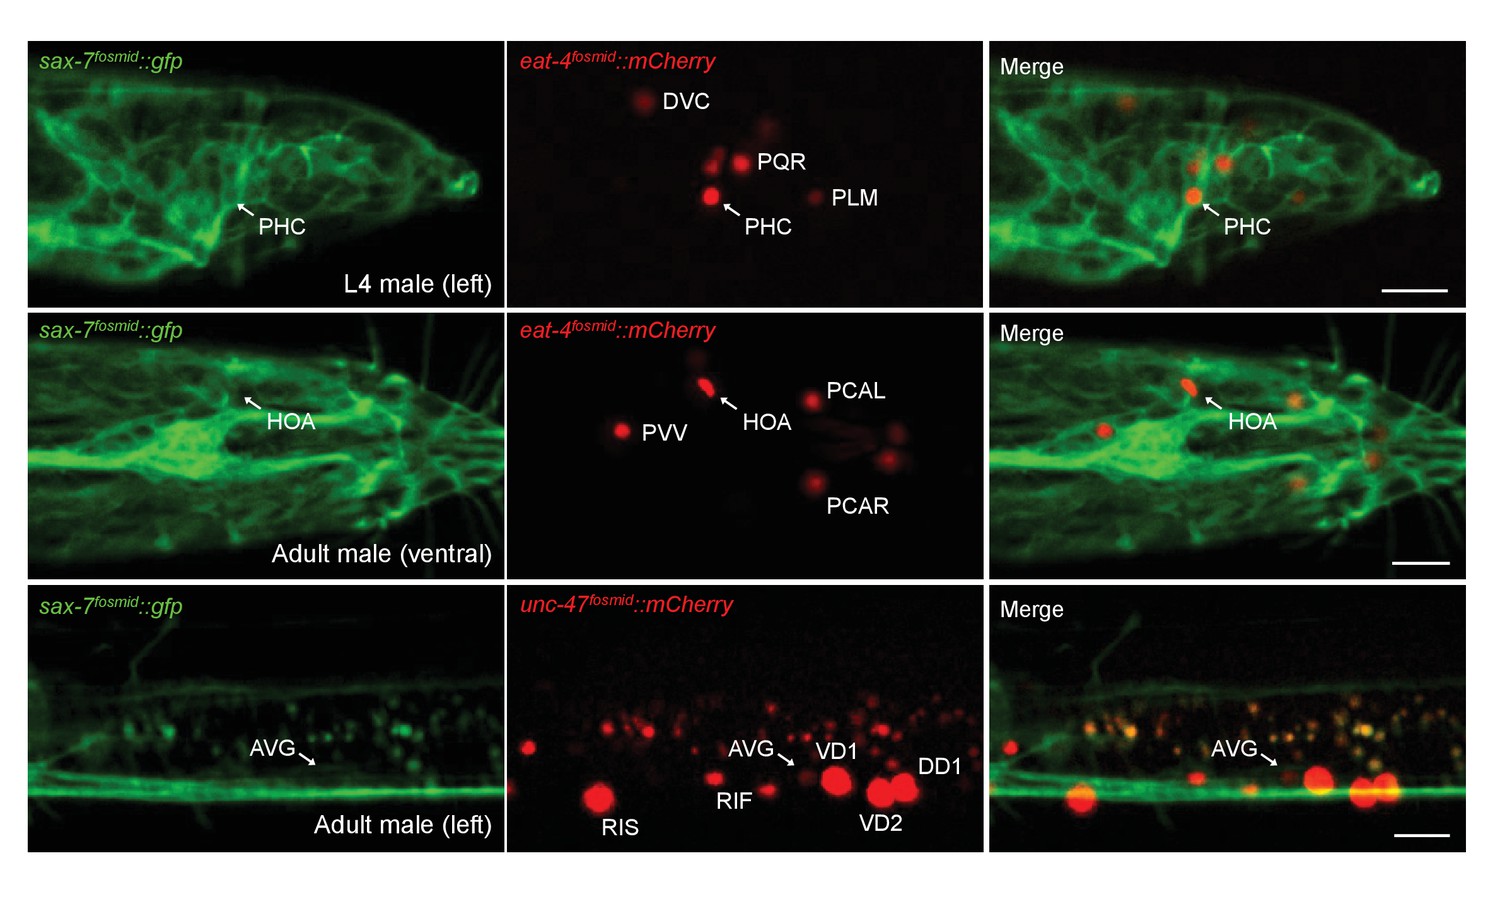
sax-7 is expressed in PHC, but not in HOA or AVG.
A fosmid-based reporter line carrying sax-7::gfp was crossed with animals carrying eat-4fosmid::mCherry or unc-47fosmid::mCherry and examined for expression in PHC, HOA or AVG in L4 or adult males. Note that SAX-7 is localized to the cytoplasm and plasma membrane in neuronal cell bodies, while mCherry-tagged proteins are targeted to the nucleus due to the nuclear localization signal of H2B. Location of PHC, HOA or AVG cell body is indicated as an arrow. Identities of eat-4 or unc-47 expressing cells in males are previously described (Gendrel et al., 2016; Serrano-Saiz et al., 2017b). SAX-7 was expressed in PHC both in L4 and adult males, but in the L4 stage it was easier to detect the signal than in the adult stage where SAX-7 expression in male-specific ray neurons near PHC was more intense. The image for unc-47fosmid::mCherry was overexposed to show AVG expression. Scale bars, 10 μm.
Figure 7

Cell adhesion genes required for male mating behavior.
Vulva location efficiency (A) or response efficiency (B) in the indicated mutant males was measured and compared to wild type males. For rescue experiments, the same cell-autonomous rescuing transgenes for the circuit formation were used. The number of males analyzed is indicated below each column. Error bars are SEM. *p<0.05; **p<0.01; ***p<0.001 (by Mann-Whitney test). For the data and statistics, see Figure 7—source data 1.
-
Figure 7—source data 1
Source data for Figure 7.
- https://doi.org/10.7554/eLife.29257.023
Figure 8
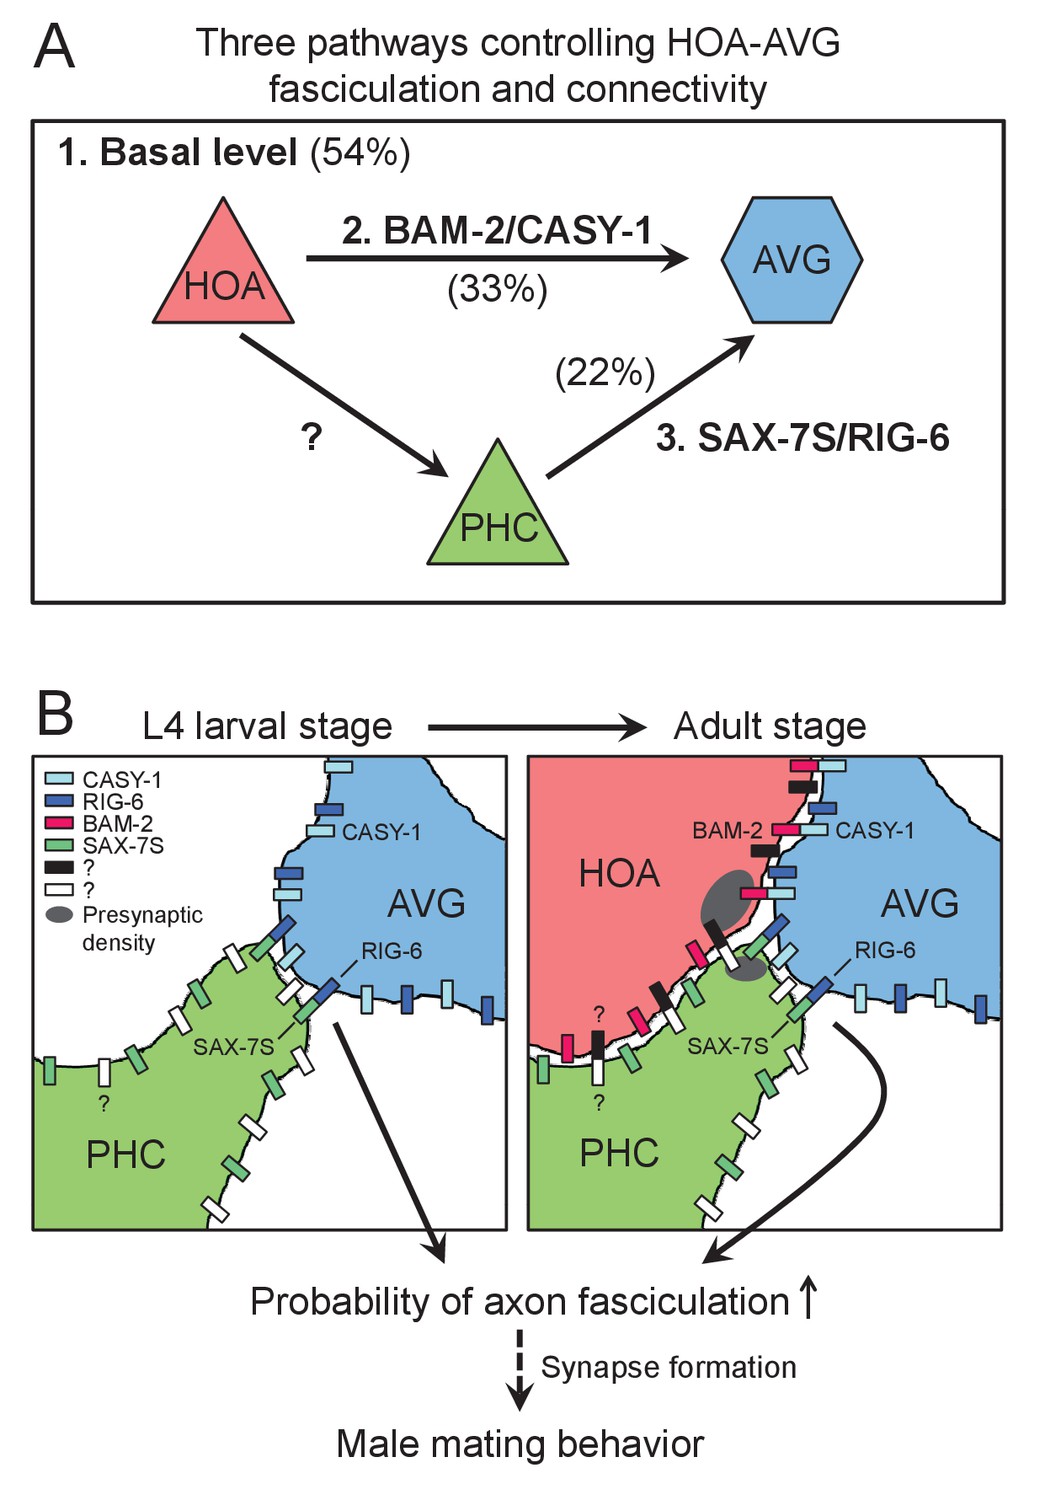
Model for function of cell adhesion protein interactions.
(A) Three pathways additively act to achieve the wild type level of HOA-AVG axon fasciculation. The median percentages of HOA-AVG axon fasciculation in mutant and/or PHC ablation studies were used to estimate contribution of each pathway. (B) Schematic showing axons, cell adhesion protein interactions, and their putative function during the L4-adult transition in males. In L4 stage, the PHC axon contacts the AVG axon through RIG-6-SAX-7S interaction. In adult stage, close apposition of HOA and AVG membranes involves CASY-1-BAM-2 interaction, while unidentified protein interaction may mediate contact between HOA and PHC. These protein interactions regulate the probability of axon fasciculation and vulva location behavior possibly by controlling synapse formation between the neurons.
Author response image 1
Additional files
-
Supplementary file 1
Neighborhood and synapse in the HOA-AVG-PHC circuit
- https://doi.org/10.7554/eLife.29257.025
-
Supplementary file 2
C. elegans strains, molecular cloning and transgenes
- https://doi.org/10.7554/eLife.29257.026
-
Transparent reporting form
- https://doi.org/10.7554/eLife.29257.027
Download links
A two-part list of links to download the article, or parts of the article, in various formats.
Downloads (link to download the article as PDF)
Open citations (links to open the citations from this article in various online reference manager services)
Cite this article (links to download the citations from this article in formats compatible with various reference manager tools)
Multiple conserved cell adhesion protein interactions mediate neural wiring of a sensory circuit in C. elegans
eLife 6:e29257.
https://doi.org/10.7554/eLife.29257


