Epigenetic profiling of growth plate chondrocytes sheds insight into regulatory genetic variation influencing height
- Broad Institute of MIT and Harvard, United States
- Harvard Medical School, United States
- Harvard University, United States
- University of Waterloo, Canada
Figures
Figure 1 with 2 supplements
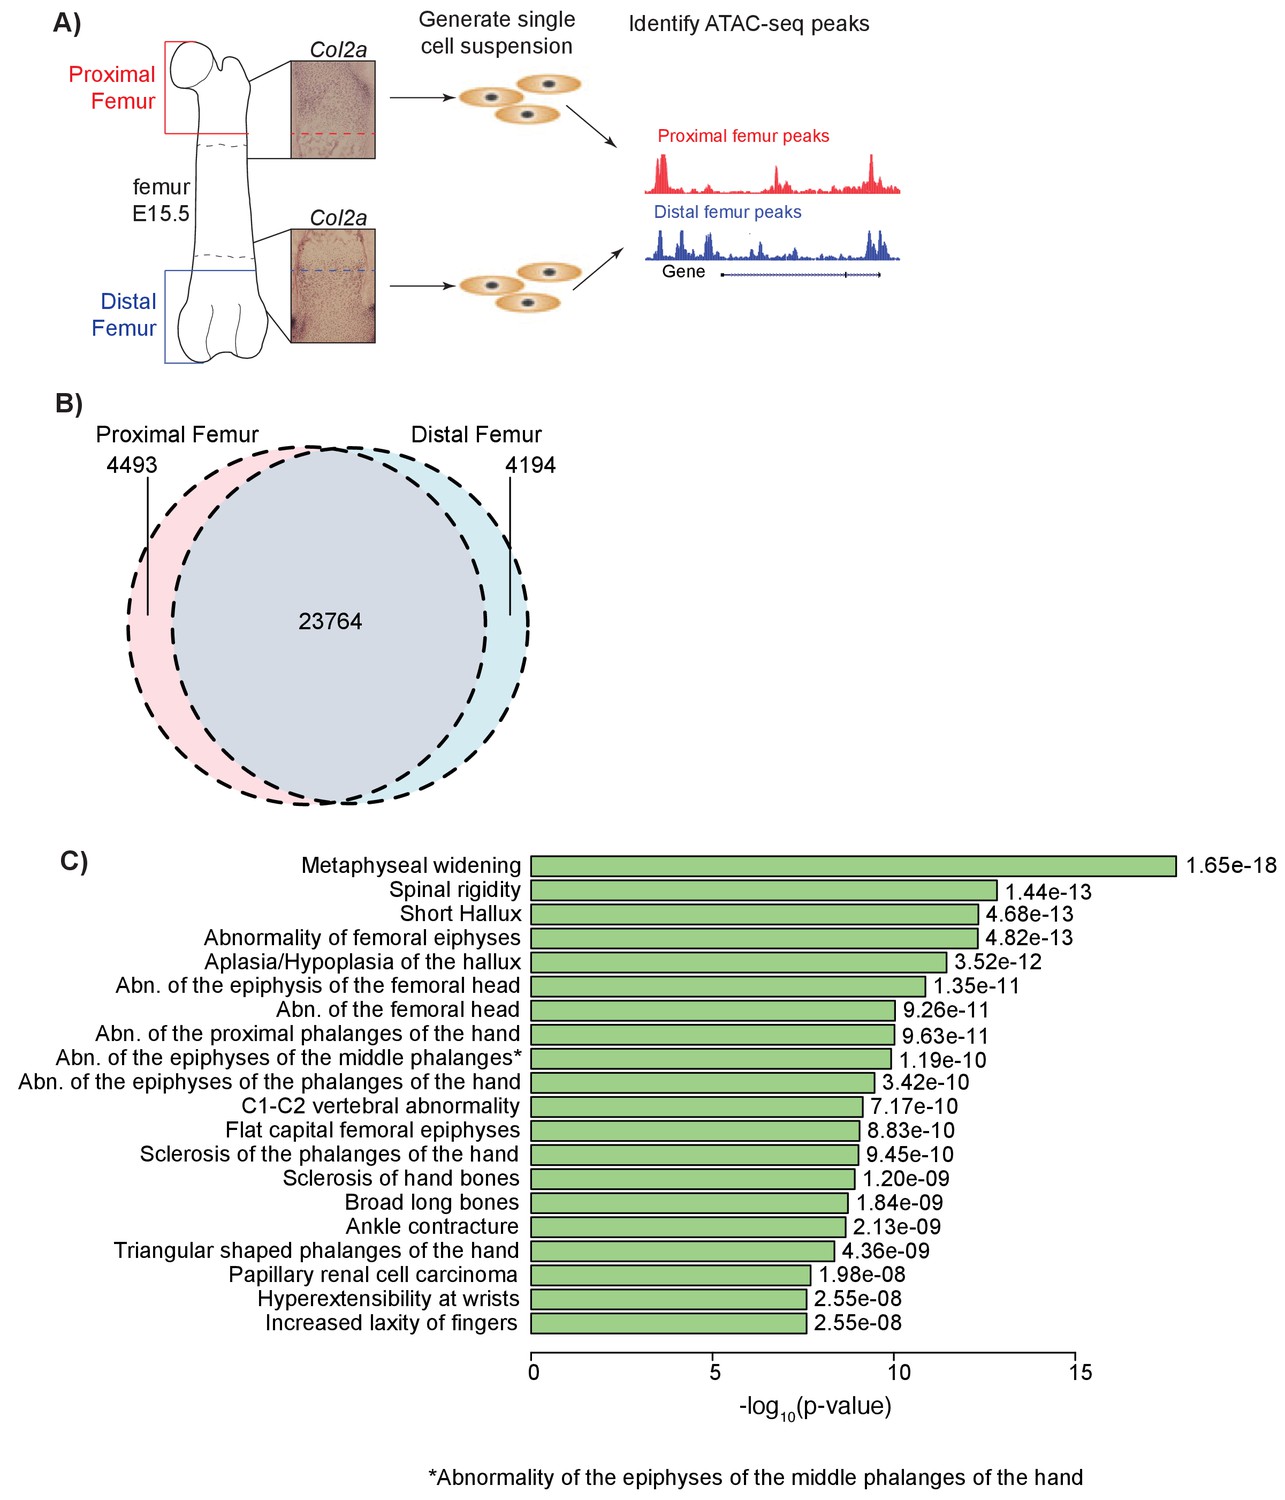
ATAC-seq on in vivo collected mouse femoral growth plate zones.
(A) Pipeline of ATAC-seq on the embryonic mouse femur. Proximal (red) and distal (blue) samples were extracted from E15.5 femoral growth plates, as labeled by Col2a1 expression (insets). Tissues were harvested just proximal (red dotted lines in inset) or distal (blue dotted lines in inset) to the forming bone collar (outlined by dashed black lines). Cells were then treated to generate a single-cell suspension. Approximately 50,000 cells per sample were utilized for subsequent ATAC-seq. Open chromatin regions were then identified from the ATAC-seq data. ATAC-seq protocol adapted from Buenrostro et al. (2013). (B) Venn diagram shows the number of ATAC-seq peaks in the proximal and distal samples. (C) ATAC-seq peaks (after subtracting peaks shared in brain ATAC-seq) were analyzed for enrichment in gene sets using GREAT. Horizontal bars show enrichment p values (shown as –log10(p value)) for Human Phenotypes. The union of proximal and distal femur peaks was used.
Figure 1—figure supplement 1
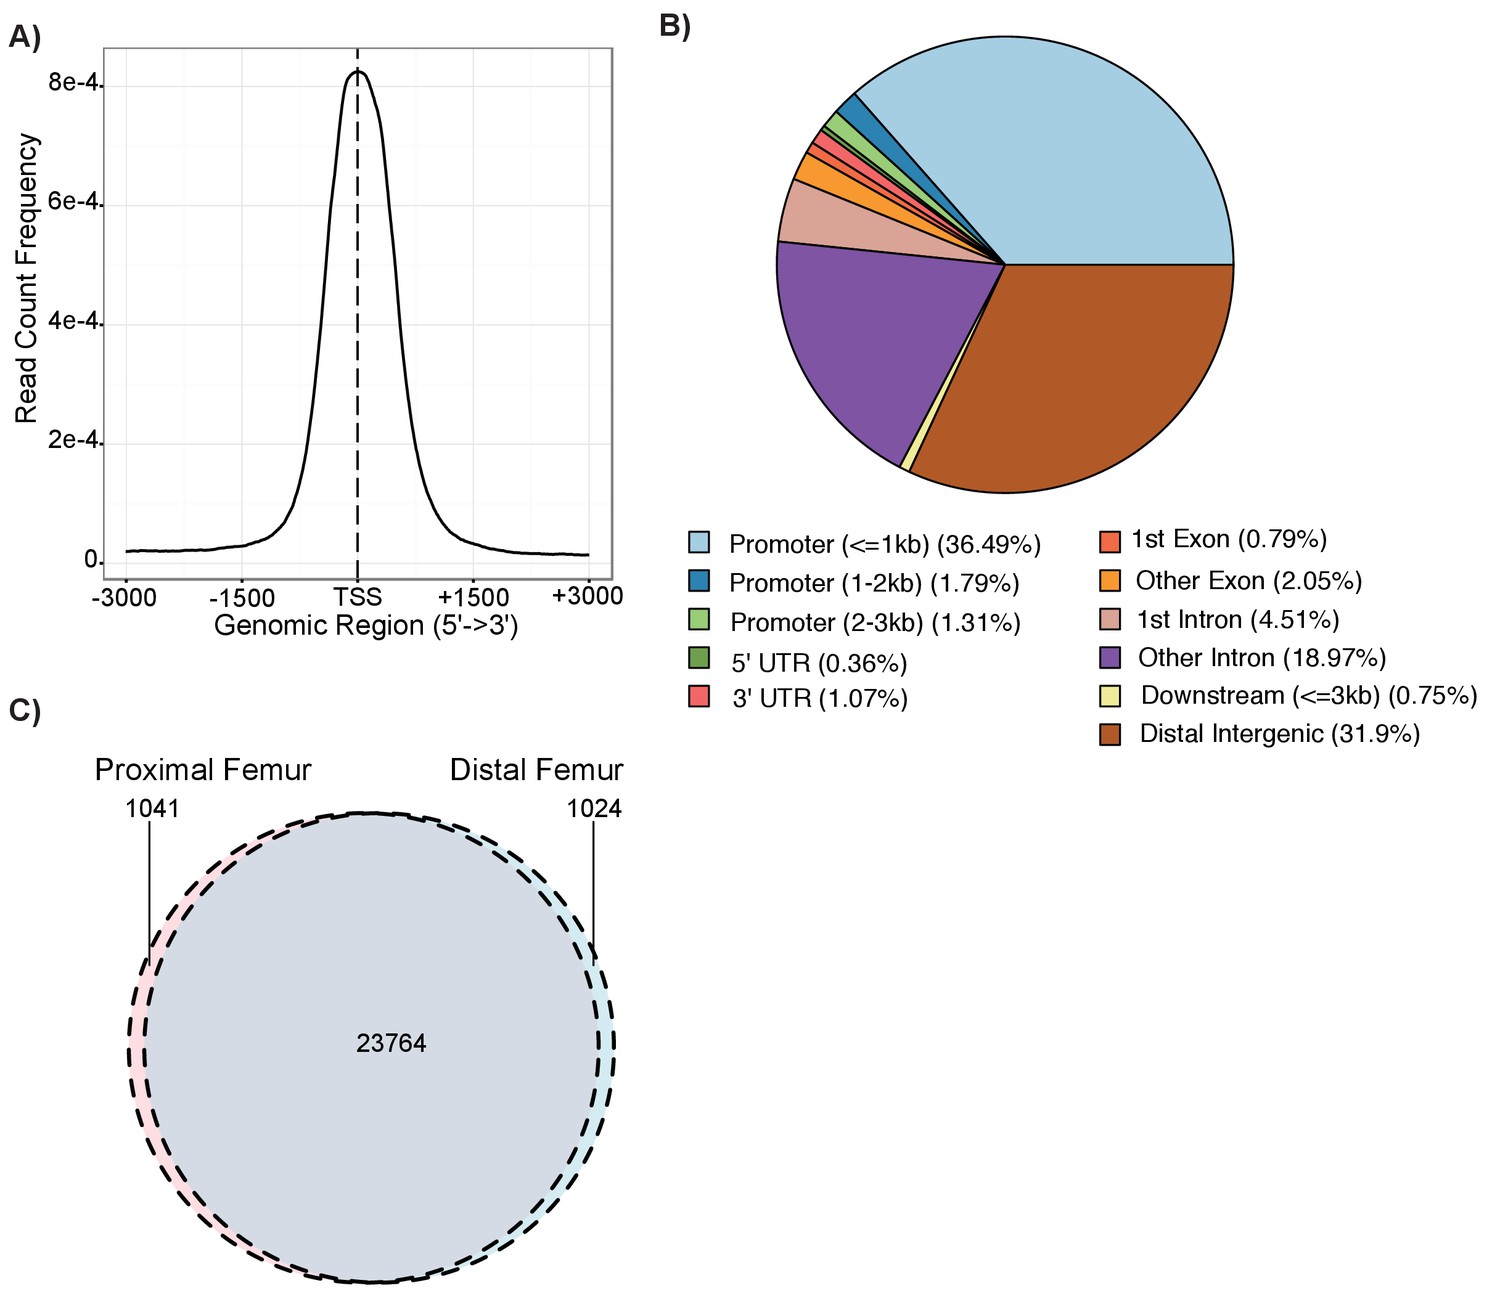
Details on chondrocyte ATAC-seq regions.
(A) ATAC-seq read distribution relative to transcriptional start sites (TSS) across the mouse genome. (B) Distribution of annotations for ATAC-seq open chromatin regions in the mouse genome. (C) Venn diagram showing the number of ATAC-seq peaks in the proximal and distal samples following liftover to the human hg19 reference genome.
Figure 1—figure supplement 2
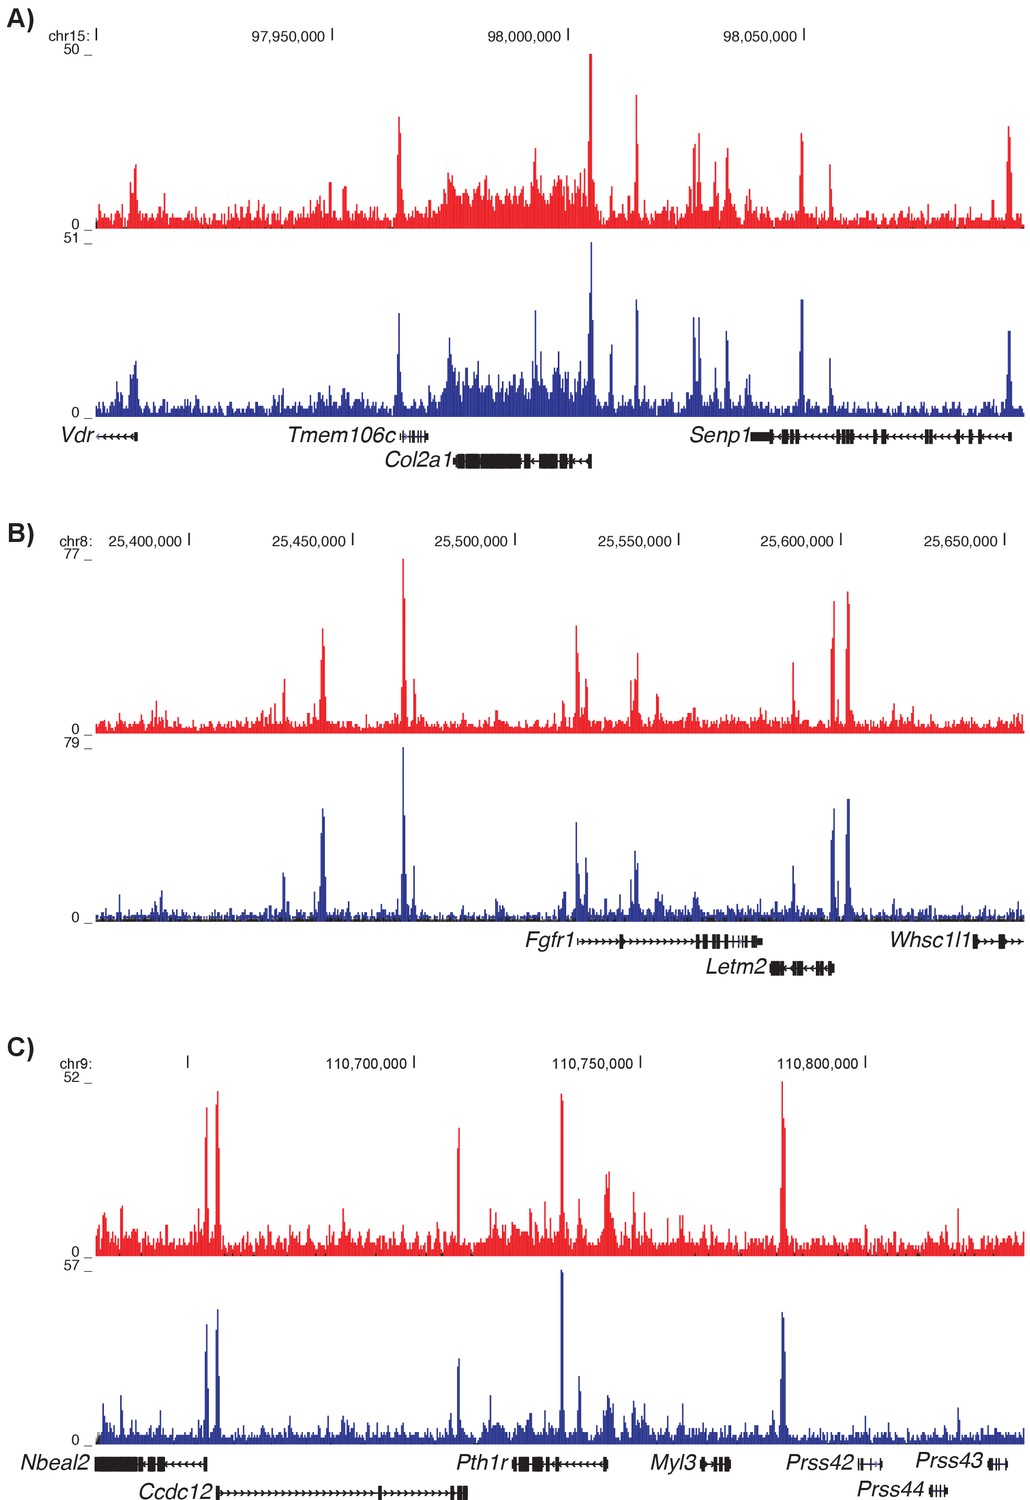
ATAC-seq peaks at known chondrocyte loci Col2a1 (A), Fgfr1 (B), and Pth1r (C).
Proximal ATAC-seq peaks are shown in red and distal ATAC-seq peaks are shown in blue. Coordinates are based on the mouse mm10 genome build.
Figure 2
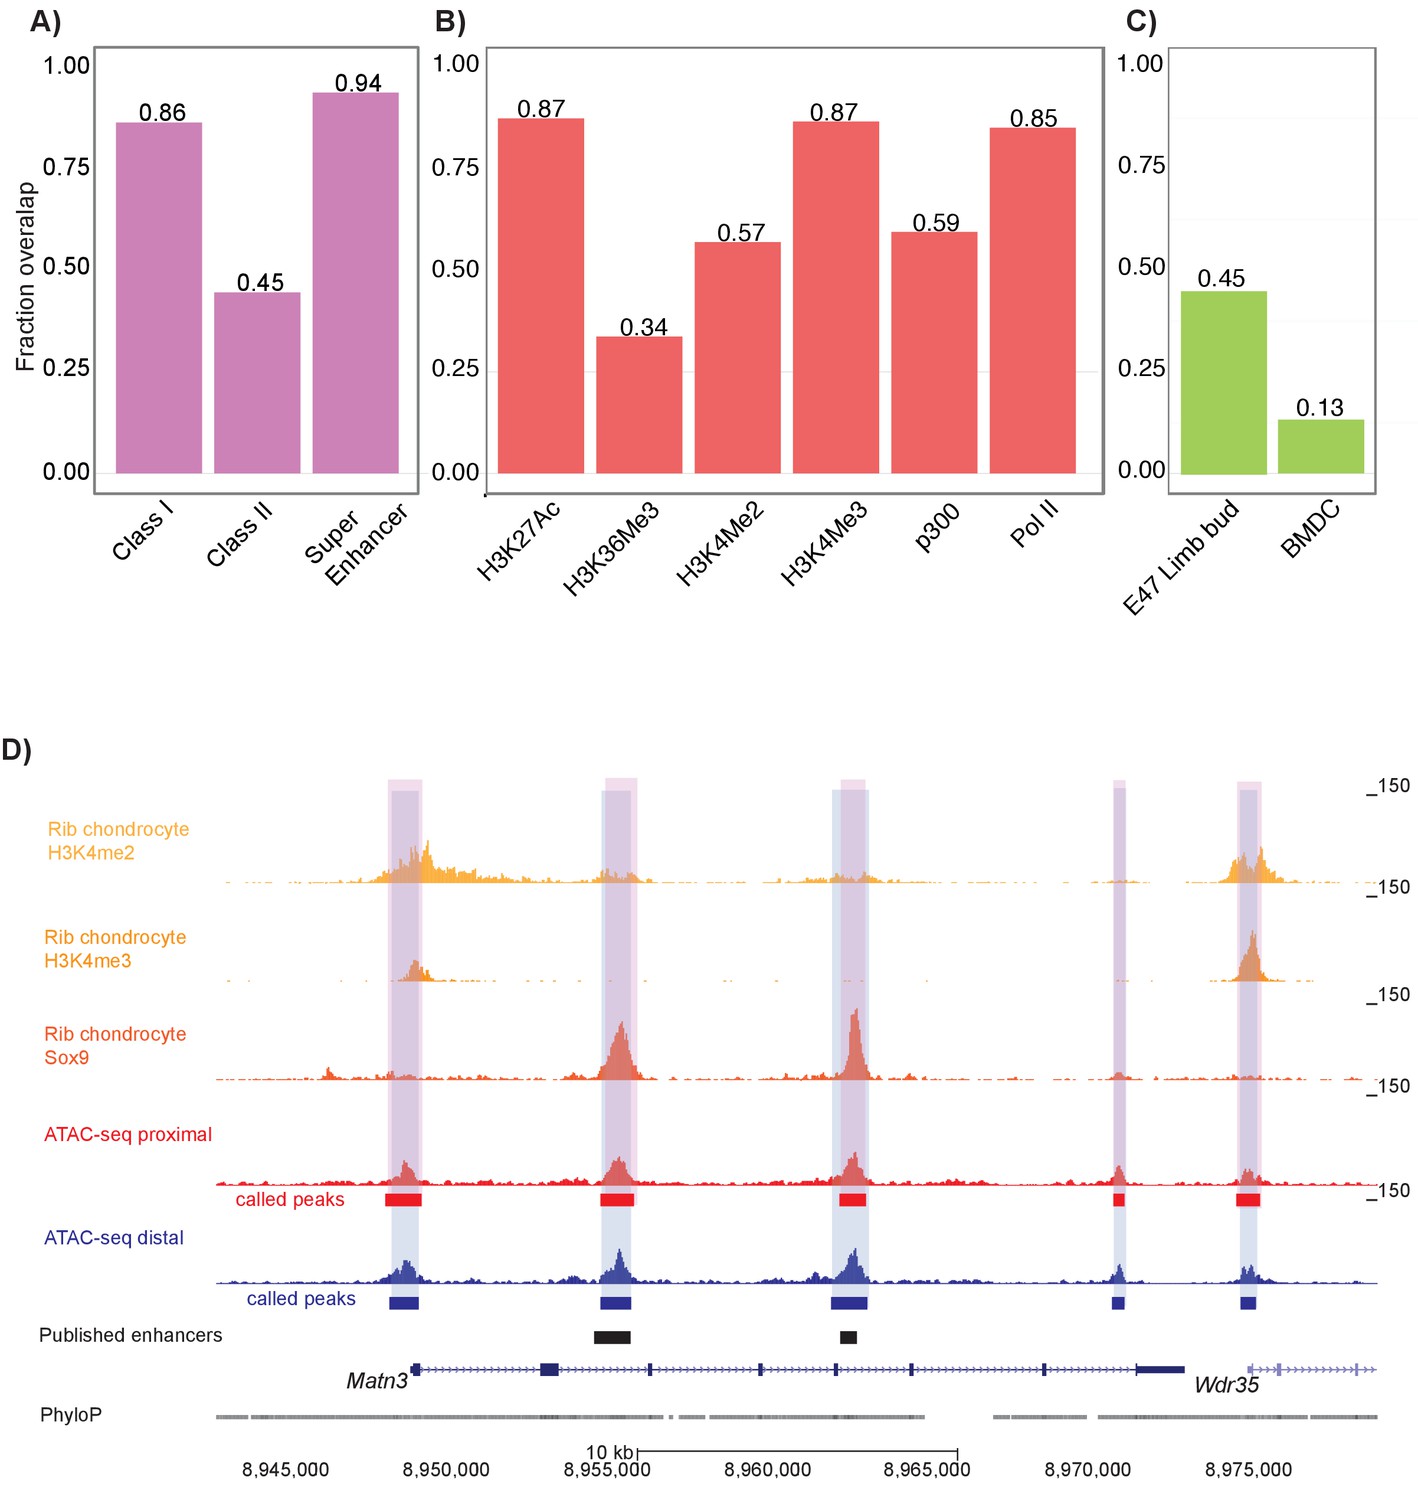
Mouse proximal and distal ATAC-seq datasets capture chondrocyte biology in mouse and humans.
(A) Proportion of mouse Sox9 Class I, Class II, and super enhancer sites (Ohba et al., 2015) overlapping with ATAC-seq peaks. (B) Proportion of mouse rib chondrocyte H3K27ac, H3K36me3, H3K4me2, H3K4me3, p300, and RNA Pol II sites overlapping with ATAC-seq peaks. (C) Proportion of human embryonic limb E47 H3K27ac (Cotney et al., 2013) and human BMDC H3K27ac sites (Kundaje et al., 2015) overlapping with ATAC-seq peaks. (D) ATAC-seq peaks at the Matn3 locus. Published rib chondrocyte peaks for H3K4me2, H3K4me3, and Sox9 are shown in shades of orange. Proximal ATAC-seq peaks are shown in red, with called peaks shown as bars below. Distal ATAC-seq peaks are shown in blue, with called peaks shown as bars below. The locations of previously published chondrocyte enhancers are shown as black bars.
Figure 3 with 1 supplement
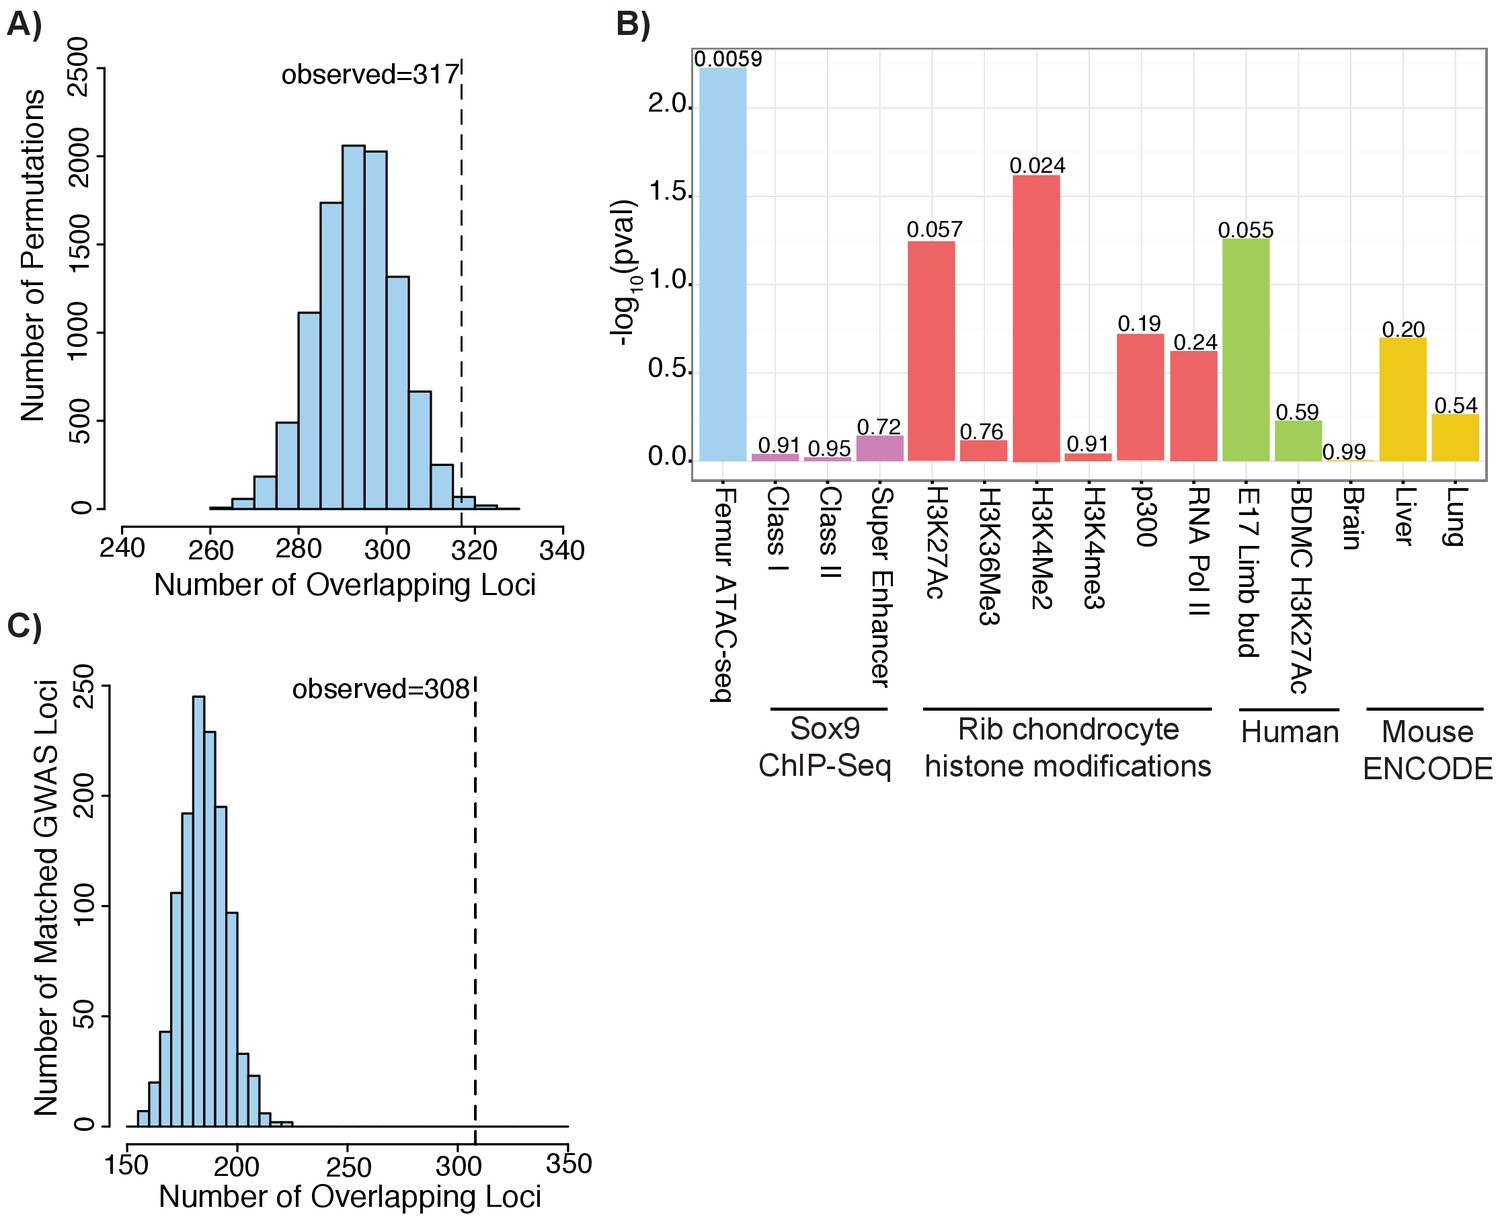
Height GWAS loci are enriched in ATAC-seq peaks.
(A) Enrichment of height GWAS loci in ATAC-seq peaks using GoShifter. Histogram (light blue bars) shows the number of overlaps observed in the 100,000 GoShifter permutations. Dotted line shows the number of overlaps observed in the ATAC-seq data. (B) GoShifter analysis p values for the ATAC-seq data, mouse rib chondrocyte Sox9 binding and histone modifications, human embryonic limb E47 H3K27ac, H3K27Ac of BMDCs, and brain, liver, and lung DNaseI hypersensitivity site samples from mouse ENCODE (C) Enrichment of height GWAS loci in ATAC-seq peaks using random matched GWAS loci. Histogram (light blue bars) shows the number of overlaps observed in 1000 matched random loci. Dotted line shows the number of overlaps observed in the ATAC-seq data.
Figure 3—figure supplement 1
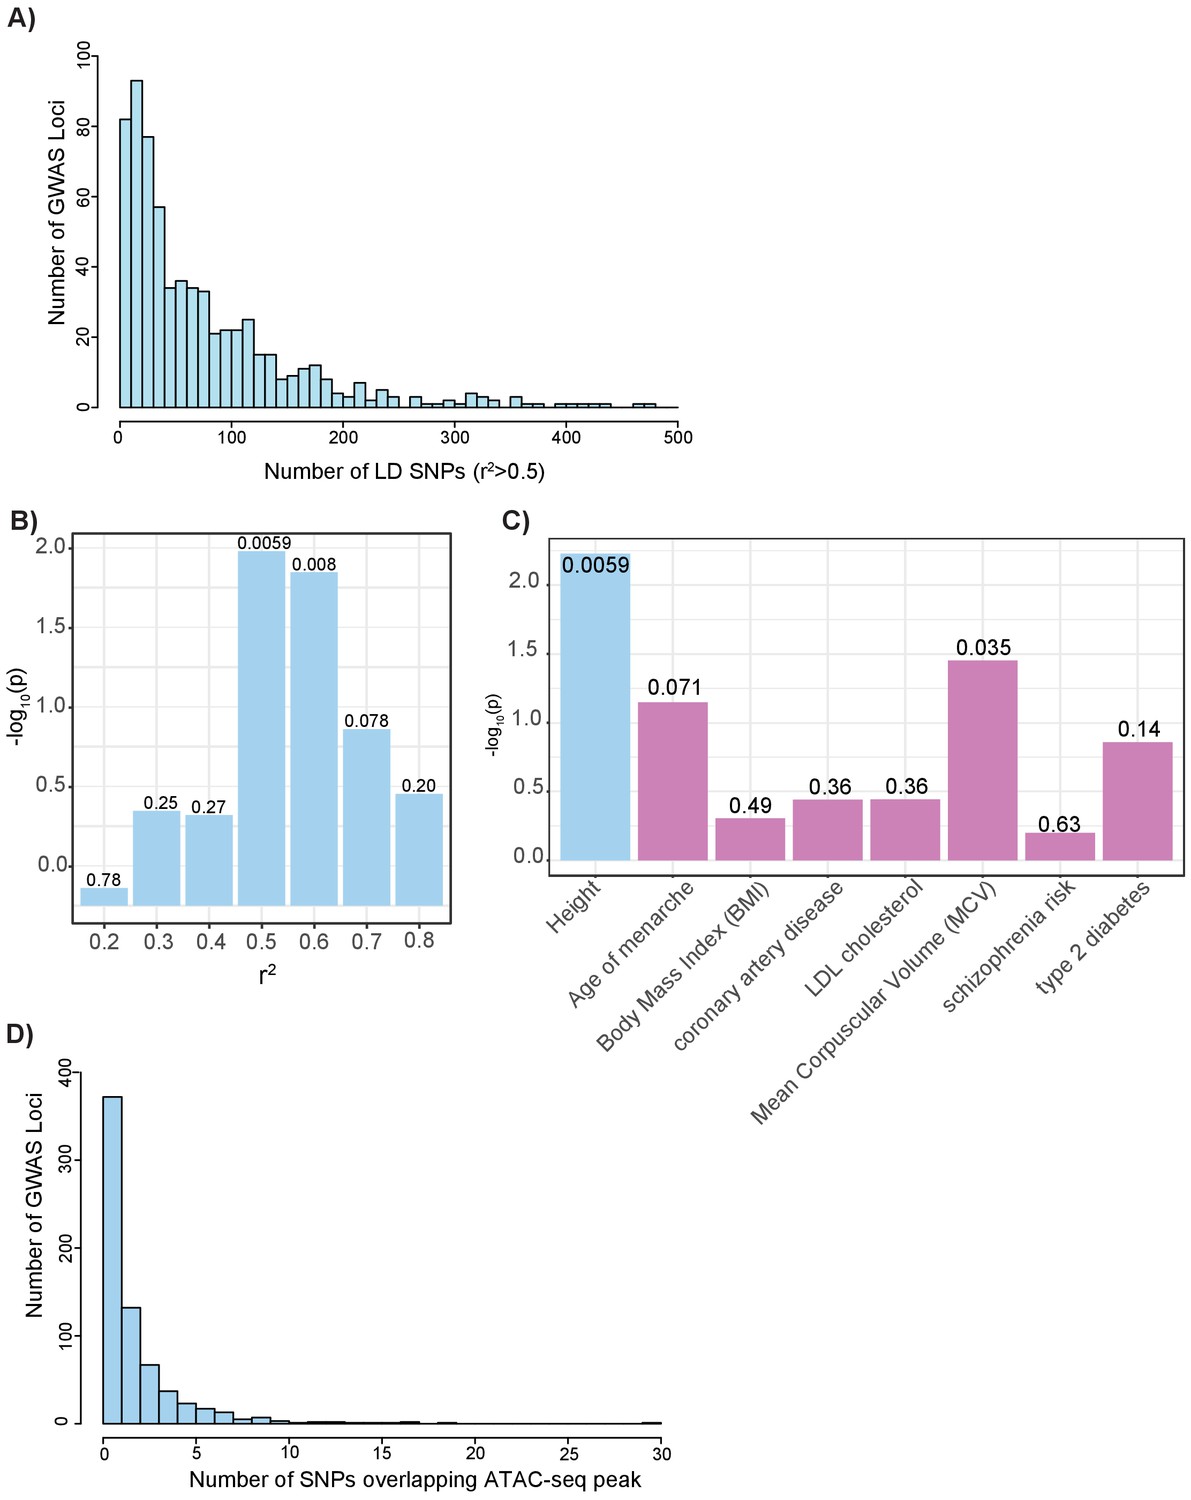
Intersection of GWAS loci and growth plate chondrocyte ATAC-seq.
(A) Histogram of number of proxy SNPs (r2 >0.5 using 1000 Genomes Phase EUR data) across 688 height GWAS loci. (B) Results of GoShifter analysis of height GWAS variants on ATAC-seq peaks at different LD thresholds ranging from r2 = 0.2 to 0.8 (based on 1000 Genomes Phase EUR data). Heights of the bars represent the –log10(p value). Results for r2 = 0.5 are the same as shown in Figure 3A–B. (C) GoShifter analysis for GWAS results for several additional complex traits/diseases on ATAC-seq peaks. Heights of the bars represent the –log10(p value). Analyses performed using r2 > 0.5 based on 1000 Genomes Phase EUR data. Results for height are the same as shown in Figure 3A–B. (D) Histogram of number of proxy SNPs (r2 > 0.5 using 1000 Genomes Phase EUR data) overlapping an ATAC-seq peak across each of 688 GWAS loci.
Figure 4
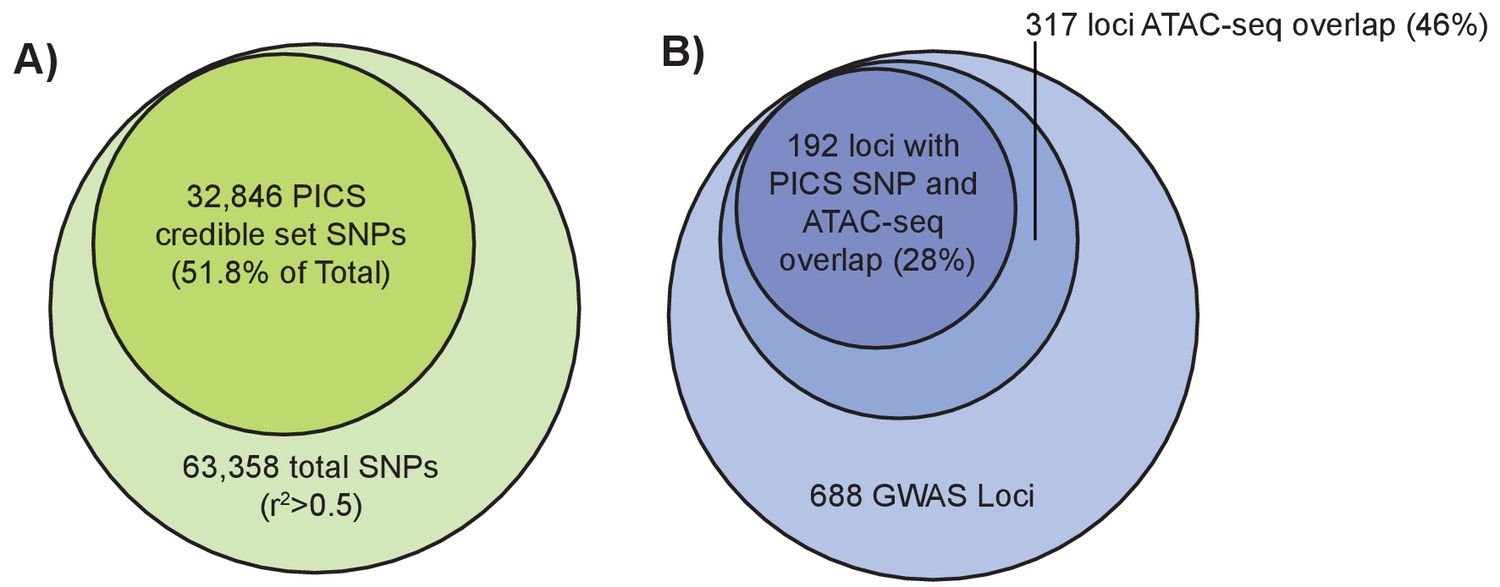
Fine-mapping of GWAS height variants.
(left): Larger light green circle represents all height GWAS SNPs and their proxies (r2 >0.5). Smaller green circle represents the proportion of these SNPs in the PICS 95% credible set. (right) Larger light blue circle represents the 688 height GWAS loci. Medium blue circle represents 317 height GWAS loci overlapping an ATAC-seq peak. Smaller dark blue circle represents 192 loci where a PICS 95% credible set variant overlaps an ATAC-seq peak.
Figure 5

Height GWAS loci are enriched in differentially expressed growth plate genes.
(A) Enrichment of height GWAS loci in differentially expressed growth plate genes. Dotted line shows number of GWAS loci with a nearby differentially expressed growth plate gene (±100 kb). Histogram (light blue bars) shows the number of overlaps observed in 1000 matched random loci. (B) Enrichment of height GWAS loci in differentially expressed growth plate genes and ATAC-seq peaks. Same as (A), except showing overlap for GWAS loci overlapping differentially expressed growth plate gene (±100 kb) and ATAC-seq peak.
Figure 6 with 2 supplements

Intersections of GWAS height variants with ATAC-seq data identify novel putatively causal variants.
(A) ATAC-seq height GWAS variant intersections at the CHSY1 locus refine height GWAS loci to fewer putatively causal variants. Height GWAS SNPs (r2 >0.5 to lead SNP) are shown as black bars, and SNPs in the PICS 95% credible set are shown as red bars. Published H3K27ac ChIP-seq in E47 human limb buds and BMDCs are shown in orange and purple respectively. ATAC-seq peaks lifted over to human are shown for proximal femur (red) and distal femur (blue). Published Sox9 class II sites from mouse rib chondrocytes lifted over to human are shown in light blue. Four height SNPs overlap an ATAC-seq peaks, representing putatively causal variants. Of these four variants, rs9920291, a C to T substitution, significantly alters the predicted binding of HOXD13 (UniProbe: HOXD13 C allele z-score = 0.7825; HOXD13 T allele z-score = 5.1269 (also Supplementary file 7) (B) Results of a luciferase reporter assay. A 341 bp region surrounding rs9920291 and containing either the reference or alternate allele at rs9920291 was cloned into a luciferase reporter vector and transfected into the human chondrocyte cell line T/C-28a2. Expression was normalized (to 1.0) by luciferase activity of the empty vector luciferase construct. (C) Allelic skew of two CHSY1 genic variants (rs28364839 which is exonic and rs11433 which is in the 3’UTR) in HEK-293FT cells. Notably, HEK-293FT is heterozygous for rs9920291, along with both assayed variants. (D) Expression of CHSY1 following CRISPR-Cas9-mediated deletion of regions surrounding rs9920291 (see Figure 6—figure supplement 1) in T/C-28a2 chondrocyte cell lines (N = 3 biological replicates). CHSY1 expression following deletion of an approximate 135 bp region using guides 1 and 4 is shown in purple and expression following deletion of an approximate 17 bp region using guides 6 and 8 is shown in orange. Expression values are normalized to a control CRISPR-Cas9 vector (green). (E) CHSY1 expression following HOXD13 overexpression in T/C-28a2 cells (N = 3 biological replicates) (see also Figure 6—figure supplement 1). Expression is normalized by an empty overexpression vector. ***p<0.001 by unpaired t-test.
Figure 6—figure supplement 1
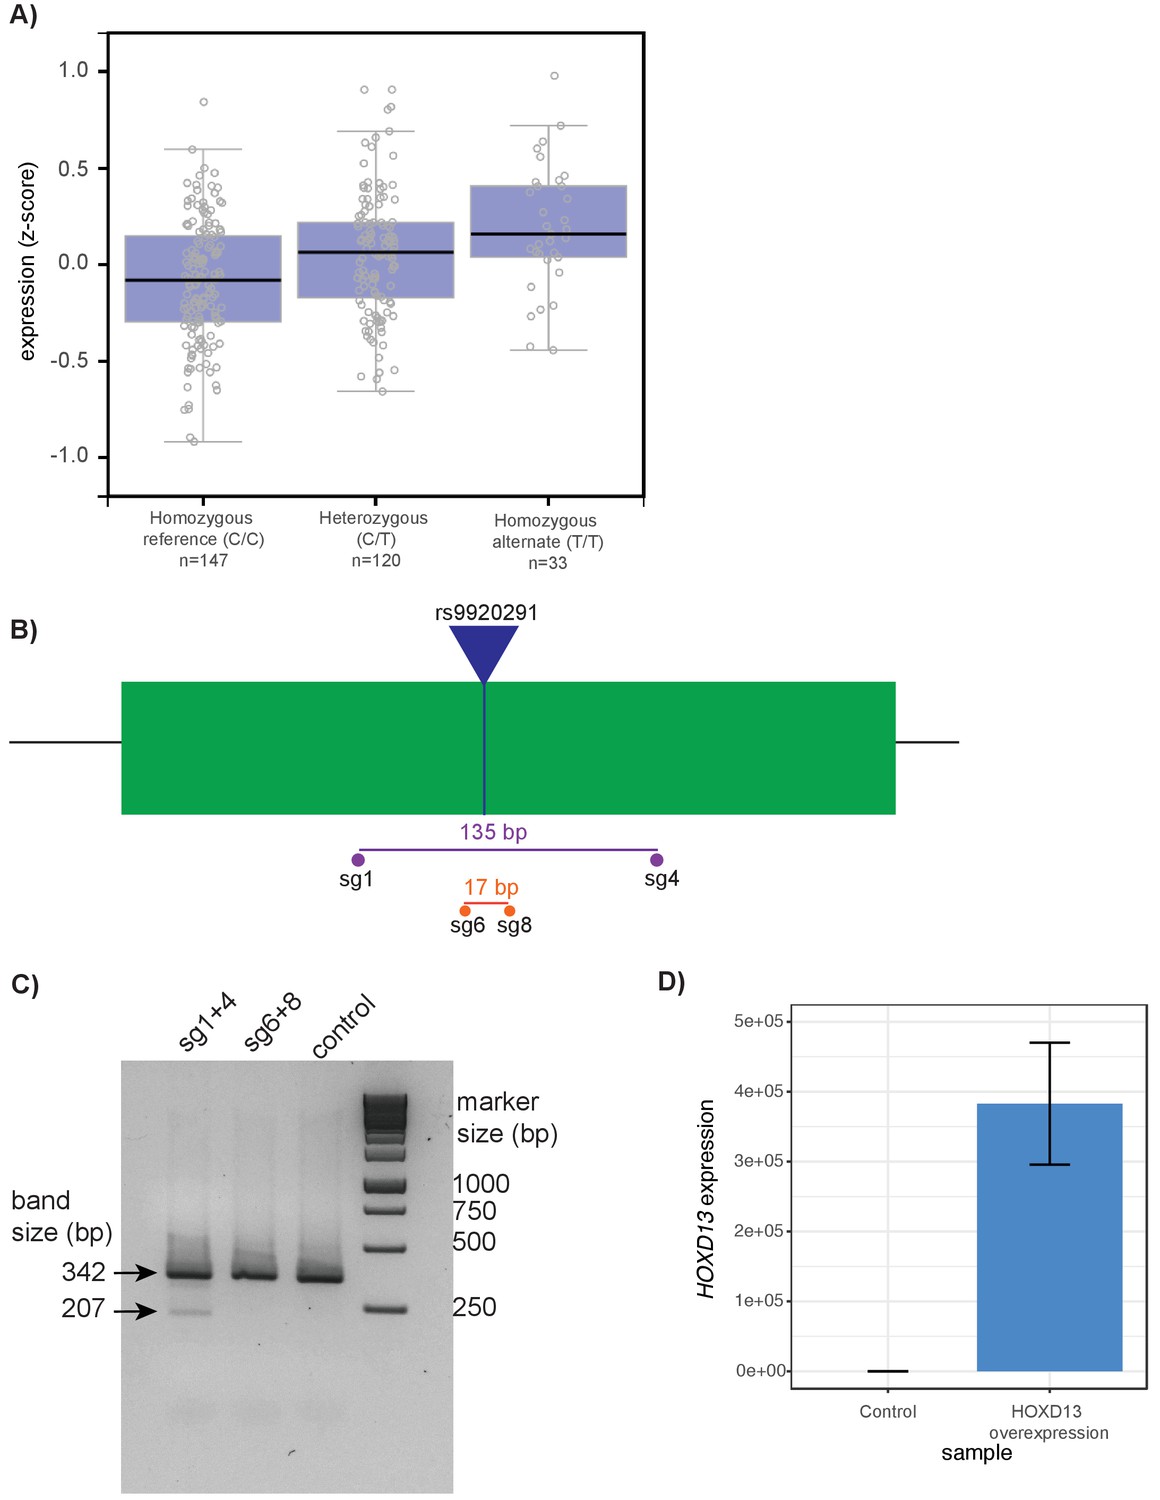
CRISPR-Cas9 targeting of CHSY1 and HOXD13 overexpression studies.
(A) Normalized expression of CHSY1 in human transformed fibroblasts from the GTEx project (Lonsdale and GTEx Consortium, 2013). Expression is segregated by the genotype of rs992091. Each individual circle represents a single individual. (B) Schematic of CRISPR-Cas9 deletion experiment. The green box represents the approximately 341 bp open chromatin region identified by ATAC-seq. The blue line represents the location of rs9920291. Locations of guide RNAs (sg1, 4, 6, and 8) are shown by circles. The approximate size of the deletions generated by sg1 and 4 (purple, 135 bp), and sg6 and 8 (orange, 17 bp) are shown. (C) Gel electrophoresis of PCR of the target locus following CRISPR-Cas9 deletion in T/C-28a2 cells. Lane 1 represents the PCR product following cutting with sg1 and 4; lane 2 represents product following cutting with sg6 and 8; lane 3 represents product following cutting with control CRISPR. The uncut PCR product should be 341 bp. The expected band size following cutting with sg1 and 4 is 207 bp and the expected size following cutting with sg6 and 8 is 324 bp. (D) Confirmation of HOXD13 expression following transfection of HOXD13 overexpression vector in T/C-28a2 human chondrocyte cell lines (N = 3 biological replicates). Expression values are normalized (to 0) to an empty vector control.
Figure 6—figure supplement 2
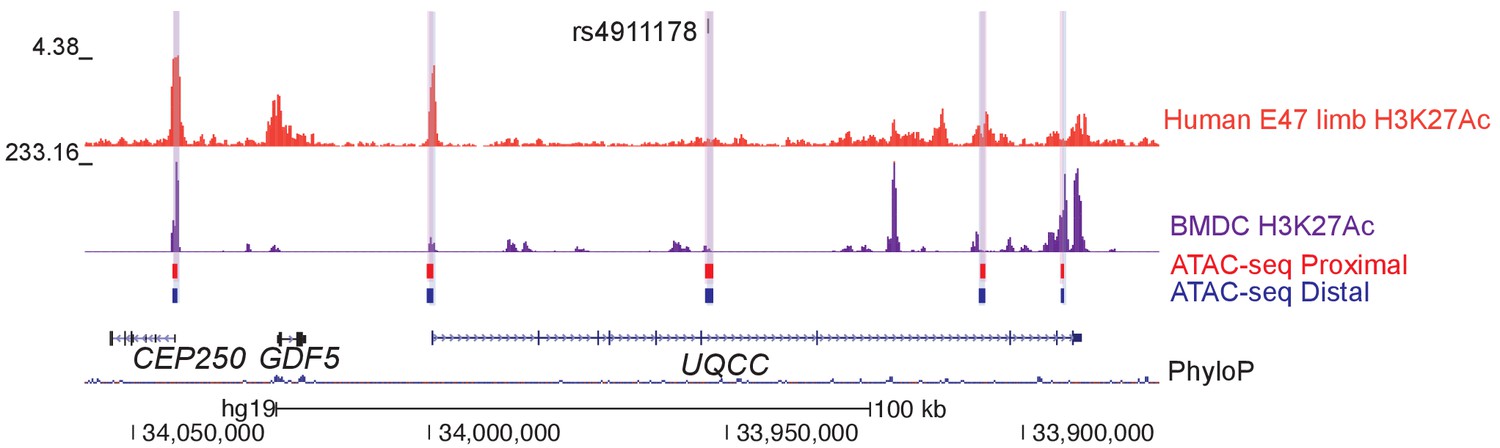
ATAC-seq height GWAS variant intersections at the GDF5 locus.
One height-associate SNP (rs4911178) overlaps a previously characterized GDF5 growth plate enhancer (Capellini et al., 2017). Features in the figure are the same as in Figure 6A.
Figure 7
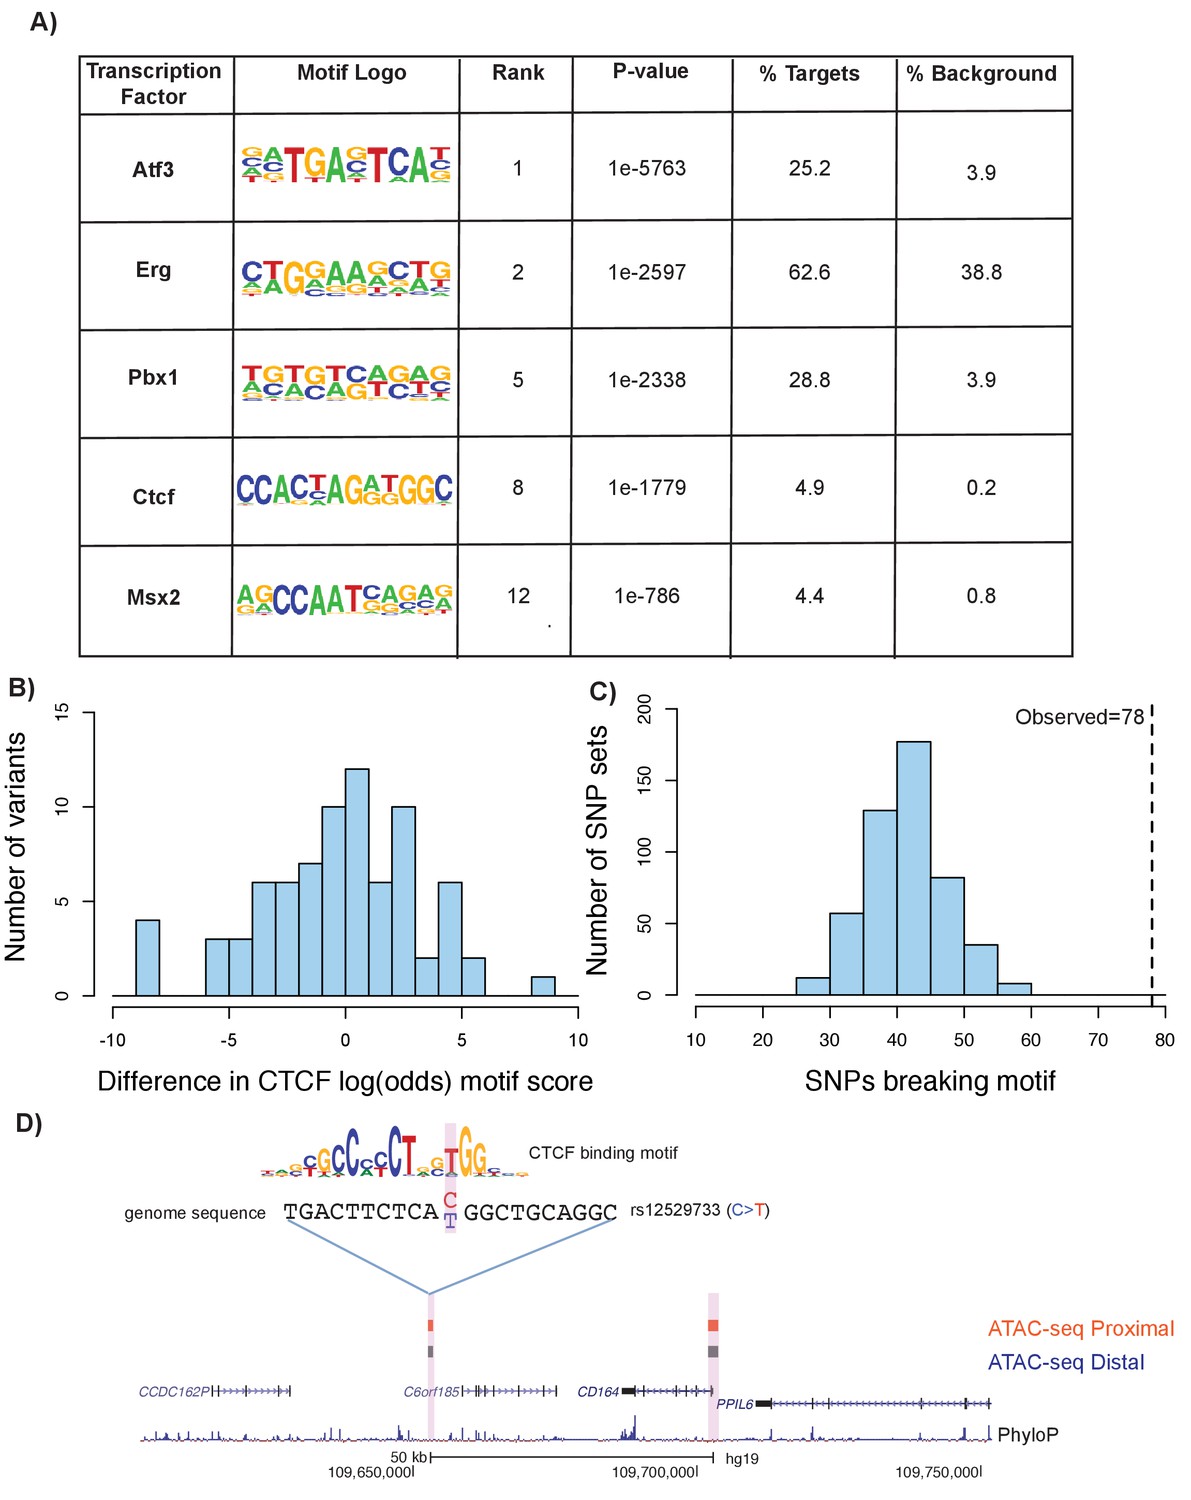
Motif disruption by height GWAS variants intersecting ATAC-seq peaks.
(A) Selected enriched motifs within mouse femoral ATAC-seq open chromatin regions. These motifs were also found following liftover of the peaks to the human genome (see Supplementary file 8, sheets 1 and 2). (B) Histogram showing distribution of log-odds motif scores of CTCF-disruption for height GWAS variants within ATAC-seq regions. Negative values indicate a disruptive effect of the variant while positive values indicate a 'conservation' of the motif hit by the variant. (C) Histogram of number of variants predicted to disrupt CTCF motifs within random subsamples of variants. Dotted line indicates number of CTCF-disrupting variants observed in the height GWAS variants overlapping ATAC-seq regions (n = 78, p<0.01). (D) An example of a variant (rs12529733) that overlaps ATAC-seq peaks and is predicted to alter CTCF binding. Features in the figure are the same as described in Figure 6A.
Additional files
-
Source code 1
- https://doi.org/10.7554/eLife.29329.015
-
Supplementary file 1
Description of each ATAC-seq dataset and its QC data.
Column headings are self-explanatory. See Materials and methods for details.
- https://doi.org/10.7554/eLife.29329.016
-
Supplementary file 2
GREAT output using proximal femur ATAC-seq dataset.
Data used to generate this table are hg19 liftover ATAC-seq coordinates from the entire proximal femur ATAC-seq analysis. Table shows top 50 hits per each category. See great.stanford.edu for details on column headings.
- https://doi.org/10.7554/eLife.29329.017
-
Supplementary file 3
GREAT output using distal femur ATAC-seq dataset.
Data used to generate this table are hg19 liftover ATAC-seq coordinates from the entire distal femur ATAC-seq analysis. Table shows top 50 hits per each category. See great.stanford.edu for details on column headings.
- https://doi.org/10.7554/eLife.29329.018
-
Supplementary file 4
GREAT output using union femur ATAC-seq dataset.
Data used to generate this table are hg19 liftover ATAC-seq coordinates from the entire union (proximal plus distal) femur ATAC-seq analysis. Table shows top 50 hits per each category. See great.stanford.edu for details on column headings.
- https://doi.org/10.7554/eLife.29329.019
-
Supplementary file 5
Collection of published chondrocyte enhancers and their intersection with ATAC-seq data.
Columns 1–5: Data on the location (chrom, start and end), gene and reference for published growth plate chondrocyte enhancers in mouse and humans. Column 6: Data on the location of overlapping proximal and distal femur union ATAC-seq set in mm9 coordinates.
- https://doi.org/10.7554/eLife.29329.020
-
Supplementary file 6
Height variants overlapping ATAC-seq peaks.
Columns: Lead rsID and Lead SNP (chr:position:reference:alternate) represent information for each index SNP from Wood et al., 2014. Similarly, LD rsID and LD SNP represent information for each proxy SNP (r2 >0.5 to lead SNP). r2 shows the LD correlation between the lead SNP and proxy SNP. GWAS p value shows the p value from Wood et al., 2014 for the lead SNP. PICS Score represents the credible set probability. PICS Credible Set shows whether that SNP is present in the 95% credible set (1 for present, 0 for absent). ATAC-seq distal, proximal, and union show whether the proxy SNP overlaps a respective ATAC-seq peak lifted over to human. For proxy SNPs that do overlap, the position of the ATAC-seq peaks is shown; otherwise, ‘NA’ represents lack of overlap. Expressed genes represents whether there is a differentially expressed growth plate gene (±100 kb) from the locus based on data from Lui et al., 2012. All positions are based on the human hg19 reference genome.
- https://doi.org/10.7554/eLife.29329.021
-
Supplementary file 7
Motif analysis of rs9920291 in the CHSY1 locus using UniProbe.
See Materials and methods for details.
- https://doi.org/10.7554/eLife.29329.022
-
Supplementary file 8
HOMER de-novo motif analysis results for mm10 and hg19 ATAC-seq peaks
Columns: Motif Logo: Logo of generated de novo motif. Rank: Motifs ranked by calculated p value, p value and log p value: p values for motif enrichment calculated by HOMER. % of Targets/Background: Percent of target and background sequences predicted to contain this motif. STD(Bg STD): Standard deviation of motif occurrence (bp) away from the center of the 200 bp sequence for target and background sets, respectively. Similar Motif: Similar motif as identified through search of HOMER vertebrate motif library; similarity score shown in parentheses (see Materials and methods).
- https://doi.org/10.7554/eLife.29329.023
-
Supplementary file 9
Transcription factor motif disruption by height GWAS SNPs
Height GWAS variants within ATAC-seq peaks (lifted to human hg19) which intersected motifs were counted as the foreground set. All height GWAS variants (regardless of whether they intersect ATAC-seq peaks) which intersected motifs were counted as the background set (a super-set of the foreground windows). For a given transcription factor (e.g. PBX1) all hits for the corresponding motif within the foreground and background windows were counted (‘Foreground Motif Hits’ and ‘Background Motif Hits’, respectively), along with the total number of all motif hits in the foreground set (‘All Foreground Motif Hits’) and the number of additional motif hits in the background set (‘Remainder Background Motif Hits’, calculated as the total number of all motif hits in the background windows minus the number of motif hits for the given transcription factor in the background windows). Hypergeometric test p values (‘pval’) and Benjamini-Hochberg FDR corrected p values (‘adjusted_pval’) are reported.
- https://doi.org/10.7554/eLife.29329.024
-
Supplementary file 10
Table of all primers and sgRNAs.
- https://doi.org/10.7554/eLife.29329.025
-
Transparent reporting form
- https://doi.org/10.7554/eLife.29329.026
Download links
A two-part list of links to download the article, or parts of the article, in various formats.
Downloads (link to download the article as PDF)
Open citations (links to open the citations from this article in various online reference manager services)
Cite this article (links to download the citations from this article in formats compatible with various reference manager tools)
Epigenetic profiling of growth plate chondrocytes sheds insight into regulatory genetic variation influencing height
eLife 6:e29329.
https://doi.org/10.7554/eLife.29329


