AMPylation targets the rate-limiting step of BiP’s ATPase cycle for its functional inactivation
- University of Cambridge, United Kingdom
Figures
Figure 1 with 3 supplements
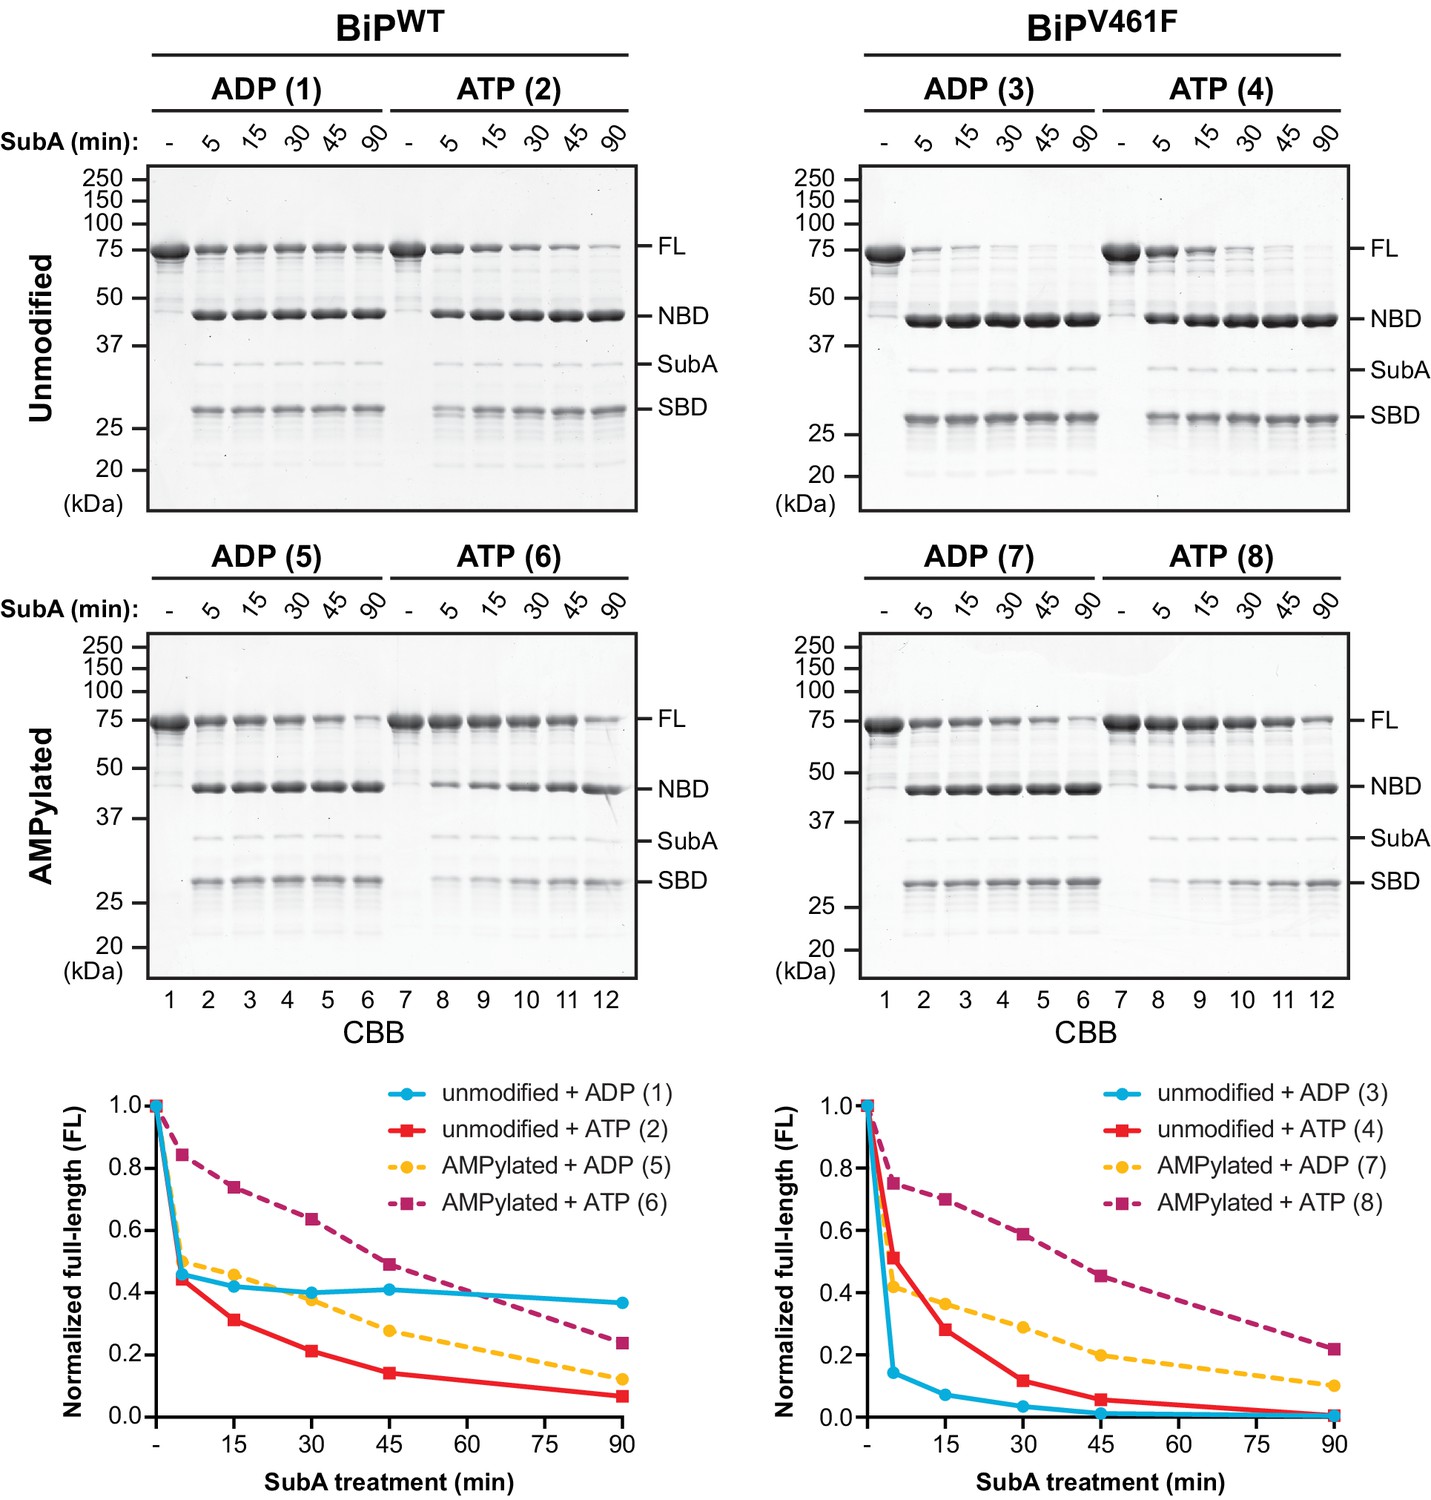
AMPylation biases BiP towards an ATP bound-like conformation.
Coomassie-stained (CBB) SDS-PAGE gels of purified unmodified or AMPylated wildtype BiP (BiPWT) and oligomerization-deficient V461F mutant (BiPV461F) proteins digested with the linker-specific SubA protease for the indicated times in presence of ADP or ATP. The intact proteins (FL) and isolated nucleotide binding domain (NBD) and substrate binding domain (SBD) are indicated. The time-dependent change of the intact BiP (FL) signals were quantified, normalized to the initial value (set to 1), and plotted in the graphs below. The numbering (1–8, in parentheses) refers to the explanatory cartoons of these limited proteolysis reactions that analyze the nucleotide-dependent conformational states of unmodified and AMPylated BiP (Figure 1—figure supplement 1). Shown are representative experimental observations reproduced three times (Figure 1—figure supplement 2).
Figure 1—figure supplement 1
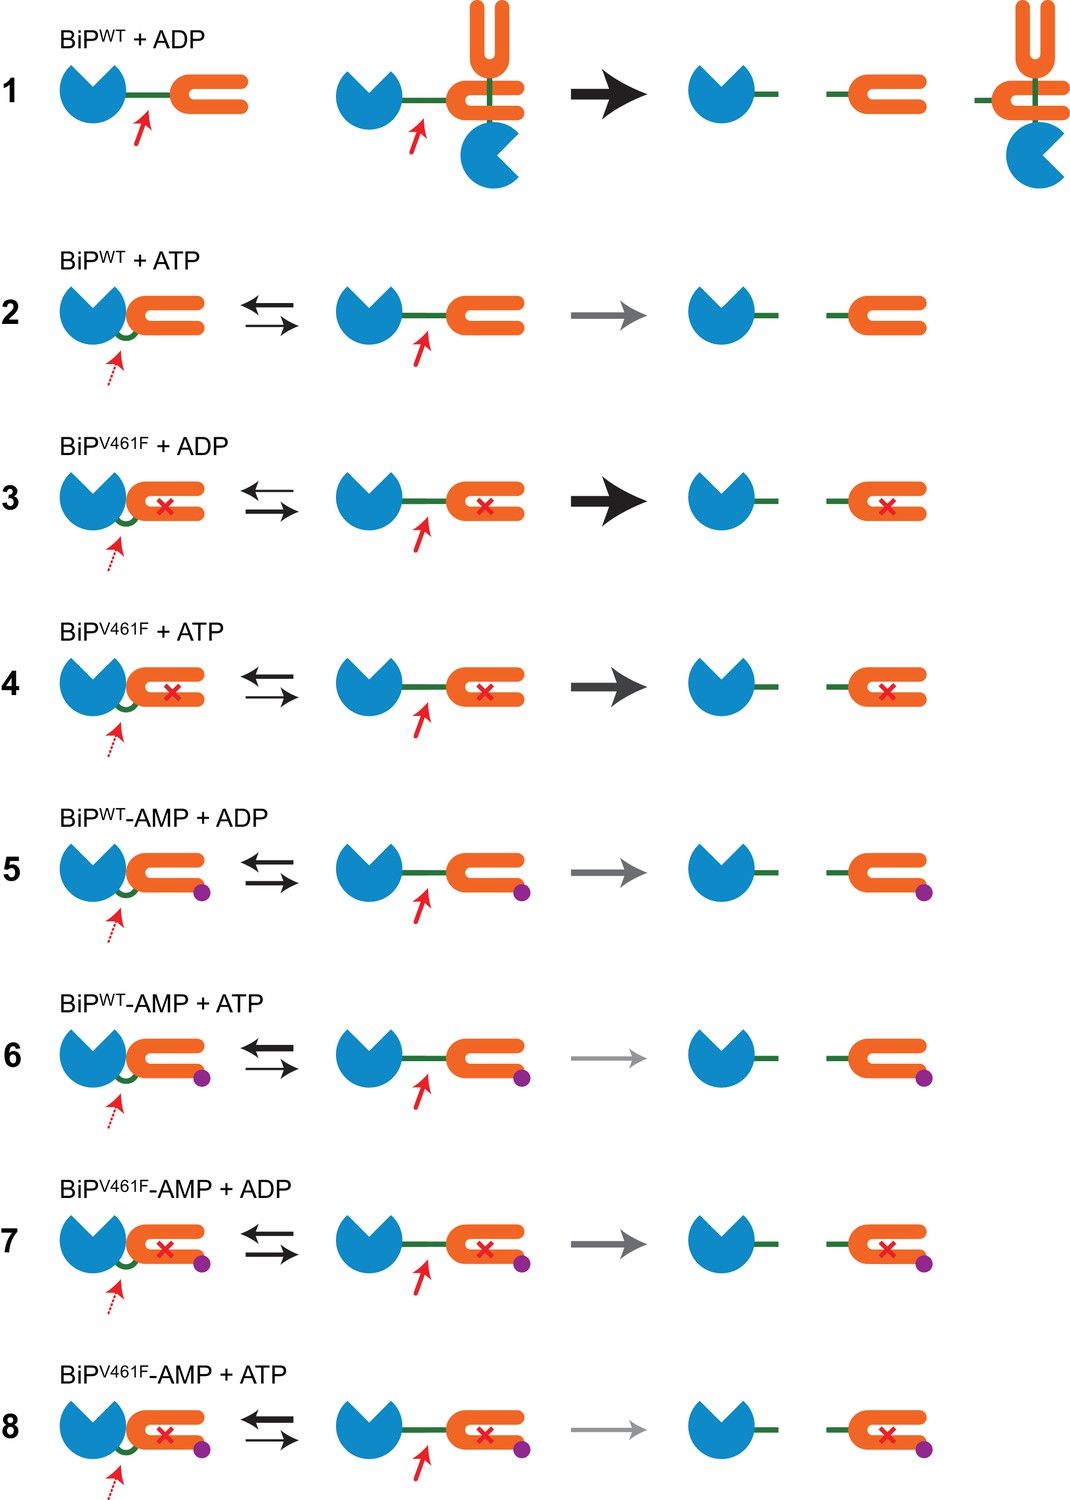
Cartoons depicting the conformational states of BiP in the reactions presented in Figure 1.
Cartoons depicting the dispositions of BiP’s interdomain linker in the reactions presented in Figure 1 explaining the observed differences in cleavability of BiP by SubA. The nucleotide binding domain (NBD) of BiP is shown in blue, the substrate binding domain (SBD) in orange and the interdomain linker in green. AMPylation of threonine 518 (BiP-AMP) is shown in purple and the cross represents the V461F mutation in BiP’s SBD. On the left, bold red arrows indicate high accessibility of the exposed linker in the domain-undocked state of BiP to SubA (fast cleavage), whereas the dotted red arrows indicate restricted access of the protease to the protected linker in the domain-docked conformation (slow cleavage). The thickness of the black arrows represents the equilibrium between the domain-docked and -undocked conformations of BiP. The thickness of the grey arrows indicate the observed SubA-mediated BiP cleavage kinetics. The cleavage products are shown on the right. Reaction 1: ADP-bound monomeric wildtype BiP (BiPWT) is rapidly cleaved. ADP-binding also stabilizes BiP oligomers, of which only the terminal BiP molecule can easily be cleaved by SubA, whereas protomers whose linkers are engaged by an SBD of an interacting molecule are strongly protected. Thus, all species are rapidly cleaved but a substantial fraction of protected BiP from oligomeric assemblies remains intact. Reaction 2: ATP binding converts BiP into the low-affinity state, which leads to oligomer disassembly and protection of the linker of monomeric BiP due to enhanced domain docking. This results in complete cleavage of BiP at a moderate rate. Reaction 3: The V461F mutation weakens BiP oligomerization. Monomeric ADP-bound BiPV461F adopts mainly the domain-undocked conformation leading to rapid and complete cleavage by SubA. Reaction 4: Linker protection due to ATP binding-induced domain docking of BiPV461F causes slower cleavage compared to reaction 3. Reaction 5: AMPylation of BiPWT diminishes its ability to engage in stable substrate interactions and thus to form oligomers. AMPylation also favors the domain-docked conformation. The combined effects lead to relatively slow but complete cleavage of ADP-bound BiPWT-AMP. Reaction 6: AMPylation further stabilizes the domain-docked conformation of ATP-bound BiPWT, leading to slower cleavage. Reaction 7 and 8: Because both AMPylation and the V461F mutation interfere with the formation of stable BiP oligomers their combination does not markedly change the cleavability of BiP in both nucleotide states compared to the corresponding reactions with modified BiPWT (reactions 5 and 6), leading to overall very similar cleavage kinetics.
Figure 1—figure supplement 2
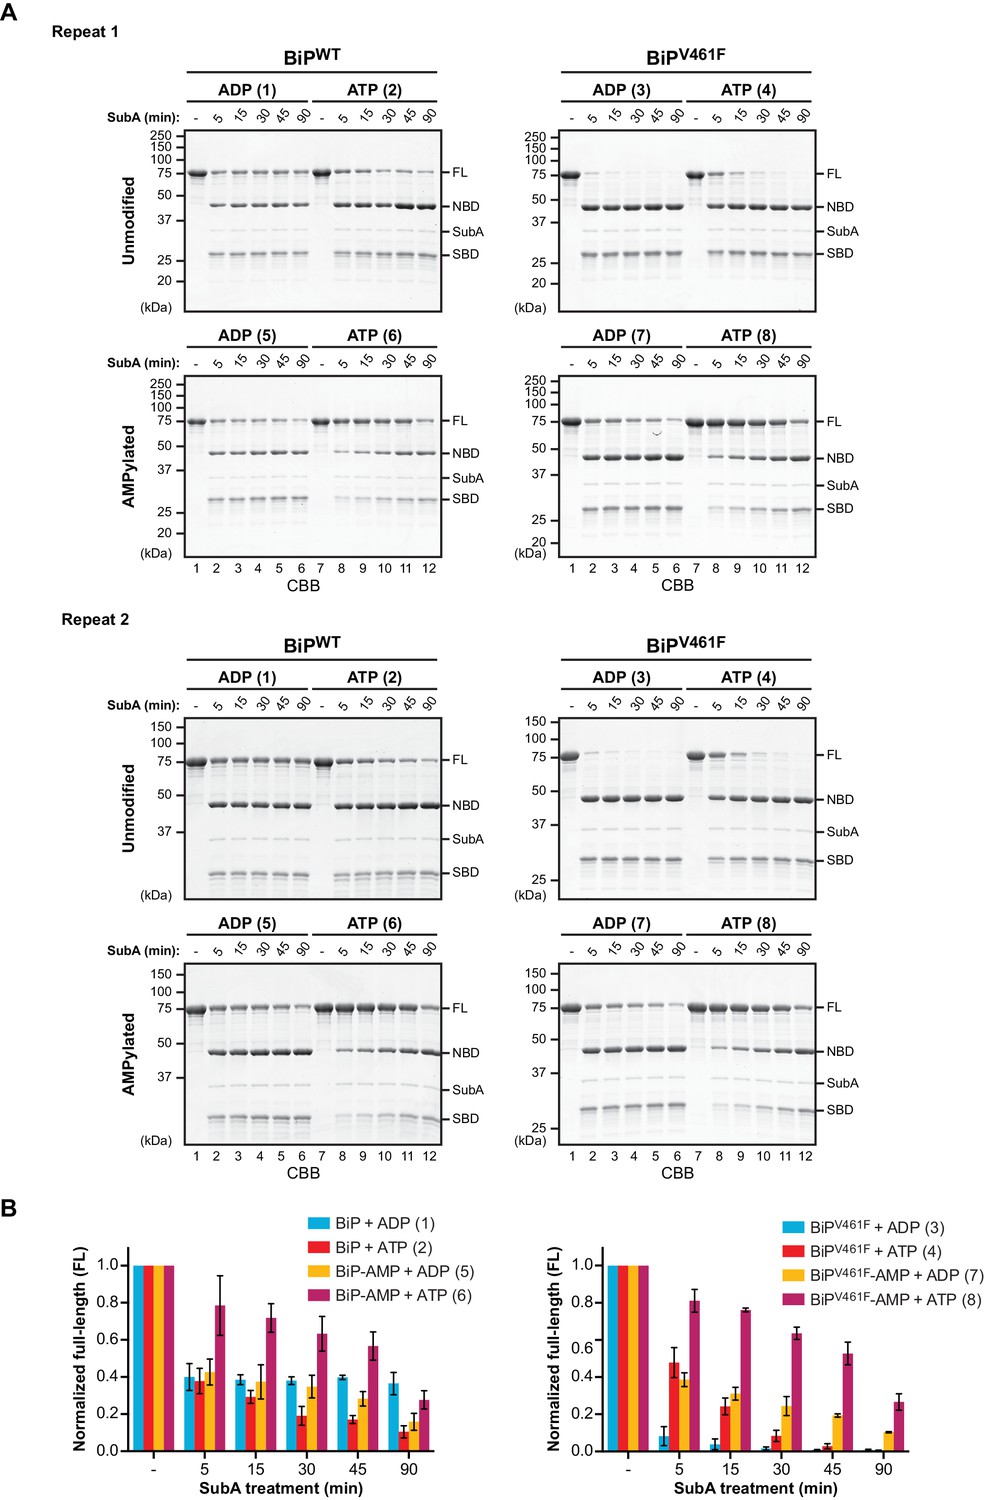
AMPylation alters the sensitivity of BiP to cleavage by SubA.
(A) Two independent repeats of the experiment shown in Figure 1. Unmodified or AMPylated wildtype BiP (BiPWT) and substrate binding-impaired (oligomerization-defective) V461F mutant (BiPV461F) proteins were digested with the linker-specific SubA protease for the indicated times in presence of ADP or ATP and analyzed by SDS-PAGE and Coomassie staining. The intact proteins (FL) and isolated nucleotide binding domain (NBD) and substrate binding domain (SBD) are indicated. The reactions are numbered according to Figure 1. (B) Graphs of the time-dependent change of the intact BiP (FL) signals of the reactions shown in ‘A’ and Figure 1. The FL signals were quantified and normalized to the initial value (set to 1). Plotted is the mean ±SD of each data point derived from Figure 1 and the two repeats shown above (n = 3).
Figure 1—figure supplement 3
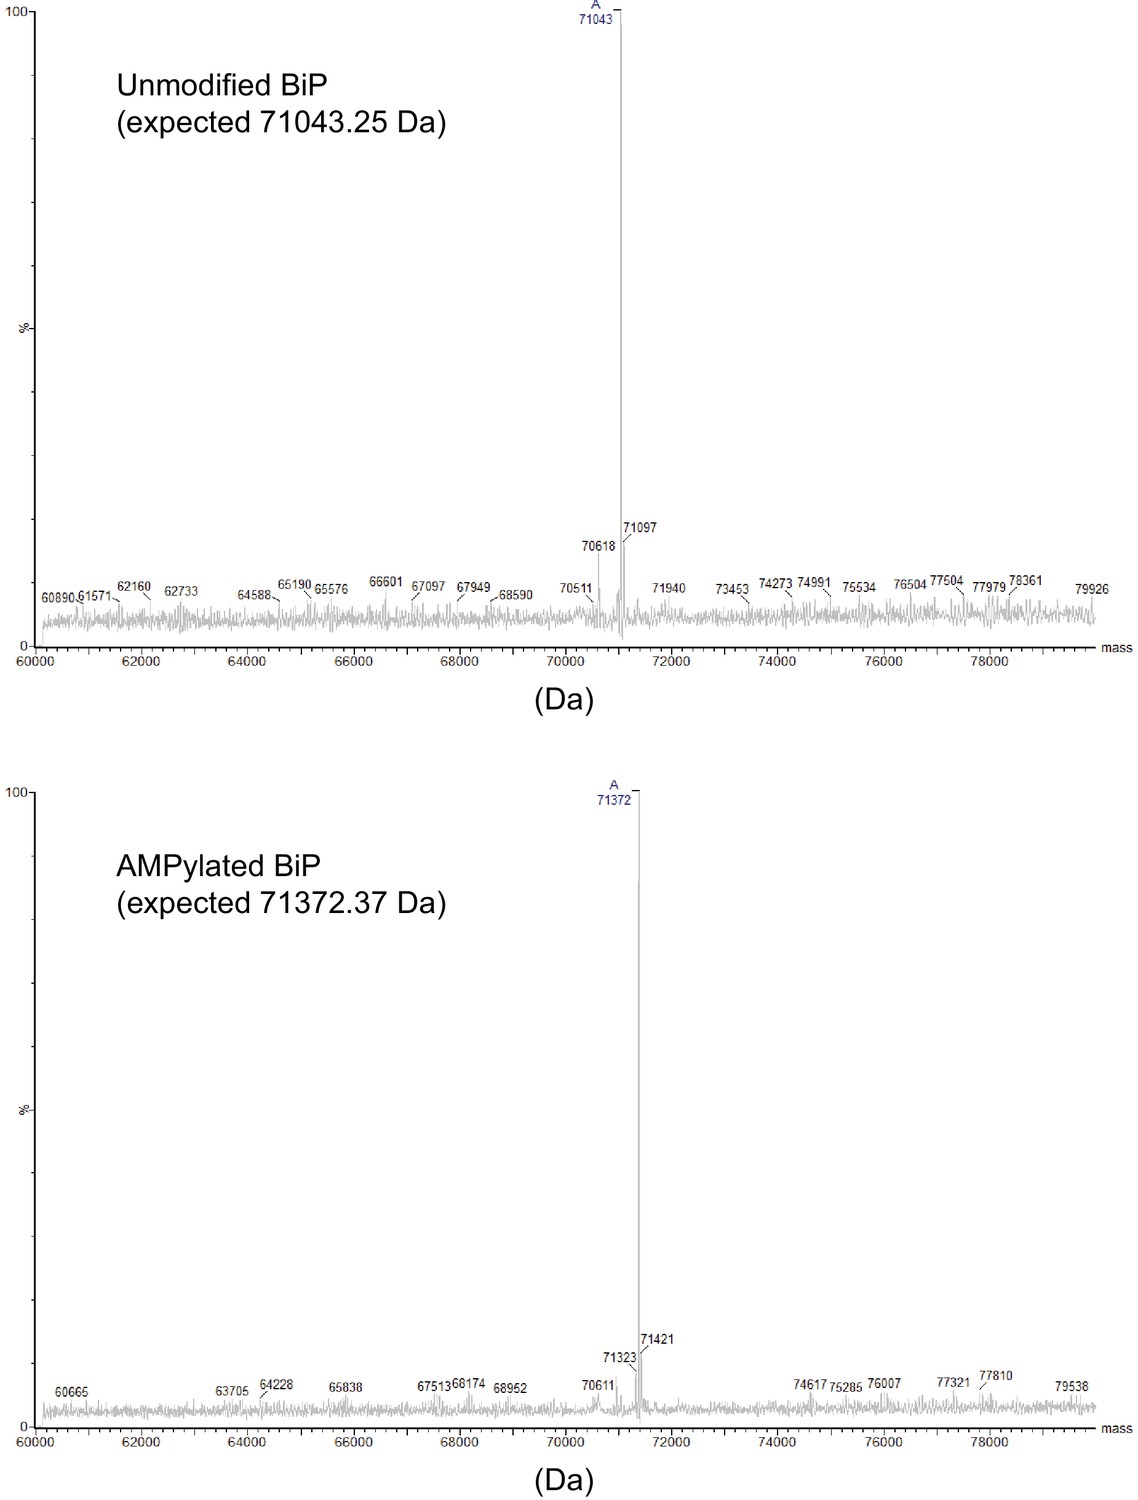
Analysis of unmodified and AMPylated BiP by mass spectrometry.
Deconvoluted mass spectra of unmodified and AMPylated BiP proteins analyzed by intact protein mass spectrometry. The reconstructed mass values for the highest peaks of the spectra are indicated. Note that the masses of the most prominent peak in each spectrum match the expected mass.
Figure 2 with 5 supplements
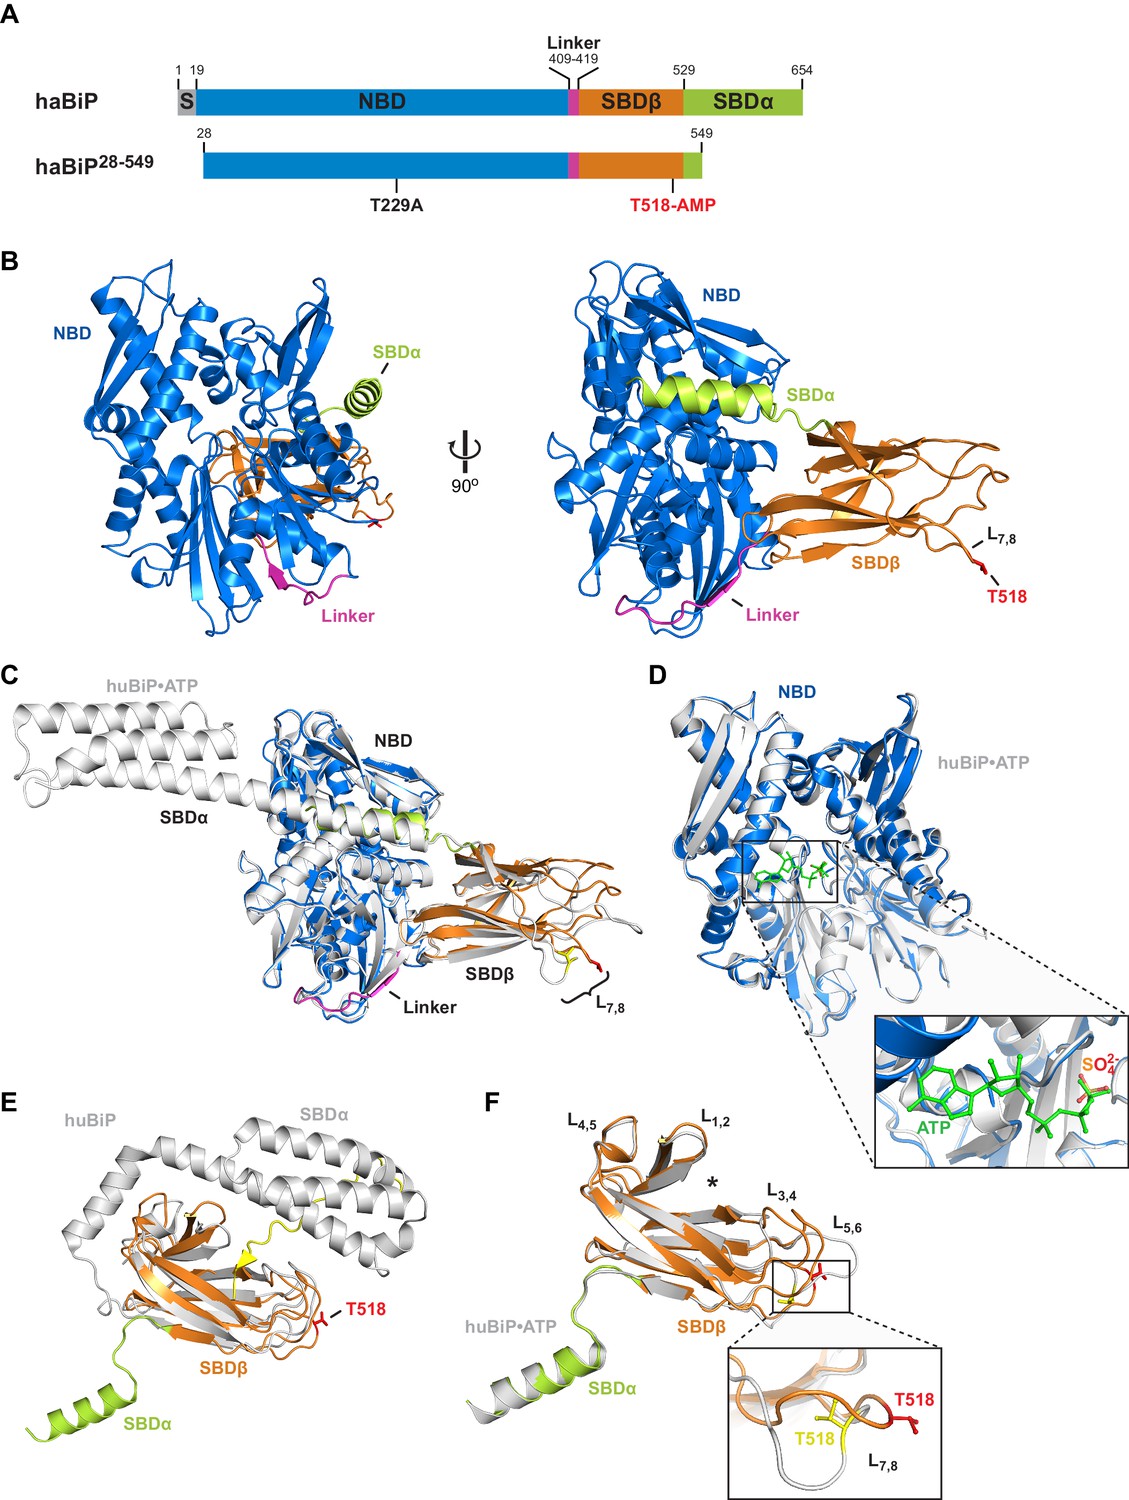
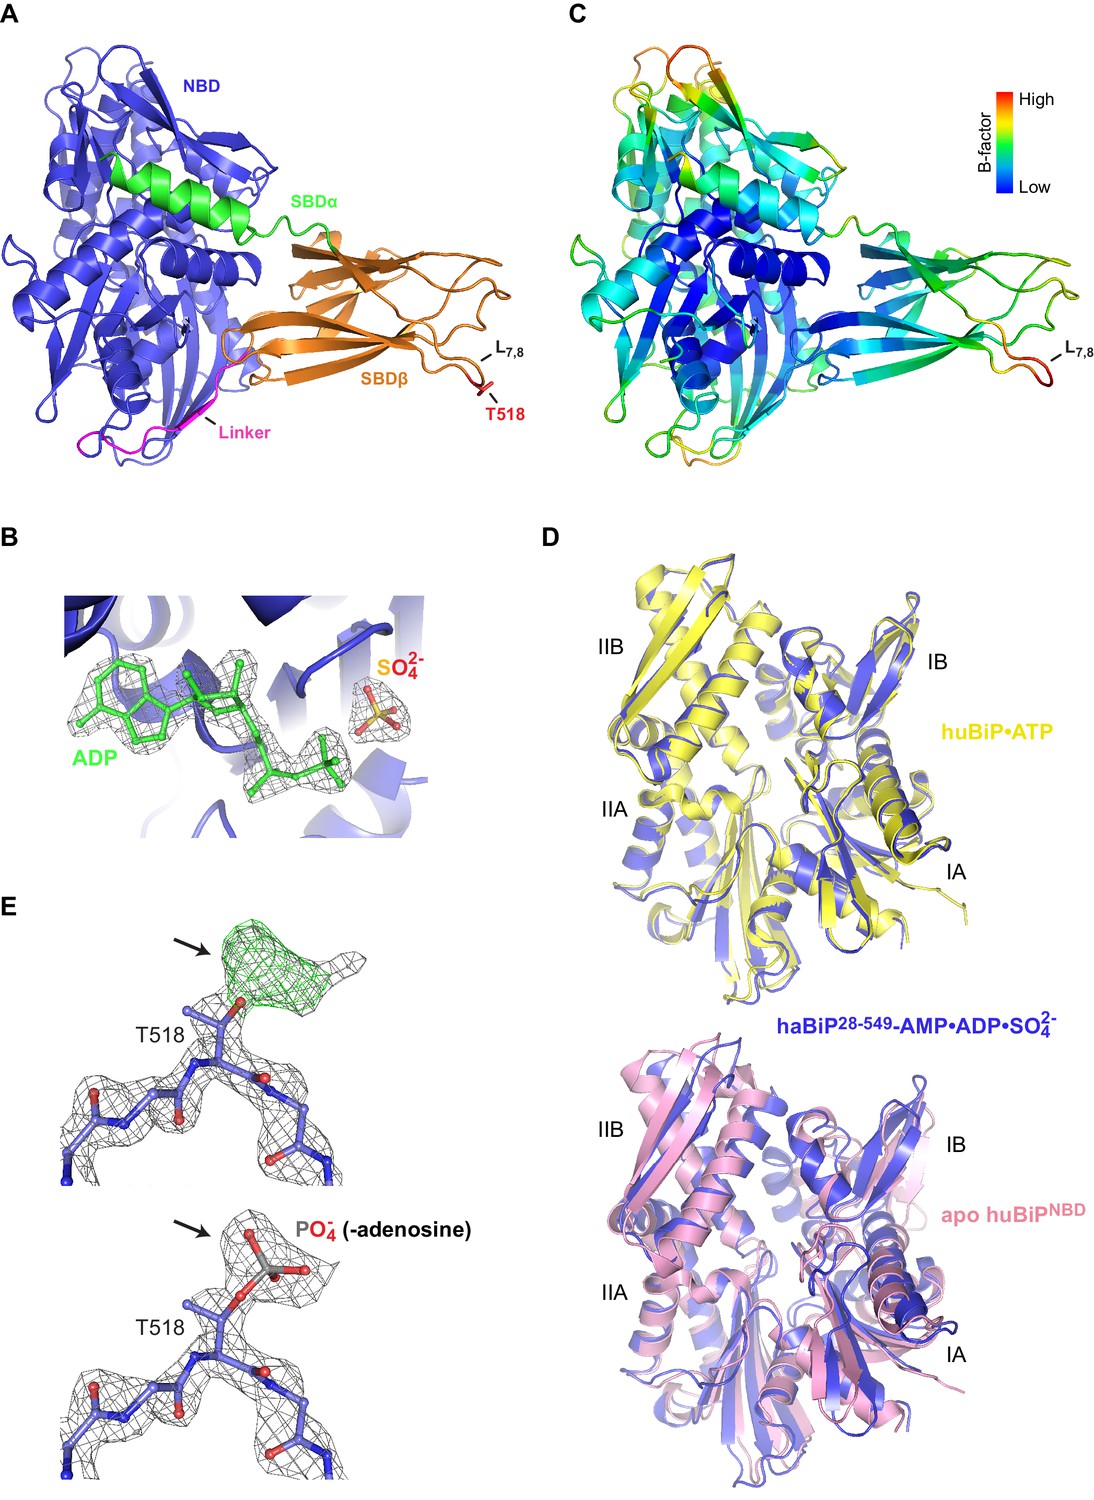
Crystal structure of in vitro AMPylated apo BiP.
(A) Schematic representation of Chinese hamster BiP (haBiP) and the derivative used for crystallization (haBiP28-549). The following features are indicated: signal sequence (grey; S), nucleotide binding domain (blue; NBD), interdomain linker (magenta; Linker), substrate binding subdomain β (orange; SBDβ), substrate binding subdomain α (green; SBDα), and the AMPylation site (T518-AMP). (B) Ribbon representation of the structure of crystallized haBiP28-549 (PDB 5O4P) in two orientations with coloring as in ‘A’. (C) Comparison of haBiP28-549 (PDB 5O4P) with the structure of unmodified ATP-bound human BiP (huBiP, PDB 5E84; grey). Loop L7,8 comprising the AMPylation site (T518) is indicated, otherwise coloring as in ‘A’. (D) Same as in ‘C’ showing only the NBDs. The inset is a close-up view of the nucleotide binding cleft. The ATP (green) bound by the unmodified huBiP and a sulfate bound by AMPylated haBiP (blue) are indicated in stick diagram. Note that the sulfate group fully occupies the position of the terminal γ-phosphate of the bound ATP. (E) Comparison of the SBD of AMPylated haBiP28-549 (PDB 5O4P; coloring as in ‘A’) with the isolated SBD of unmodified huBiP (PDB 5E85, grey). A C-terminal substrate peptide (yellow) occupies the peptide binding groove of unmodified huBiP. The AMPylation site (T518) is indicated (red). (F) As in ‘C’ comparing only the substrate binding domains. The asterisk (*) marks the peptide binding groove. The inset shows a close-up view of L7,8. Note the outward orientation of the T518 side chain in the AMPylated haBiP28-549 (red) compared to its inward orientation in unmodified huBiP (yellow).
Figure 2—figure supplement 1
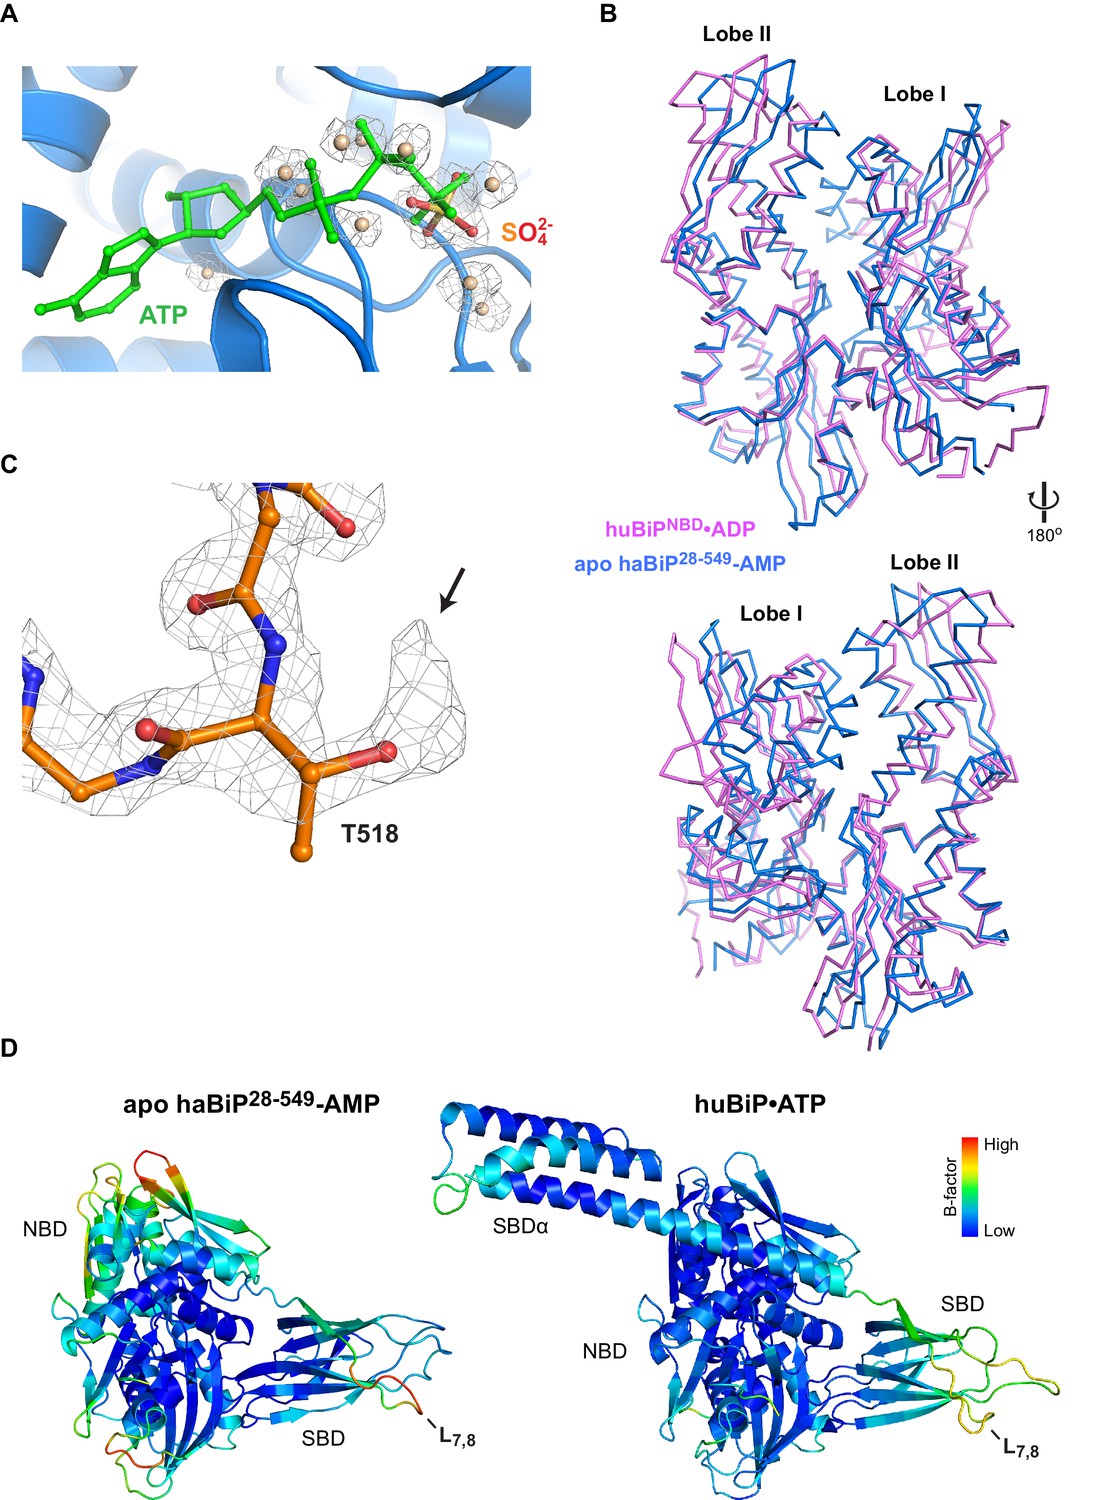
Features of the AMPylated apo BiP structure point to the absence of nucleotide in the NBD and AMPylation of T518.
(A) A close-up view of the nucleotide binding cleft of AMPylated haBiP28-549 (PDB 5O4P) in ribbon representation. The ATP (green) as found in unmodified human BiP (PDB 5E84) and the electron densities (2FO-FC contoured at 1.00 RMSD; grey mesh) of a sulfate group and several water molecules found in the AMPylated haBiP28-549 structure are indicated. Note that the sulfate and water molecules in PDB 5O4P overlap with the phosphate groups of ATP in 5E84. (B) Comparison of the NBD of AMPylated haBiP28-549 (PDB 5O4P; blue) and the ADP-bound isolated NBD of human BiP (PDB 3IUC; purple) in backbone representation. (C) The density map (2Fo-Fc contoured at 1.00 RMSD; grey mesh) of part of the SBD loop L7,8 from the structure of AMPylated haBiP28-549 (PDB 5O4P) with the modeled residues is shown. The side chain of threonine 518 (T518) is indicated. Oxygen atoms are represented in red and nitrogen atoms in blue. Note the extra density protruding from the T518 side chain (arrow). (D) The structure AMPylated haBiP28-549 (left; PDB 5O4P) and ATP-bound human BiP (right; PDB 5E84) in ribbon representation and colored according to Cα B-factors (generated with PyMOL). Note the high B-factor values at loop L7,8 of haBiP28-549.
Figure 2—figure supplement 2
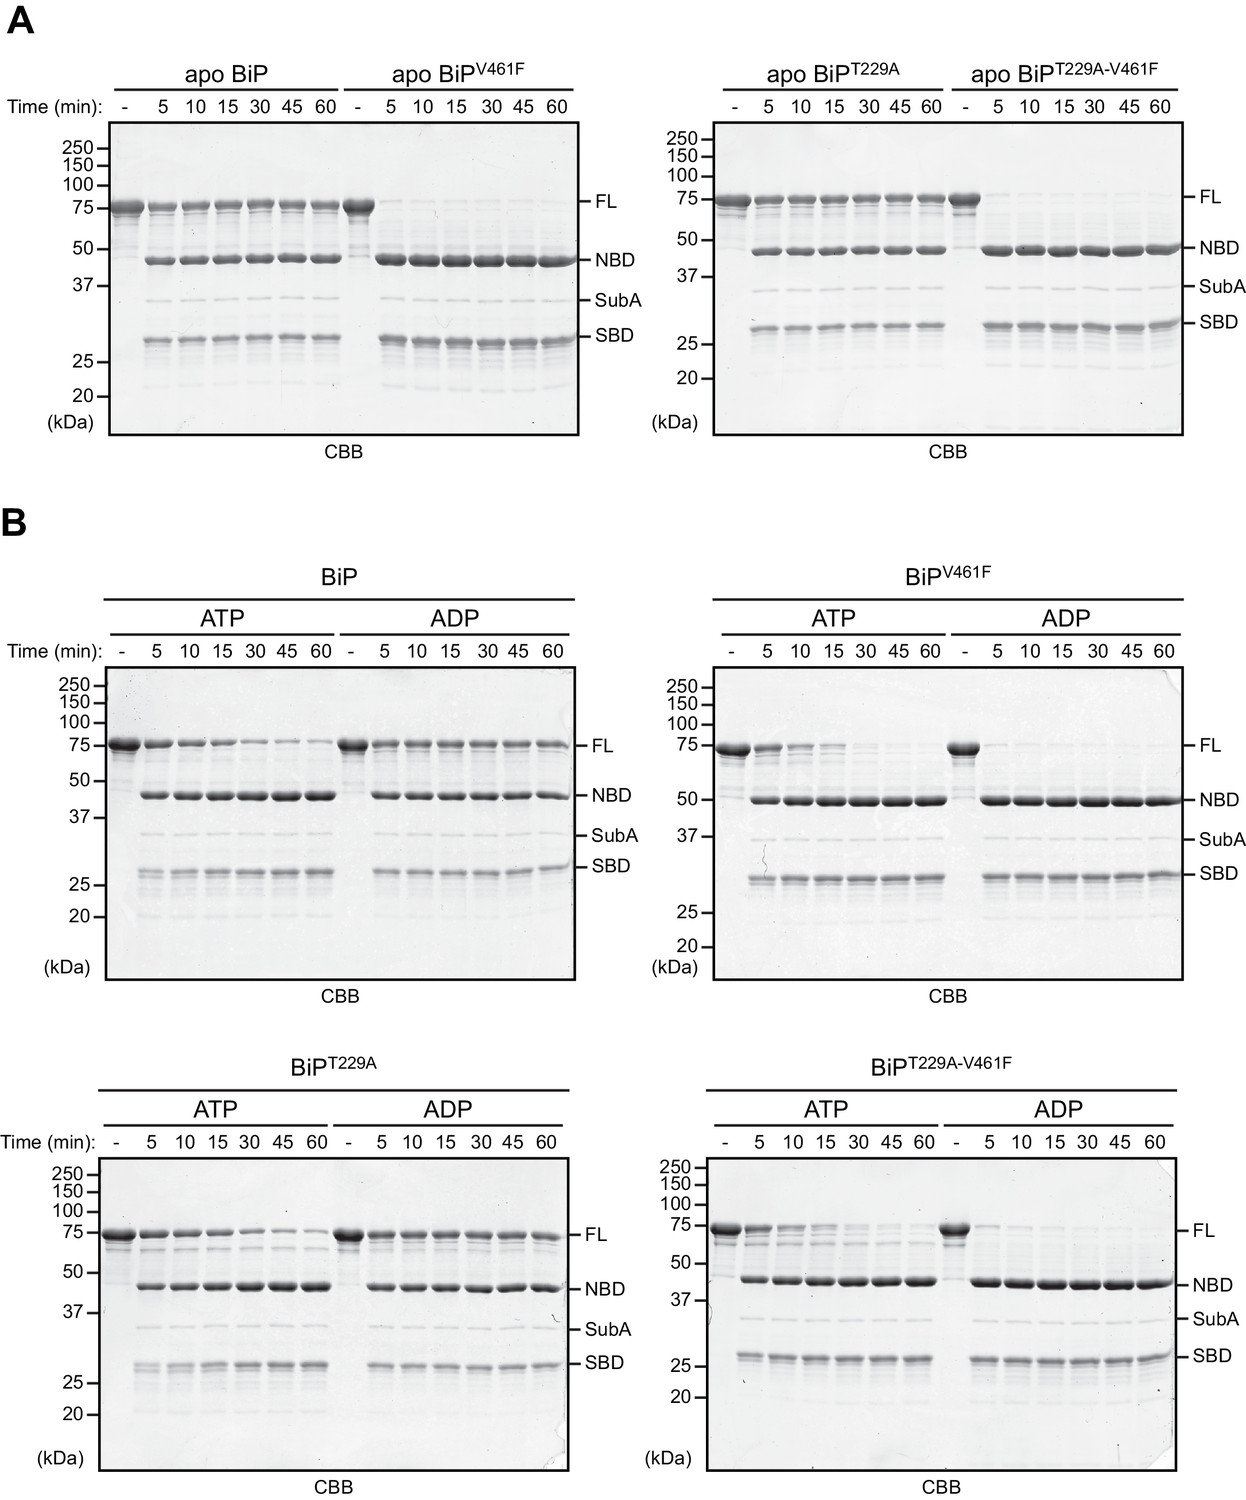
The T229A mutation does not alter BiP’s nucleotide-dependent allostery.
(A) Limited proteolysis experiment to analyze the conformational states of purified, nucleotide-free wildtype BiP protein and the indicated mutants using the linker-specific bacterial protease SubA (as in Figure 1). The proteins were cleaved with SubA for the indicated times in absence of added nucleotide (apo state) and subsequently analyzed by SDS-PAGE and Coomassie (CBB) staining. The intact proteins (FL) and isolated nucleotide binding domain (NBD) and substrate binding domain (SBD) are indicated. (B) As in ‘A’ but cleavage was performed in presence of ADP or ATP. Note that the T229A mutation does not alter BiP’s characteristic nucleotide-dependent sensitivity to cleavage by SubA.
Figure 2—figure supplement 3
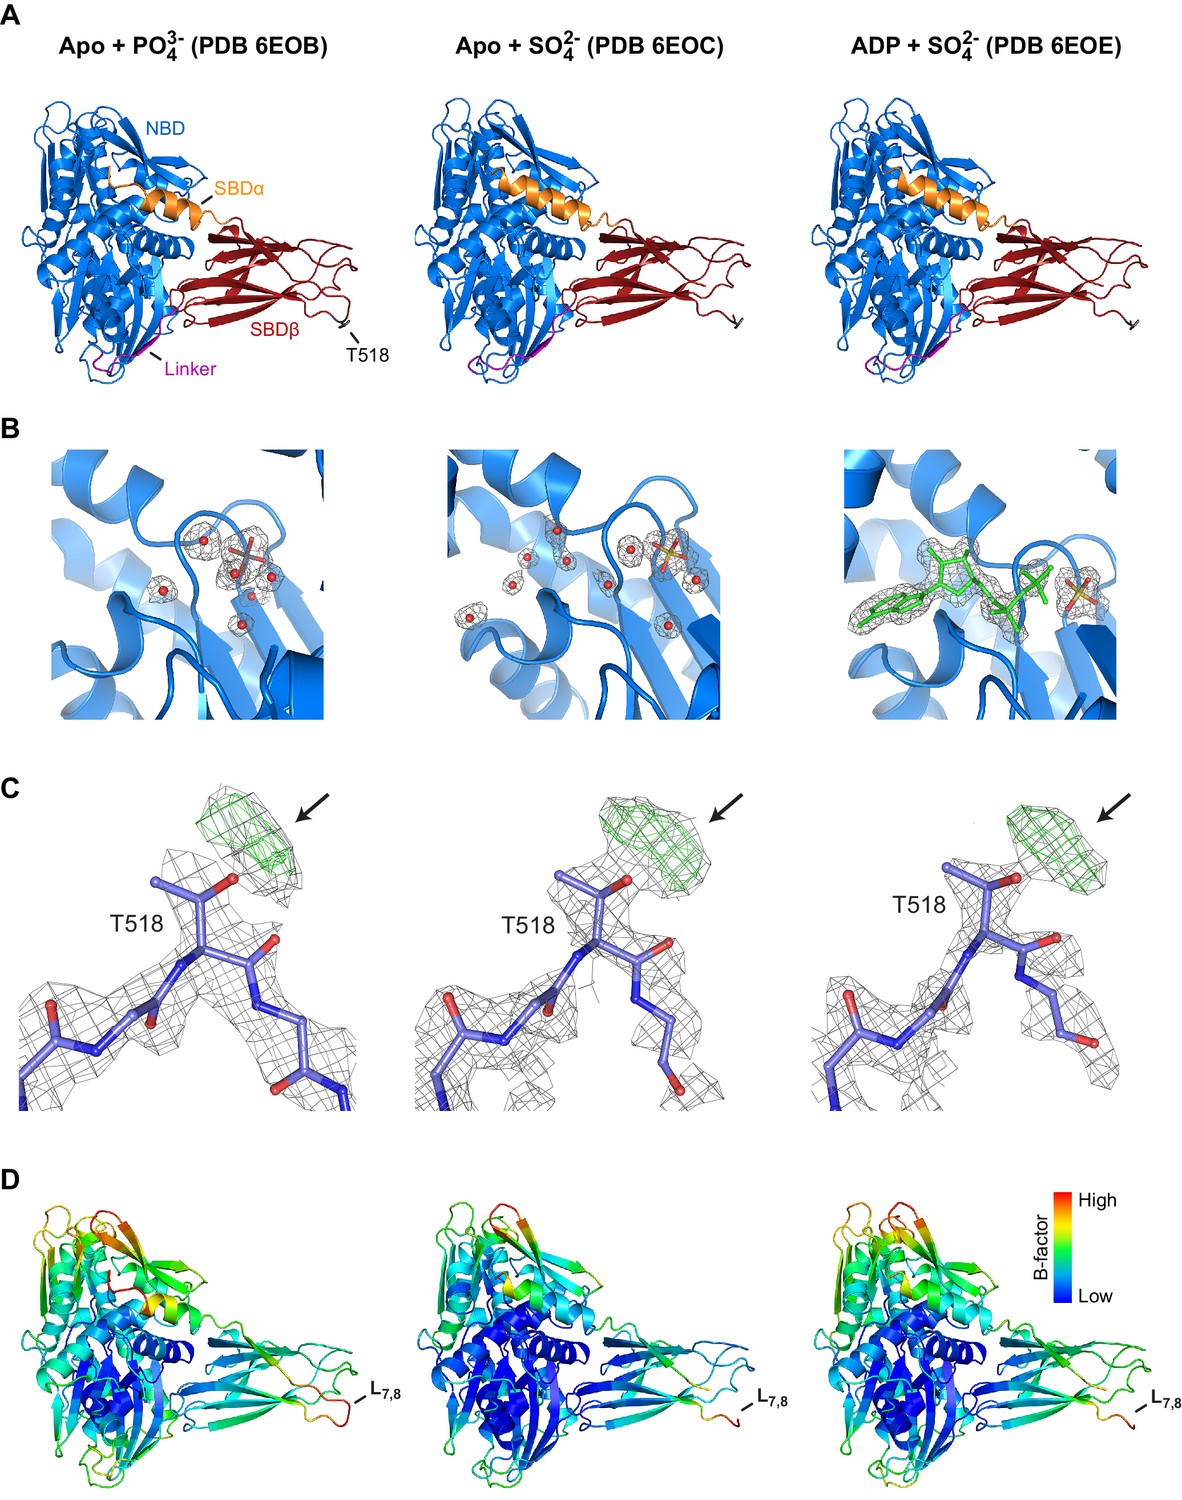
Structures of AMPylated BiP in a different crystal form and in the presence of diverse ligands exhibit consistent modification-dependent features.
(A) Ribbon representations of the structures of crystallized AMPylated haBiP28-549 in side view orientation. The nucleotide binding domain (blue; NBD), interdomain linker (magenta; Linker), substrate binding subdomain β (red; SBDβ), substrate binding subdomain α (orange; SBDα), and the AMPylation site (dark grey sticks; T518) are indicated and the corresponding PBD codes (6EOB, 6EOC, 6EOE) are denoted above (see Table 1). Note that all BiP structures are in the domain-docked conformation despite ATP being absent from the NBD (‘B’). (B) A close-up view of the nucleotide binding cleft in ribbon representation of the structures shown in ‘A’. The density maps (2Fo-Fc contoured at 1.00 RMSD; grey mesh) of modeled water molecules (red dots), phosphate (grey sticks), sulfate (yellow sticks), and ADP (green) are indicated. Note that the nucleotide in structure PDB 6EOE was built in with partial occupancy. (C) The density maps (2Fo-Fc contoured at 1.00 RMSD; grey mesh) and difference maps (Fo-Fc contoured at 3.00 RMSD; green mesh) of part of the SBD loop L7,8 with modeled residues of structures shown in ‘A’ are presented. Arrows indicate additional densities protruding from the T518 side chain. Oxygen atoms are represented in red and nitrogen atoms in dark blue. (D) The structure shown in ‘A’ colored according to Cα B-factors (generated with PyMOL). Note the high B-factor values observed at loop L7,8.
Figure 2—figure supplement 4
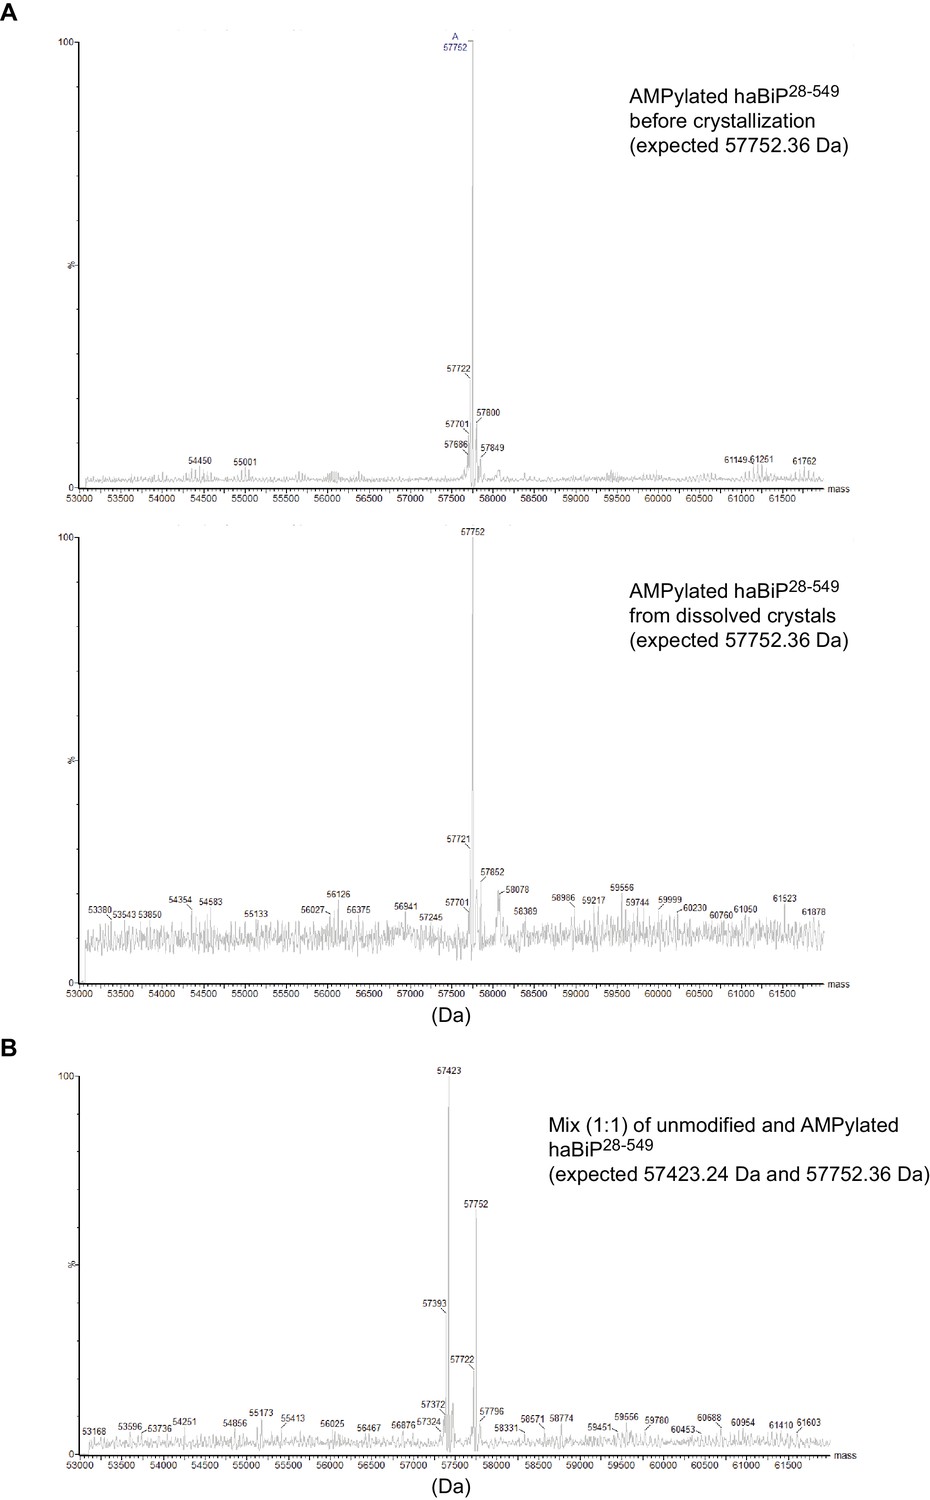
Mass spectrometry analysis of BiP used for crystallization.
(A) Deconvoluted intact protein mass spectra of AMPylated haBiP28-549 protein before crystallization (input material) and from dissolved crystals (taken from the same trays as the one used to generate structure PDB 6EOE). The reconstructed mass values for the highest peaks are indicated on the spectra. Note that the mass of the most prominent peak in both spectra match the expected mass. (B) Analysis as in ‘A’ of a 1:1 mixture of unmodified and AMPylated haBiP28-549 proteins. Note the two prominent peaks corresponding to the expected masses of both species.
Figure 2—figure supplement 5
Crystal structure of ADP-bound AMPylated BiP.
(A) Ribbon representation (side view) of the structure of haBiP28-549 crystallized in presence of ADP (PDB 6EOF). The nucleotide binding domain (blue; NBD), interdomain linker (magenta; Linker), substrate binding subdomain β (orange; SBDβ), substrate binding subdomain α (green; SBDα), loop L7,8, and the AMPylation site residue (red; T518) are indicated. (B) Close-up view of the nucleotide binding cleft of the NBD shown in ‘A’ (blue). The density map (2Fo-Fc contoured at 1.00 RMSD; grey mesh) of bound ADP (green) and sulfate are indicated. (C) The structure shown in ‘A’ colored according to Cα B-factors (generated with PyMOL). Note that the highest B-factor values are observed at loop L7,8. (D) Comparison of the NBD of ADP-bound AMPylated haBiP28-549 (PDB 6EOF; blue) and either the structure of the ATP-bound NBD of full-length human BiP (PDB 5E84; yellow) or the isolated apo NBD (PDB 3LDN; pink). The subdomains (A and B) of lobes I and II are indicated. Note that close match between the NBD conformations of ADP-bound AMPylated haBiP28-549 and ATP-bound BiP (Cα alignment RMS = 0.378 Å; residues 1–407; over 305 Cα’s). Also note the widened nucleotide binding cleft of the apo NBD relative to the ADP-bound NBD of AMPylated haBiP28-549 (Cα alignment RMS = 2.911 Å; residues 1–407; over 345 Cα’s). (E) The density map (2Fo-Fc contoured at 1.00 RMSD; grey mesh) and positive difference map (Fo-Fc contoured at 3.00 RMSD; green mesh) of part of the SBD loop L7,8 from the structure of ADP-bound AMPylated haBiP28-549 (PDB 6EOF) with modeled residues is shown before (top) and after (bottom) modeling of a phosphate group (representing part of the phosphodiester bond to adenosine) into the additional density protruding from the T518 side chain (arrows). Oxygen atoms are represented in red and nitrogen atoms in dark blue.
Figure 3

AMPylation inhibits J protein-mediated BiP oligomerization.
(A) Peptide bond absorbance traces (A230 nm) of wildtype unmodified (BiP) and AMPylated (BiP-AMP) BiP proteins (both at 50 µM) resolved by size-exclusion chromatography in absence of added nucleotide. The elution peak corresponding to BiP monomers (M) and earlier eluting peaks (II and III) representing BiP dimers and trimers, respectively, as well as high-molecular weight (HMW) oligomers are indicated. Note the enhanced monomer signal and paucity of oligomers in the sample of AMPylated BiP. (B) As in ‘A’ but in presence of ADP or ATP (both at 1.5 mM). Note the nearly complete disassembly of BiP oligomers in the ATP-containing sample. (C) Where indicated the same experiment as in ‘A’ was performed in presence of ATP (1.5 mM) and different concentrations of the wildtype (J) or inactive QPD mutant (J*) J-domain of ERdj6 (1 × represents 1.25 µM of J-domain). Note the J-domain concentration-dependent increase in peaks II and III and the formation of faster eluting species (before 8 min) representing large BiP oligomers. (D) Comparison of the elution profiles of unmodified (left) and AMPylated BiP (right) treated as in ‘C’. Note the near absence of early-eluting oligomeric species in the AMPylated BiP sample. A representative experiment of three independent repeats is shown.
Figure 4 with 1 supplement
AMPylation inhibits J protein-mediated substrate binding.
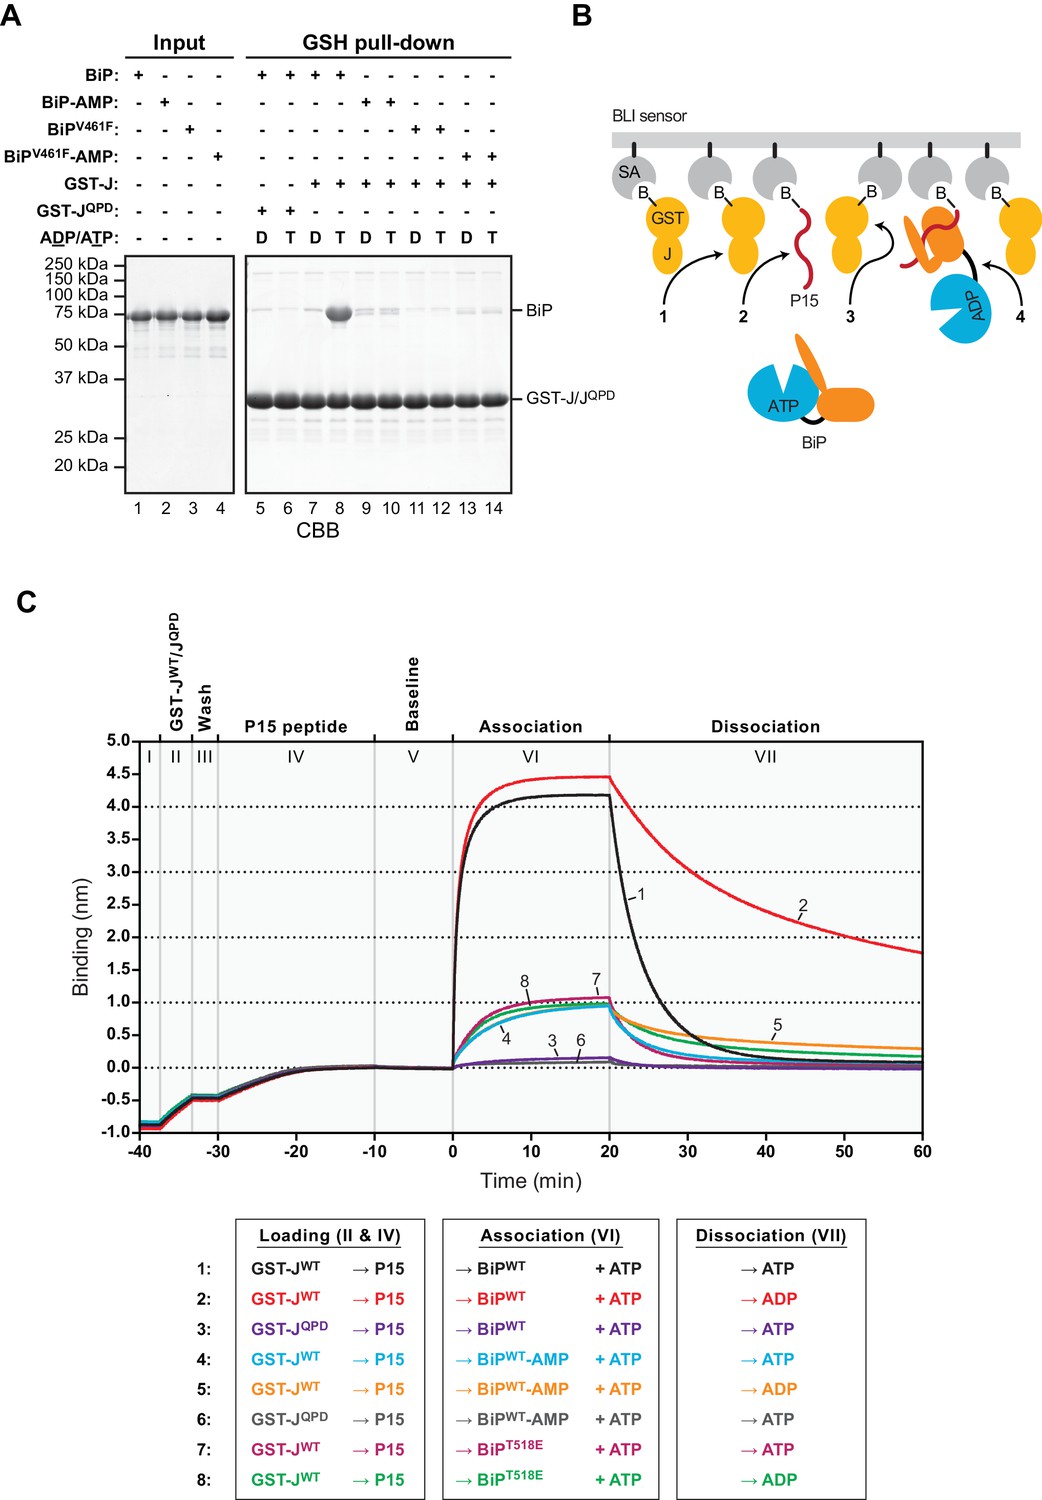
(A) Coomassie-stained SDS-PAGE gels of proteins eluted from a glutathione (GSH) sepharose matrix. Unmodified or AMPylated wildtype or V461F mutant BiP proteins were incubated in presence of ADP or ATP with wildtype or QPD mutant J-domain coupled via a GST-fusion protein to GSH sepharose beads and subsequently washed extensively. The input and the bound proteins (GSH pull-down) eluted by denaturation in SDS are indicated. (B) Cartoon depicting possible interactions between soluble BiP (the analyte) and biotinylated GST-J co-immobilized with a BiP substrate peptide (P15) on a bio-layer interferometry (BLI) sensor (the ligand). Streptavidin (SA)-coated BLI sensors (grey), the biotin moiety (B) covalently attached to GST-J (yellow), biotinylated P15 substrate peptide (red), and ATP-bound BiP in solution are shown. Arrows indicate J domain-mediated BiP interactions with GST-J in trans (1), P15 (2), GST-J in cis (3) and J domain-mediated BiP oligomerization (4). (C) Plot of the BLI signal as a function of time in experiments as cartooned in ‘B’ and tabulated below. The individual steps of the experiment (I-VII) are indicated: After an initial equilibration step (I) biotinylated wildtype or QPD mutant GST-J corresponding to an interference signal difference of ~0.4 nm was immobilized (II). Following a short wash step (III) the binding sites on the sensors were saturated with biotinylated P15 peptide (IV), followed by an extended wash step to establish a stable baseline signal (V). The sensors were then introduced into solutions containing unmodified (BiP) or AMPylated (BiP-AMP) wildtype BiP or BiPT518E mutant proteins to detect their association with the sensors in presence of ATP (VI). Dissociation of BiP from the sensor was measured in protein-free solutions containing either ADP or ATP (VII). A representative experiment is shown and the same result was observed in at least three independent repeats. Note that in the presence of ADP the dissociation of AMPylated BiP (32.9 × 10⁻⁴ ± 19.0×10⁻⁴ s−1; trace 5) and BiPT518E (16.5 × 10⁻⁴ ± 7.3×10⁻⁴ s−1, trace 8) was faster than unmodified BiP (7.9 × 10⁻⁴ ± 5.3×10⁻⁴ s−1; trace 2). The dissociation rate constants represent mean values with standard deviations.
Figure 4—figure supplement 1
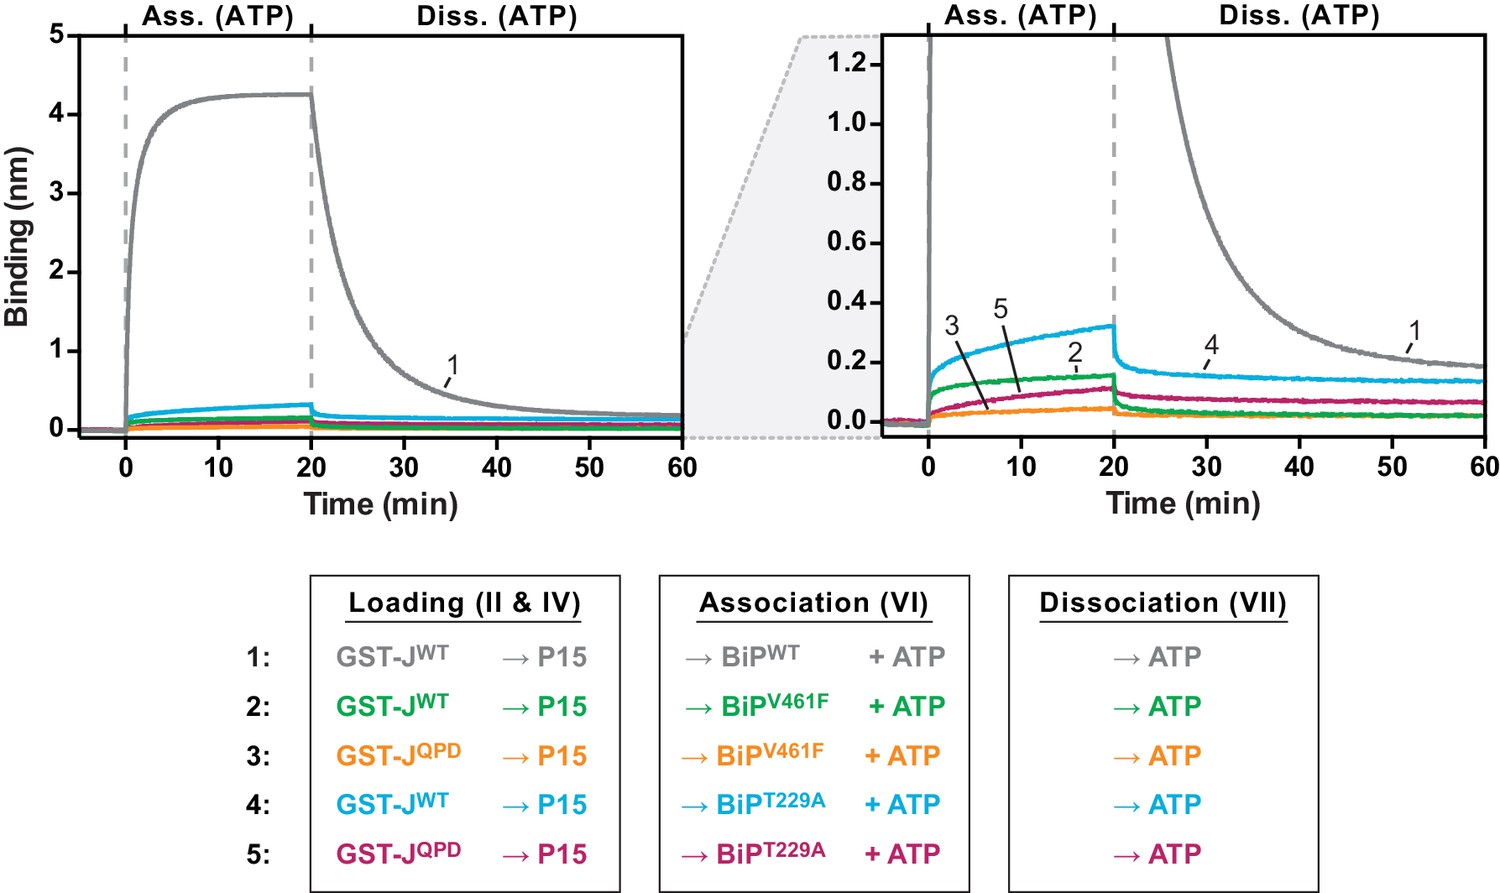
J domain-mediated substrate interactions depend on BiP’s ATPase activity and ability to bind substrates.
Bio-layer interferometry (BLI) experiment as in Figure 4C. A plot of binding signals against time during the association and dissociation steps is shown. After an initial equilibration step biotinylated wildtype or QPD mutant GST-J corresponding to a binding signal difference of ~0.4 nm was immobilized. The binding sites on the sensors were then saturated with biotinylated P15 peptide. After a baseline step the sensors were introduced into solution containing wildtype BiP or substrate binding-deficient BiPV461F or ATP hydrolysis-deficient BiPT229A mutant proteins to detect their association with the sensors in presence of ATP. Dissociation of BiP proteins from the sensor was measured in protein-free solutions containing ATP. The graph on the right is a close-up view to visualize binding curves with low amplitudes. A representative experiment of two independent repeats is shown.
Figure 5 with 2 supplements
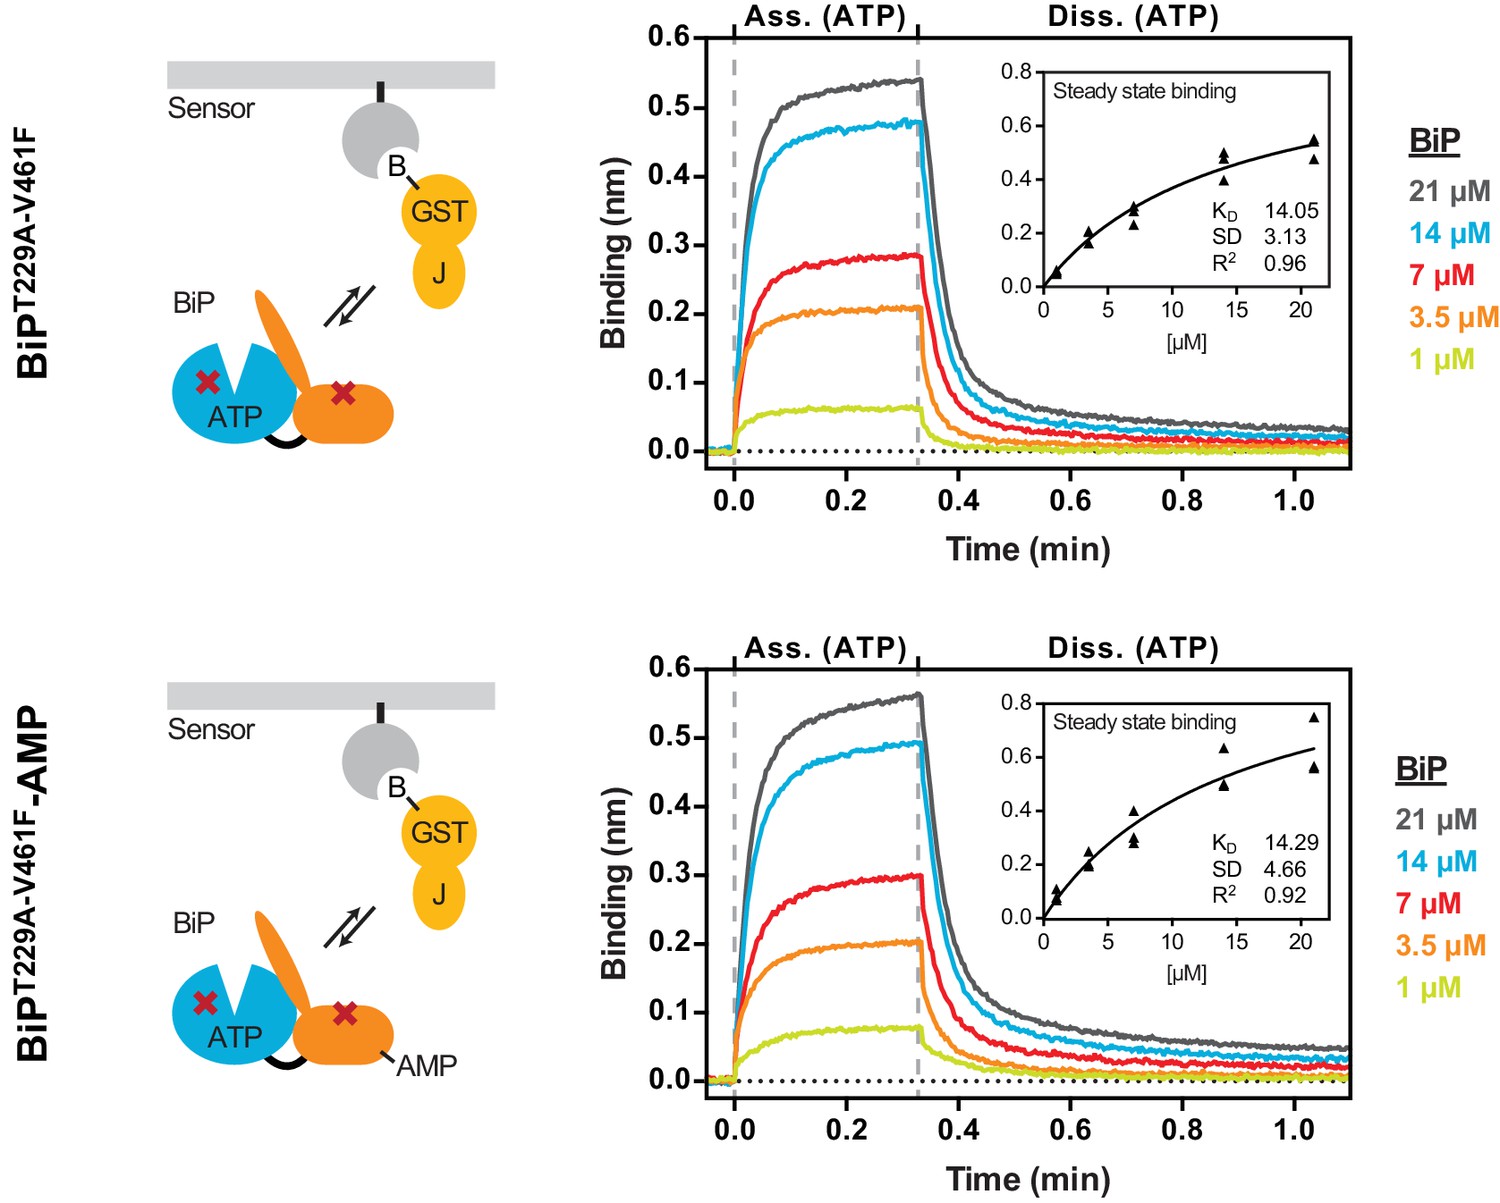
AMPylation does not alter non-substrate interactions between BiP and a model J-domain.
Bio-layer interferometry (BLI) experiment based on the experiment outlined in Figure 4C to measure the functionally relevant non-substrate interactions between an ATPase and substrate binding BiP mutant protein (BiPT229A-V461F) and a model J-domain fused to GST (GST-J). The cartoons on the left depict the anticipated interactions between BiP in solution and the J-domain on the sensor surface during the association step and plots of BLI binding signals against time are shown on the right. After an initial equilibration step the sensors were saturated with biotinylated GST-J followed by another wash step to achieve a stable baseline signal (not shown). The sensors were then exposed to solutions containing different concentrations of unmodified or AMPylated BiPT229A-V461Fproteins to measure their association with the sensors. Dissociation was detected in protein-free solutions containing ATP. Representative plots of recorded binding signals of the association and dissociation steps are shown. The insets present plots of the plateau binding amplitudes during the association step against BiP concentrations of three independent experiments as well as the obtained dissociation constant (KD) values with the corresponding standard deviations and the R2 values of the fits.
Figure 5—figure supplement 1
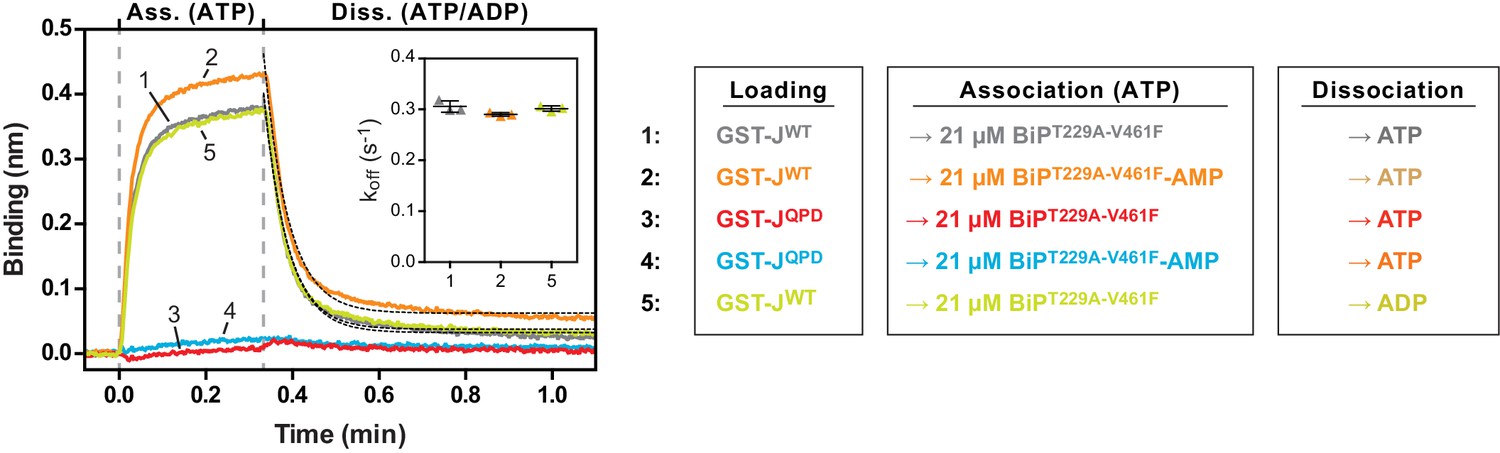
The non-substrate interaction between BiPT229A-V461F and the BLI sensor requires a functional J-domain.
Bio-layer interferometry (BLI) experiment as in Figure 5 to measure the functionally relevant non-substrate interactions between an ATPase activity- and substrate binding-deficient mutant BiP protein (BiPT229A-V461F) and a wildtype model J-domain fused to GST (GST-J) or a mutant thereof carrying an inactivating amino acid substitution in the conserved HPD motif (GST-JQPD). After an initial equilibration step the sensors were saturated with biotinylated GST-J followed by a baseline step (not shown). The sensors were then exposed to solutions containing unmodified or AMPylated BiPT229A-V461F to measure their association with the sensors. Dissociation was detected in protein-free solutions containing either ATP or ADP. A plot of the recorded binding signals against time of the association and dissociation steps is shown. The insets present the calculated dissociation rate constants (koff) during the dissociation steps of the indicated samples from three independent repeats of the experiment. Bars indicate the standard deviations. Note that the dissociation rate constants are the same in presence of ATP or ADP.
Figure 5—figure supplement 2
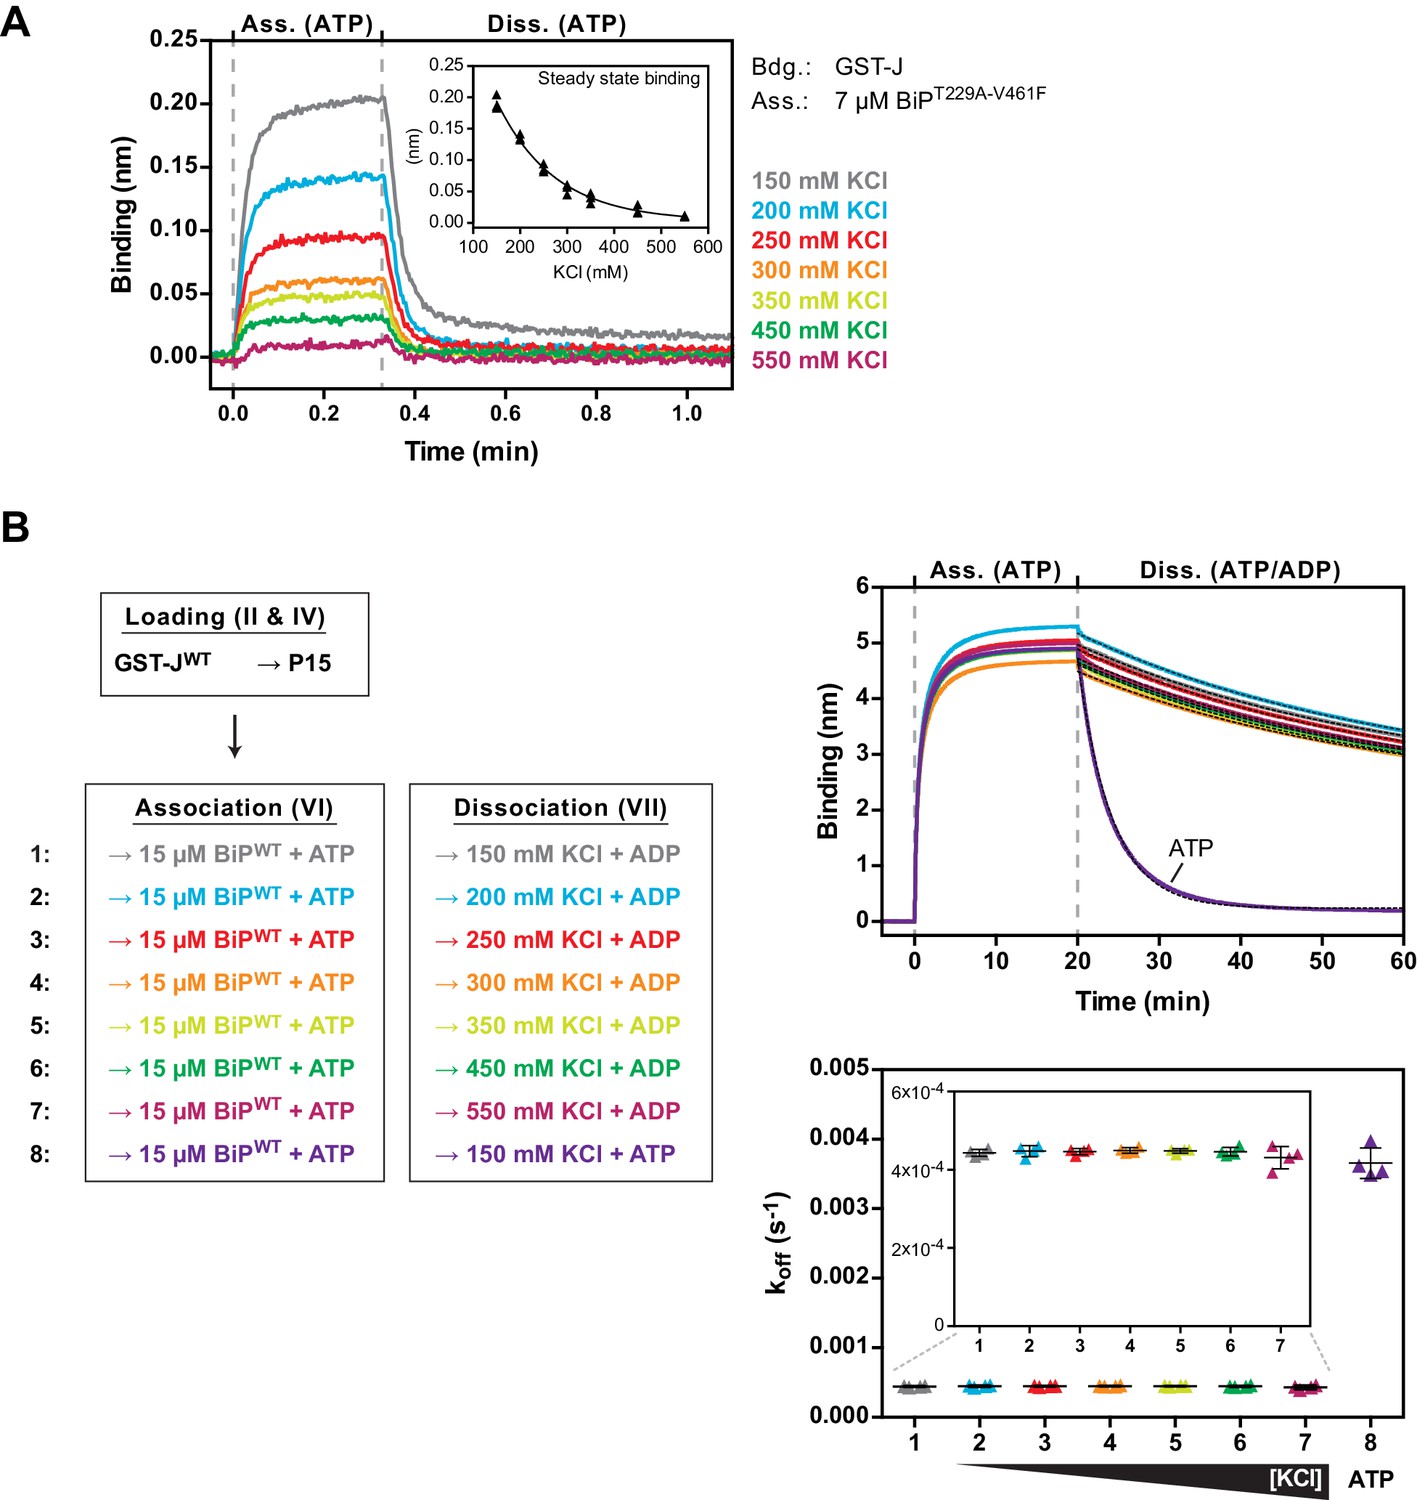
The non-substrate interaction between BiPT229A-V461F and the J-domain is sensitive to elevated salt concentrations.
(A) Bio-layer interferometry (BLI) experiment as in Figure 5 to measure the functionally relevant non-substrate interactions between an ATPase activity- and substrate binding-deficient mutant BiP protein (BiPT229A-V461F) and a wildtype model J-domain fused to GST (GST-J) in presence of increasing concentrations of salt (potassium chloride; KCl). The sensors were saturated with biotinylated GST-J and washed to a stable baseline (not shown). The sensors were then exposed to solutions containing unmodified BiPT229A-V461F in presence of the indicated salt concentrations to measure its association with the sensors. Dissociation was detected in protein-free solutions containing ATP. A plot of the binding signals against time of the association and dissociation steps is shown. The inset presents a plot of the obtained binding amplitudes against the salt concentration of three independent repeats of the experiment. The line represents a best-fit curve. Note the non-linear correlation of binding and salt concentration. (B) BLI experiment as in Figure 4C. A plot of the binding signals against time of the association and dissociation steps is shown. The sensors were loaded with biotinylated GST-J corresponding to a binding signal difference of ~0.4 nm followed by saturation with biotinylated P15 BiP substrate peptide and a baseline step. The sensors were then introduced into solution containing wildtype BiP protein until steady state binding was established. Dissociation of BiP from the sensor was measured in protein-free solutions containing ADP (or ATP as a control) and different salt concentrations as indicated. The dotted lines in the dissociation step represent single-exponential fits of the curves used to calculate the corresponding dissociation rate constants (koff) shown on the graph below. The koff values of four independent repeats are shown and bars represent standard deviations. Note that the dissociation of BiP in presence of ADP is unaffected by increasing salt concentrations.
Figure 6 with 1 supplement
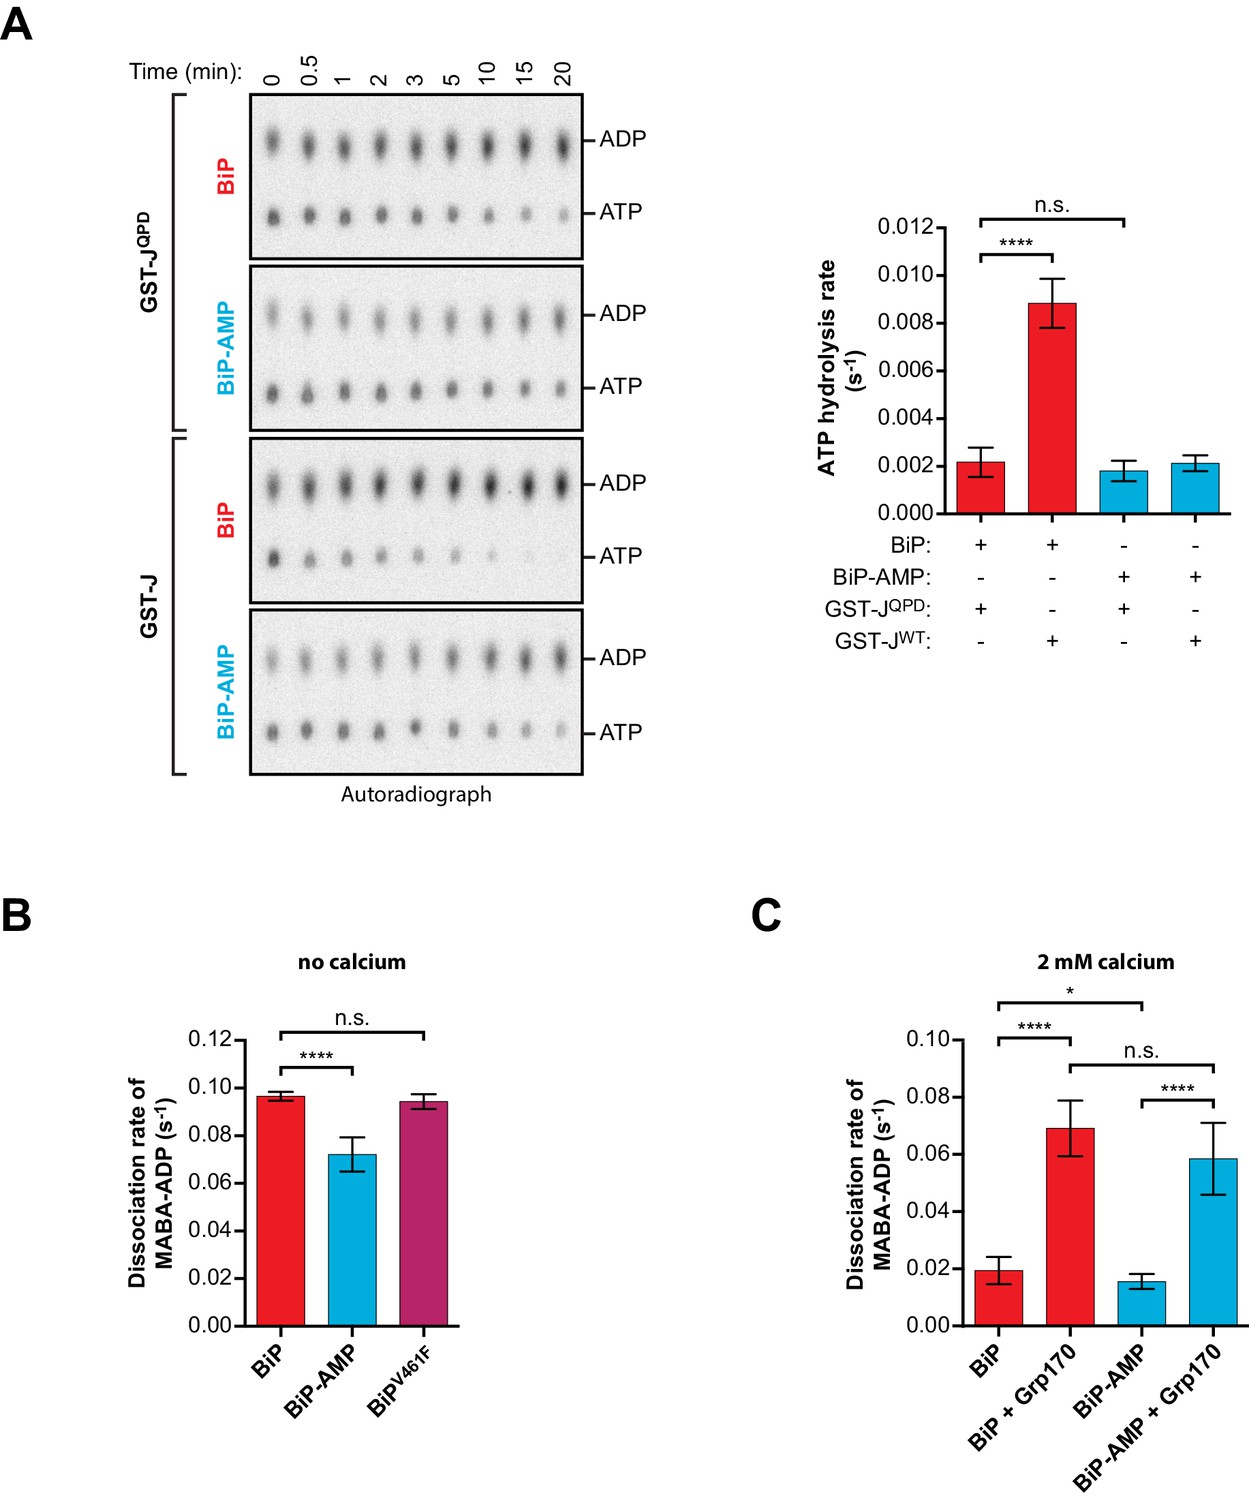
Effect of AMPylation on J domain-stimulated ATPase activity of BiP and ADP release from BiP.
(A) Shown is an autoradiograph of 32P-labeled ATP and ADP separated by thin-layer chromatography, the products of a single-turnover ATPase assay to analyze the effect of AMPylation on ATP hydrolysis by BiP. Pre-formed complexes between purified unmodified or AMPylated wildtype BiP protein and α-32P-ATP were incubated without or with wildtype GST-J or the QPD mutant for the indicated times prior analysis by thin-layer chromatography. A representative experiment is shown on the left and the signals from five repeats of the experiment were quantified and the calculated ATP hydrolysis rates are presented on the graph. Error bars represent standard deviations. ****p<0.0001, n.s. p>0.05. (B) Measurement of nucleotide release from BiP in absence of calcium. Unmodified or AMPylated wildtype or V461F mutant BiP proteins were incubated with the fluorescent ADP derivative MABA-ADP and the dissociation of the formed complexes was measured upon dilution with a solution containing excess of ATP to prevent re-binding of MABA-ADP. The dissociation rates of at least three independent repeats are shown. Error bars represent standard deviations. ****p<0.0001, n.s. p>0.05. (C) A similar experiment as in ‘B’ was performed in presence of 2 mM calcium in the solution and without or with Grp170. The dissociation rates of at least five independent repeats are shown. Error bars represent standard deviations. *p=0.0281, ****p<0.0001, n.s. p>0.05.
-
Figure 6—source data 1
Source data and calculated rates for the single-turnover ATPase assays shown in Figure 6A.
- https://doi.org/10.7554/eLife.29428.021
-
Figure 6—source data 2
Source data and calculated rates for the MABA-ADP release measurements shown in Figure 6B.
- https://doi.org/10.7554/eLife.29428.022
-
Figure 6—source data 3
Source data and calculated rates for the MABA-ADP release measurements shown in Figure 6C.
- https://doi.org/10.7554/eLife.29428.023
Figure 6—figure supplement 1
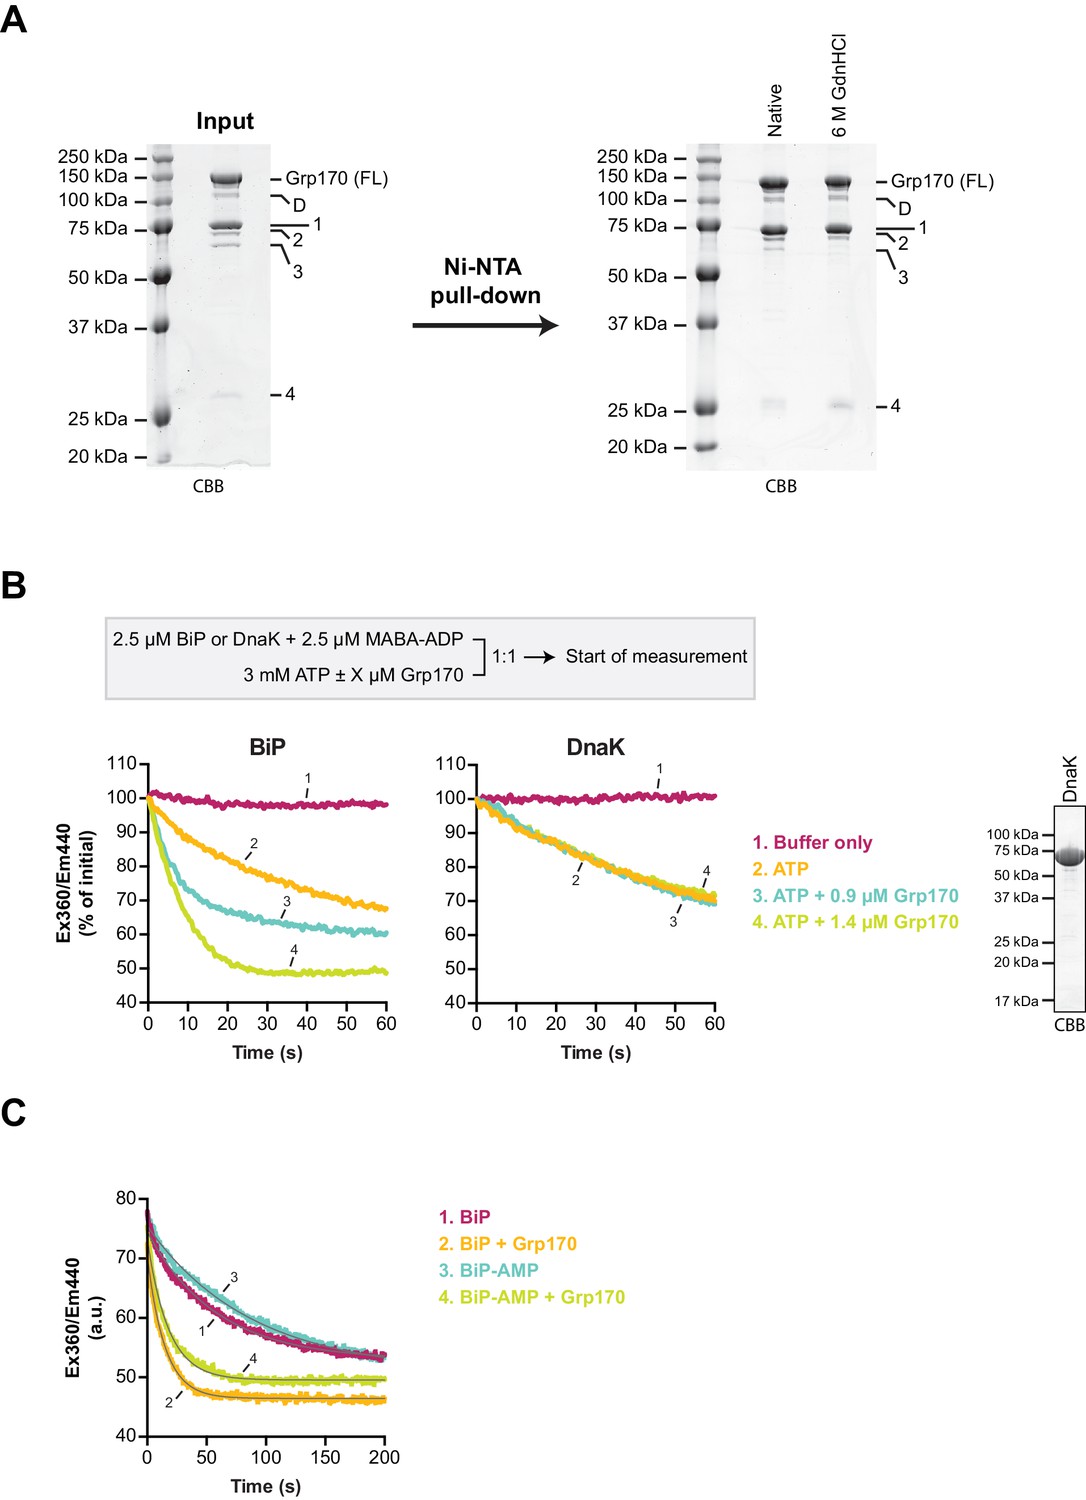
Grp170 stimulates MABA-ADP release from BiP.
(A) Coomassie (CBB)-stained SDS-PAGE gels of bacterially expressed and purified human Grp170 protein carrying an N-terminal His6-tag. A sample of the protein preparation was applied to SDS-PAGE (left) and the full-length protein (FL) as well as co-purified faster migrating species (D and 1–4) are indicated. The latter contain mainly Grp170-derived peptides as identified by mass spectrometry analysis (Supplementary file 1). A Ni-NTA affinity pull-down (right) under native conditions or upon denaturation with 6 M guanidine hydrochloride (GdnHCl) supports their identity as N-terminal proteolytic fragments of Grp170 (carrying a His6-tag) and indicates only minor contamination of the preparation with other proteins. (B) Measurement of nucleotide release from BiP or DnaK in presence of 2 mM calcium. Unmodified wildtype BiP (or DnaK) protein (2.5 µM) was incubated with the fluorescent ADP derivative MABA-ADP (at 2.5 µM) and the dissociation of the formed complexes was measured over time upon 1:1 dilution with a solution containing 3 mM ATP without or with Grp170 (at 0.9 µM or 1.4 µM) as depicted on the scheme. MABA-ADP fluorescence was detected by excitation at 360 nm and recording the emission signal at 440 nm. The Coomassie-stained SDS-PAGE gel on the right shows purified DnaK used in this assay. (C) Representative measurement of MABA-ADP release from unmodified or AMPylated BiP (BiP-AMP) as in ‘B’ upon dilution into an ATP-containing solution without or with 1.4 µM Grp170. The raw fluorescence traces were fitted to a single exponential function (grey curves) to calculate the dissociation rate constants presented in Figure 6C.
Figure 7
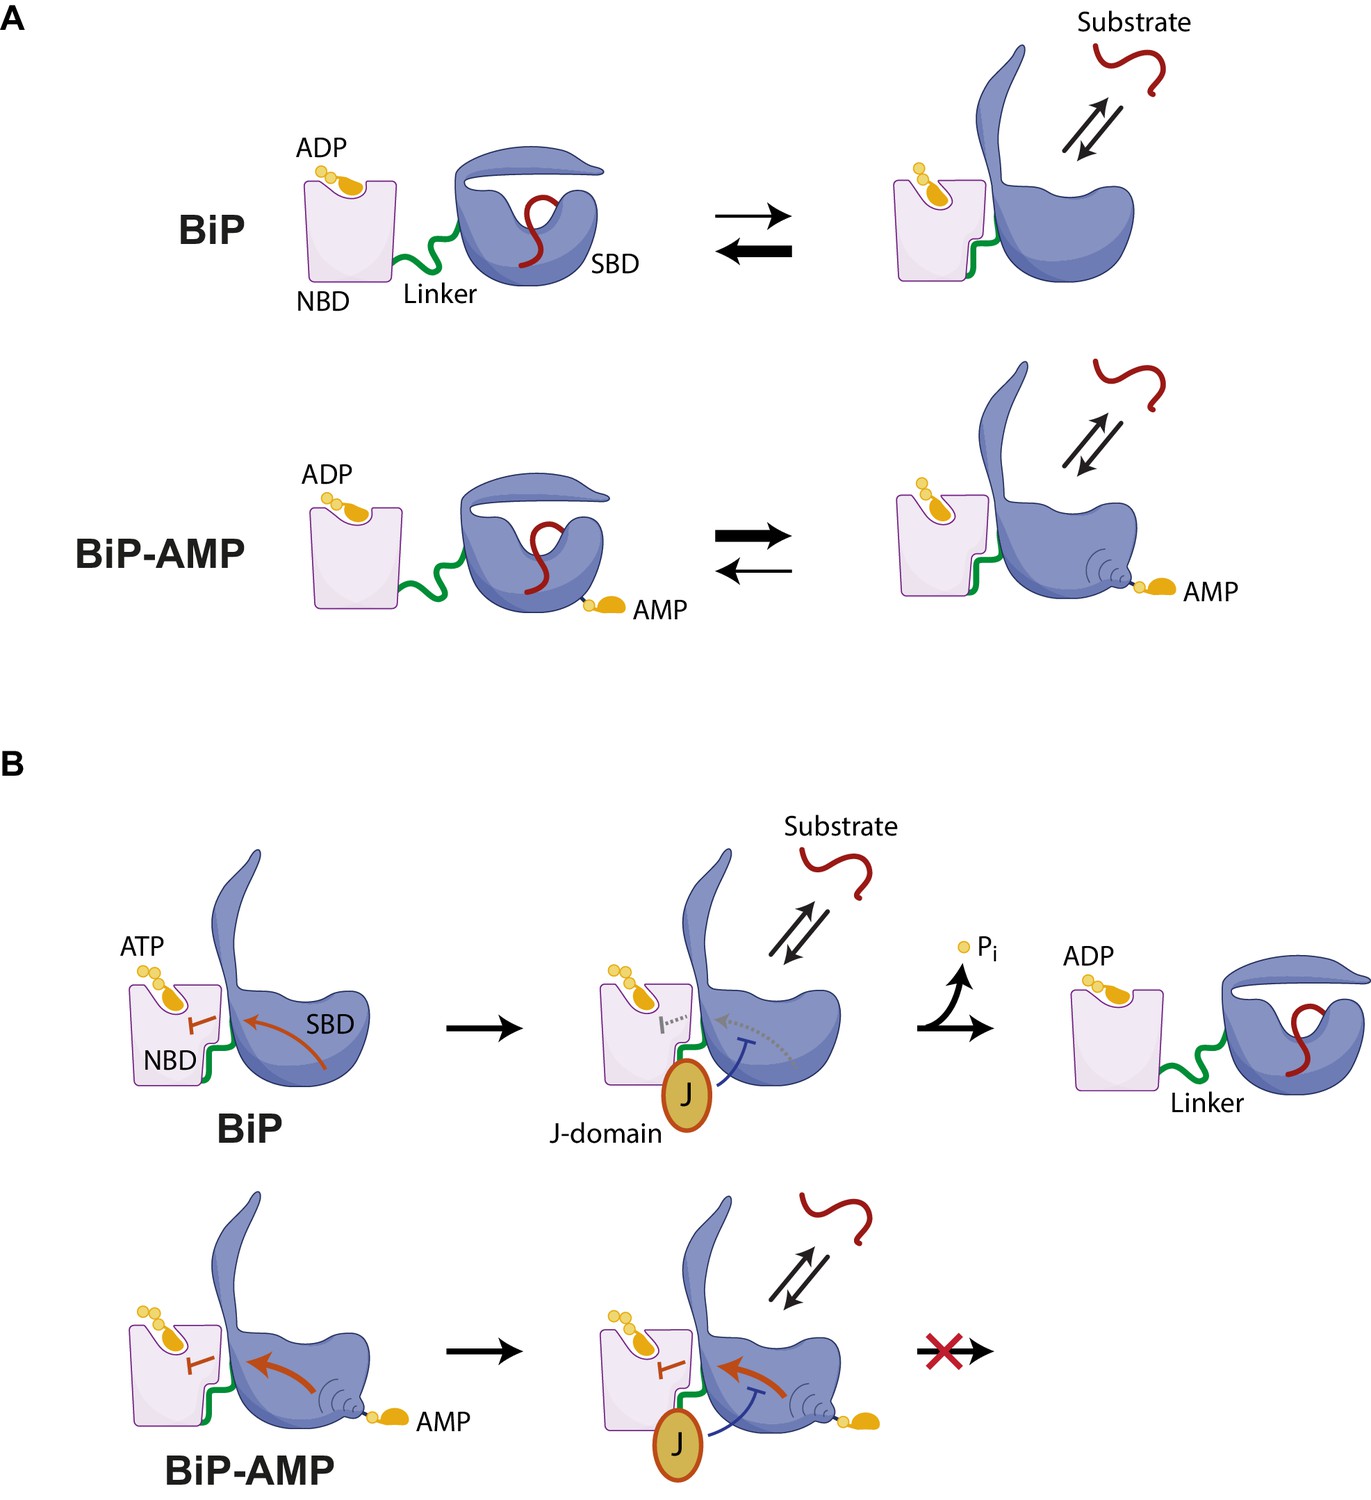
Hypothesized mechanisms by which AMPylation inactivates BiP.
(A) ADP-bound unmodified BiP is strongly biased towards a domain-undocked conformation with low substrate ‘off’ rates. AMPylation (BiP-AMP) biases the ADP-bound chaperone towards a more domain-docked state with higher substrate ‘off’ rates. As a consequence, AMPylation enfeebles BiP-client interactions. (B) The contacts formed between the docked nucleotide binding domain (NBD) and substrate binding domain (SBD) of ATP-bound BiP are proposed to inhibit its basal ATPase activity (red arrow). J-domain interaction with BiP likely weakens these inhibitory interdomain contacts favoring ATP hydrolysis (Kityk et al., 2015) and triggering complete domain undocking, exposure of the interdomain linker (green), and stable substrate binding (red). By an allosteric mechanism, AMPylation on threonine 518 further strengthens the domain-docked conformation of ATP-bound BiP, which also strengthens the ATPase-inhibitory interdomain contacts (bold red arrow). This elevates the threshold for J domain-mediated stimulation of ATPase activity.
Tables
Table 1
Data collection and refinement statistics
https://doi.org/10.7554/eLife.29428.012| AMPylated haBiP28-549 | Apo | Apo | Apo | ADP | ADP | |
|---|---|---|---|---|---|---|
| Data collection | ||||||
| Synchrotron stations (DLS) | I02 | I24 | I24 | I24 | I24 | |
| Space group | P21 | P212121 | P212121 | P212121 | P212121 | |
| Cell dimensions | ||||||
| a,b,c; (Å) | 68.33, 118.65, 83.15 | 64.65, 69.07, 122.23 | 69.088, 75.408, 98.308 | 69.089, 75.310, 98.350 | 69.05, 75.61, 97.50 | |
| α, β, γ; (⁰) | 90, 97, 90 | 90, 90, 90 | 90, 90, 90 | 90, 90, 90 | 90, 90, 90 | |
| Resolution, (Å) | 67.76–1.86 (1.91–1.86)* | 61.12–2.0 (2.05–2.00) | 75.41–1.67 (1.7–1.67) | 98.35–1.71 (1.74–1.71) | 97.5–1.59 (1.61–1.59) | |
| Rmerge | 0.089 (0.83) | 0.158 (1.31) | 0.086 (0.794) | 0.096 (1.002) | 0.131 (0.906) | |
| Rmeas | 0.122 (1.119) | 0.185 (1.532) | 0.096 (0.871) | 0.108 (1.104) | 0.145 (1.022) | |
| <I/σ (I)> | 9.6 (1.4) | 8.5 (1.5) | 12 (2.1) | 13 (2.2) | 8.8 (2.2) | |
| CC1/2 | 0.995 (0.533) | 0.995 (0.522) | 0.997 (0.888) | 0.998 (0.820) | 0.990 (0.836) | |
| Completeness, % | 99.4 (99.1) | 99.9 (100) | 98.3 (100) | 99.9 (100) | 100 (99.9) | |
| Redundancy | 3.4 (3.5) | 7.1 (7.2) | 6.6 (6.7) | 6.6 (6.7) | 6.5 (6.4) | |
| Refinement | ||||||
| Rwork | 0.195 | 0.240 | 0.210 | 0.210 | 0.200 | |
| Rfree | 0.212 | 0.280 | 0.250 | 0.250 | 0.220 | |
| No. of reflections | 104104 | 35827 | 56476 | 53637 | 66447 | |
| No. of atoms | 8750 | 3994 | 4281 | 4245 | 4156 | |
| Average B-factors | 24.9 | 35.7 | 23.14 | 23.3 | 30.09 | |
| RMS deviations | ||||||
| Bond lengths (Å) | 0.007 | 0.007 | 0.007 | 0.009 | 0.008 | |
| Bond angles, (⁰) | 1.261 | 1.151 | 1.184 | 1.485 | 1.332 | |
| Ramachandran favoured region, % | 99 | 97.49 | 98.05 | 98.44 | 99.03 | |
| Ramachandran outliers, % | 0.19 | 0 | 0 | 0 | 0 | |
| MolProbity score (percentile†) | 0.67 (100%) | 0.83 (100%) | 0.67 (100%) | 0.78 (100%) | 0.74 (100%) | |
| PDB code | 5O4P | 6EOB | 6EOC | 6EOE | 6EOF |
-
* Values in parentheses are for the highest-resolution shell.
† 100th percentile is the best among structures of comparable resolution.
Additional files
-
Supplementary file 1
Mass spectrometry analysis of the Grp170 protein preparation.
Bands of full-length Grp170 protein and faster migrating species were cut out of a Coomassie-stained SDS-PAGE gel and analyzed by LC-MS/MS after in-gel digest with trypsin. The identified peptides for the bands indicated in Figure 6—figure supplement 1A are presented.
- https://doi.org/10.7554/eLife.29428.025
-
Supplementary file 2
Plasmids used in this study.
The table lists the plasmids used in this study including references (as PMIDs).
- https://doi.org/10.7554/eLife.29428.026
-
Transparent reporting form
- https://doi.org/10.7554/eLife.29428.027
Download links
A two-part list of links to download the article, or parts of the article, in various formats.
Downloads (link to download the article as PDF)
Open citations (links to open the citations from this article in various online reference manager services)
Cite this article (links to download the citations from this article in formats compatible with various reference manager tools)
AMPylation targets the rate-limiting step of BiP’s ATPase cycle for its functional inactivation
eLife 6:e29428.
https://doi.org/10.7554/eLife.29428


