Sumoylation promotes optimal APC/C activation and timely anaphase
- Johns Hopkins University, United States
- University of Texas Southwestern Medical Center, United States
Figures
Figure 1 with 4 supplements
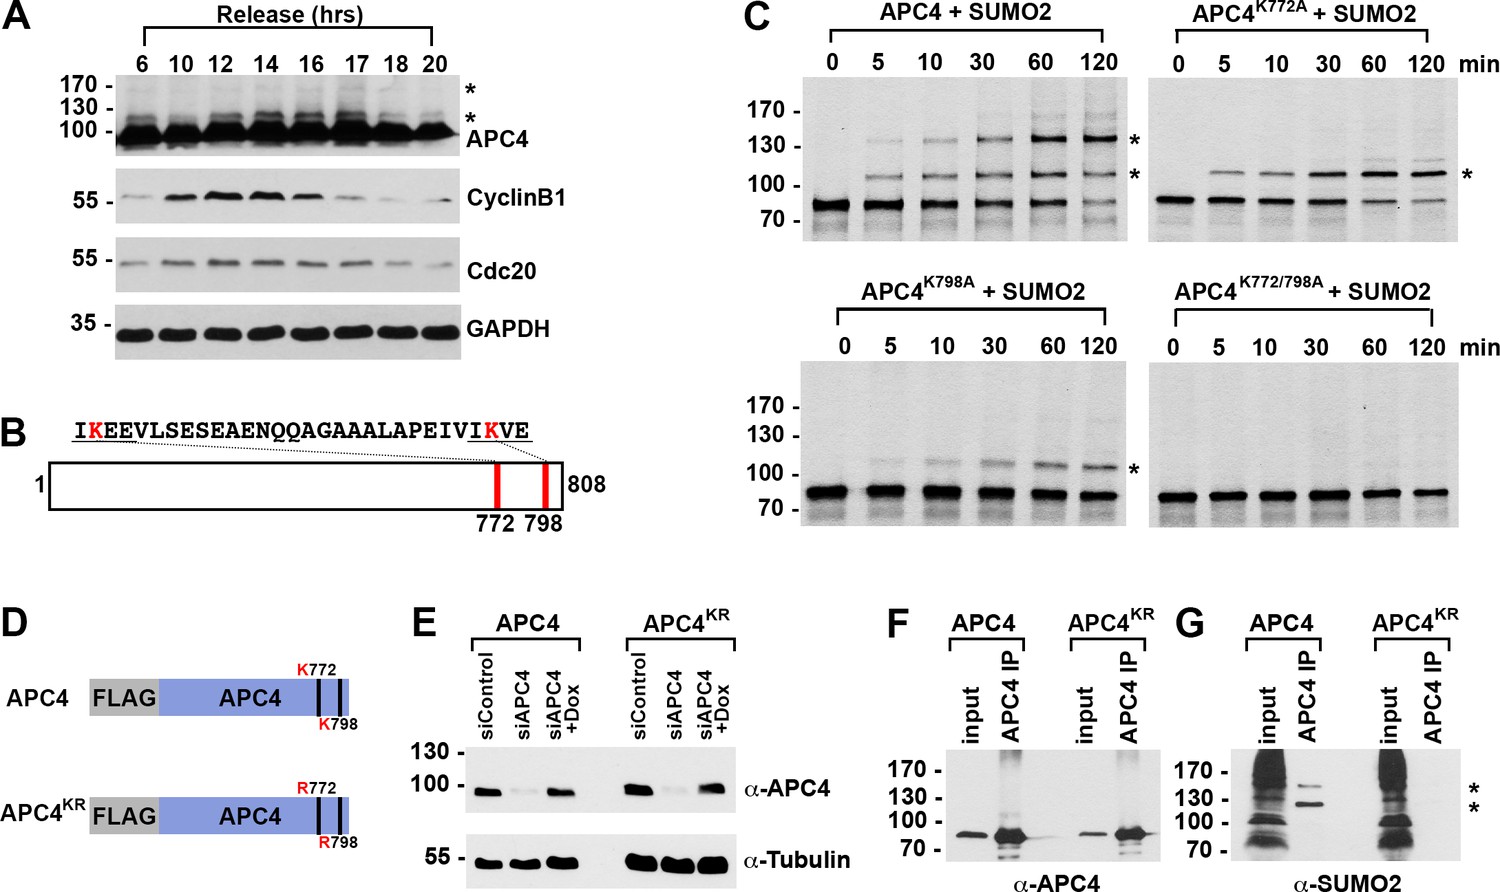
APC4 is sumoylated in a cell-cycle-dependent manner at two C-terminal lysines.
(A) HeLa cells were synchronized in S-phase using a double-thymidine arrest and released for varying time points. Whole cell lysates were analyzed by immunoblotting for APC4, Cyclin B1, Cdc20, and glyceraldehyde 3-phosphate dehydrogenase (GAPDH) as a loading control. Asterisks indicate sumoylated forms of APC4. (B) APC4 contains two C-terminal SUMO consensus site lysines at 772 and 798. (C) Full-length wild-type APC4 or the indicated lysine to alanine substitution mutants were expressed in rabbit reticulocyte lysate in the presence of [35S]-methionine and incubated for the indicated times in modification reactions containing SUMO E1 and E2 enzymes and SUMO2. Proteins were detected by SDS-PAGE and autoradiography. Asterisks indicate sumoylated forms of APC4. (D) Constructs coding for FLAG-tagged versions of wild type APC4 or a sumoylation-deficient mutant containing arginine substitutions at lysines 772 and 798 (APC4KR) were used to generate stable inducible cell lines in YFP-H2B HeLa cells. (E) Endogenous APC4 was depleted by siRNA, and FLAG-APC4 or FLAG-APC4KR stable cell lines were induced by doxycycline for 48 hr. Immunoblot analysis using APC4 and tubulin-specific antibodies reveals that FLAG-APC4 and FLAG-APC4KR are expressed at near endogenous levels. (F–G) Co-immunoprecipitations were performed with an antibody against APC4, followed by immunoblotting for APC4 or SUMO2. FLAG-APC4 is sumoylated in vivo while FLAG-APC4KR is not. Asterisks indicate sumoylated APC4.
Figure 1—figure supplement 1
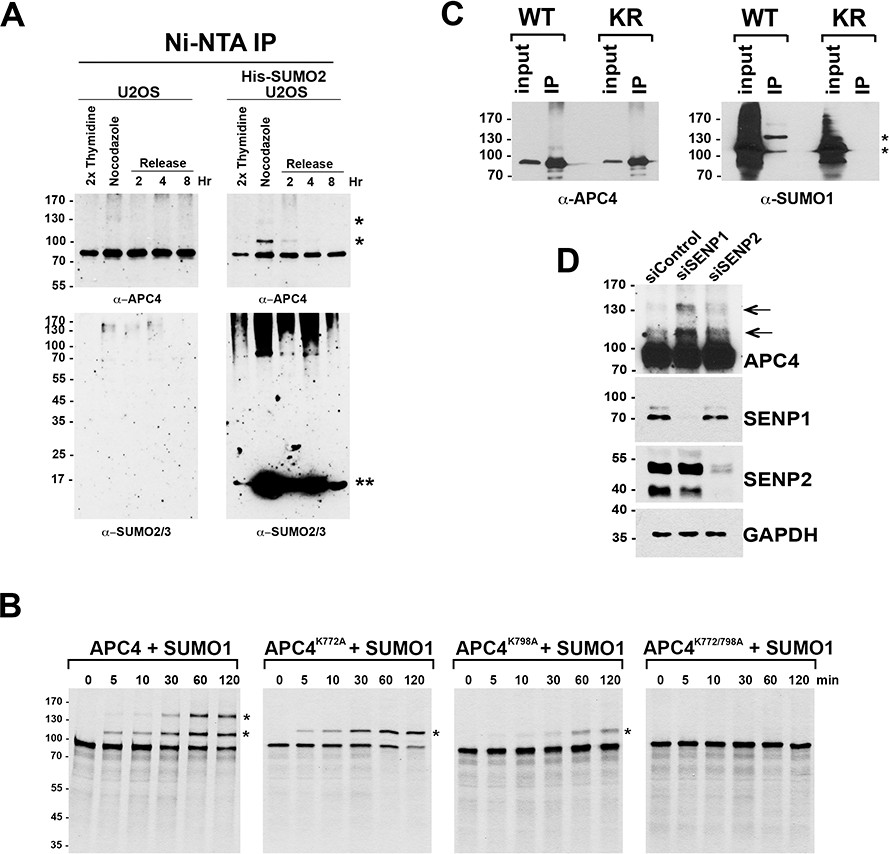
APC4 is sumoylated at two C-terminal lysine residues in mitosis; APC4 sumoylation is regulated by SENP1.
(A) U2OS or 6xHis-SUMO2 U2OS cells were synchronized in different stages of the cell cycle. SUMO2-modified proteins were purified by Ni-NTA agarose chromatography and analyzed by SDS-PAGE and immunoblotting with antibodies against APC4 or SUMO2/3. Single asterisks (*) indicates SUMO modified forms of APC4. A double asterisk (**) indicates unconjugated 6xHis-SUMO2. (B) Wild type and mutant APC4 proteins were expressed in rabbit reticulocyte lysate in the presence of [35S]-methionine and incubated for the indicated times in modification reactions containing SUMO E1 and E2 enzymes and SUMO1. Reactions were analyzed by SDS-PAGE and autoradiography. Asterisks (*) indicate sumoylated forms of APC4. (C) Endogenous APC4 was depleted by siRNA, and APC4 WT or APC4KR were induced by doxycycline for 48 hr. Immunoprecipitations were performed with an antibody against APC4, followed by immunoblotting for APC4 or SUMO1. Asterisks indicate sumoylated APC4. (D) HeLa cells were transfected with control, SENP1 or SENP2 specific siRNAs. 36 hr following transfection, cells were treated with 2 mM thymidine for 19 hr, released into nocodazole or 6 hr, followed by treatment with MG132 for 2 hr to synchronize cells in metaphase. Whole cell lysates were immunoblotted with antibodies specific for APC4, SENP1, SENP2, and GAPDH. Arrows indicate sumoylated APC4.
Figure 1—video 1
Movie of YFP-H2B (green) HeLa cells treated for 48 hr with a control siRNA.
Images were analyzed by timelpase microscopy using a Zeiss Observer Z1 fluorescence microscope. One frame captured every 5 min displayed at 2 frames/s.
Figure 1—video 2
Movie of YFP-H2B (green) HeLa cells treated for 48 hr with siAPC4.
Images were analyzed by timelpase microscopy using a Zeiss Observer Z1 fluorescence microscope. One frame captured every 5 min displayed at 2 frames/s.
Figure 1—video 3
Movie of FLAG-APC4 WT cells treated for 48 hr with siAPC4 and APC4 WT induction with doxycycline.
YFP-H2B (green). Images were analyzed by timelpase microscopy using a Zeiss Observer Z1 fluorescence microscope. One frame captured every 5 min displayed at 2 frames/s.
Figure 2 with 4 supplements
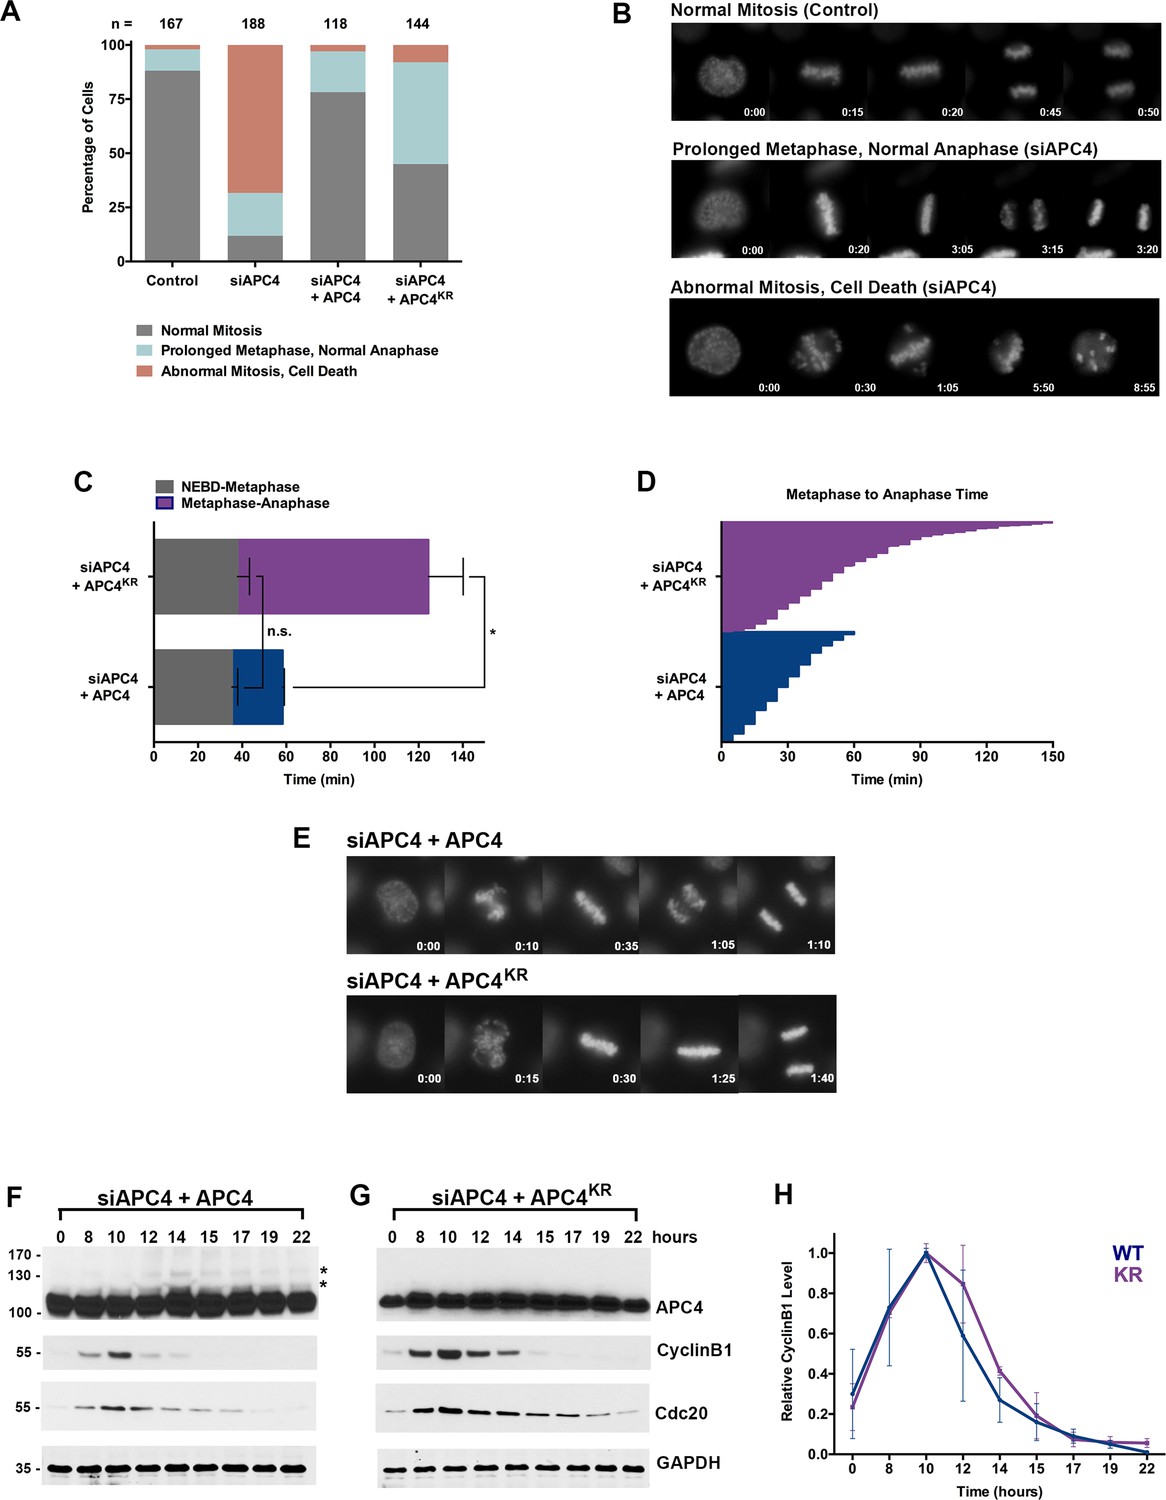
APC4 sumoylation is required for timely metaphase-anaphase transition.
(A) Cells were transfected with control or APC4-specific siRNAs for 48 hr followed by 16 hr of timelapse live cell acquisition. siAPC4 transfected cells were also induced to express FLAG-APC4 or FLAG-APC4KR. Analysis represents mitotic progression time beginning with nuclear envelope breakdown (NEBD) to anaphase onset. Quantification of mitotic phenotypes is shown. Prolonged metaphase is defined by >60 min in metaphase plate alignment before anaphase onset. Abnormal metaphase is defined by inability to generate a metaphase plate and defects in chromosomal cohesion. n > 100 for each cell line. (B) Cells representative of each mitotic phenotype categorized in (A) are featured with timestamps in minutes. (C) Mitotic progression beginning with NEBD to metaphase plate alignment and from metaphase plate alignment to anaphase onset was quantified in FLAG-APC4 and FLAG-APC4KR expressing cells. Experiments were performed in triplicate; means are displayed and error bars represent standard deviations. n = 50 for each cell line. Two-tailed t-tests were used to calculate significance: p=0.38 for differences in FLAG-APC4 and FLAG-APC4KR timing from NEBD-metaphase, p<0.001 for differences in FLAG-APC4 and FLAG-APC4KR timing from metaphase plate alignment to anaphase. (D) Individual timing of metaphase-anaphase progression is displayed for FLAG-APC4 and FLAG-APC4KR expressing cells. n = 215 for each cell line. (E) Representative cells from timelapse acquisition beginning with NEBD to anaphase onset in FLAG-APC4 and FLAG-APC4KR expressing cells with timestamps indicated in minutes. (F) FLAG-APC4 and (G) FLAG-APC4KR expressing cells were synchronized in S-phase using a double-thymidine block and released for various time points. Whole cell lysates were analyzed by immunoblotting for APC4, Cyclin B1, Cdc20 and GAPDH as a loading control. Asterisks (*) indicate sumoylated forms of APC4. (H) Relative protein levels of Cyclin B1 in FLAG-APC4 and FLAG-APC4KR cells were quantitated using ImageJ. Normalized mean values are graphed with standard deviations from three separate experiments.
Figure 2—figure supplement 1
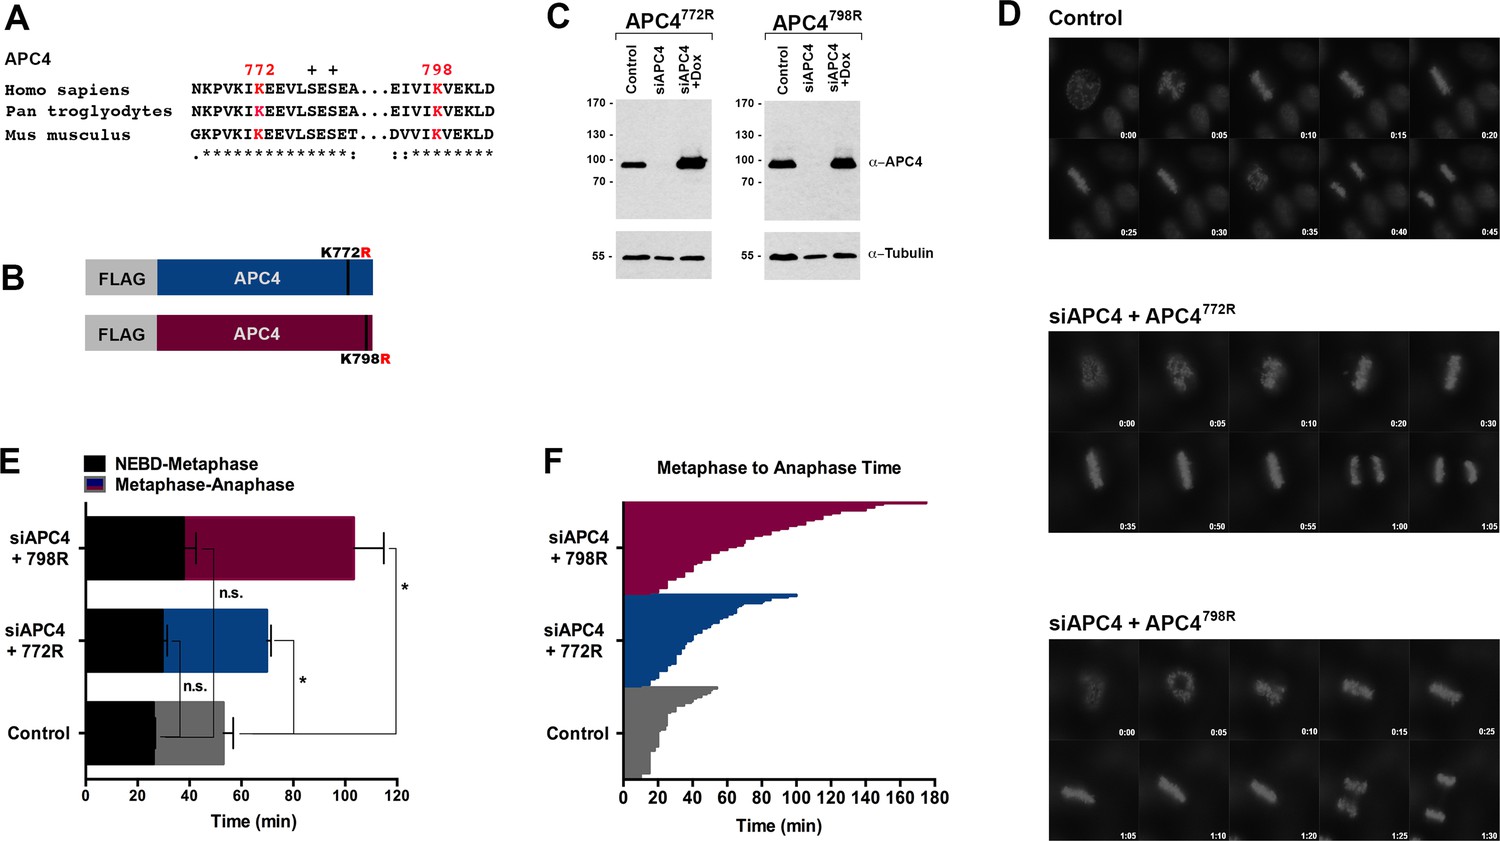
Analysis of single SUMO consensus site APC4 mutants.
(A) Sequence alignments of full-length, mammalian APC4. Phosphorylation sites are indicated by ‘+”, identical residues by ‘*”, conservative substitutions by ‘:”, and non-conservative substitutions by ‘.”. (B) Constructs coding for FLAG-tagged versions of APC4 sumoylation-deficient mutants containing arginine substitutions at lysines 772 or 798 (APC4772R/APC4798R) were used to generate stable inducible cell lines in YFP-H2B HeLa cells. (C) Endogenous APC4 was depleted by siRNA, and FLAG-APC4772R or FLAG-APC4798R stable cell lines were induced by doxycycline for 48 hr. Immunoblot analysis using APC4 and tubulin-specific antibodies reveals that FLAG-APC4772R and FLAG-APC4798R are expressed at near endogenous levels. (D) Cells were transfected with control or APC4-specific siRNAs for 48 hr followed by 16 hr of timelapse live cell acquisition. Representative cells are featured with timestamps in minutes. (E) Mitotic progression beginning with NEBD to metaphase plate alignment and from metaphase plate alignment to anaphase onset was quantified in FLAG-APC4772R and FLAG-APC4798R expressing cells. Experiments were performed in triplicate; means are displayed and error bars represent standard deviations. n > 100 for each cell line. Two-tailed t-tests were used to calculate significance: p=0.1551 for differences in Control vs. and FLAG-APC4772R timing from NEBD-metaphase, p=0.0724 for differences in Control vs. FLAG-APC4798R timing from NEBD-metaphase; p=0.0306 for differences in Control vs. FLAG-APC4772R and p=0.0338 for differences in FLAG-APC4798R timing from metaphase plate alignment to anaphase, respectively. (D) Individual timing of metaphase to anaphase progression are displayed for FLAG-APC4 772R and FLAG-APC4798R expressing cells. n = 67 for each cell line.
Figure 2—video 1
Movie of FLAG-APC4KR cells treated for 48 hr with siAPC4 and APC4 KR induction with doxycycline.
YFP-H2B (green). Images were analyzed by timelpase microscopy using a Zeiss Observer Z1 fluorescence microscope. One frame captured every 5 min displayed at 2 frames/s.
Figure 2—video 2
Movie of FLAG-APC4K772R cells treated for 48 hr with siAPC4 and APC4K772R induction with doxycycline.
YFP-H2B (green). Images were analyzed by timelpase microscopy using a Zeiss Observer Z1 fluorescence microscope. One frame captured every 5 min displayed at 7 frames/s.
Figure 2—video 3
Movie of FLAG-APC4K798R cells treated for 48 hr with siAPC4 and APC4K798R induction with doxycycline.
YFP-H2B (green). Images were analyzed by timelpase microscopy using a Zeiss Observer Z1 fluorescence microscope. One frame captured every 5 min displayed at 7 frames/s.
Figure 3 with 1 supplement
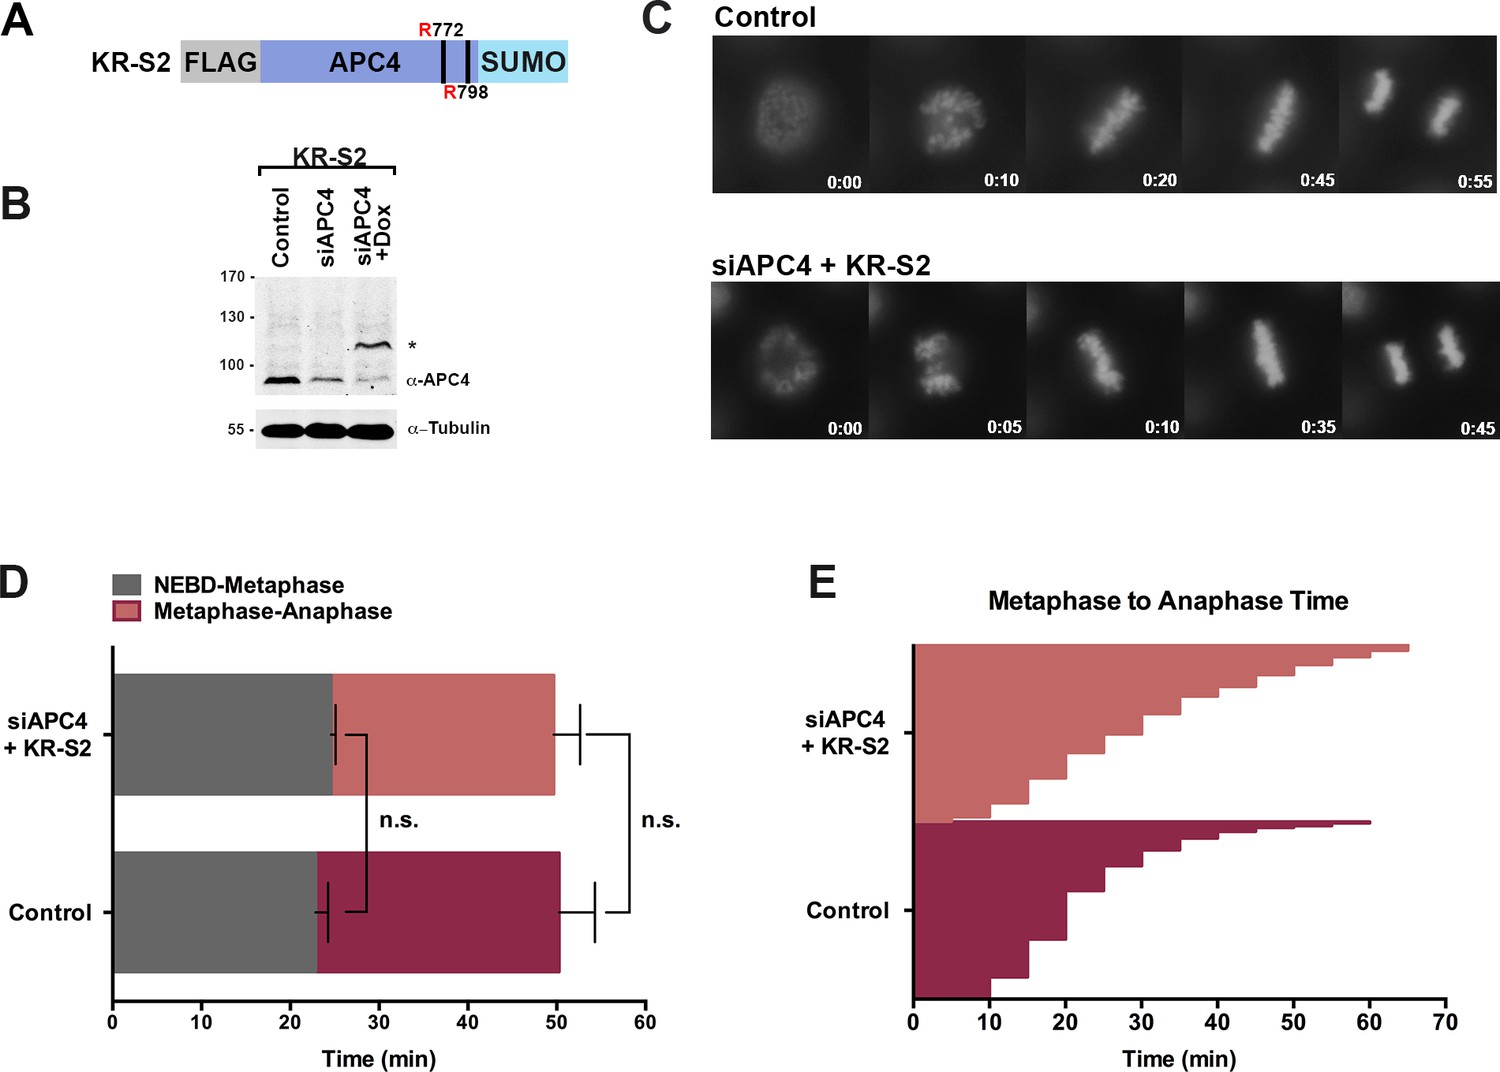
APC4KR-SUMO rescues APC4KR metaphase-anaphase delay.
(A) A construct coding for a FLAG-tagged APC4KR-SUMO2 fusion protein (APC4KR-S2) was used to generate stable inducible lines in YFP-H2B HeLa cells. (B) Cells were transfected with control or APC4-targeting siRNAs and cultured in the presence (+Dox) or absence of doxycycline. Endogenous APC4 and FLAG-APC4KR-S2 expression levels were analyzed by immunoblot analysis with APC4 and tubulin specific antibodies. (C) Representative cells from timelapse acquisition beginning with NEBD to anaphase onset in control and FLAG-APC4KR-S2 expressing cells with timestamps indicated in minutes. (D) Mitotic timing beginning with NEBD to metaphase plate alignment and from metaphase plate alignment to anaphase onset was quantified in control and FLAG-APC4KR-S2-expressing cells. Experiments were performed in triplicate; means are displayed and error bars represent standard deviations. n = 60 for each cell line. Two-tailed t-tests were used to calculate significance: p=0.16 between control and FLAG-APC4KR-S2 timing from NEBD-metaphase, p=0.35 for control and FLAG-APC4KR-S2 timing from metaphase plate alignment to anaphase. (E) Individual metaphase to anaphase transition times are displayed for control and FLAG-APC4KR-S2-expressing cells. n = 314 for each cell line.
Figure 3—video 1
Movie of FLAG-APC4KR-S2 cells treated for 48 hr with siAPC4 and APC4KR-S2 induction with doxycycline.
YFP-H2B (green). Images were analyzed by timelpase microscopy using a Zeiss Observer Z1 fluorescence microscope. One frame captured every 5 min displayed at 2 frames/s.
Figure 4 with 4 supplements
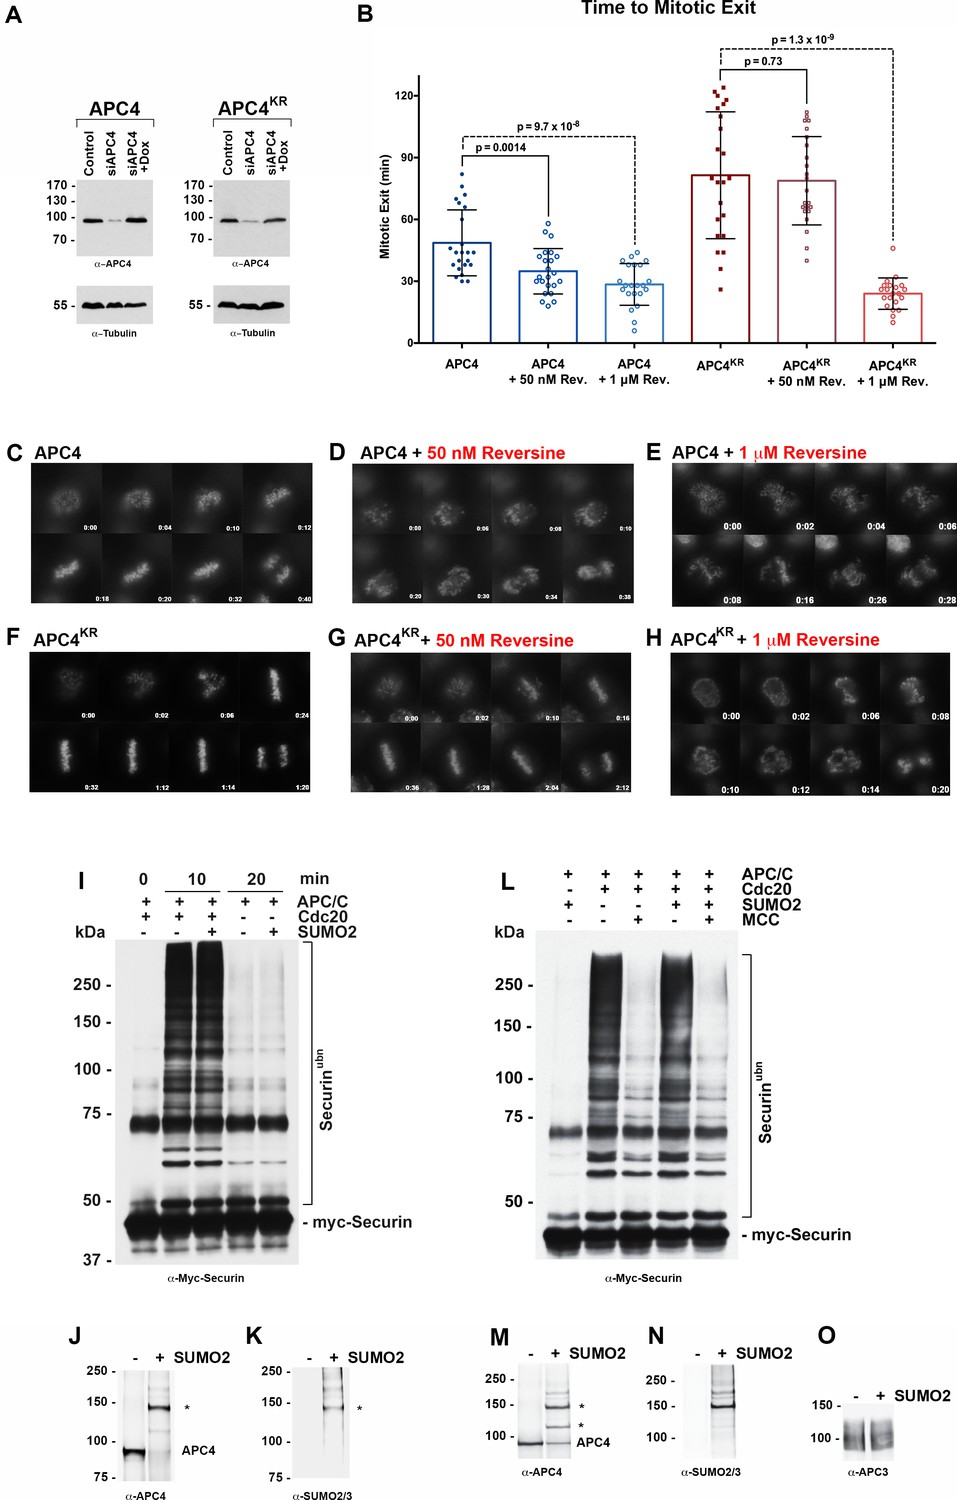
APC4 sumoylation indirectly affects APC/C activity and functions through the SAC.
(A) Endogenous APC4 was depleted by siRNA, and FLAG-APC4 or FLAG-APC4KR stable cell lines were induced by doxycycline for 48 hr. Immunoblot analysis using APC4 and tubulin-specific antibodies reveals that FLAG-APC4 and FLAG-APC4KR are expressed at near endogenous levels. (B) Cells were treated with reversine immediately prior to 4 hr timelapse acquisition, and timing from NEBD to anaphase onset (mitotic exit timing) was collected. Data is representative of four independent experiments, n = 23 for each cell line. On average, FLAG-APC4 cells take 48.65 min to mitotic exit (Standard Deviation = SD = 15.99) while reversine treated FLAG-APC4 cells take 34.87 min (SD = 11.00). This difference is significant (p=0.0014). FLAG-APC4KR cells take 81.48 min to mitotic exit (SD = 30.78) while reversine treated FLAG-APC4KR cells take 78.78 min (SD = 21.41). This difference is not statistically significant (p=0.73). Two-tailed t-tests were used to calculate significance. (C–H) Representative cells from timelapse acquisition beginning with NEBD to anaphase onset in cells with or without 50 nM or 1 μM reversine are shown with timestamps indicated in minutes. (I) Activity assays using unmodified or in vitro sumoylated APC/C was performed with recombinant myc-Securin substrate, in the presence or absence of recombinant co-activator Cdc20. (J–K) Immunoblots of immunopurified APC/C using antibodies specific for APC4 and SUMO2/3 with SUMO modification of APC/C complex indicated with ‘*”. (L) Activity assays using unmodified or in vitro sumoylated APC/C was performed with recombinant myc-Securin substrate, in the presence or absence of recombinant co-activator Cdc20 and inhibitory MCC complex as indicated. (M–O) Immunoblots of immunopurified APC/C using antibodies specific for APC4, APC3 and SUMO2/3, with SUMO modification of APC/C complex indicated with ‘*”.
Figure 4—video 1
Movie of Flag-APC4 WT cells treated for 48 hr with siAPC4 and APC4 WT induction with doxycycline.
50 nM Reversine was added immediately prior to timelapse imaging. Images were analyzed by timelpase microscopy using a Zeiss Observer Z1 fluorescence microscope. One frame captured every 2 min displayed at 7 frames/s.
Figure 4—video 2
Movie of Flag-APC4 WT cells treated for 48 hr with siAPC4 and APC4 WT induction with doxycycline.
1 μM Reversine was added immediatley prior to timelapse imaging. Images were analyzed by timelpase microscopy using a Zeiss Observer Z1 fluorescence microscope. One frame captured every 2 min displayed at 7 frames/s.
Figure 4—video 3
Movie of Flag-APC4KR cells treated for 48 hr with siAPC4 and APC4KR induction with doxycycline.
50 nM Reversine was added immediately prior to timelapse imaging. Images were analyzed by timelpase microscopy using a Zeiss Observer Z1 fluorescence microscope. One frame captured every 2 min displayed at 7 frames/s.
Figure 4—video 4
Movie of Flag-APC4KR cells treated for 48 hr with siAPC4 and APC4KR induction with doxycycline.
1 μM Reversine was added immediately prior to timelapse imaging. Images were analyzed by timelpase microscopy using a Zeiss Observer Z1 fluorescence microscope. One frame captured every 1 min displayed at 2 frames/s.
Figure 5
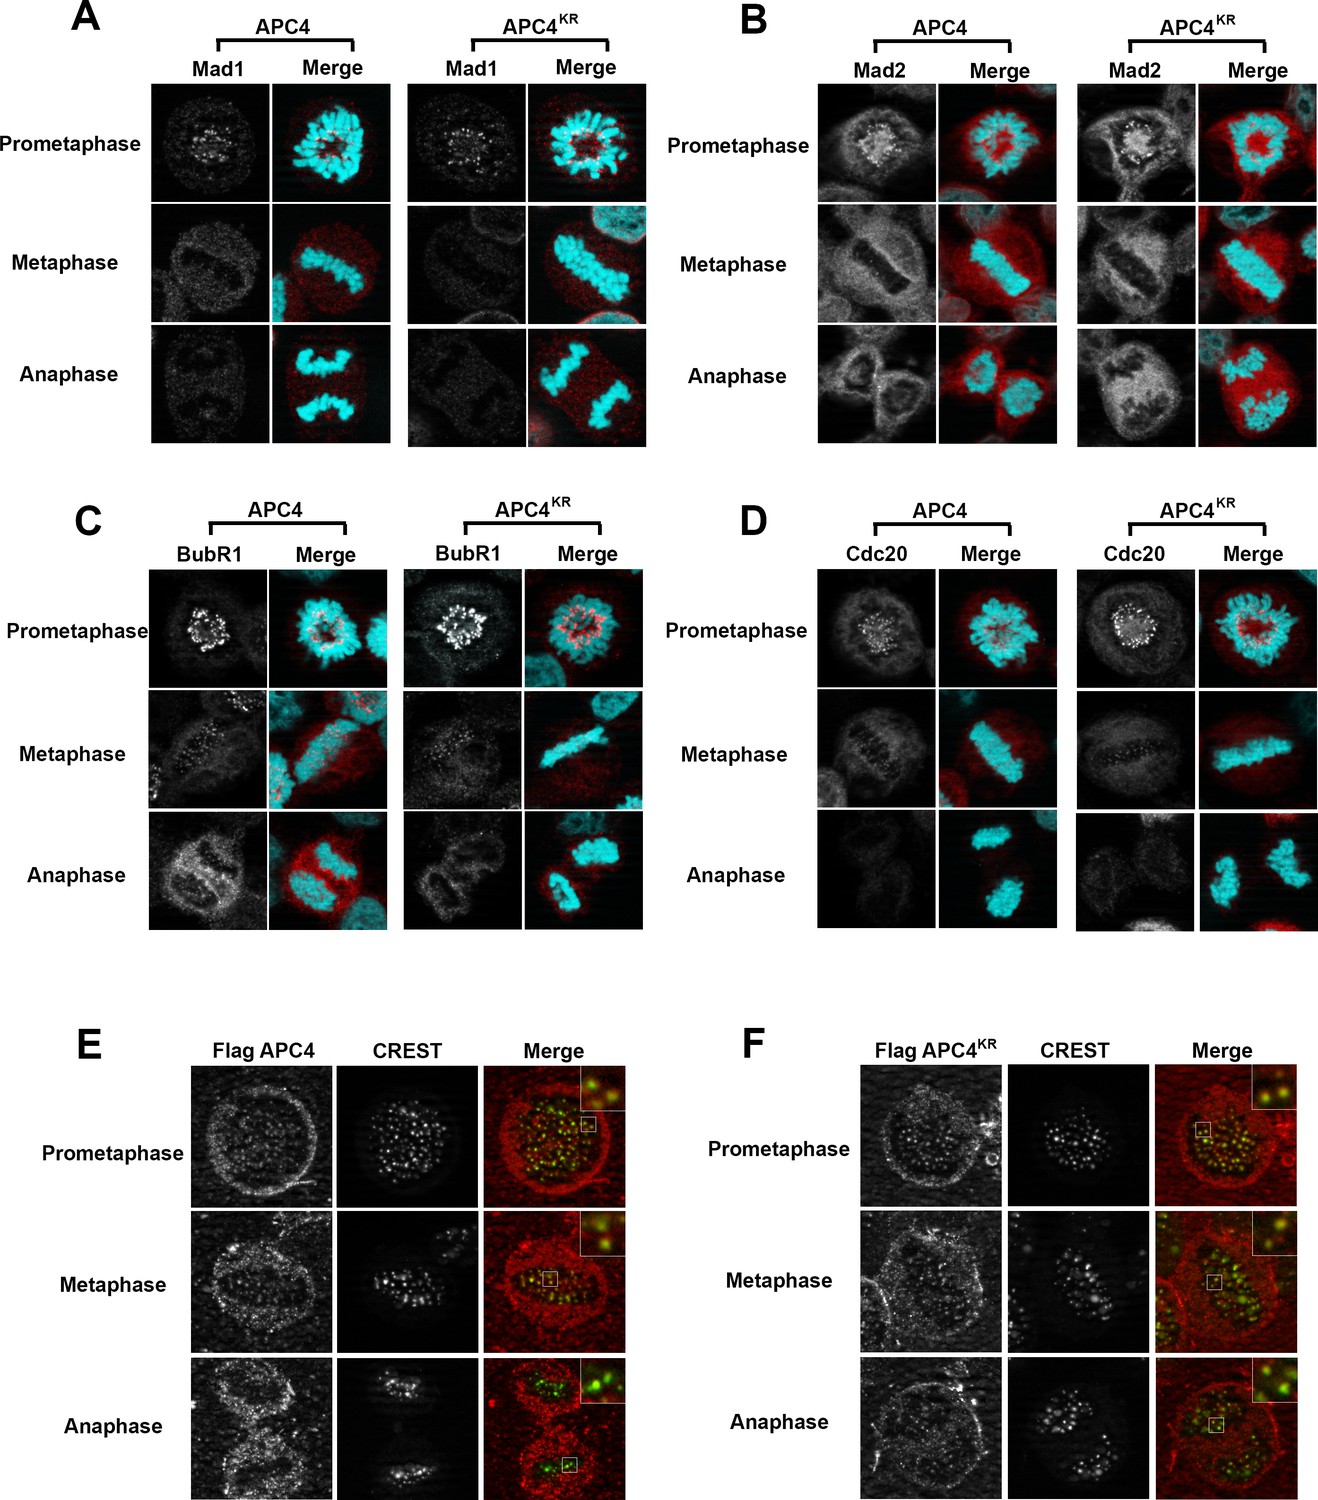
APC4 sumoylation does not affect association of APC/C or SAC proteins with kinetochores.
Stable inducible cell lines were depleted of endogenous APC4 using siRNA for 48 hr with concomitant induction of FLAG-APC4 or FLAG-APC4KR expression and stained with antibodies specific to (A) Mad1, (B) Mad2, (C) BubR1, and (D) Cdc20. Chromatin (colored in teal) was visualized by detection of YFP-H2B expressed in these cell lines. (E and F) Inducible cell lines were treated as described above. Cells were stained with FLAG and CREST-specific antibodies and analyzed by immunofluorescence microscopy. Boxed regions are magnified to show co-localization at kinetochores during prometaphase and metaphase.
Figure 6 with 1 supplement
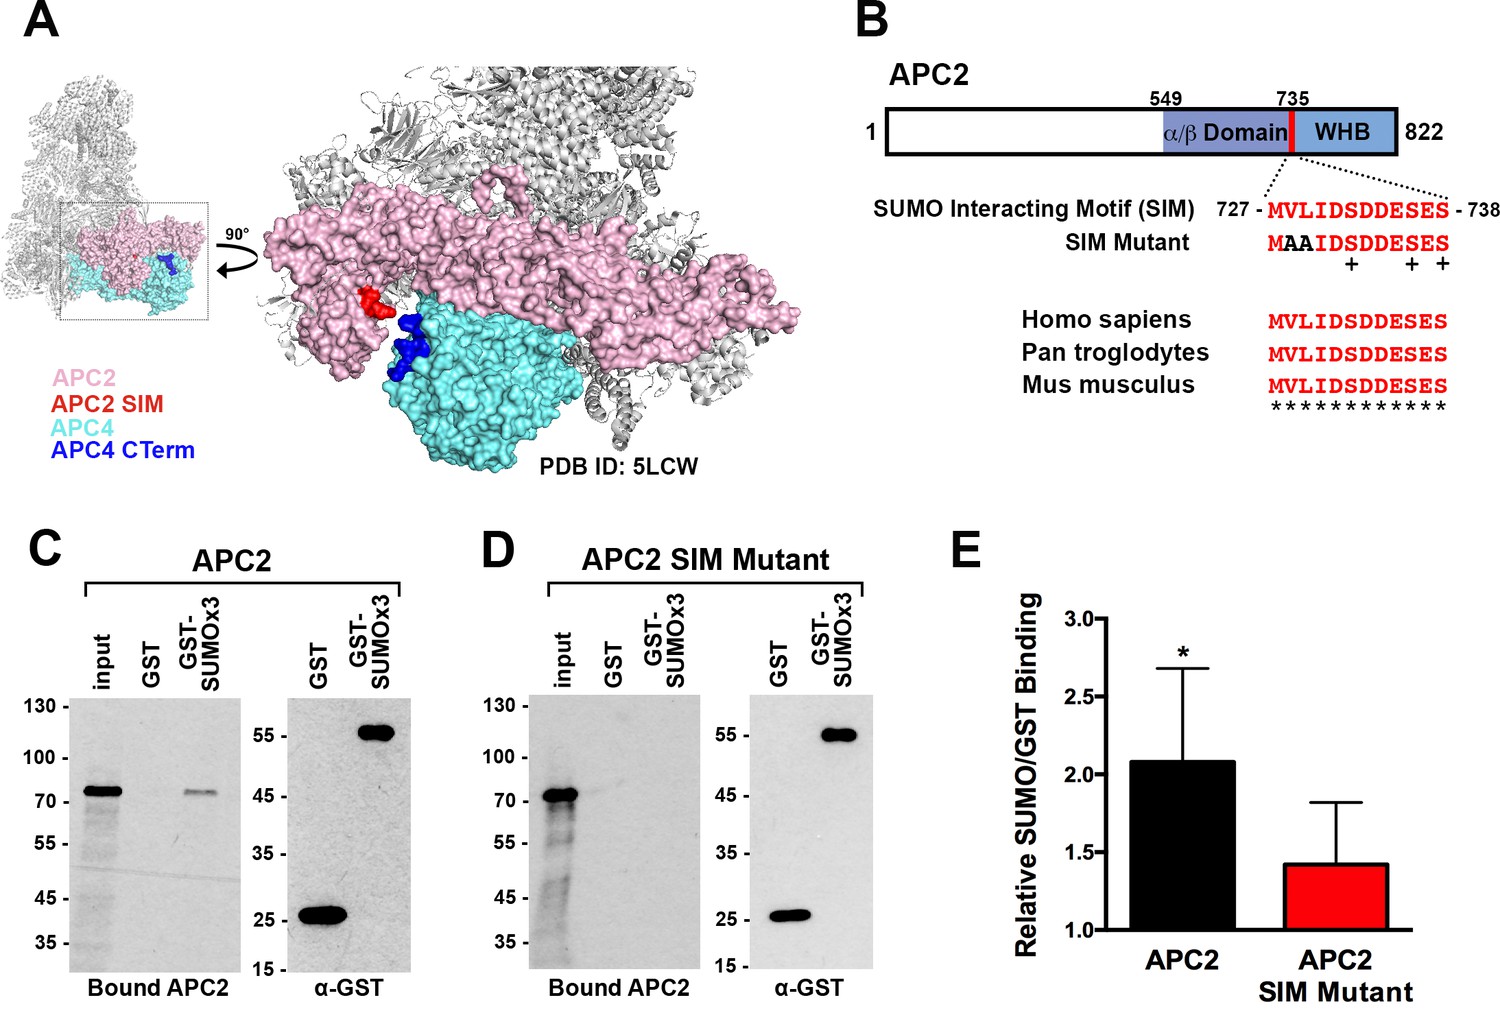
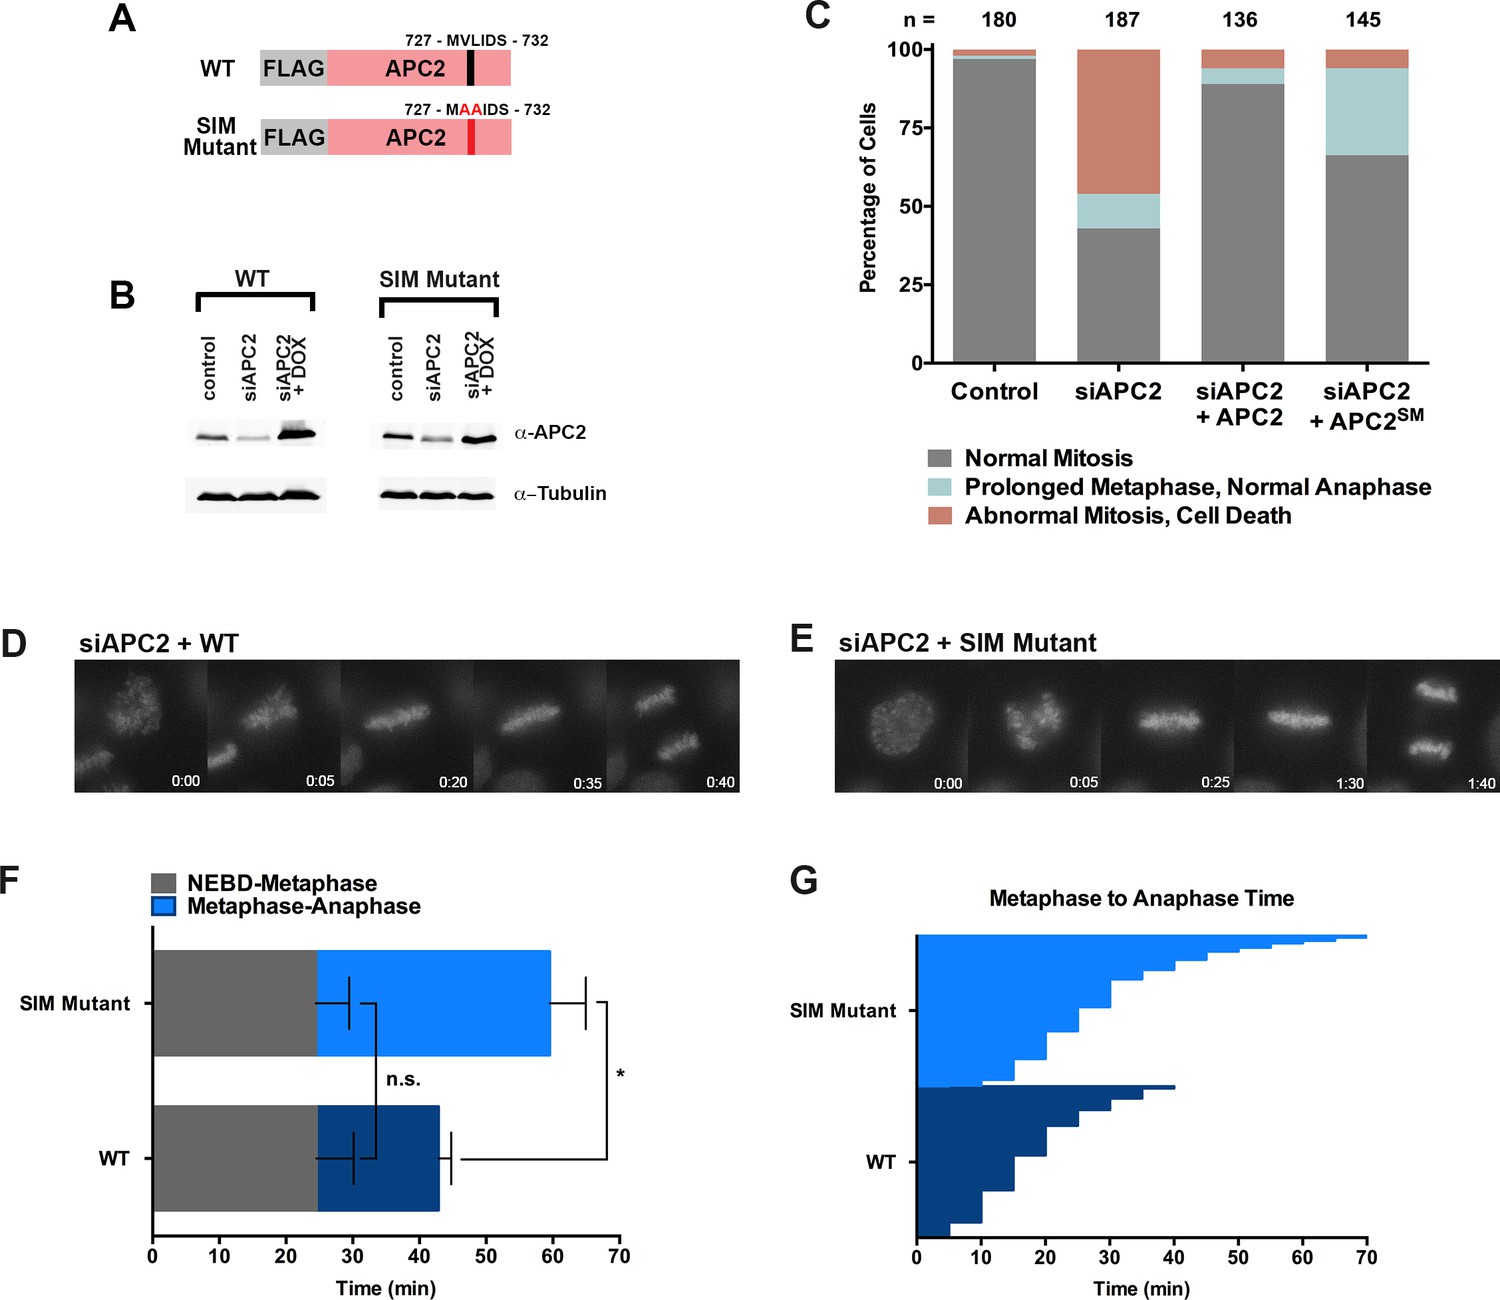
APC2 contains a conserved C-terminal SIM.
(A) APC2 (pink) contains a predicted SIM (red) near its C-terminus that is in close proximity to the C-terminus (blue) of APC4 (teal). (PDB ID: 5LCW [Alfieri et al., 2016]). (B) Schematic depicting the APC2 SIM (red) between residues 727–738 and its conservation in mammals, with sequence homology indicated by ‘*” and phosphorylation sites indicated by ‘+”. Previously characterized (Brown et al., 2015) α/β and WHB domains extend from residues 549–727 and 735–822, respectively. Alanine substitutes at V728 and L729 were used to generate a SIM Mutant. (C and D) APC2 and an APC2 SIM mutant were produced in rabbit reticulocyte lysate in the presence of [35S]-methionine. The expressed proteins were incubated with immobilized, recombinant GST or GST-SUMO2 trimer (SUMOx3) and binding was analyzed by SDS-PAGE and autoradiography. (E) Quantitation from three independent binding assays. Values from scintillation counting were used to generate relative binding ratios. Means are plotted and bars represent standard deviations. Two-tailed t-tests were performed: p=0.04 for APC2 wild type binding to GST-SUMOx3/GST, p=0.08 for APC2 SIM Mutant binding to GST-SUMOx3/GST.
Figure 6—figure supplement 1
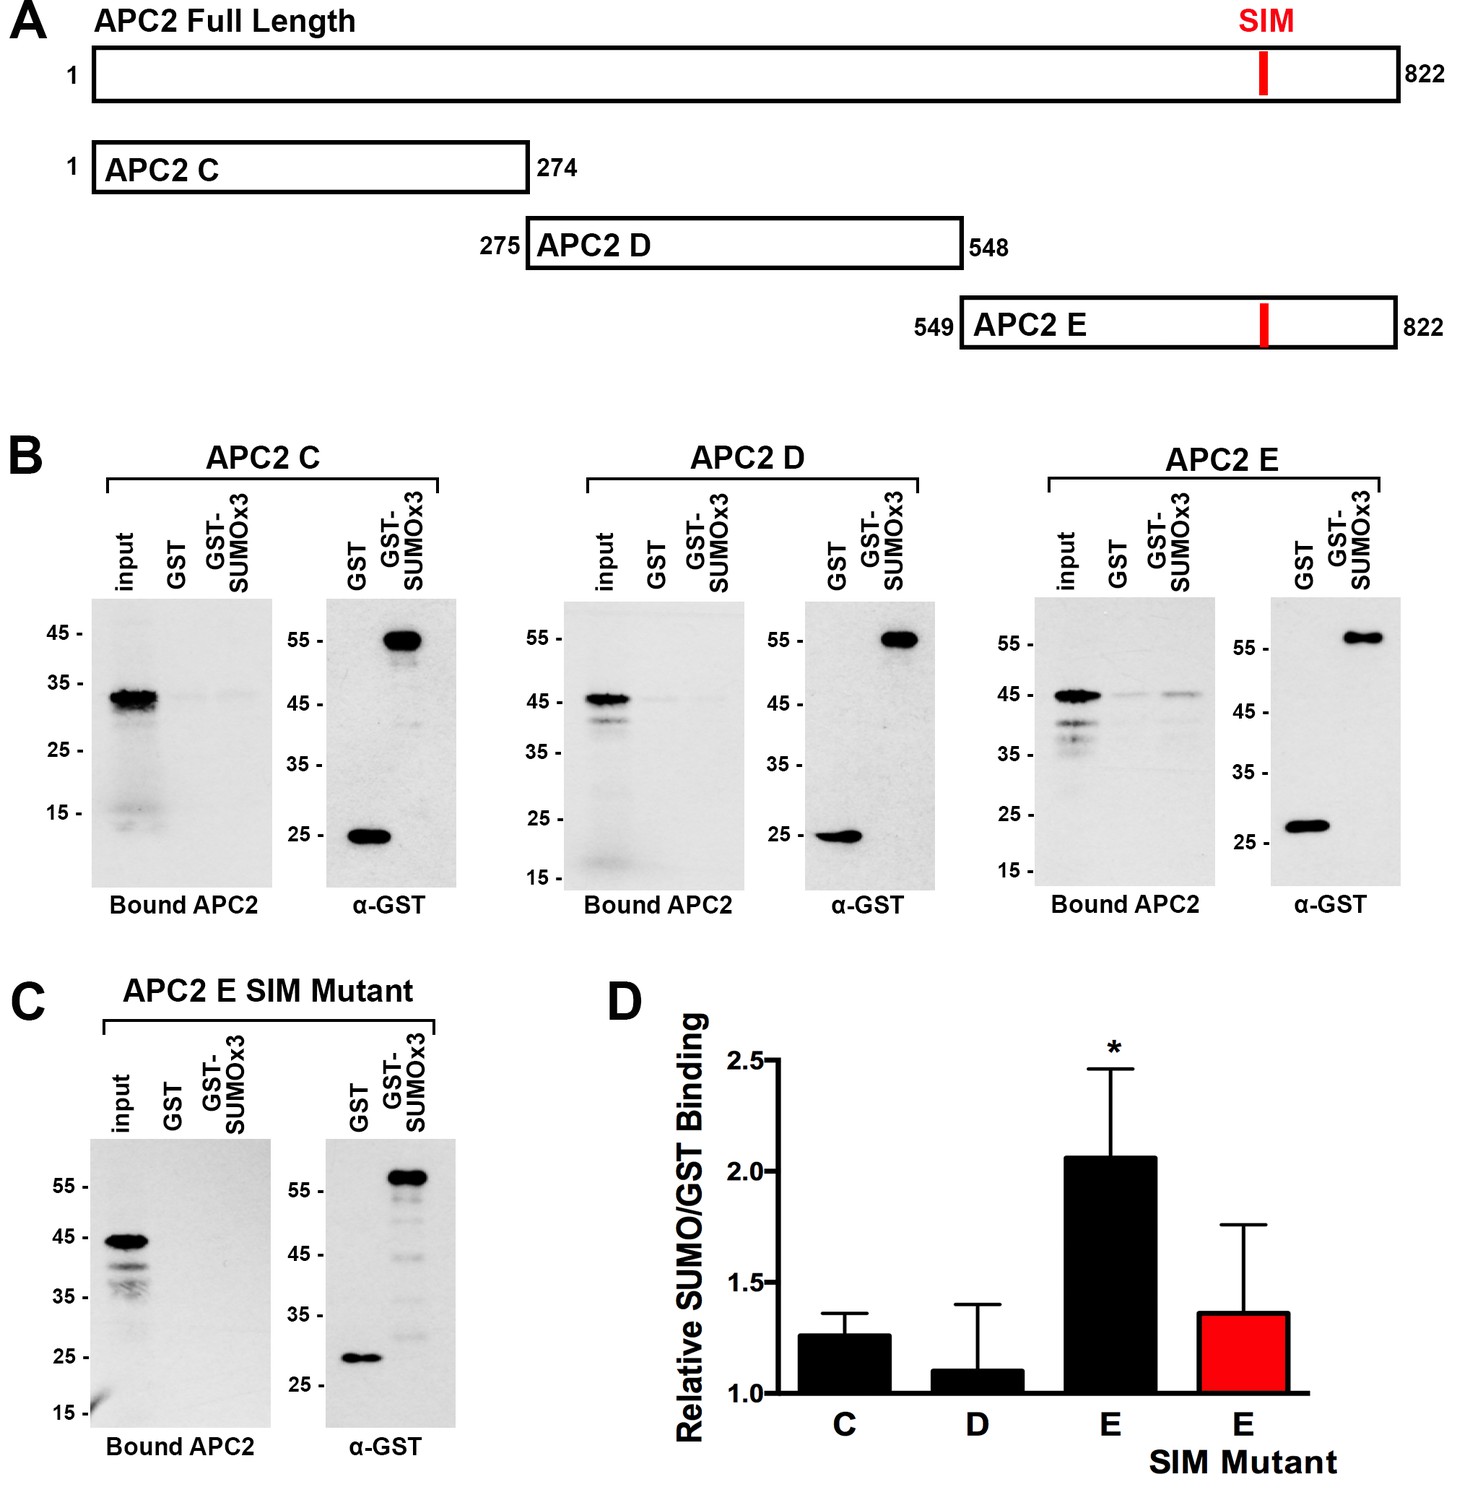
APC2 contains a C-terminal SIM.
(A) Illustration of full-length APC2 and individual deletion fragments used for in vitro SUMO-binding assays. (B) In vitro binding assays were performed using immobilized GST or GST-SUMO2 trimer (SUMOx3) beads and in vitro transcribed and translated APC2 fragments. Bound APC2 was assessed by autoradiography. (C) In vitro binding assays were performed using APC2 fragment E containing mutations in the predicted SIM. (D) Quantitation from three independent replicates indicating the ratio of SUMO to GST binding. Values were derived from scintillation counting of bound APC2 proteins. Means are plotted and bars represent standard deviations. Two-tailed t-tests were performed, p=0.22 for APC2 C binding to GST-SUMOx3/GST, p=0.75 for APC2 D binding to GST-SUMOx3/GST, p=0.01 for APC2 E binding to GST-SUMOx3/GST, and p=0.18 for APC2 E SIM Mutant binding to GST-SUMOx3/GST.
Figure 7 with 3 supplements
The APC2 SIM is required for normal progression from metaphase to anaphase.
(A) Constructs coding for FLAG-tagged versions of wild-type APC2 or the SIM mutant (APC2SM) were used to generate stable inducible cell lines in YFP-H2B HeLa cells. (B) Cells were transfected with control or APC2-specific siRNAs and cultured in the presence (+Dox) or absence of doxycycline. Endogenous APC2, FLAG-APC2 and FLAG-APC2SM expression levels were analyzed by immunoblot analysis with APC2 and tubulin-specific antibodies. (C) Mitotic phenotypes observed in cells treated as in (B) are displayed. n > 130 for each cell line. (D and E) Representative cells from timelapse acquisition beginning with NEBD to anaphase onset in FLAG-APC2 and FLAG-APC2SM-expressing cells with timestamps indicated in minutes. (F) Mitotic timing beginning with NEBD to metaphase plate alignment and from metaphase plate alignment to anaphase onset was quantified in FLAG-APC2 and FLAG-APC2SM expressing cells. Experiments were performed in triplicate; means are displayed and error bars represent standard deviations. n = 59 for each cell line. Two-tailed t-tests were used to calculate significance: p=0.912 between FLAG-APC2 and FLAG-APC2SM timing of NEBD-metaphase, p<0.001 for FLAG-APC2 and FLAG-APC2SM timing from metaphase plate alignment to anaphase. (G) Individual timing of metaphase to anaphase transition times is displayed for FLAG-APC2 and FLAG-APC2SM expressing cells. n = 239 for each cell line.
Figure 7—video 1
Movie of YFP-H2B (green) HeLa cells treated for 48 hr with siAPC2.
Images were analyzed by timelpase microscopy using a Zeiss Observer Z1 fluorescence microscope. One frame captured every 5 min displayed at 2 frames/s.
Figure 7—video 2
Movie of FLAG-APC2 WT cells treated for 48 hr with siAPC2 and APC2 WT induction with doxycycline.
Images were analyzed by timelpase microscopy using a Zeiss Observer Z1 fluorescence microscope. One frame captured every 5 min displayed at 2 frames/s.
Figure 7—video 3
Movie of FLAG-APC2 SIM mutant (SM) cells treated for 48 hr with siAPC2 and APC2 SM induction with doxycycline.
Images were analyzed by timelpase microscopy using a Zeiss Observer Z1 fluorescence microscope. One frame captured every 5 min displayed at 2 frames/s.
Figure 8 with 1 supplement
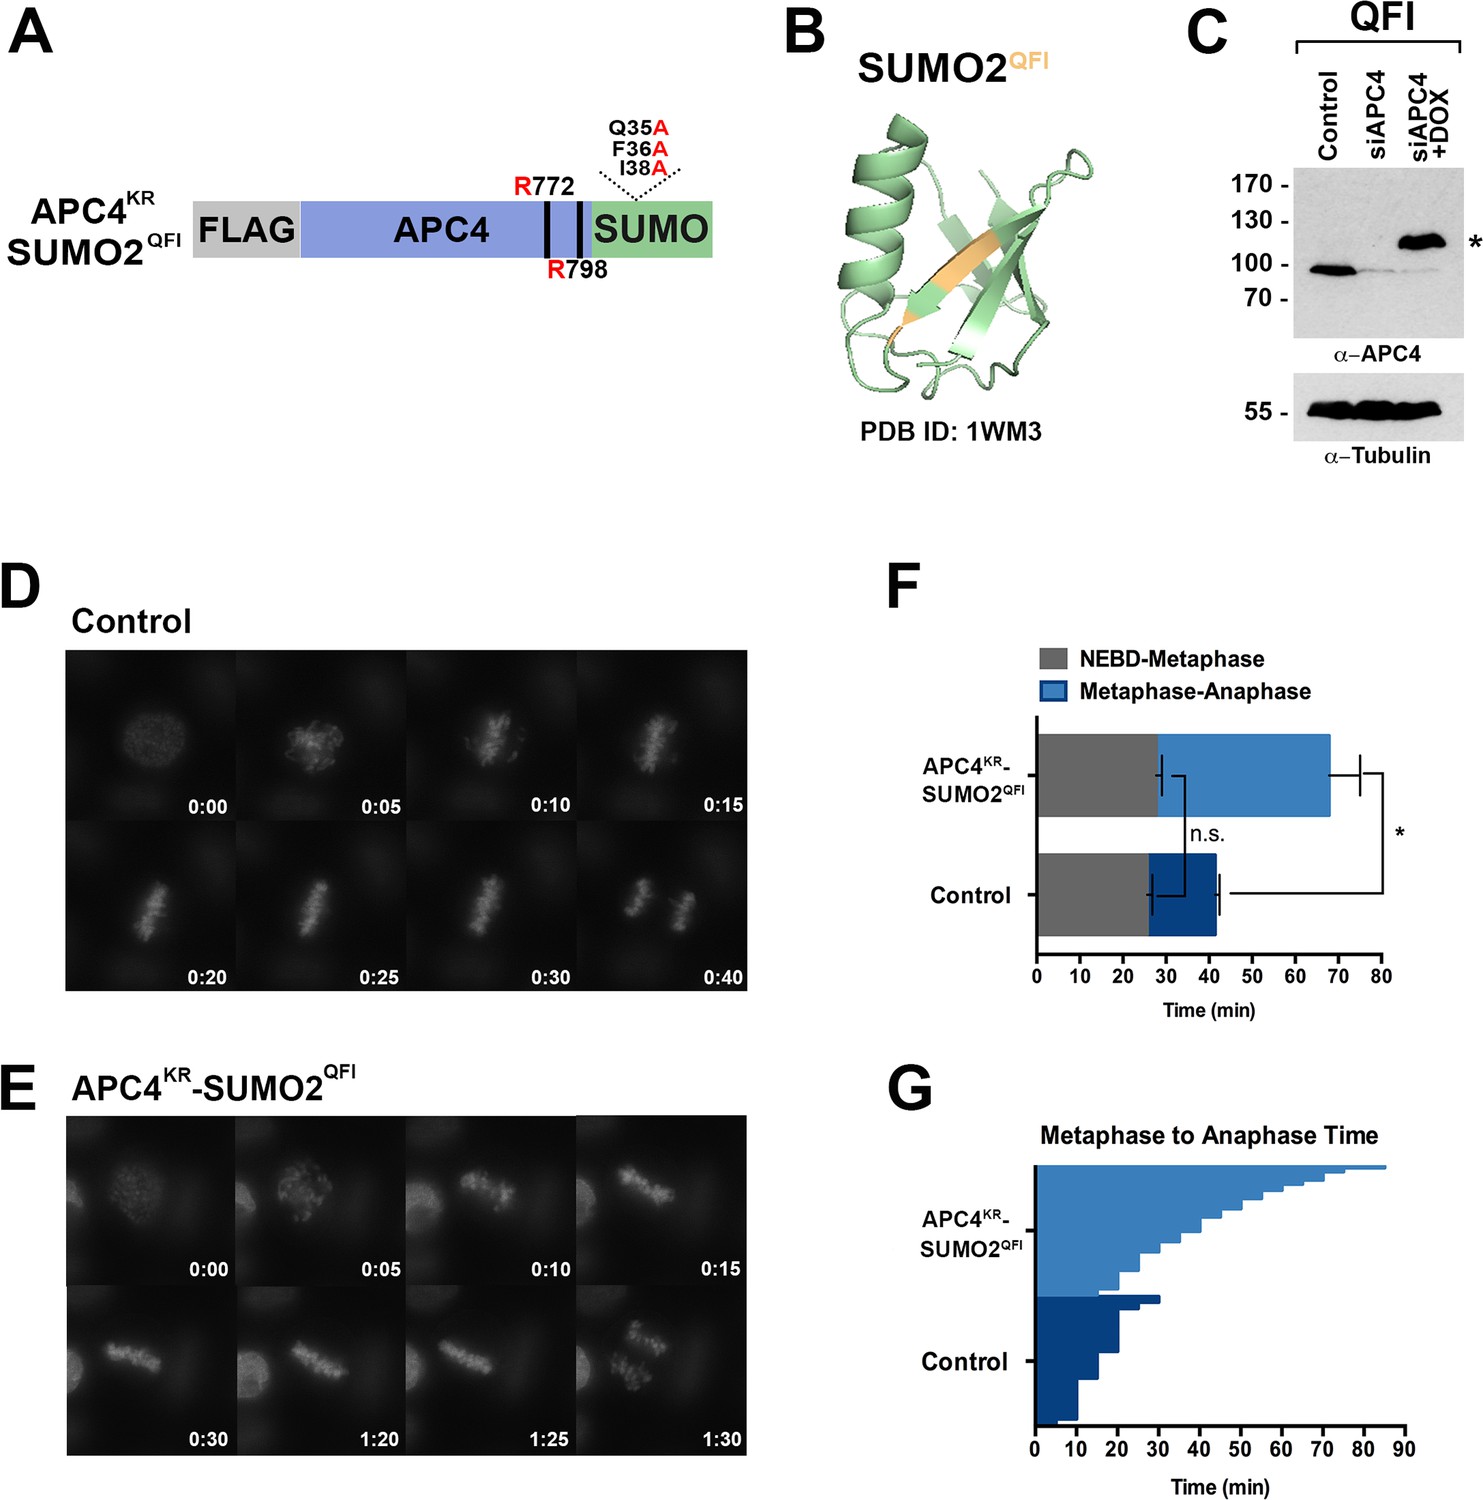
SIM binding of APC4SUMO is required for normal metaphase-anaphase transitions.
(A) Construct coding for FLAG-tagged, linear APC4KRSUMO deficient of SIM binding (SUMO2-QFI) was used to generate stable inducible cell lines in YFP-H2B HeLa cells. (B) The crystal structure of SUMO2 (PDB ID: 1WM3 [Huang et al., 2004]) with the SIM binding mutations in the second β-strand (highlighted in yellow) is shown. (C) Cells were transfected with control or APC4-targeting siRNAs (Control or siAPC4) and cultured in the presence (+Dox) or absence of doxycycline. Endogenous APC4 and FLAG-APC4KRSUMO2QFI expression levels were analyzed by immunoblot analysis with APC4 and tubulin-specific antibodies. (D and E) Representative cells from timelapse acquisition beginning with NEBD to anaphase onset in control and FLAG-APC4KRSUMO2QFI-expressing cells with timestamps indicated in minutes. (F) Mitotic timing beginning with NEBD to metaphase plate alignment and from metaphase plate alignment to anaphase onset was quantified in control and FLAG-APC4KRSUMO2QFI-expressing cells. Experiments were performed in triplicate; means are displayed and error bars represent standard deviations (SD). n = 101 for each cell line. Two-tailed t-tests were used to calculate significance: p=0.097 (not significant) between Control (average = 28.59 min, SD = 2.19) and FLAG-APCKRSUMO2QFI (average = 34.89 min, SD = 1.93) timing of NEBD-metaphase, p=0.0011 for Control (average = 18.28 min, SD = 1.57) and FLAG-APC4KRSUMO2QFI (average = 53.15 min, SD = 3.85) timing from metaphase plate alignment to anaphase. (G) Individual timing of metaphase to anaphase transition times is displayed for Control and FLAG-APC4KRSUMO2QFI-expressing cells. n = 101 for each cell line.
Figure 8—video 1
Movie of FLAG-APC4KR-SUMO2QFI cells treated for 48 hr with siAPC4 and SUMO2QFI induction with doxycycline.
YFP-H2B (green). Images were analyzed by timelpase microscopy using a Zeiss Observer Z1 fluorescence microscope. One frame captured every 5 min displayed at 2 frames/s.
Figure 9
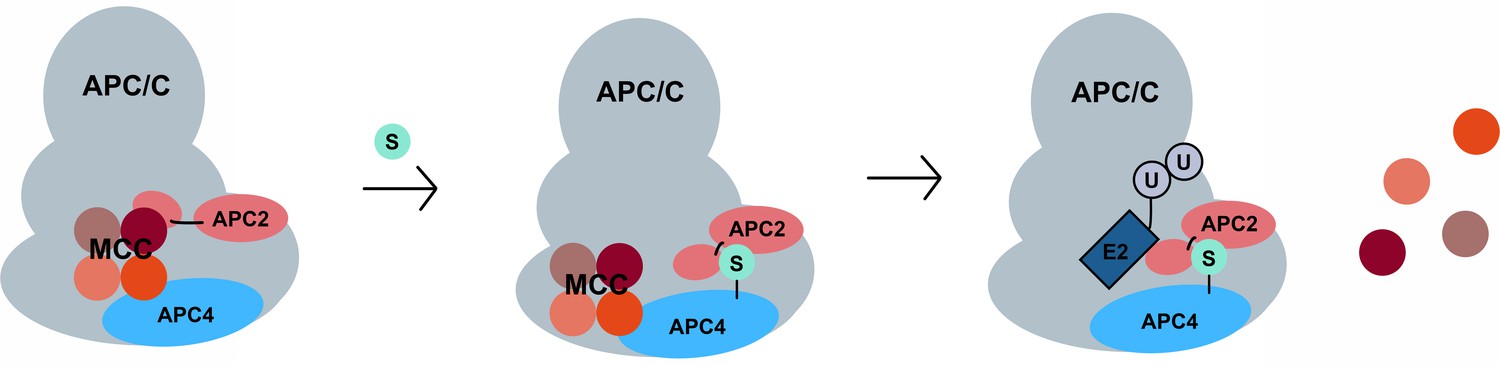
A model for SUMO-mediated enhancement of APC/C activity involving APC4 sumoylation and APC2 SUMO binding.
SUMO, conjugated to C-terminal lysines in APC4, is proposed to interact with a SIM near the WHB domain of APC2 and stabilize a conformation of the catalytic core that facilitates either MCC turnover, E2 binding or both.
Additional files
-
Transparent reporting form
- https://doi.org/10.7554/eLife.29539.029
Download links
A two-part list of links to download the article, or parts of the article, in various formats.
Downloads (link to download the article as PDF)
Open citations (links to open the citations from this article in various online reference manager services)
Cite this article (links to download the citations from this article in formats compatible with various reference manager tools)
Sumoylation promotes optimal APC/C activation and timely anaphase
eLife 7:e29539.
https://doi.org/10.7554/eLife.29539


