Astrocytes release prostaglandin E2 to modify respiratory network activity
- Karolinska Institutet, Karolinska University Hospital, Sweden
Figures
Figure 1
Astrocytes can be identified and studied in GFAPMrgA1+mice.
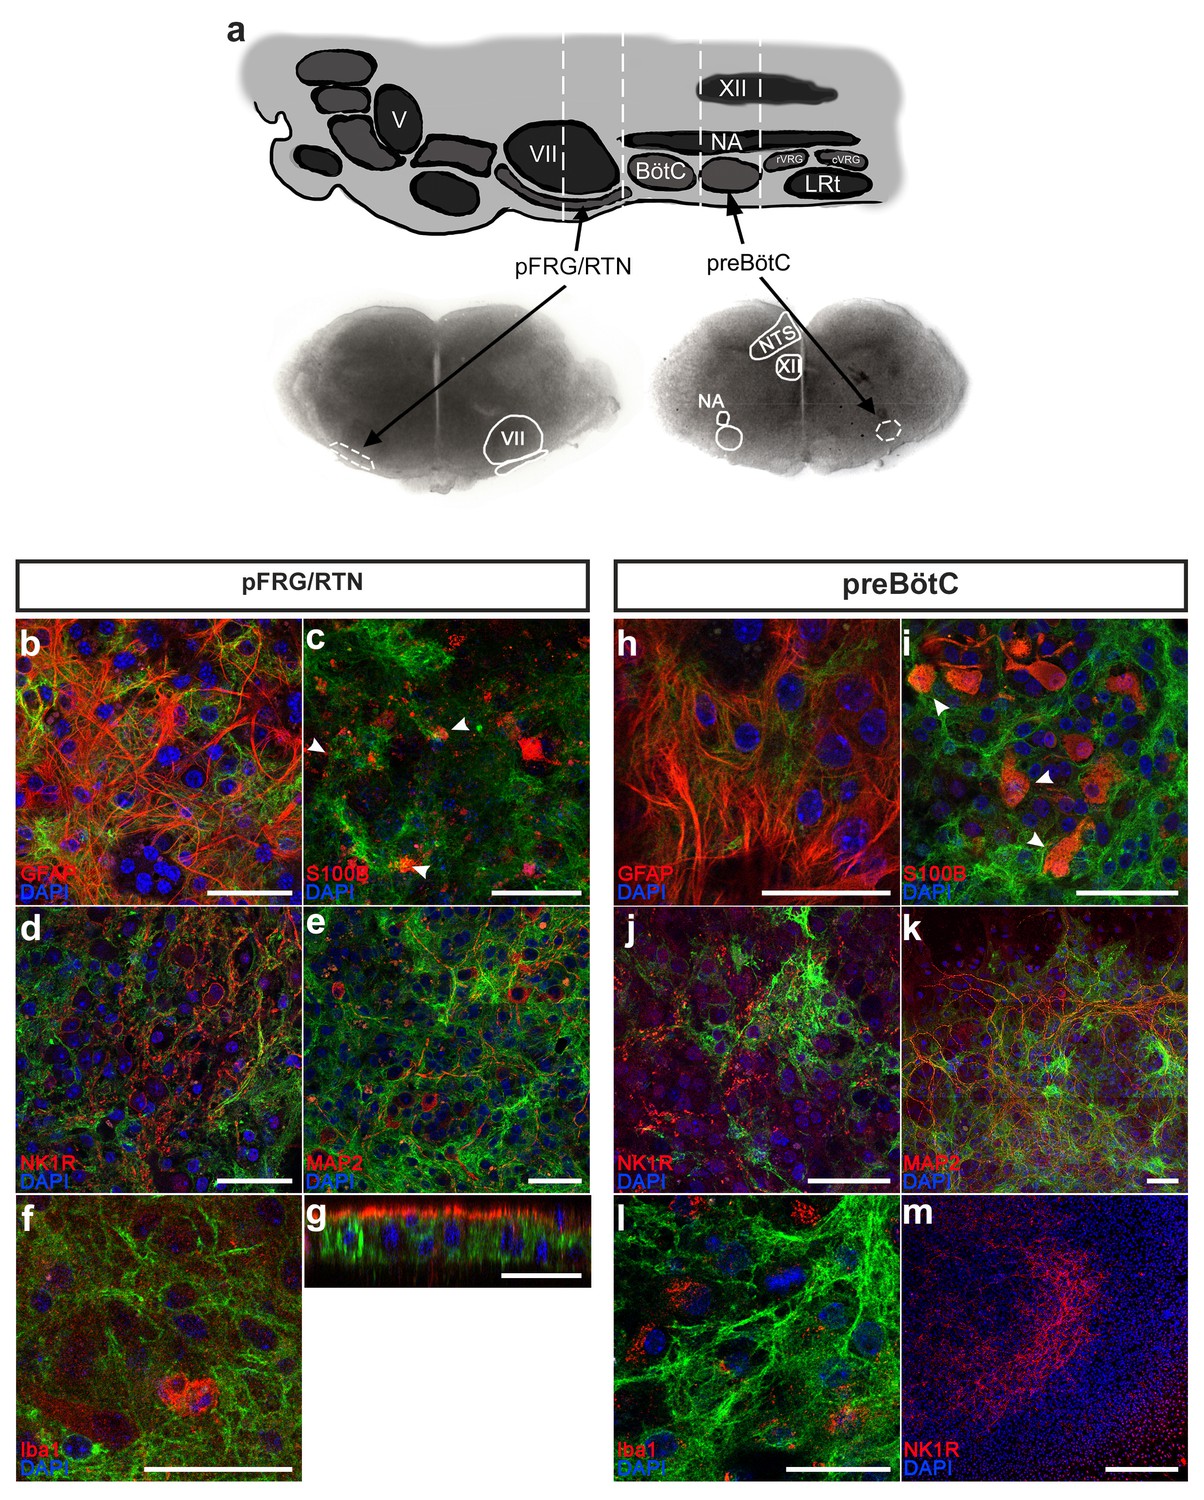
The pFRG/RTN and preBötC slices (a) obtained from GFAPMrgA1+ mice expressed GFP (green), which co-localized with the astrocytic markers GFAP (red; b, h) and S100β (c, i). By contrast, no GFP co-expression was detected with the neuronal markers NK1R (red; d, j) or MAP2 (red; e, k), or with the microglial marker Iba1 (red; f, l). Littermate controls did not express GFP (m). The z-projections revealed that the antibodies used in the immunohistochemical analyses penetrate only a part of the brainstem slice (g). V; trigeminal nucleus, VII; facial nucleus; BötC; Bötzinger complex, NA; Nucleus Ambiguus, XII; hypoglossal nucleus, rVRG; rostral ventral respiratory group, cVRG; caudal ventral respiratory group, LRt; lateral reticular nucleus, NTS; nucleus tractus solitaries. Arrowheads indicate double-labeled cells. Scale bars: 50 µm in b–l, 500 µm in m.
-
Figure 1—source data 1
IHC Quantification.
- https://doi.org/10.7554/eLife.29566.003
Figure 2
Active astrocytes constitute a subgroup of glial cells forming separate networks within the respiratory networks.
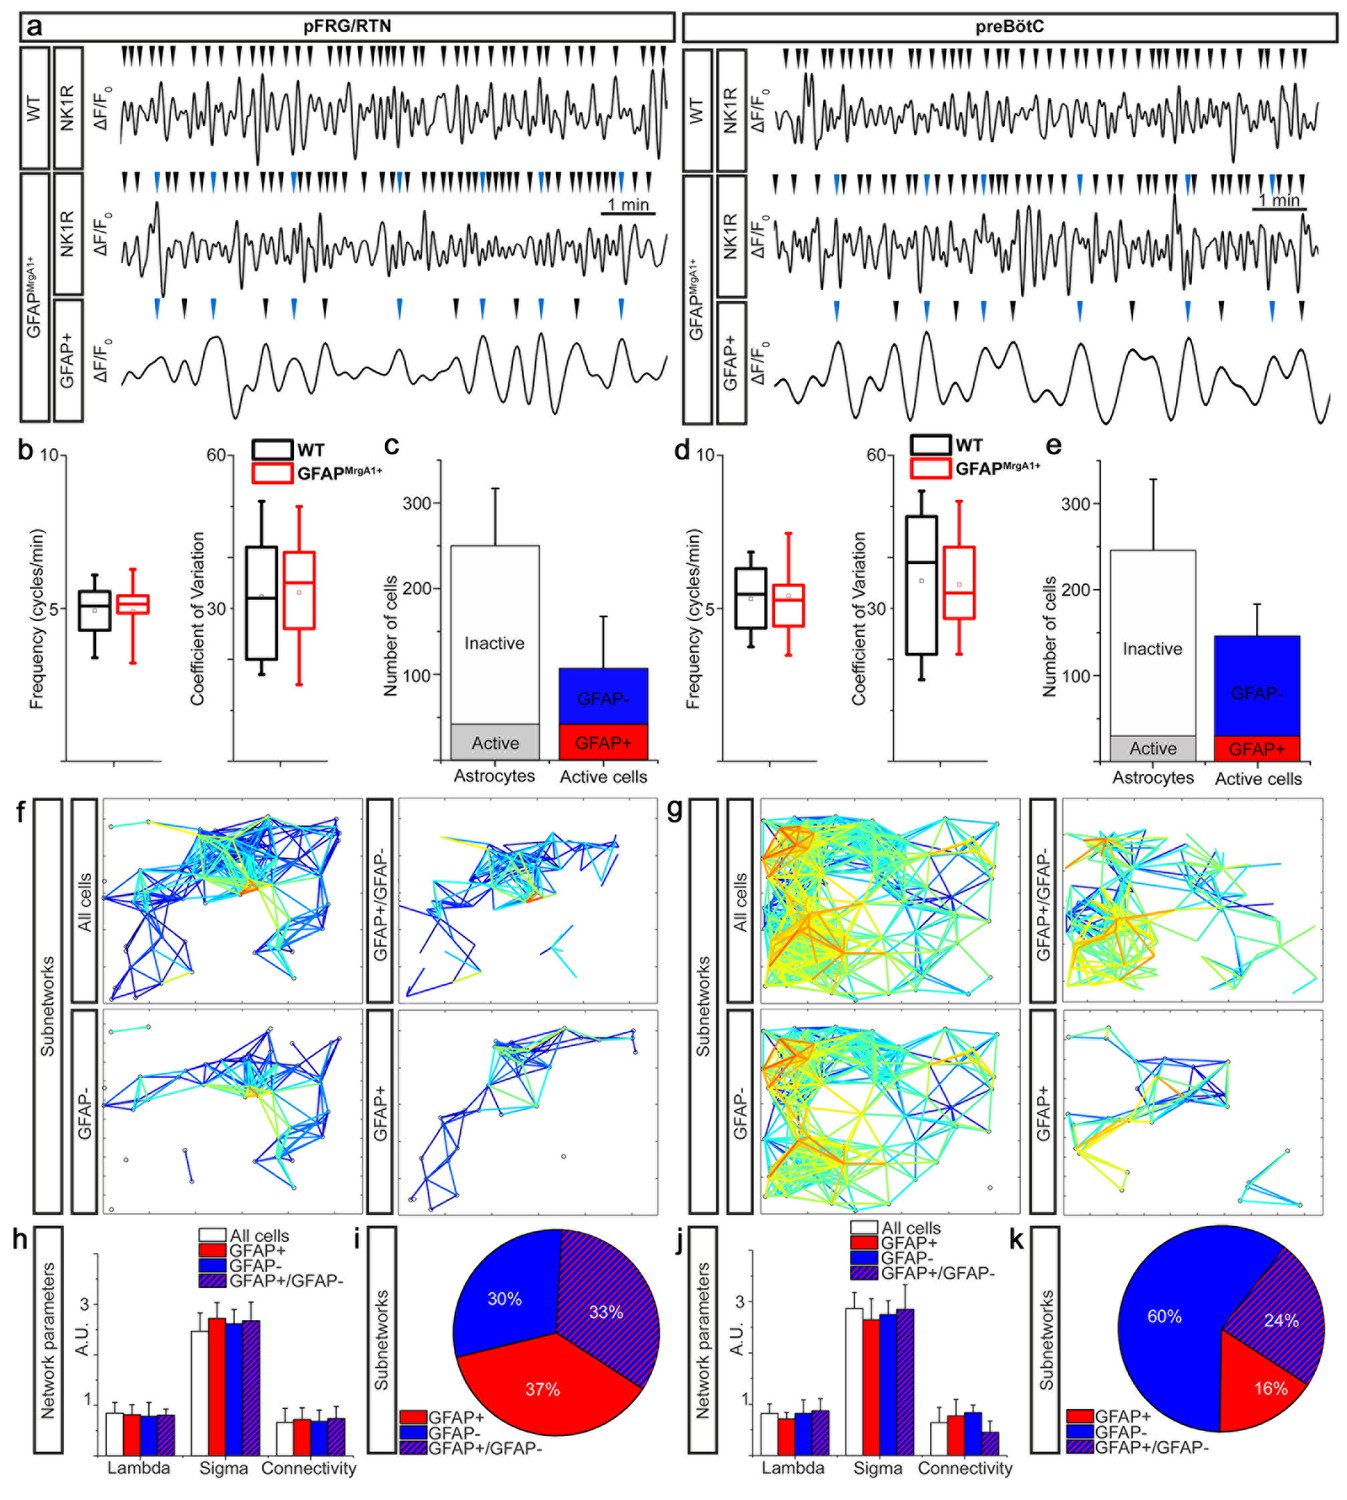
Respiratory neuron (NK1R+) Ca2+ activity had a similar pattern in GFAPMrgA1+ as in littermate control (WT) mice (a) with no difference in overall network Ca2+ oscillation frequency (b and c) or coefficient of variation (b and c). A subgroup of astrocytes had rhythmic Ca2+ activity, some of which were synchronized with respiratory neuron activity (a, blue arrowheads). In the pFRG/RTN, 18 ± 13% of the astrocytes were active. Of the total number of active cells, 40 ± 12% were astrocytes (GFAP+) (a). In the preBötC, 13 ± 7% of the astrocytes were active, and only 20 ± 9% of the total number of active cells were astrocytes (b). (f) and (g) graphically represent the network structures in a 2-D plane, with the lines representing correlation coefficients above set cut-offs for the cell pairs (warmer color equals higher correlation coefficient). Node (cell) distance in the networks plots is proportional to actual distance within the brainstem slice culture. In both the pFRG/RTN and the preBötC, active astrocytes (GFAP+) and neurons (GFAP-) formed separate networks (f, g). However, these networks interconnected to build a joint astrocyte–neuron (GFAP+/GFAP-) network (f, g). All subnetworks had similar network properties (h, j), except the connectivity of the astrocyte–neuron network in the preBötC, which was slightly and nonsignificantly less than that of the other subnetworks (j). The pFRG/RTN consisted of equal parts of the three subnetworks (i), whereas the preBötC network was predominantly neuronal (k). pFRG/RTN n = 19 slices, preBötC n = 22 slices. Arrowheads show identified Ca2+ peaks in a. Data are as boxplots in b and d, where tails represent maximum and minimum values, the box 50 % of the data, line in box median and the square the mean value, and as presented as the mean ± SD in c, e, h and j.
-
Figure 2—source data 1
Control frequencies.
- https://doi.org/10.7554/eLife.29566.005
-
Figure 2—source data 2
Network quantification.
- https://doi.org/10.7554/eLife.29566.006
-
Figure 2—source data 3
Number of cells.
- https://doi.org/10.7554/eLife.29566.007
Figure 3
Astrocytes control neurons in the pFRG/RTN.
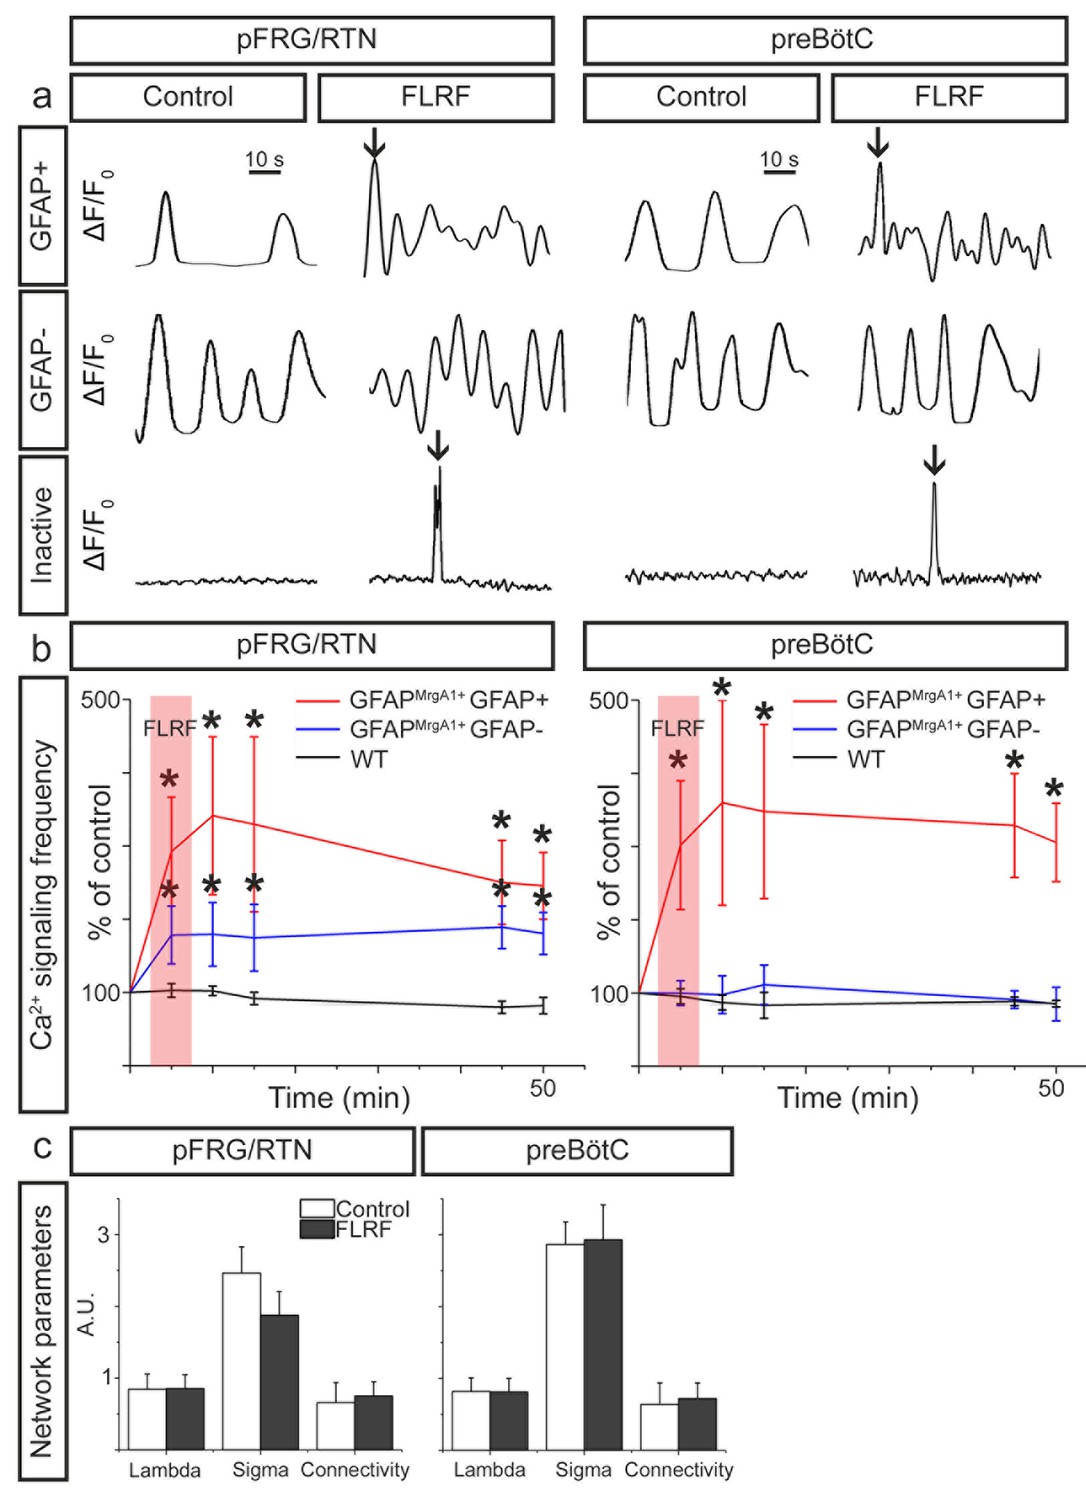
(a) Individual 1 min calcium traces (ΔF/F0 over time, band pass filtered 0.01–0.15 Hz) during the control period and after the application of the MrgA1R ligand FLRF. Activation of astrocytes through addition of FLRF increased calcium-signaling frequency of astrocytes in both the pFRG/RTN and the preBötC (b, red trace). In the pFRG/RTN, neuronal calcium-signaling frequency increased after astrocyte activation (b, blue trace). This was not observed in the preBötC (b, blue trace). Littermate controls (WT) did not respond to FLRF (b, black trace). Network properties were not affected by addition of FLRF (c). pFRG/RTN n = 18 slices, preBötC n = 20 slices. Data are presented as the mean ± SD. *p<0.05 compared to their respective controls.
-
Figure 3—source data 1
Frequency data.
- https://doi.org/10.7554/eLife.29566.009
-
Figure 3—source data 2
Network quantification.
- https://doi.org/10.7554/eLife.29566.010
Figure 4
Astrocytes release PGE2 upon activation.
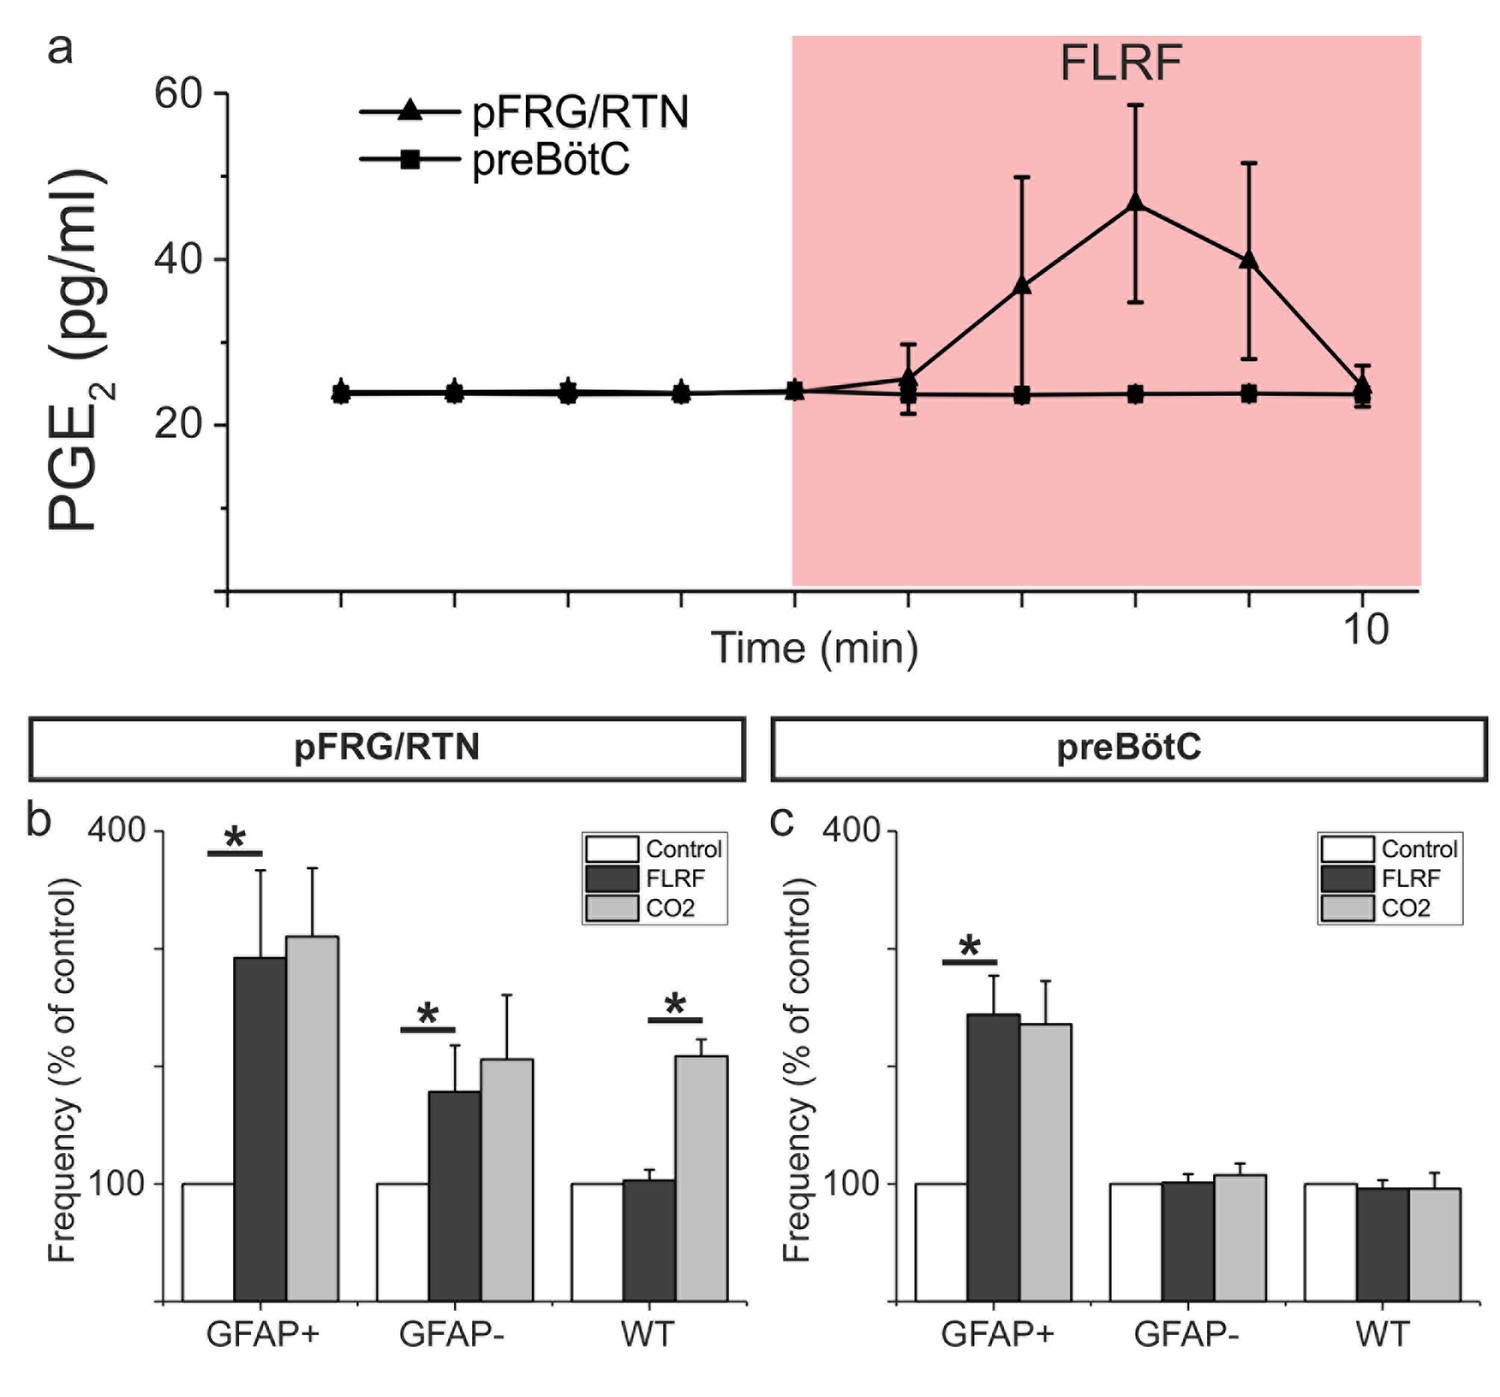
Astrocyte activation through application of the MrgA1R ligand FLRF increases PGE2 levels in the aCSF of the pFRG/RTN (n = 8) but not he preBötC (n = 3; a). After such activation, the hypercapnic response (CO2 partial pressure increase from 4.6 kPa to 6.6 kPa) is blunted (n = 8, (b). The preBötC does not respond to a hypercapnic challenge (n = 6, (c). Data are presented as the mean ± SD. *p<0.05 for the indicated comparisons.
-
Figure 4—source data 1
Elisa.
- https://doi.org/10.7554/eLife.29566.012
-
Figure 4—source data 2
Frequency data.
- https://doi.org/10.7554/eLife.29566.013
Additional files
-
Supplementary file 1
Number of experiments conducted
- https://doi.org/10.7554/eLife.29566.014
-
Supplementary file 2
Statistical analyses and results
- https://doi.org/10.7554/eLife.29566.015
-
Transparent reporting form
- https://doi.org/10.7554/eLife.29566.016
Download links
A two-part list of links to download the article, or parts of the article, in various formats.
Downloads (link to download the article as PDF)
Open citations (links to open the citations from this article in various online reference manager services)
Cite this article (links to download the citations from this article in formats compatible with various reference manager tools)
Astrocytes release prostaglandin E2 to modify respiratory network activity
eLife 6:e29566.
https://doi.org/10.7554/eLife.29566


