IRAK2 directs stimulus-dependent nuclear export of inflammatory mRNAs
- Lerner Research Institute, Cleveland Clinic, United States
- Jagiellonian University, Poland
- Stanford University School of Medicine, United States
- Mount Auburn Hospital, Harvard Medical School, United States
- Zentrum für Molekulare Biologie der Universität Heidelberg, DKFZ-ZMBH Alliance, Germany
- Bristol-Myers Squibb, United States
- Shanghai Jiao Tong University School of Medicine, China
- Yale University School of Medicine, United States
- Case Western Reserve University, United States
- Stokes Veterans Administration Hospital, United States
- Lerner Research Institute Cleveland Clinic, United States
Figures
Figure 1 with 4 supplements
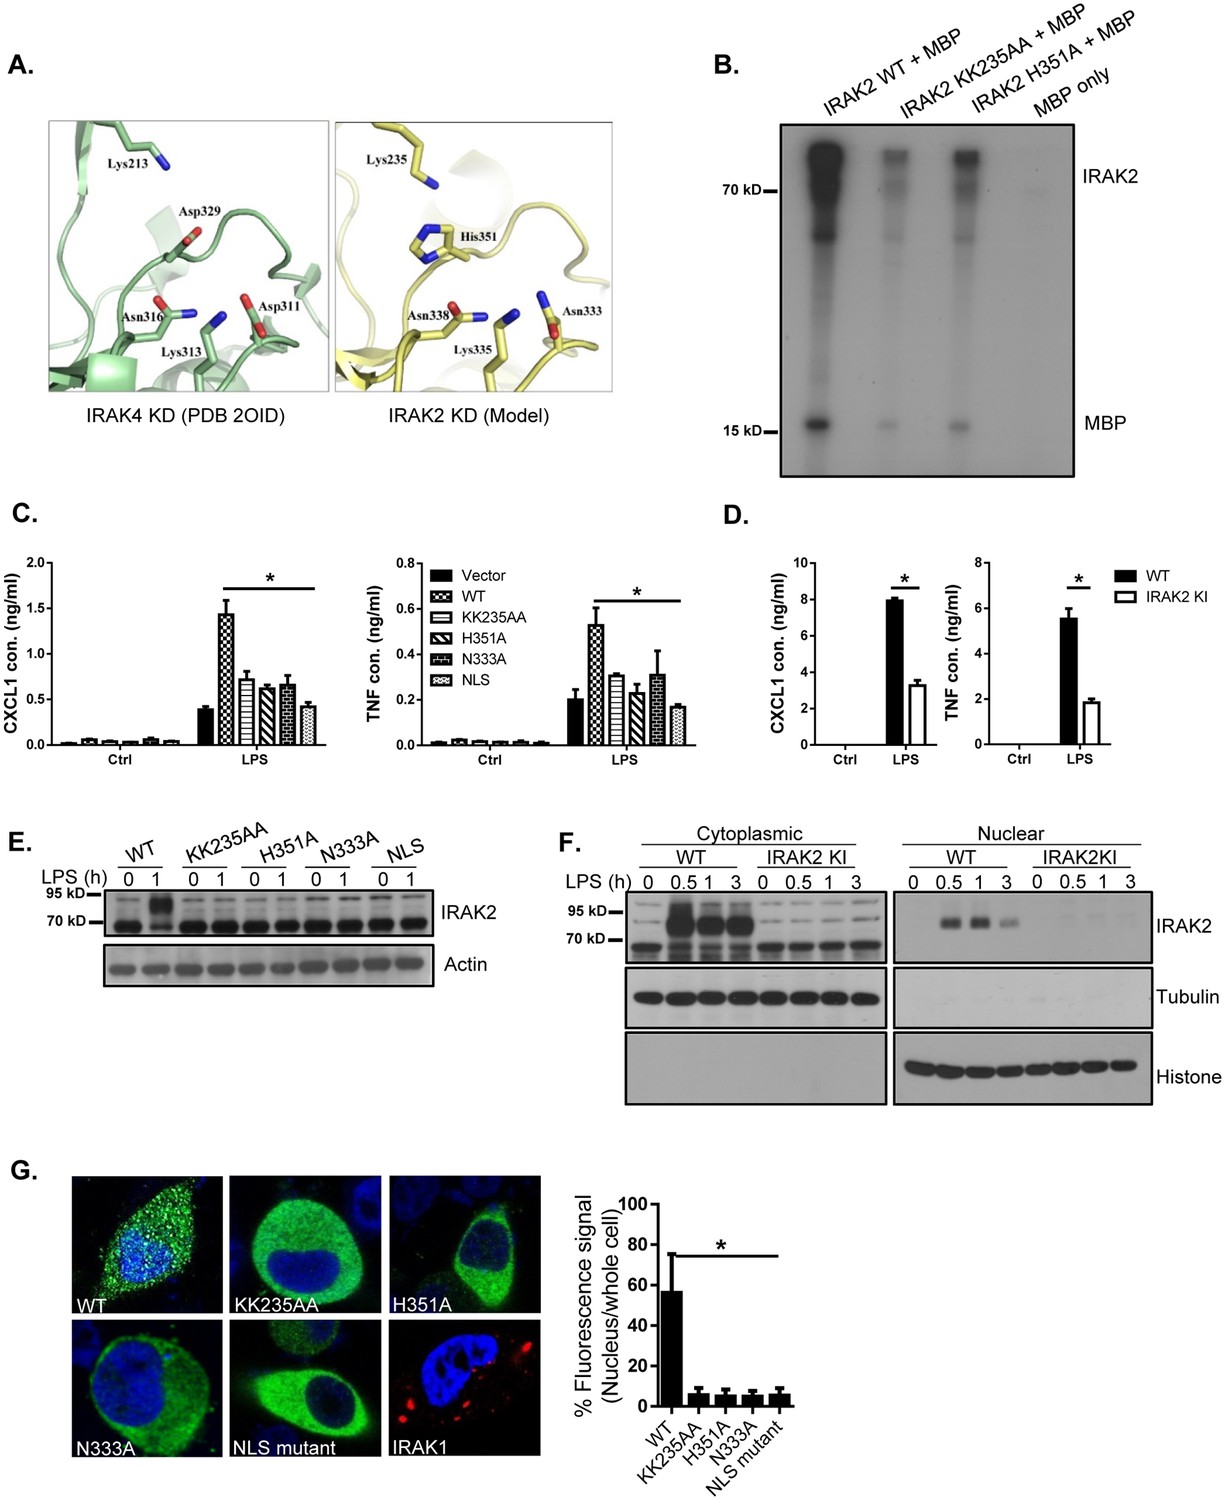
IRAK2 kinase activity is required for LPS-induced IRAK2 nuclear translocation.
(A) A structural model of the catalytic site of IRAK2 kinase domain was created on a web-based molecular modeling server (Arnold et al., 2006), using the crystal structure of the IRAK4 KD segment (PDB 2OID) as a template (left). (B) In vitro kinase assay of purified recombinant mouse His-flag tagged IRAK2 WT, KK235AA and H351A mutants using myelin basic protein (MBP) as a substrate. (C) IRAK2-deficient macrophages restored with IRAK2 WT, KK235AA, H351A, N333A or empty vector were treated with LPS for 6 hr, followed by ELISA for CXCL1 and TNF levels in the supernatant. Western blot analysis for the expression of the transfected constructs are shown in (E-D) Wild-type (WT) and IRAK2 kinase-inactive (KI) BMDMs were treated with LPS for 6 hr, followed by ELISA for CXCL1 and TNF levels in the supernatant. (E) Lysates made from cells described in (C) were analyzed by western blot analysis with the indicated antibodies. (F) Cytoplasmic and nuclear extracts from WT and IRAK2 KI BMDMs treated with LPS for the indicated times were analyzed by western blot analysis with the indicated antibodies. The experiments were repeated five times with similar results. (G) Confocal imaging of HeLa cells transiently transfected with FLAG-tagged IRAK2 WT, KK235AA, H351A, N333A, NLS mutant and IRAK1-RFP (a negative control). For Flag-tagged construct, immunostaining was performed with anti-FLAG (green) on the transfected cells. Nuclei were stained with DAPI in blue. Fluorescence intensity was quantified in the nucleus versus the whole cell of 50 expressing cells and analyzed by Student’s t test. Bar graph shows the percentage of fluorescent signal in the nucleus in expressing cells. Data represent mean ± SEM; *p<0.05 by Student’s t test.
-
Figure 1—source data 1
The numerical data for the graphs in Figure 1.
- https://doi.org/10.7554/eLife.29630.008
Figure 1—figure supplement 1
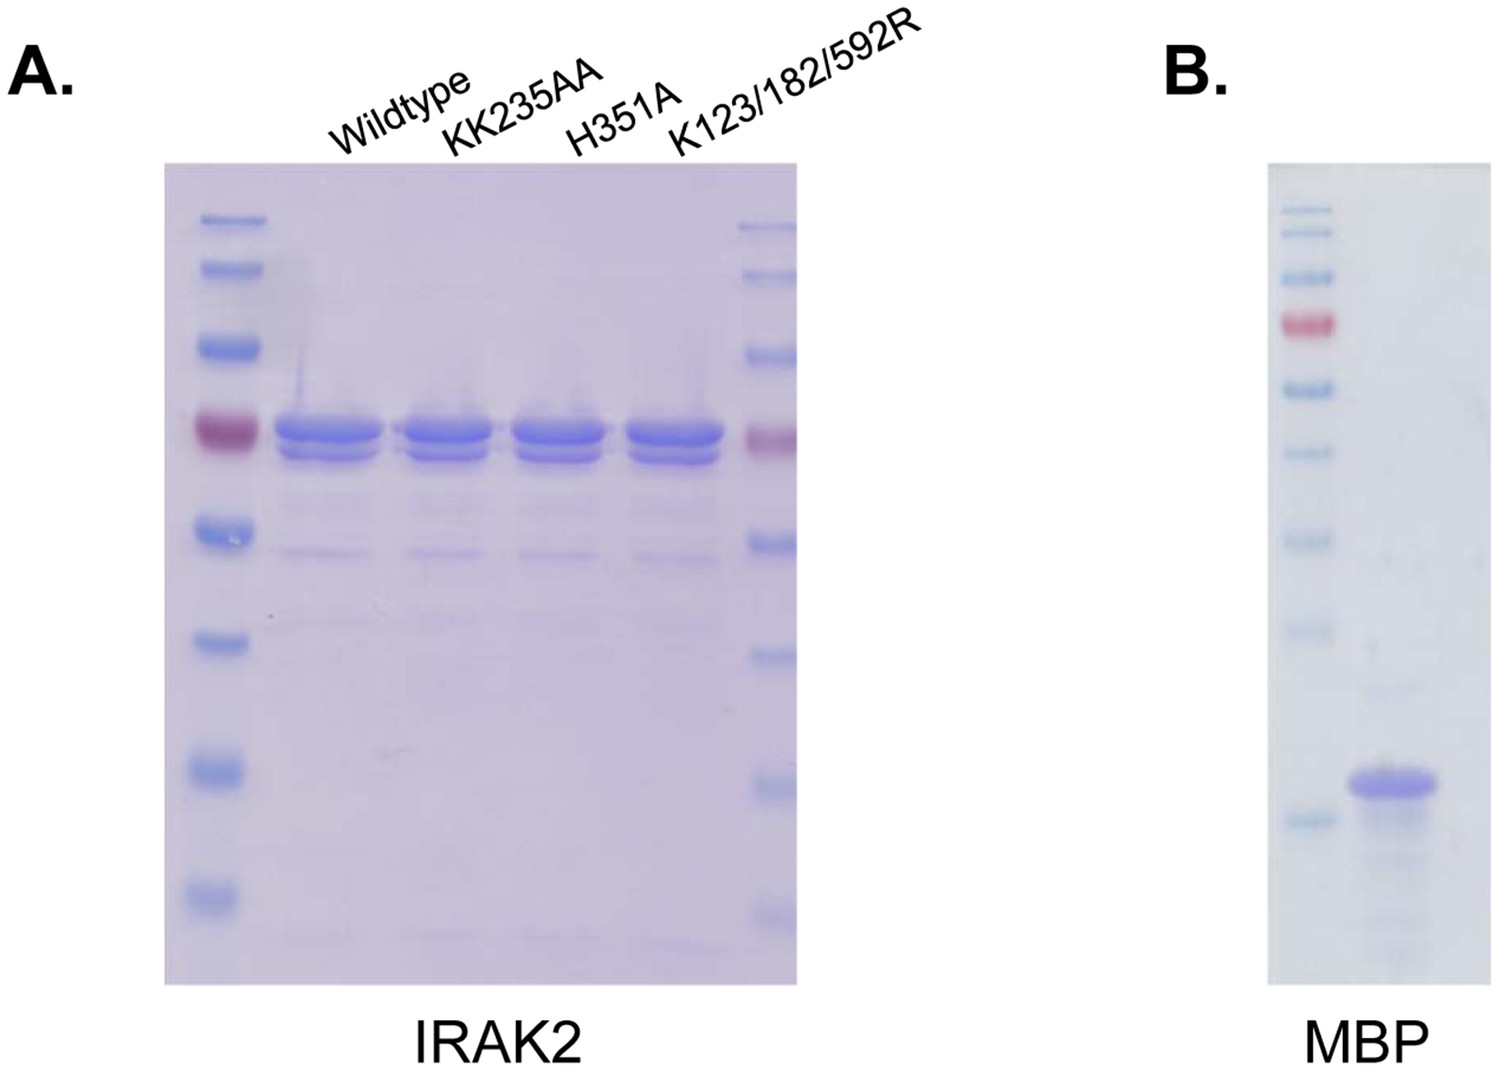
Coomassie blue staining for recombinant proteins using in Figure 1.
(A) Coomassie blue staining of purified recombinant IRAK2 protein: Wild-type, KK235AA, H351A and K123/182/592R. (B) Coomassie blue staining of recombinant MBP.
Figure 1—figure supplement 2
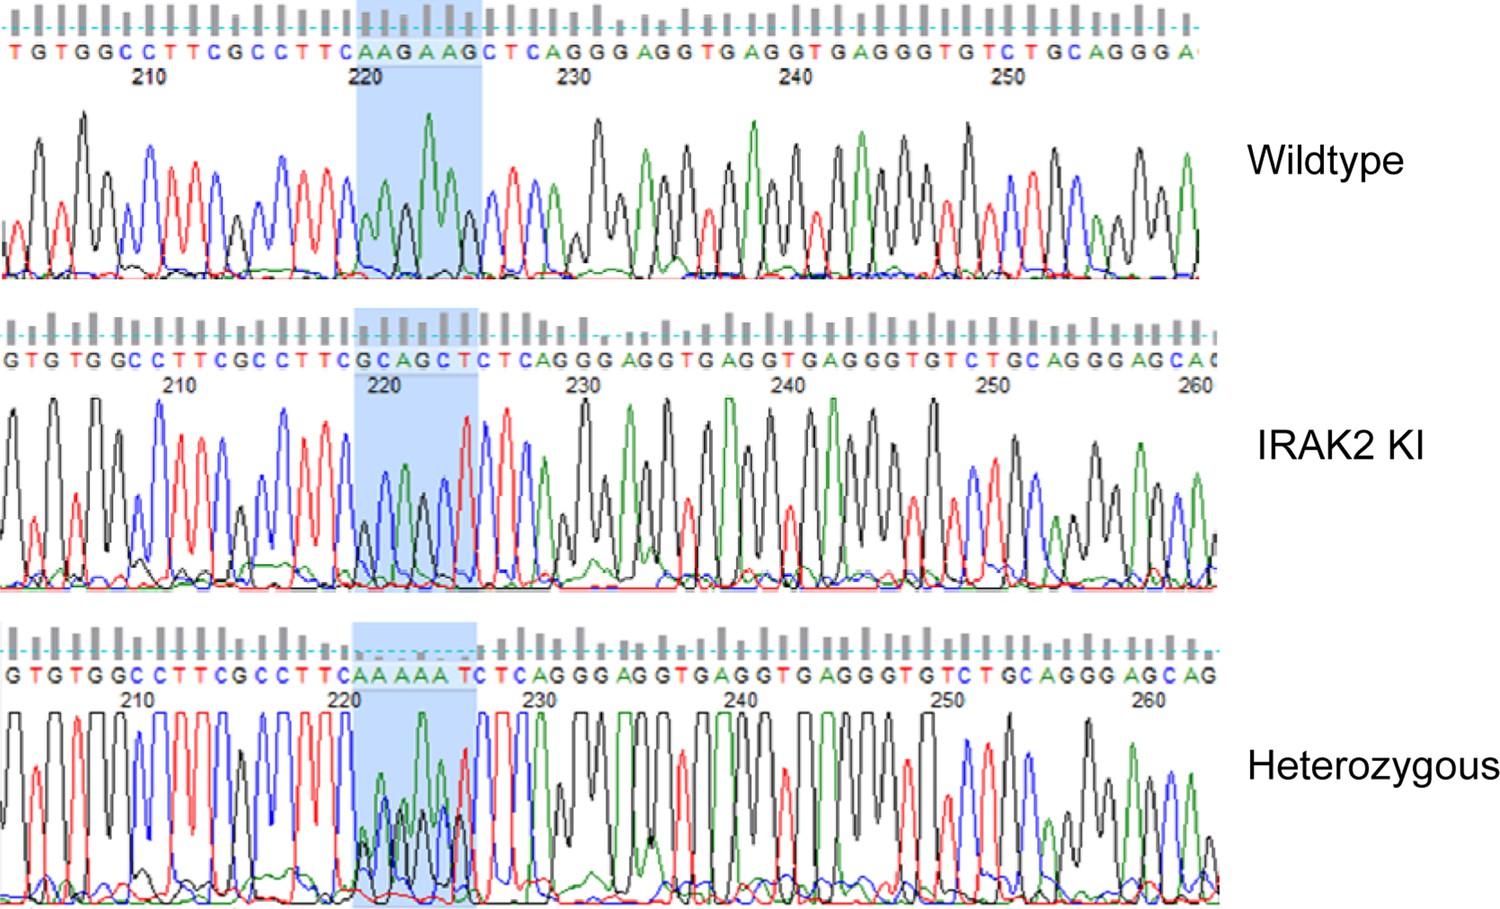
Sequencing analysis of wild-type, IRAK2 kinase-inactive (IRAK2 KI) and heterozygous mice.
AAGAAG was mutated to GCAGCT (highlighted in blue).
Figure 1—figure supplement 3
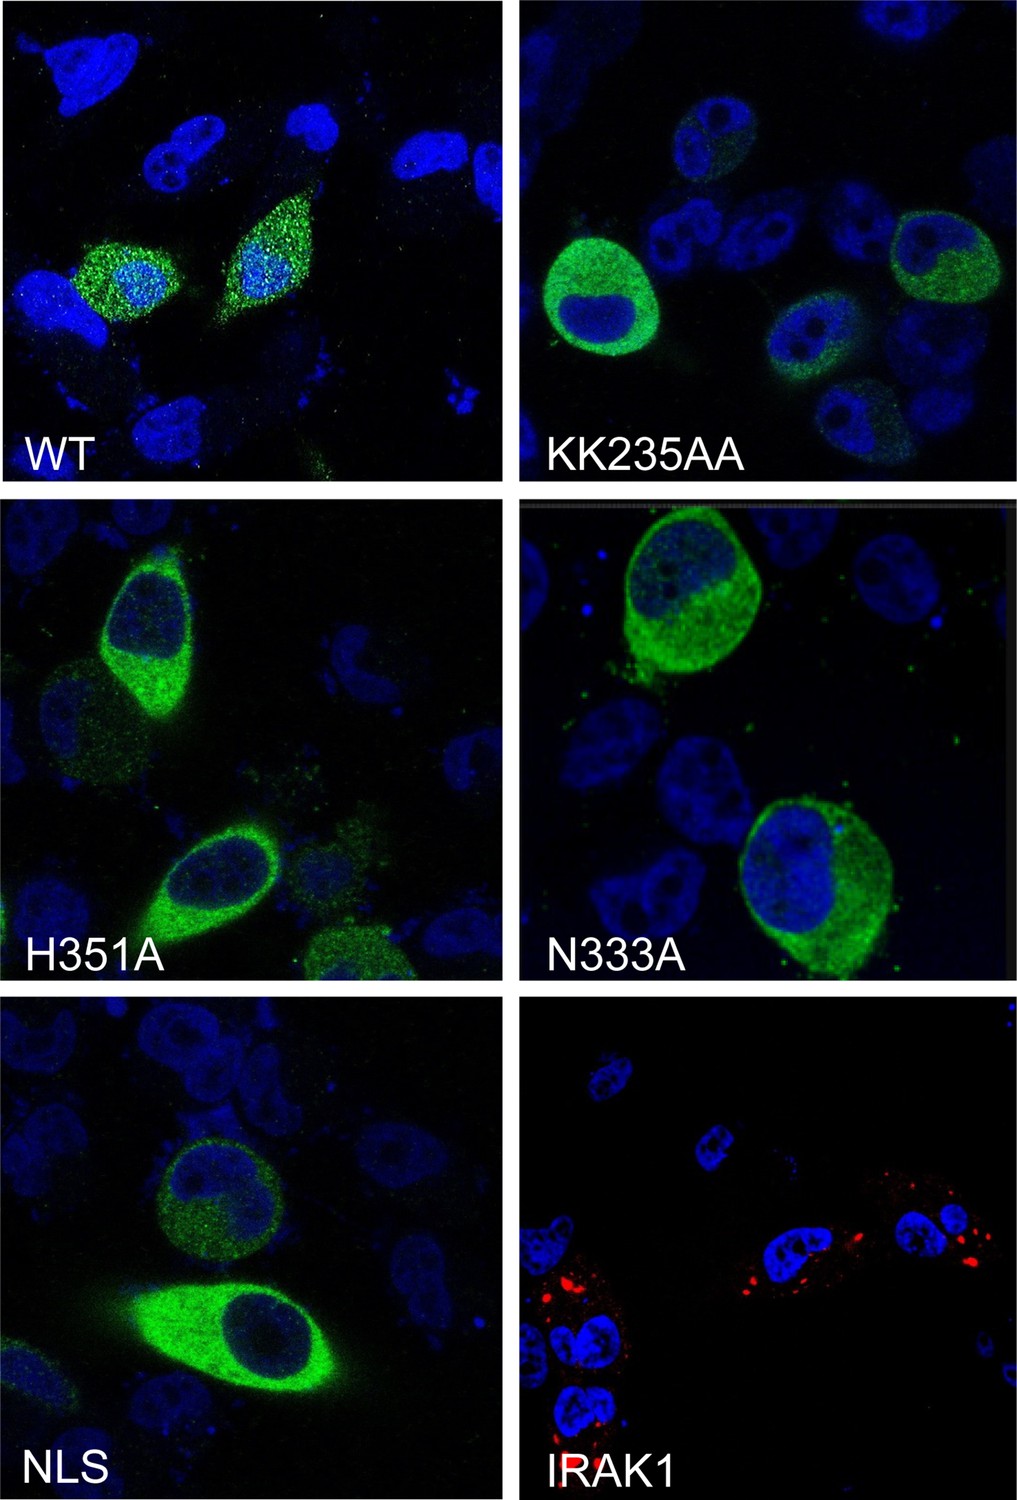
Lower magnification of the confocal imaging of Figure 1G.
Confocal imaging of HeLa cells transiently transfected with FLAG-tagged IRAK2 WT, KK235AA, H351A, N333A, NLS mutant and IRAK1-RFP (a negative control). Immunostaining was performed with anti-FLAG (green) on the transfected cells with Flag-tagged constructs. Nuclei were stained with DAPI in blue.
Figure 1—figure supplement 4
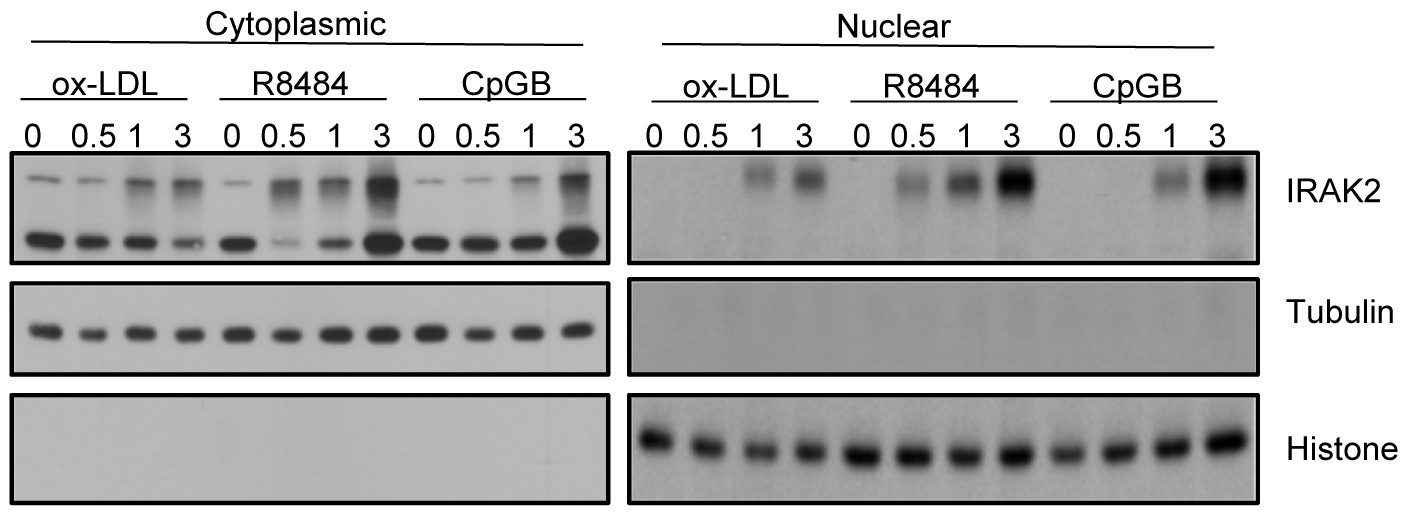
Cytoplasmic and nuclear extracts from WT BMDMs treated with oxidized low-density lipoprotein (ox-LDL), R848 and CpGB for the indicated times were analyzed by western blot analysis with the indicated antibodies.
The experiments were repeated five times with similar results.
Figure 2 with 6 supplements
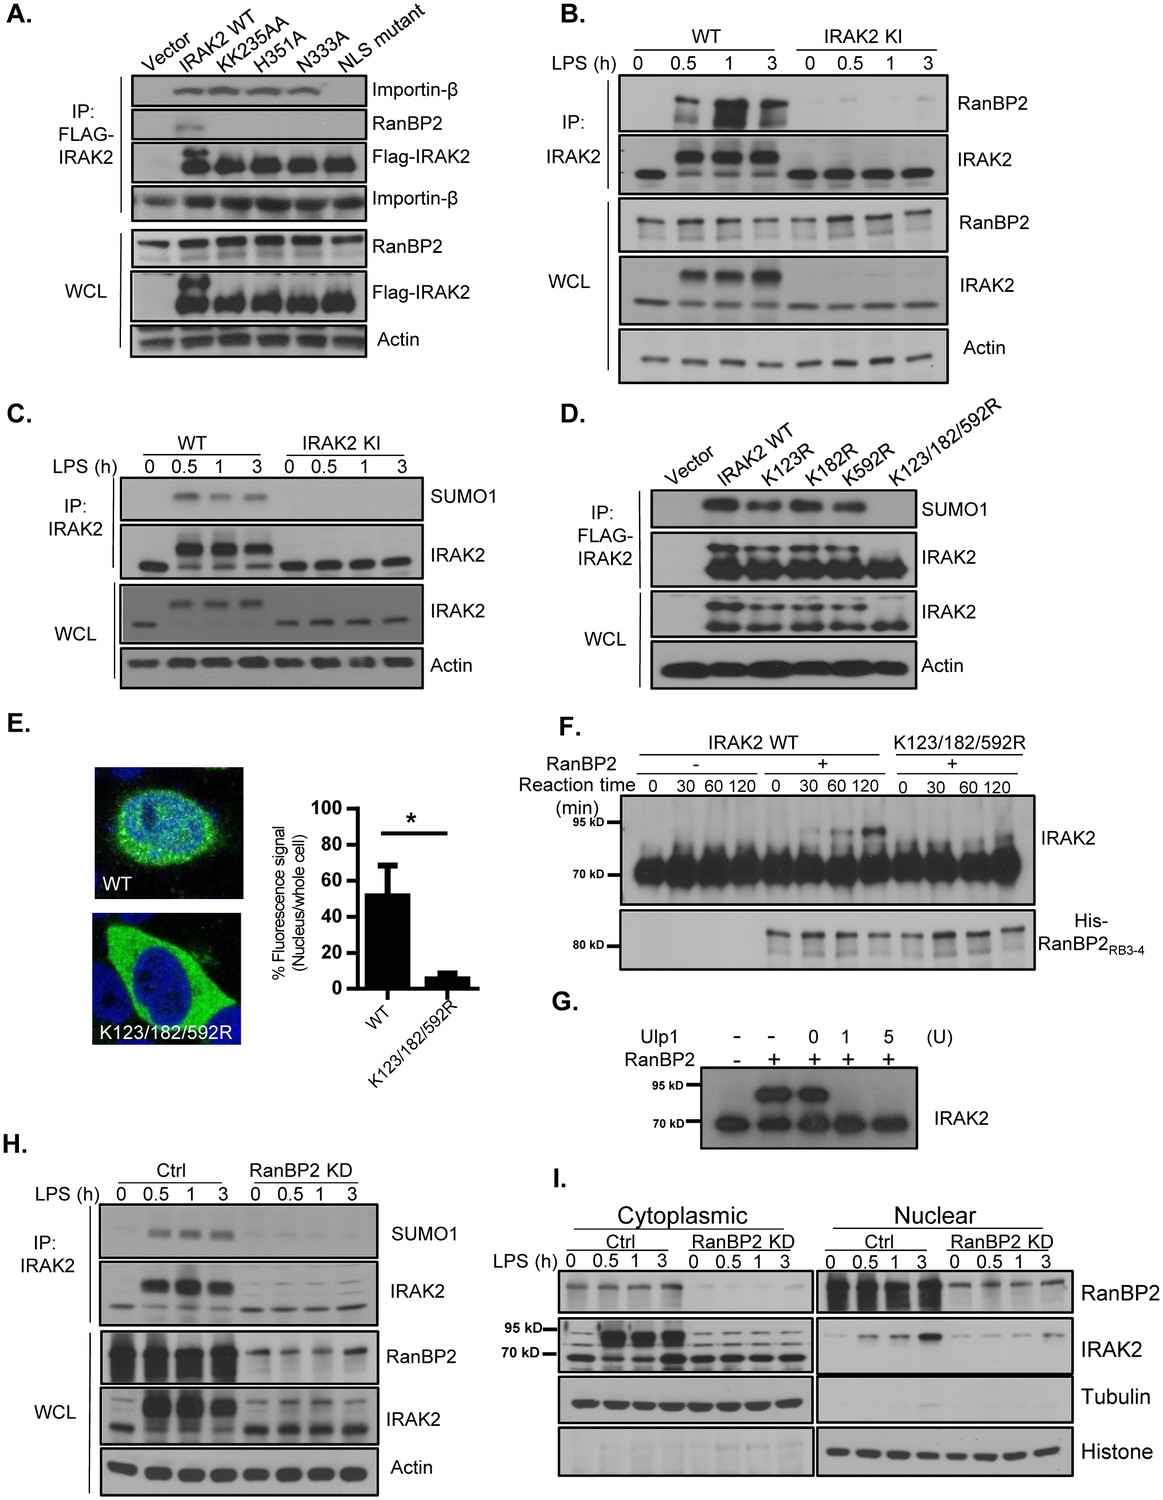
RanBP2 mediates LPS-induced IRAK2 sumoylation.
(A) HeLa cells transiently transfected with FLAG-tagged IRAK2 WT, KK235AA, H351A, N333A and NLS mutant (K361/362/364A) followed by immunoprecipitation (IP) with anti-FLAG antibody and analyzed by western blot analysis with the indicated antibodies. (B) Wild-type (WT) and IRAK2 kinase inactive (KI) BMDMs were treated with LPS for indicated times, followed by immunoprecipitation (IP) with anti-IRAK2 antibody and analyzed by western blot analysis with the indicated antibodies. (C) WT and IRAK2 KI BMDMs were treated with LPS for the indicated times, followed by immunoprecipitation (IP) with anti-IRAK2 antibody under the denaturing condition (0.1% SDS in the lysis buffer) and analyzed by western blot analysis with the indicated antibodies. (D) HeLa cells transiently transfected with FLAG-tagged IRAK2 WT, K123R, K182R, K592R and K123/182/592R mutant followed by immunoprecipitation (IP) with anti-FLAG antibody under the denaturing condition (0.1% SDS in the lysis buffer) and analyzed by western blot analysis with the indicated antibodies. (E) Confocal imaging of HeLa cells transiently transfected with FLAG-tagged IRAK2 WT and K123/182/592R. Immunostaining was performed with anti-FLAG (green) on the transfected cells. Nuclei were stained with DAPI in blue. Fluorescence intensity was quantified in the nucleus versus the whole cell of 50 expressing cells and analyzed by Student’s t test. Bar graph shows the percentage of fluorescent signal in the nucleus in expressing cells. Data represent mean ± SD; *p<0.05. (F–G) In vitro sumoylation assay using purified recombinant Aos1/Uba2 (E1), UBC9 (E2), RanBP2RB3-4 (E3), SUMO1 and IRAK2 WT and IRAK2 K123/182/592R, following by western blot analysis with anti-IRAK2 antibody. RanBP2 was detected by western blot prior to the reaction using anti-His antibody. IRAK2 was sumoylated in vitro, followed by incubation with Ulp1 (1 unit and 5 unit) for 30 min (G). (H) Control (non-targeting siRNA) and RanBP2 knockdown (KD, with RanBP2 siRNA) macrophages were treated with LPS for the indicated times, followed by immunoprecipitation (IP) with anti-IRAK2 antibody and analyzed by western blot analysis with the indicated antibodies.(I) Cytoplasmic and nuclear extracts from Control (non-targeting siRNA) and RanBP2 knockdown (KD, with RanBP2 siRNA) treated with LPS for indicated times were analyzed by western blot analysis with the indicated antibodies. The experiments were repeated for five times with similar results. Data represent mean ± SEM; *p<0.05 by Student’s t test.
-
Figure 2—source data 1
The numerical data for the graphs in Figure 2E.
- https://doi.org/10.7554/eLife.29630.017
Figure 2—figure supplement 1
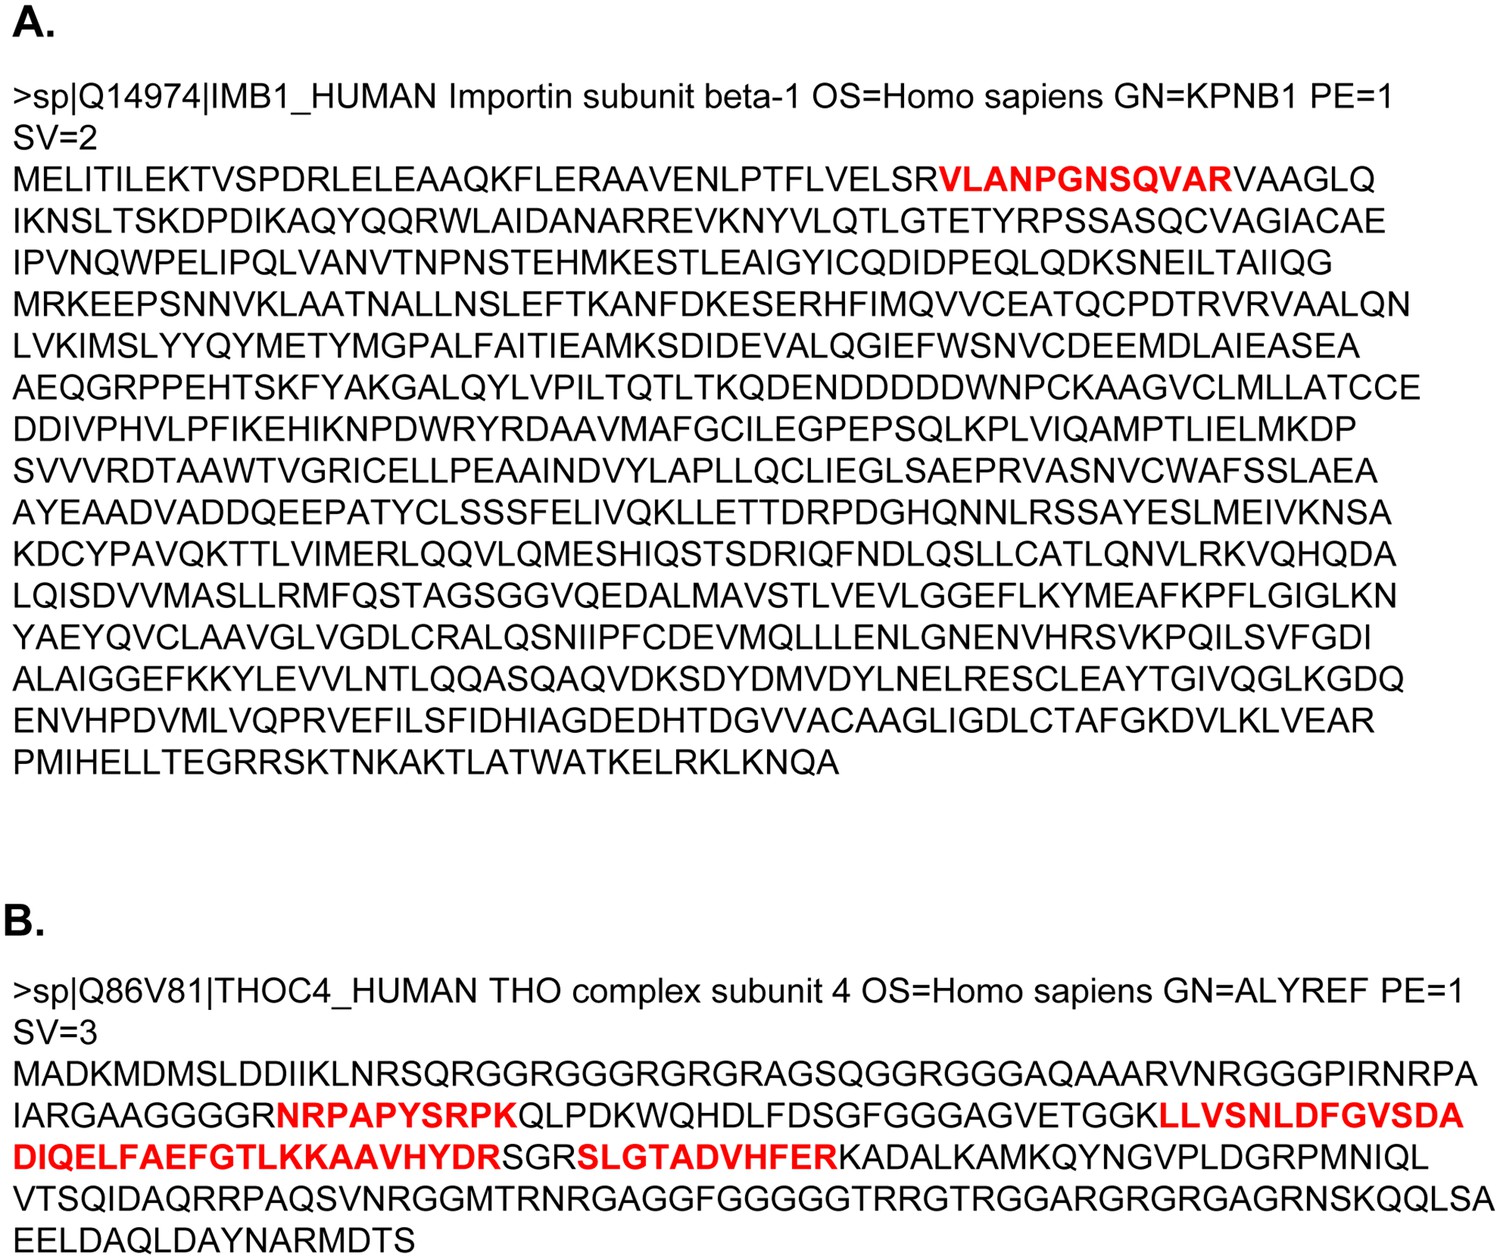
IL1R-293 cells were transiently transfected with HA-tagged IRAK2 and treated by IL-1.
Anti-HA antibody was used for co-immunoprecipitation assay to search for potential IRAK2-interacting proteins. The highlighted amino acid sequences of Importin-β−2 (A) and ALYREF (B) were identified by the mass spectrometry analysis.
-
Figure 2—figure supplement 1—source data 1
The numerical data for the graphs in Figure 2—figure supplement 2.
(A) for Figure 2—figure supplement 2. (B) for Figure 2—figure supplement 3.
- https://doi.org/10.7554/eLife.29630.011
Figure 2—figure supplement 2
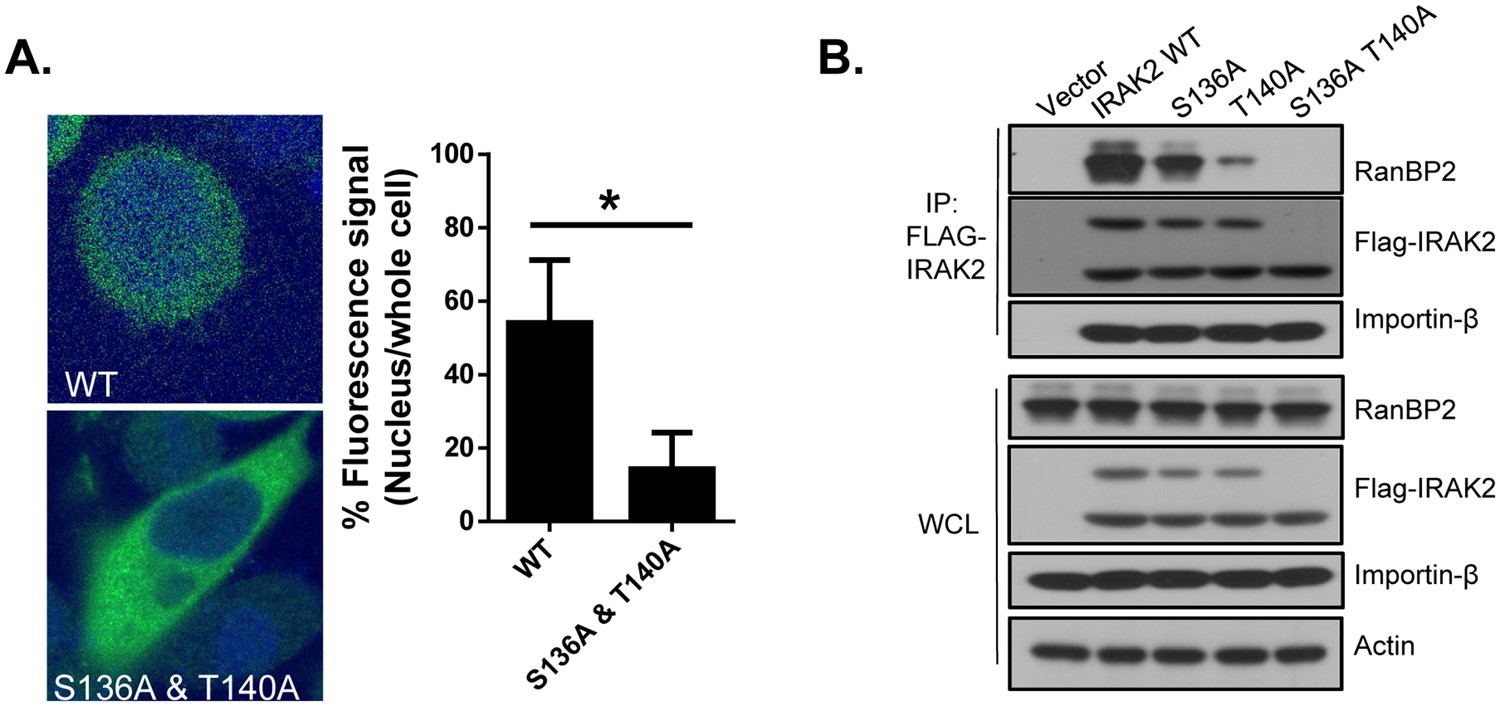
The phosphorylation of IRAK2 is required for its nuclear translocation.
(A) Confocal imaging of HeLa cells transiently transfected with FLAG-tagged IRAK2 WT and S136A/T140A double mutant. For Flag-tagged construct, immunostaining was performed with anti-FLAG (green) on the transfected cells. Nuclei were stained with DAPI in blue. Fluorescence intensity was quantified in the nucleus versus the whole cell of 50 expressing cells and analyzed by Student’s t test. Bar graph shows the percentage of fluorescent signal in the nucleus in expressing cells. Data represent mean ± SEM; *p<0.05 by Student’s t test. (B) HeLa cells transiently transfected with FLAG-tagged IRAK2 WT, S136A, T140A, and double mutant followed by immunoprecipitation (IP) with anti-FLAG antibody and analyzed by western blot analysis with the indicated antibodies.
Figure 2—figure supplement 3
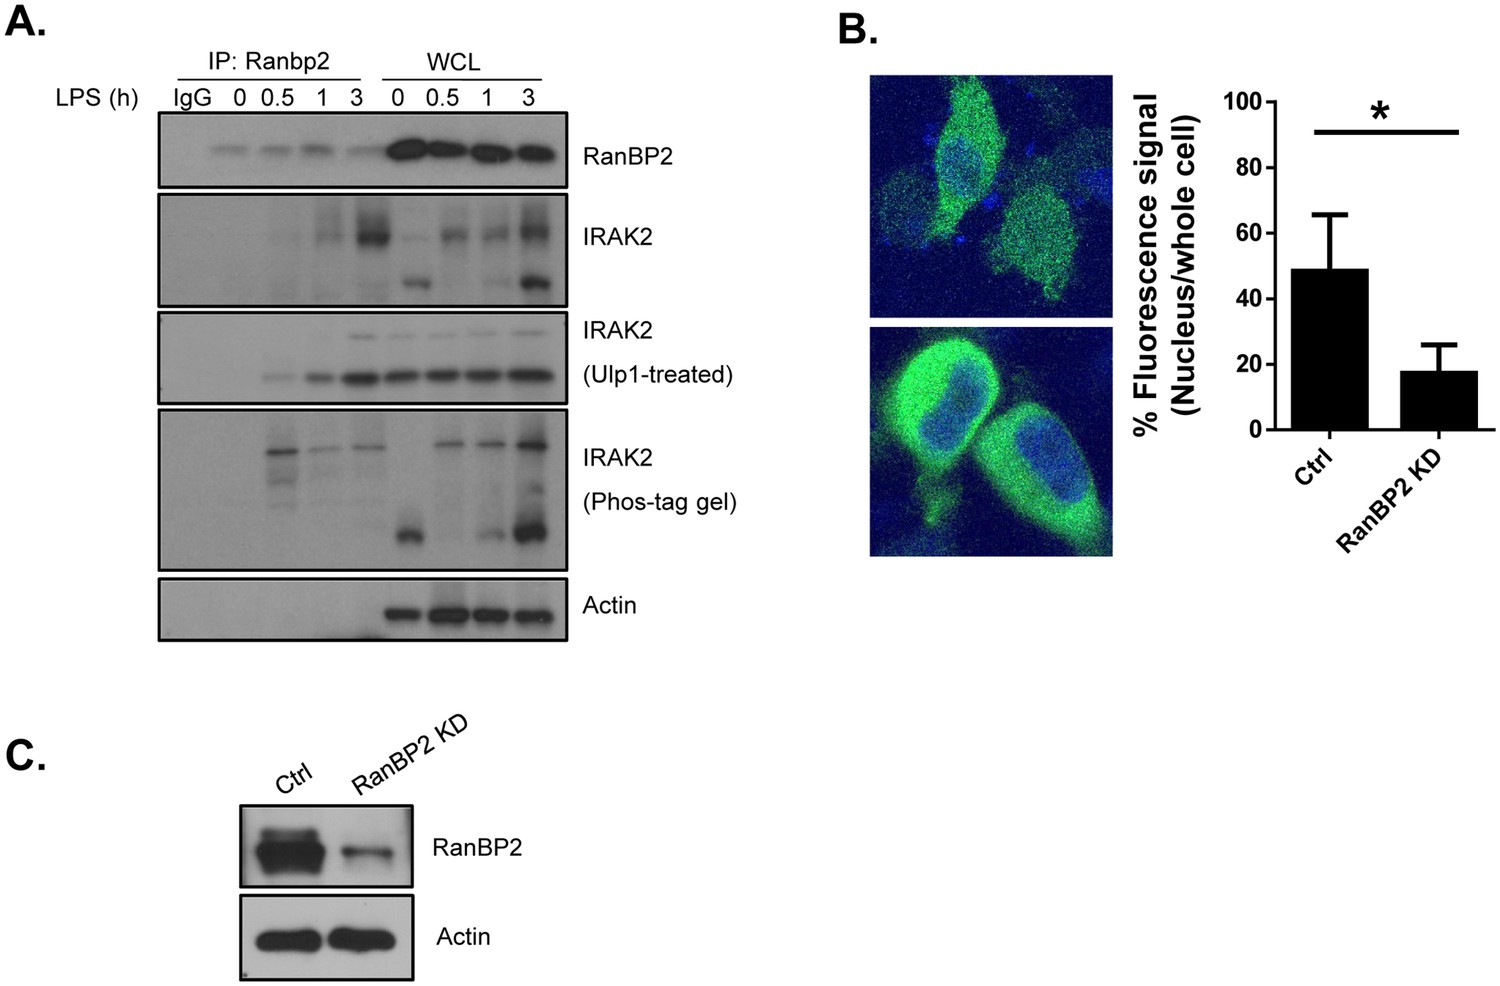
RanBP2 mediates IRAK2 nuclear translocation.
(A) Wild-type (BMDMs were treated with LPS for the indicated times, followed by immunoprecipitation (IP) with anti-RanBP2 antibody and treated with/without Ulp1 (5 unit) for 30 min analyzed by western blotting with the indicated antibodies. Phos-tag acrylamide gel was used to detect the phosphorylation of IRAK2. (B) Confocal imaging of control and RanBP2 knockdown (KD) HeLa cells transiently transfected with FLAG-tagged IRAK2 WT. For Flag-tagged construct, immunostaining was performed with anti-FLAG (green) on the transfected cells. Nuclei were stained with DAPI in blue. Fluorescence intensity was quantified in the nucleus versus the whole cell of 50 expressing cells and analyzed by Student’s t test. Bar graph shows the percentage of fluorescent signal in the nucleus in expressing cells. Data represent mean ± SEM; *p<0.05 by Student’s t test. (C) Western blot analysis from cells used in panel B. with indicated antibodies.
Figure 2—figure supplement 4
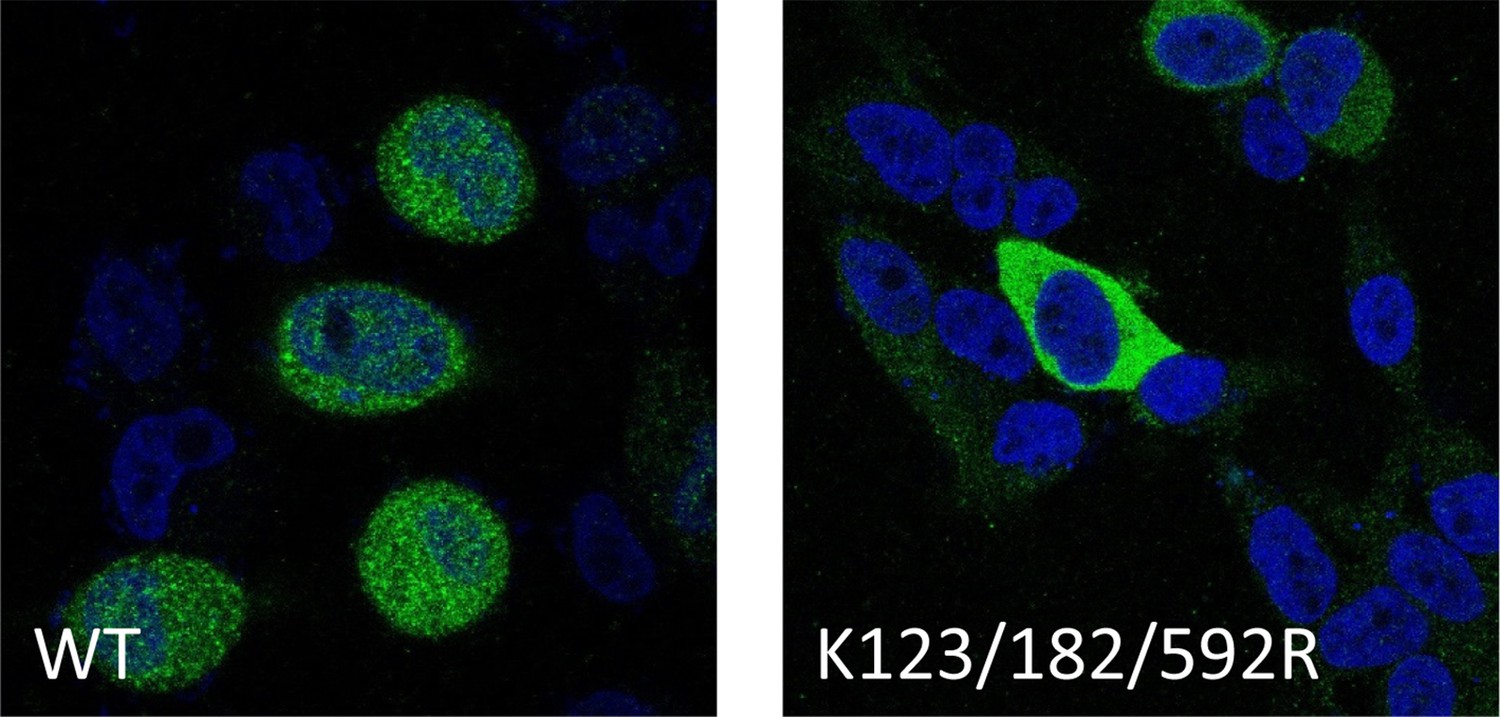
Lower magnification of the confocal imaging in showing in Figure 2E.
Confocal imaging of HeLa cells transiently transfected with FLAG-tagged IRAK2 WT, and K123/182/592R mutant. Immunostaining was performed with anti-FLAG (green) on the transfected cells. Nuclei were stained with DAPI in blue.
Figure 2—figure supplement 5
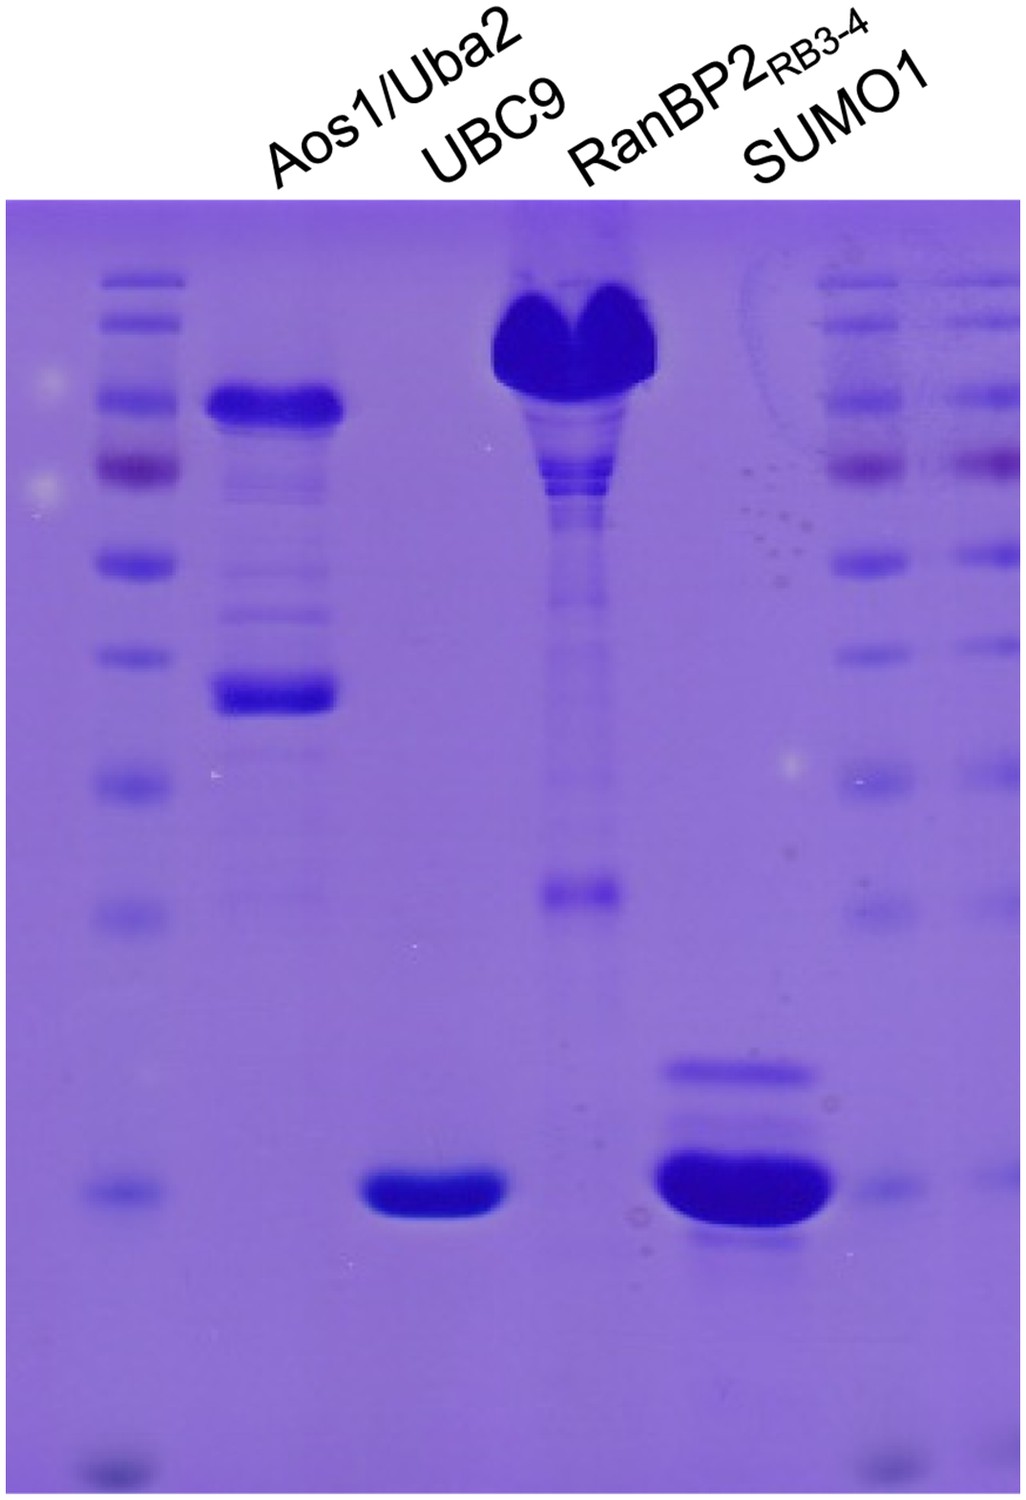
Coomassie blue staining of purified recombinant Aos1/Uba2 (E1), UBC9 (E2), RanBP2 (E3) and SUMO1.
https://doi.org/10.7554/eLife.29630.015
Figure 2—figure supplement 6
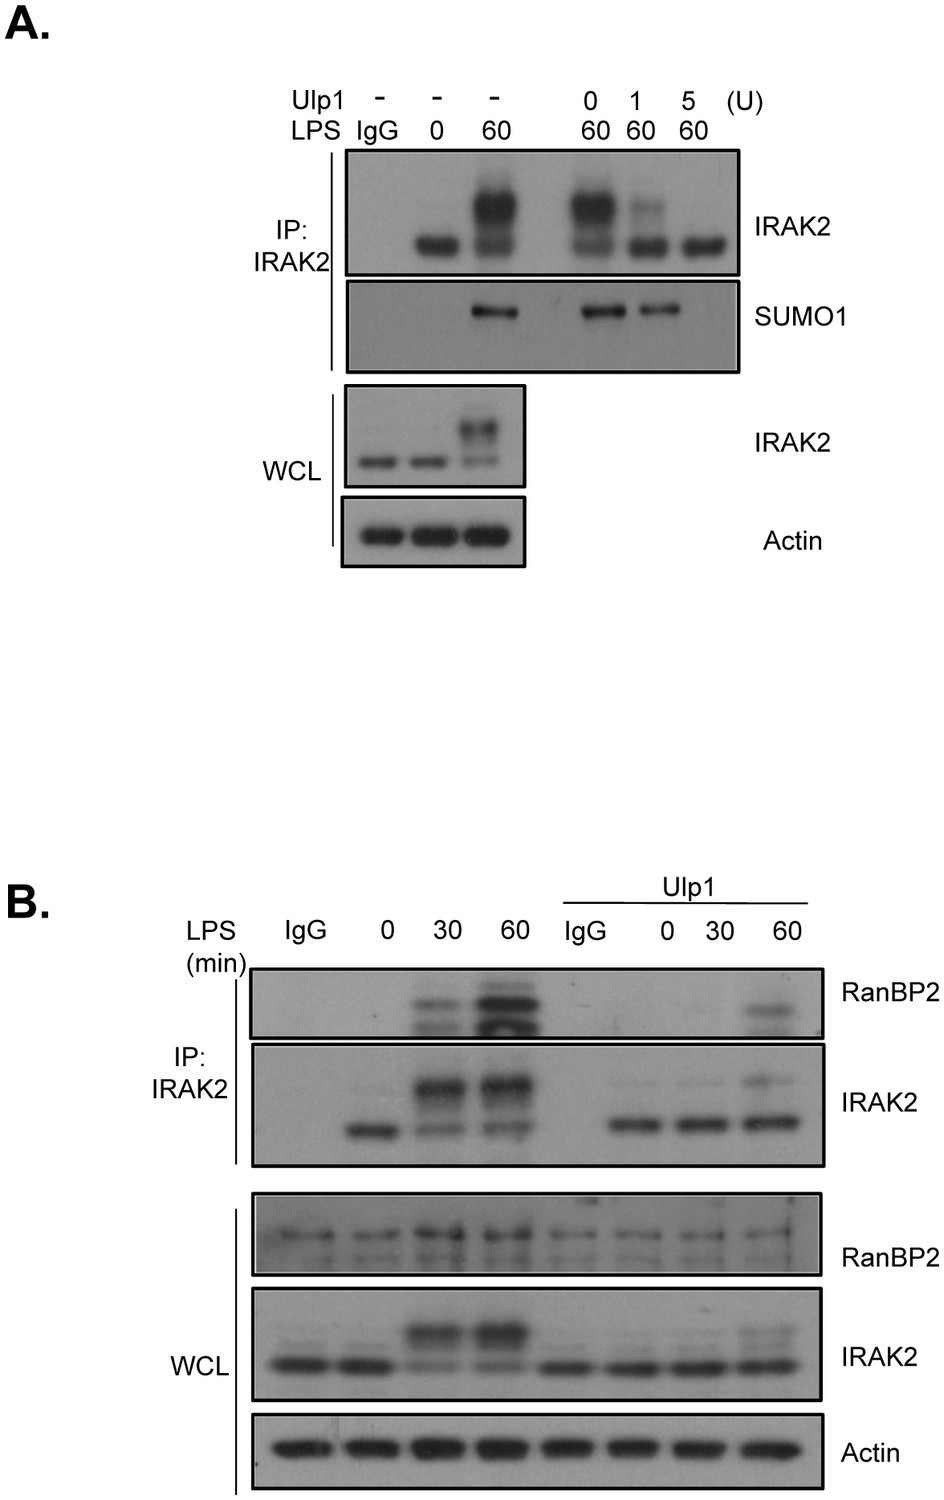
SUMO protease Ulp1 removes IRAK2 modification.
(A) WT BMDMs were treated with LPS for the indicated times, followed by immunoprecipitation (IP) with anti-IRAK2 antibody under the denaturing condition (0.1% SDS in the lysis buffer), followed by incubation with Ulp1 (5 unit) for 30 min. The samples were analyzed by western blot analysis with the indicated antibodies. (B) WT BMDMs were treated with LPS for indicated times. The cell lysates were treated with/without Ulp1 (10 unit) for 60 min followed by immunoprecipitation (IP) with anti-IRAK2 antibody and analyzed by western blot analysis with the indicated antibodies.
Figure 3 with 4 supplements
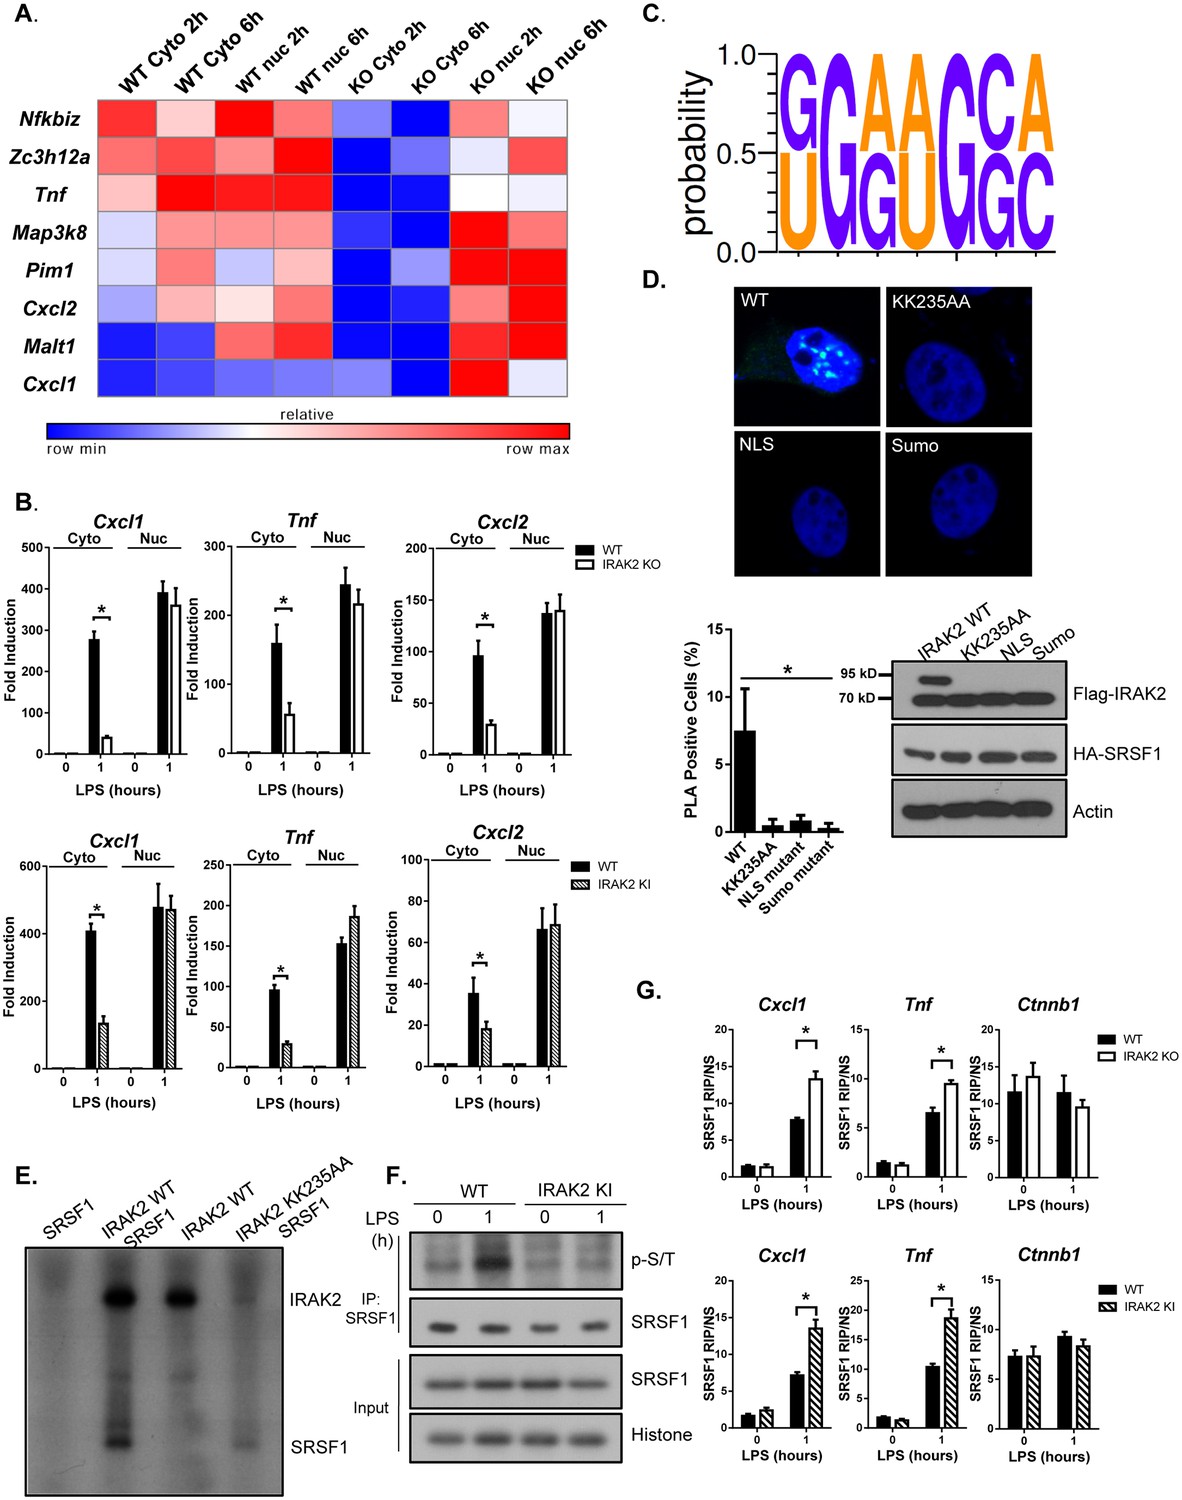
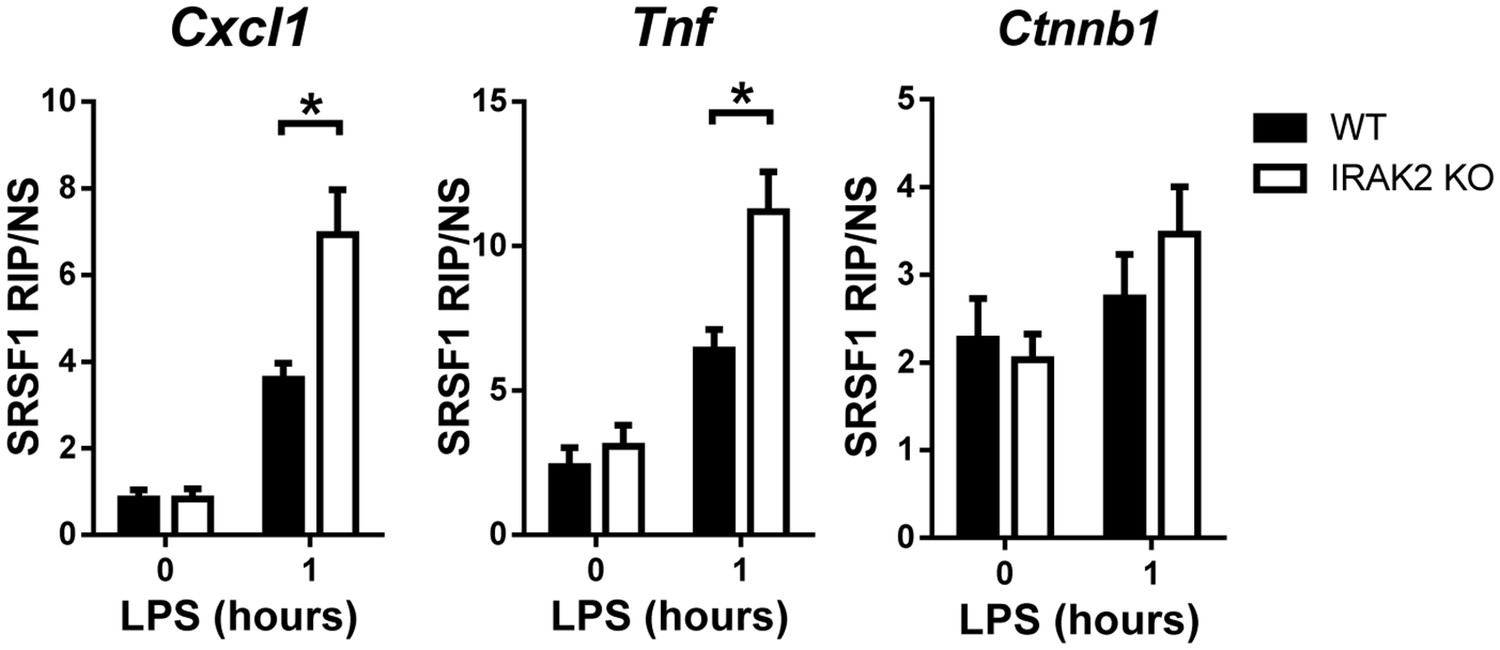
IRAK2 mediates nuclear export of mRNAs of pro-inflammatory genes.
(A) Heatmap showing the cytosolic and nuclear abundance of selected transcripts that require IRAK2 for nuclear export in response to LPS stimulation. Affymetrix microarray was performed to analyze the total mRNAs isolated from the cytoplasmic and nuclear fractions of 3 pairs of WT and IRAK2 knockout (KO) BMDMs treated with LPS for the indicated times. Transcripts-induced by LPS in the nuclei of both WT and KO cells were further ranked based on an index (I) that measures the impact of IRAK2 deficiency on transcript nuclear retention (See Materials and methods section). Scaled expression levels of transcripts encoding pro-inflammatory cytokines and chemokines are shown from blue to red, indicating low to high expression. (B) Total mRNAs isolated from the cytoplasmic and nuclear fractions of WT, IRAK2 KO and IRAK2 kinase-inactive (KI) BMDMs treated with LPS for the indicated times were subjected to RT-PCR analyses. (C) RNA-READ motif scanner, a regression-based framework which searches for previously defined RNA cis-motif was performed and the binding sites of SRSF1 (KGRWGSM, K: G/U; R:G/A; W:A/U; S:G/C; M:A/C) are significantly enriched in the 3’UTRs of the positive set versus the negative set (Materials and methods). (D) Confocal imaging of PLA (proximity ligation assay) signal of Hela cells transfected with HA-tagged SRSF1 together with FLAG-tagged IRAK2 WT, KK235AA, NLS mutant (K361/362/364A) and Sumo mutant (K123/182/592R). Mouse anti-HA and Rabbit anti-FLAG antibody were used for the proximity ligation assay. Green dots present PLA positive signal indicating the interaction of IRAK2 with SRSF1. Bar graph shows the percentage of PLA positive cells analyzed by Student’s t test. *p<0.05. Western blot analysis of Hela cells transfected with HA-tagged SRSF1 together with FLAG-tagged IRAK2 WT, KK235AA, NLS mutant (K361/362/364A) and Sumo mutant (K123/182/592R) with the indicated antibody. (E) Phosphorylation of SRSF1 by IRAK2 was assessed by in vitro kinase assay using recombinant IRAK2 and SRSF1. (F) WT and IRAK2 KI BMDMs treated with LPS for the indicated times, followed by immunoprecipitation (IP) with anti-SRSF1 antibody under denaturing condition (0.1% SDS in the lysis buffer) and analyzed by western blot analysis with the indicated antibodies. (G) WT, IRAK2 KO and IRAK2 KI BMDMs were treated with LPS for indicated times, followed by RNA immunoprecipitation with anti-SRSF1 antibody and RT-PCR analyses of the indicated mRNAs. The presented are the relative values normalized against IgG control (Materials and methods). The experiments were repeated for five times with similar results. Data represent mean ± SEM; *p<0.05 by Student’s t test.
-
Figure 3—source data 1
The numerical data for the graphs in Figure 3.
- https://doi.org/10.7554/eLife.29630.024
Figure 3—figure supplement 1
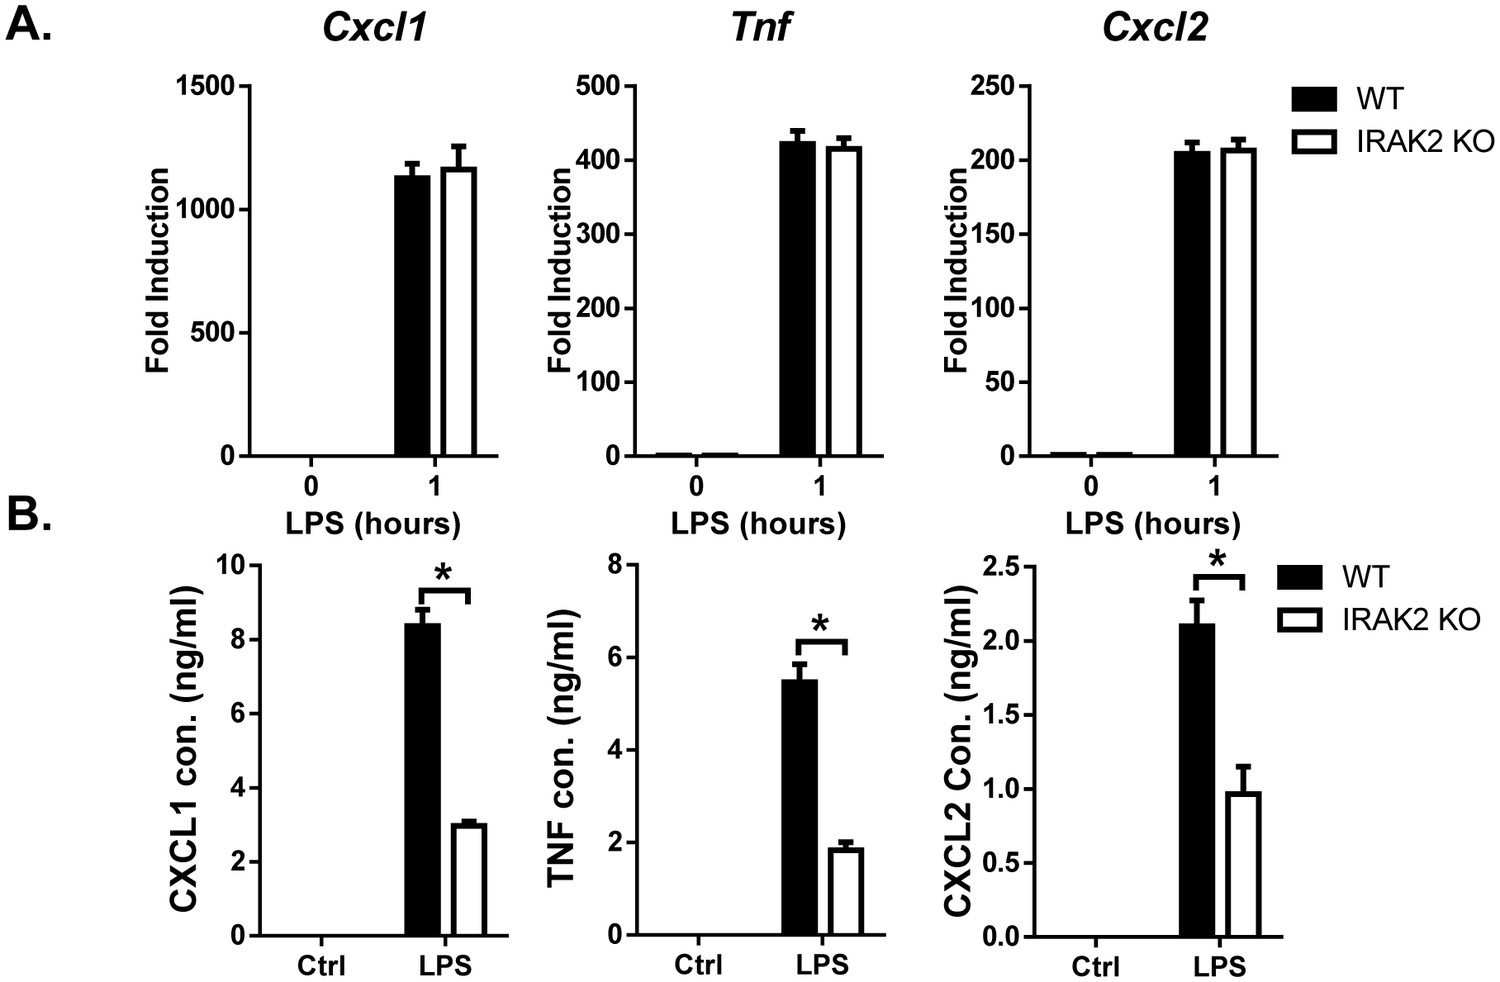
IRAK2 is required for the posttranscriptional regulation of inflammatory genes in response to LPS stimulation.
(A) RT-PCR analysis of RNA samples from wild-type and IRAK2 KO macrophages untreated or treated with LPS for 1 hr. (B) ELISA assay of the supernatant from wild-type and IRAK2 KO macrophages untreated or treated with LPS for 8 hr.
-
Figure 3—figure supplement 1—source data 1
The numerical data for the graphs in Figure 3—figure supplement 3.
(A) for Figure 3—figure supplement 1A. (B) for Figure 3—figure supplement 1A. (C) Figure 3—figure supplement 4.
- https://doi.org/10.7554/eLife.29630.020
Figure 3—figure supplement 2
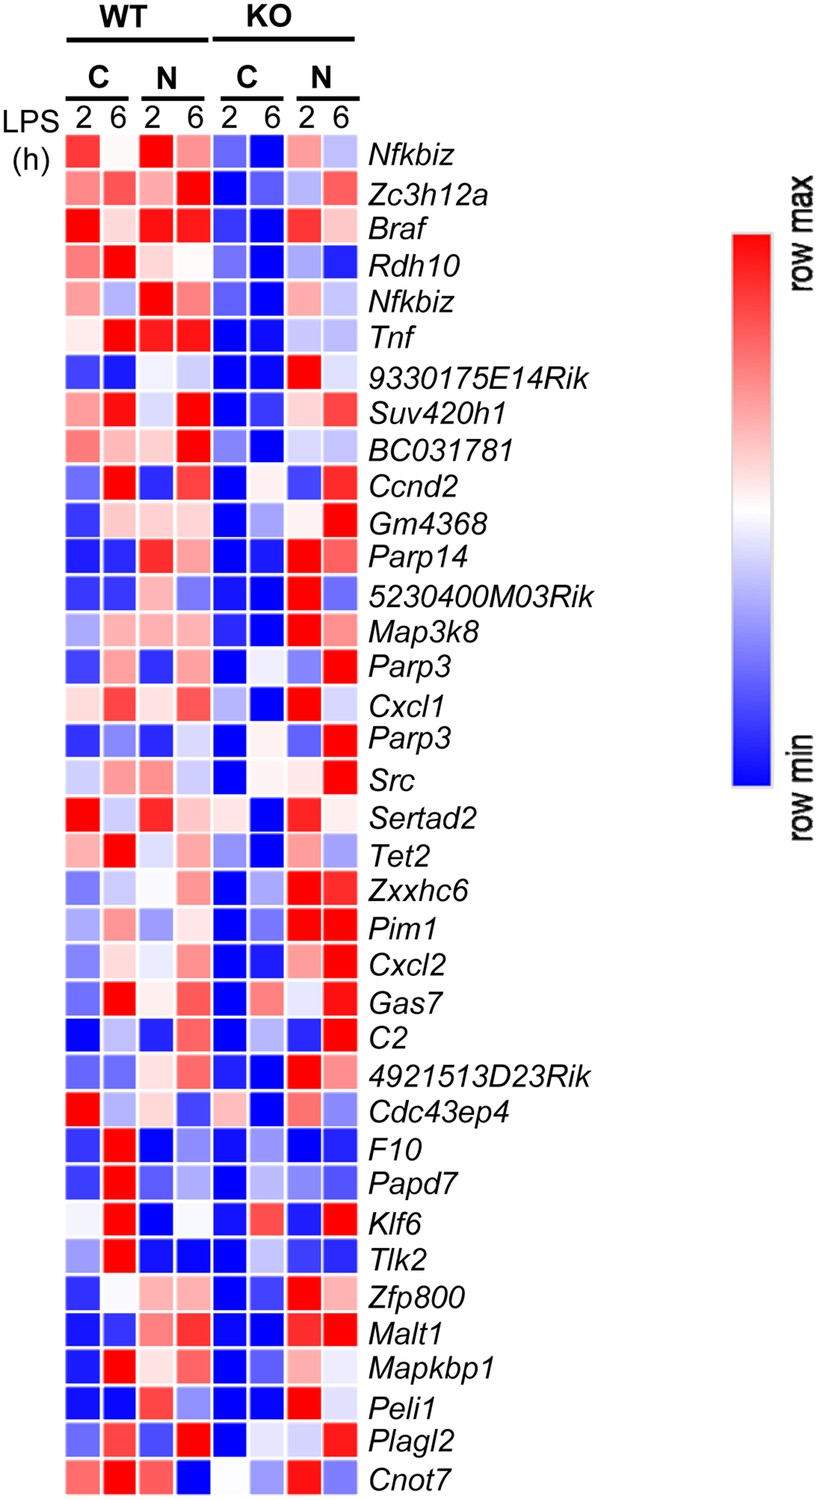
Heatmap showing the cytosolic and nuclear abundance of selected transcripts that require IRAK2 for nuclear export in response to LPS stimulation.
Affymetrix microarray was performed to analyze the total mRNAs isolated from the cytoplasmic and nuclear fractions of 3 pairs of wild-type (WT) and IRAK2 KO BMDMs treated with LPS for the indicated times. Transcripts-induced by LPS in the nuclei of both WT and KO cells were further ranked based on an index (I) that measures the impact of IRAK2 deficiency on transcript nuclear retention (See Materials and methods). Scaled expression levels of top 40 transcripts are shown from blue to red, indicating low to high expression.
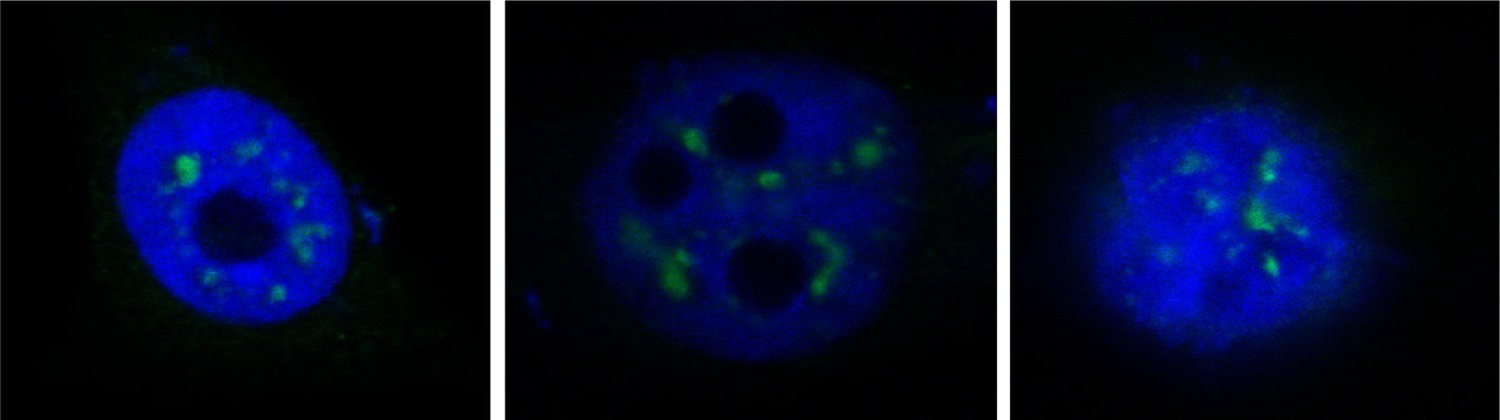
Figure 3—figure supplement 3
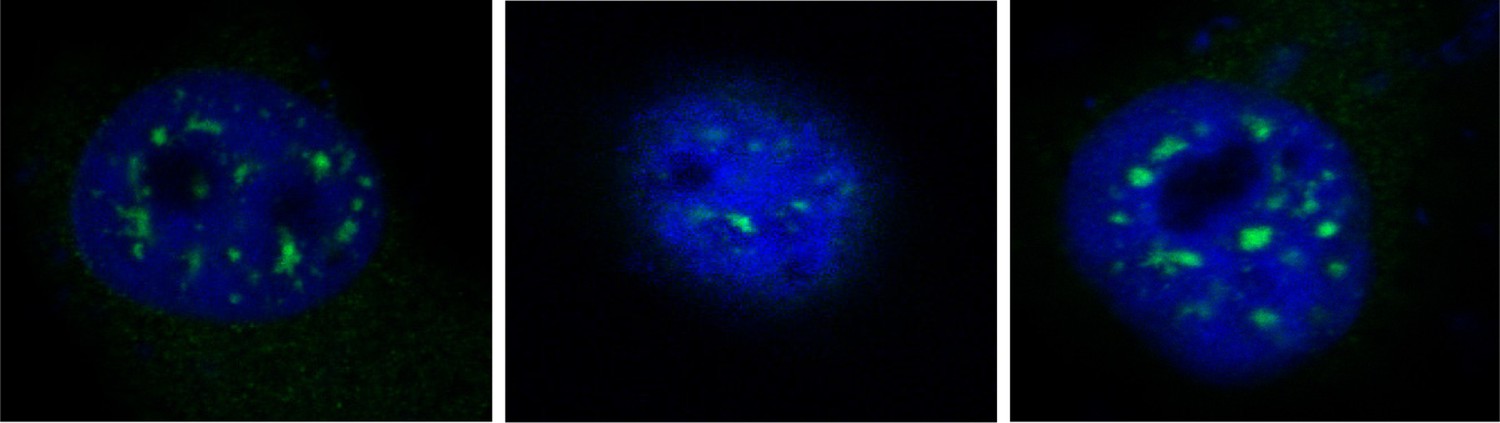
Additional Images for the proximity ligation assay showed in Figure 3D.
Hela cells were transiently transfected with FLAG-tagged IRAK2 and HA-tagged SRSF1. Mouse anti-HA and Rabbit anti-FLAG antibody were used for the proximity ligation assay. Green dots present the interaction of IRAK2 with SRSF1.
Figure 3—figure supplement 4
WT and IRAK2 KO BMDMs were treated with LPS for indicated times and fixed in 0.1% formaldehyde for 15 min at room temperature, whereupon the cross-linking reaction was stopped with glycine (pH 7; 0.25 M).
The cells were then washed twice with ice-cold PBS, resuspended in 2 ml RIPA buffer (50 mM Tris-HCl [pH 7.5], 1% NP-40, 0.5% sodium deoxycholate, 0.05% SDS, 1 mM EDTA, 150 mM NaCl, and proteinase inhibitors), and sonicated. The lysate was centrifuged and each supernatant was immunoprecipitated overnight at 4°C, using Dynabeads preincubated with anti-SRSF1 antibody. The beads were washed five times with 1 ml RIPA buffer and resuspended in 150 ml elution buffer (50 mM Tris-Cl [pH 7], 5 mM EDTA, 10 mM DTT, 1% SDS). RNA was purified from immunoprecipitates with Trizol and RT-PCR analyses of the indicated mRNAs. The presented are the relative values normalized against IgG control (Materials and methods). The experiments were repeated for five times with similar results. Data represent mean ± SEM; *p<0.05 by Student’s t test.
Figure 4 with 2 supplements
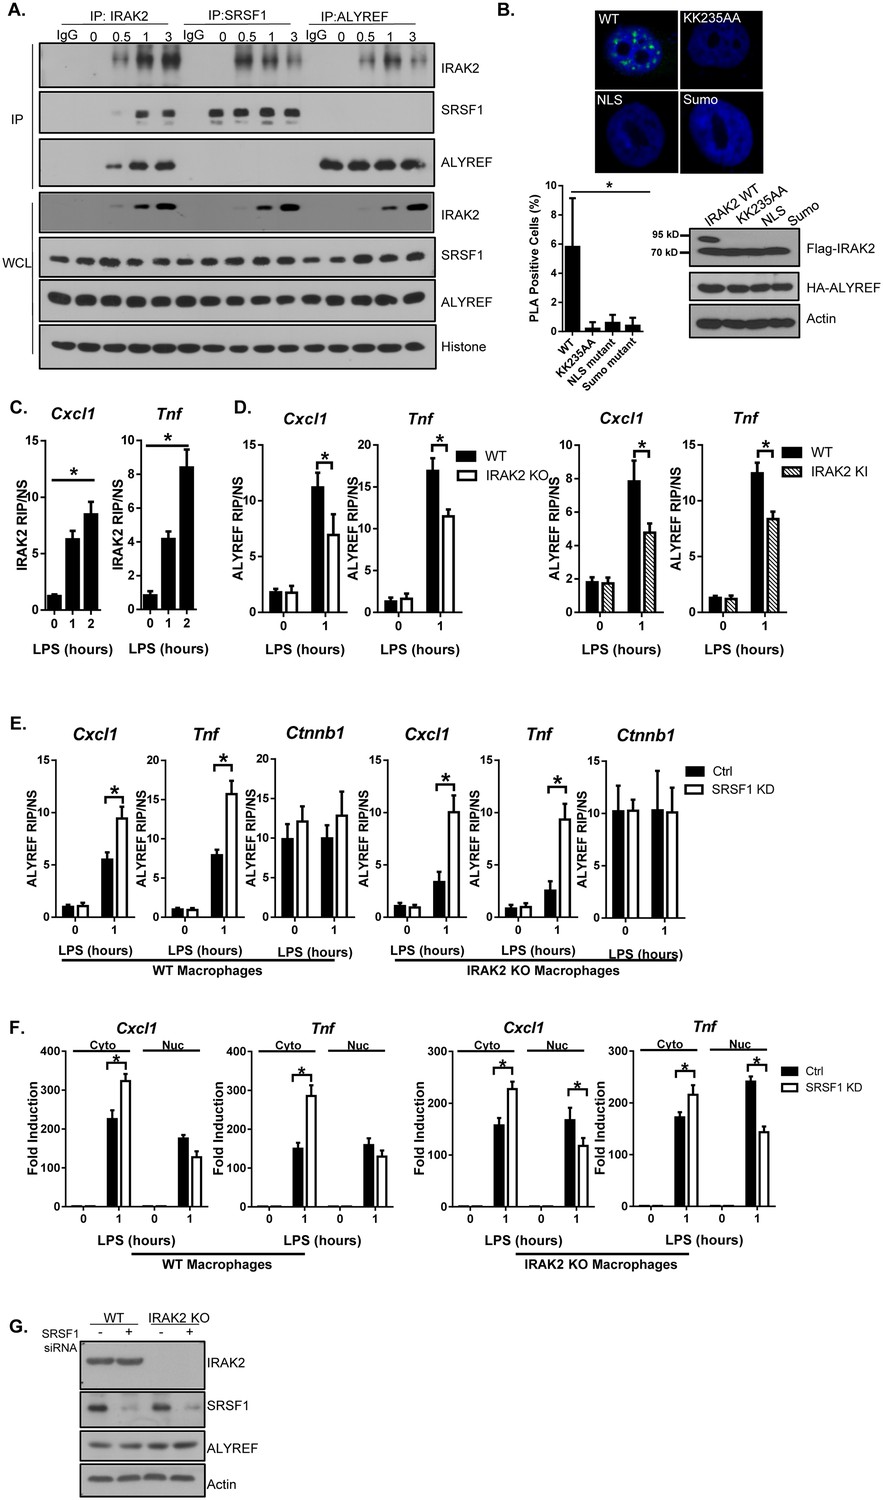
IRAK2 mediates the recruitment of ALYREF nuclear export factor to the target mRNAs.
(A) Nuclear extracts were isolated from Wild-type (WT) BMDMs treated with LPS for the indicated times, followed by immunoprecipitation (IP) with anti-IRAK2, anti-SRSF1 or anti-ALYREF and analyzed by western blot analysis with the indicated antibodies. (B) Confocal imaging of PLA (proximity ligation assay) signal of Hela cells transfected with FLAG-tagged IRAK2 WT, KK235AA, NLS mutant (K361/362/364A) and Sumo mutant (K123/182/592R). Mouse anti-ALYREF and Rabbit anti-FLAG antibody were used for the proximity ligation assay. Green dots present PLA positive signal indicating the interaction of IRAK2 with ALYREF. Bar graph shows the percentage of PLA positive cells analyzed by Student’s t test. *p<0.05. Western blot analysis of Hela cells transfected with FLAG-tagged IRAK2 WT, KK235AA, NLS mutant (K361/362/364A) and Sumo mutant (K123/182/592R) with the indicated antibody. (C) WT BMDMs were treated with LPS for the indicated times, followed by RNA immunoprecipitation with anti-IRAK2 antibody and RT-PCR analyses of the indicated mRNAs. The presented are the relative values normalized against IgG control (Materials and methods). (D) WT, IRAK2 KO and IRAK2 KI BMDMs were treated with LPS for the indicated times, followed by RNA immunoprecipitation with anti-ALYREF antibody and RT-PCR analyses of the indicated mRNAs. The presented are the relative values normalized against IgG control (Materials and methods). (E–G) SRSF1 was knocked down in WT and IRAK2 KO macrophages. The SRSF1-knockdown cells were then treated with LPS for the indicated times, followed by RNA immunoprecipitation with anti-ALYREF and RT-PCR analyses of the indicated mRNAs. The presented are the relative values normalized against IgG control (Materials and methods) (E). Total mRNAs were isolated from the cytoplasmic and nuclear fractions of The SRSF1-knockdown cells treated with LPS for the indicated times, followed by RT-PCR analyses for the indicated mRNAs (F). The experiments were repeated for at least three times. Data represent mean ± SEM; *p<0.05 by Student’s t test. (G) Western analysis of lysates from cells used in Figure 4E–F with the indicated antibodies.
-
Figure 4—source data 1
The numerical data for the graphs in Figure 4.
- https://doi.org/10.7554/eLife.29630.029
Figure 4—figure supplement 1
Additional images for the proximity ligation assay showed in Figure 4B.
Hela cells were transiently transfected with FLAG-tagged IRAK2. Mouse anti-ALYREF and Rabbit anti-FLAG antibody were used for the proximity ligation assay. Green dots present the interaction of IRAK2 with ALYREF.
Figure 4—figure supplement 2
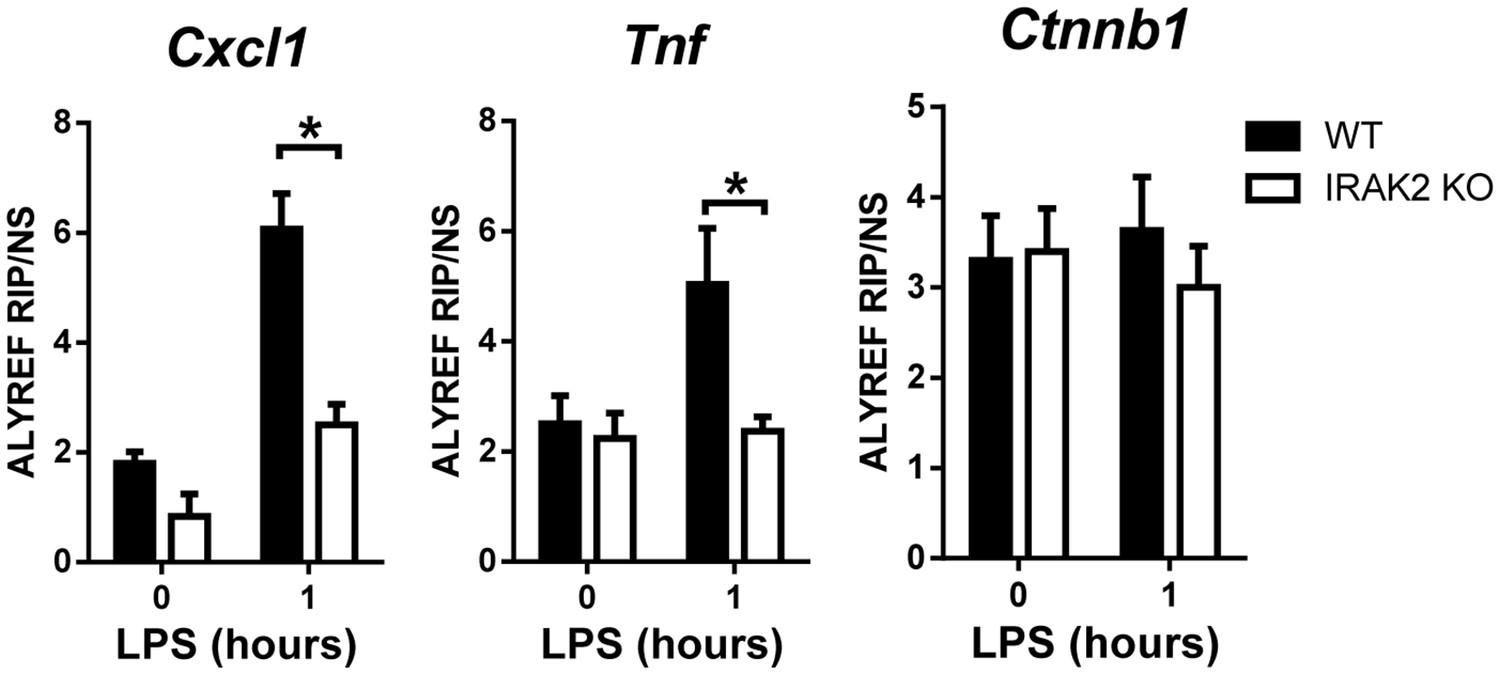
IRAK2 is requried for the recruitment of ALYREF to the target mRNAs.
https://doi.org/10.7554/eLife.29630.027-
Figure 4—figure supplement 2—source data 1
The numerical data for the graph in Figure 4—figure supplement 2.
- https://doi.org/10.7554/eLife.29630.028
Figure 5

IRAK2-ALYREF facilitates the assembly of nuclear export complex on target mRNAs.
(A) Nuclear extracts were isolated from Control (non-targeting siRNA) and ALYREF knockdown (KD, with ALYREF siRNA) macrophages treated with LPS for the indicated times, followed by immunoprecipitation (IP) with anti-IRAK2 and analyzed by western blot analysis with the indicated antibodies. (B) Control (non-targeting siRNA) and ALYREF knockdown (KD, with ALYREF siRNA) macrophages were treated with LPS for the indicated times, followed by RNA immunoprecipitation with anti-Nxf1 antibody and RT-PCR analyses of the indicated mRNAs. The presented are the relative values normalized against IgG control (Materials and methods). (C) Western analysis of lysates from cells used in Figure 5B with the indicated antibodies. (D) WT and IRAK2 KO BMDMs were treated with LPS for the indicated times, followed by RNA immunoprecipitation with anti-Nxf1 antibody and RT-PCR analyses of the indicated mRNAs. The presented are the relative values normalized against IgG control (Materials and methods). (E) Total mRNAs were isolated from the cytoplasmic and nuclear fractions of Control (non-targeting siRNA) and ALYREF knockdown (KD, with ALYREF siRNA) macrophages treated with LPS for indicated times were subjected to RT-PCR analyses. (F) Control (non-targeting siRNA) and ALYREF knockdown (KD, with ALYREF siRNA) macrophages were treated with LPS for 6 hr, followed by ELISA for CXCL1 and TNF levels in the supernatant. The experiments were repeated for three times. Data represent mean ± SEM; *p<0.05 by Student’s t test.
-
Figure 5—source data 1
The numerical data for the graphs in Figure 5.
- https://doi.org/10.7554/eLife.29630.031
Figure 6 with 1 supplement
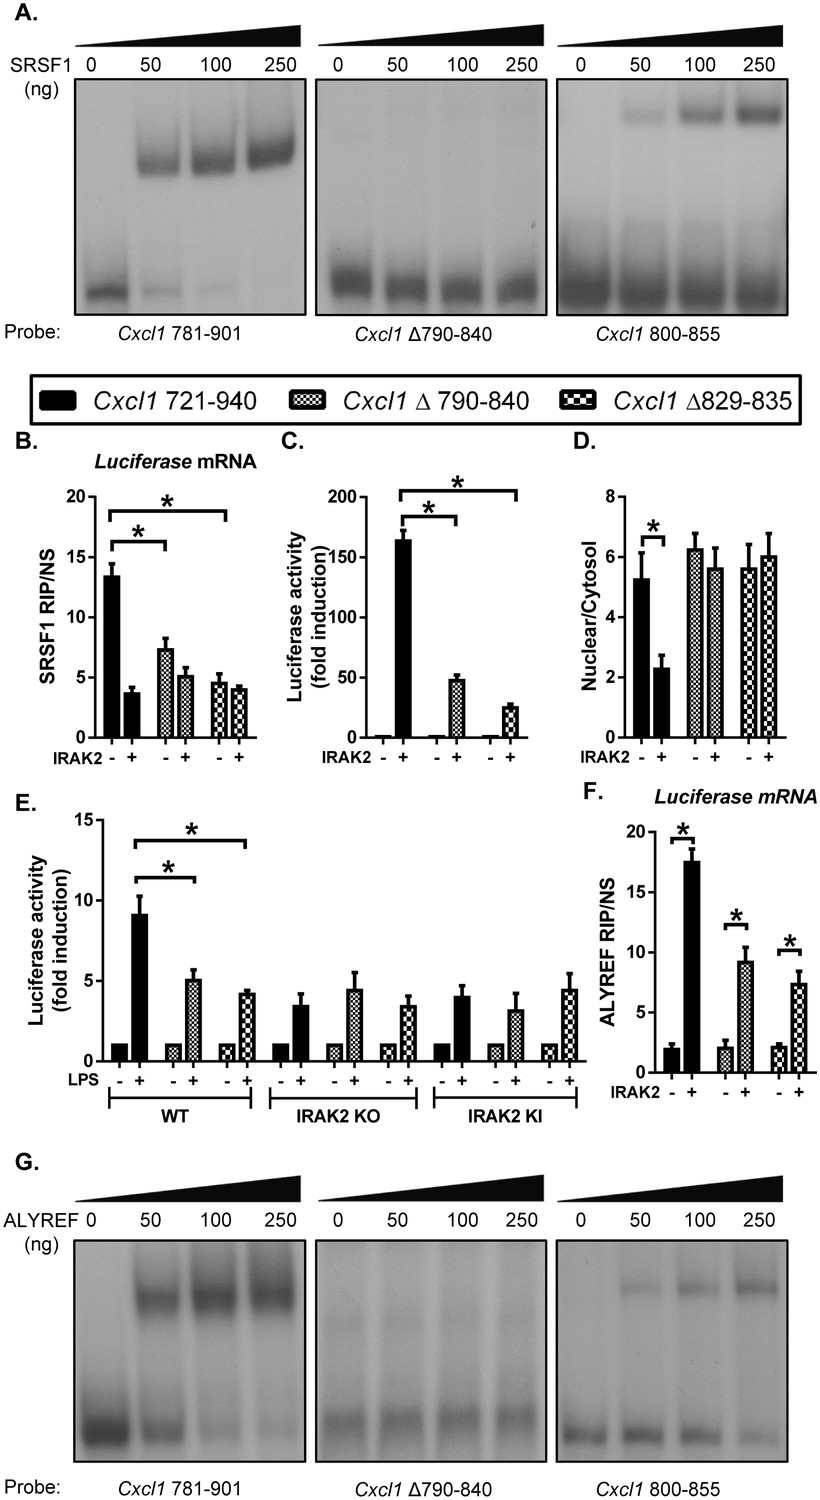
SRSF1 binding renders the LPS-sensitivity of the target mRNAs for their nuclear export.
(A) REMSA was performed to show binding of purified recombinant SRSF1 protein to the Cxcl1 3’UTR (nt 781–901), Cxcl1 3’UTR (nt Δ 790–840 in 781–901) and Cxcl1 3’UTR (800-855). (B–D) CMV-Luc- Cxcl1 3’UTR (721-940), (nt Δ 790–840 in 721–940) and (nt Δ 829–835 in 721–940) plasmids were transiently transfected in IRAK-deficient 293-IL1R (I1A) cells for 24 hr; followed by RNA immunoprecipitation with anti-SRSF1 antibody and RT-PCR analyses of the indicated mRNAs, the presented are the relative values normalized against IgG control (Material and methods) (B); Luciferase activity was measured (C); RT-PCR analysis of total mRNAs isolated from the cytoplasmic and nuclear fractions (D). (E) CMV-Luc- Cxcl1 3’UTR (721-940), (nt Δ 790–840 in 721–940) and (nt Δ 829–835 in 721–940) plasmid were transiently transfected in wild-type, IRAK2 KO and IRAK2 KI macrophages and treated with LPS for 12 hr, followed by luciferase assay. (F) For the transfected cells as described in Figure 6B–D, cell lysates were subjected to RNA immunoprecipitation with anti-ALYREF antibody and RT-PCR analyses of the indicated mRNAs. The presented are the relative values normalized against IgG control (Materials and methods). (G) REMSA was performed to show binding of purified recombinant ALYREF protein to the Cxcl1 3’UTR (nt 781–901), Cxcl1 3’UTR (nt Δ 790–840 in 781–901) and Cxcl1 3’UTR (800-855). Data represent mean ± SEM; *p<0.05 by Student’s t test.
-
Figure 6—source data 1
The numerical data for the graphs in Figure 6.
- https://doi.org/10.7554/eLife.29630.034
Figure 6—figure supplement 1
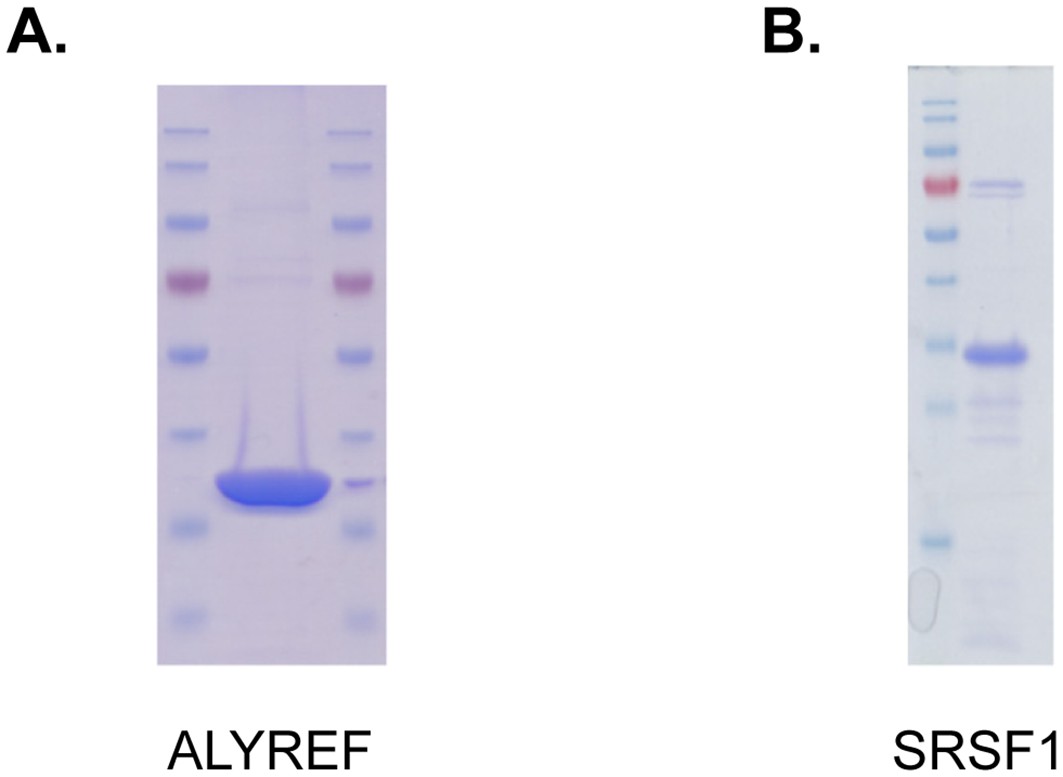
Coomassie blue staining of purified recombinant ALYREF and SRSF1.
https://doi.org/10.7554/eLife.29630.033
Figure 7
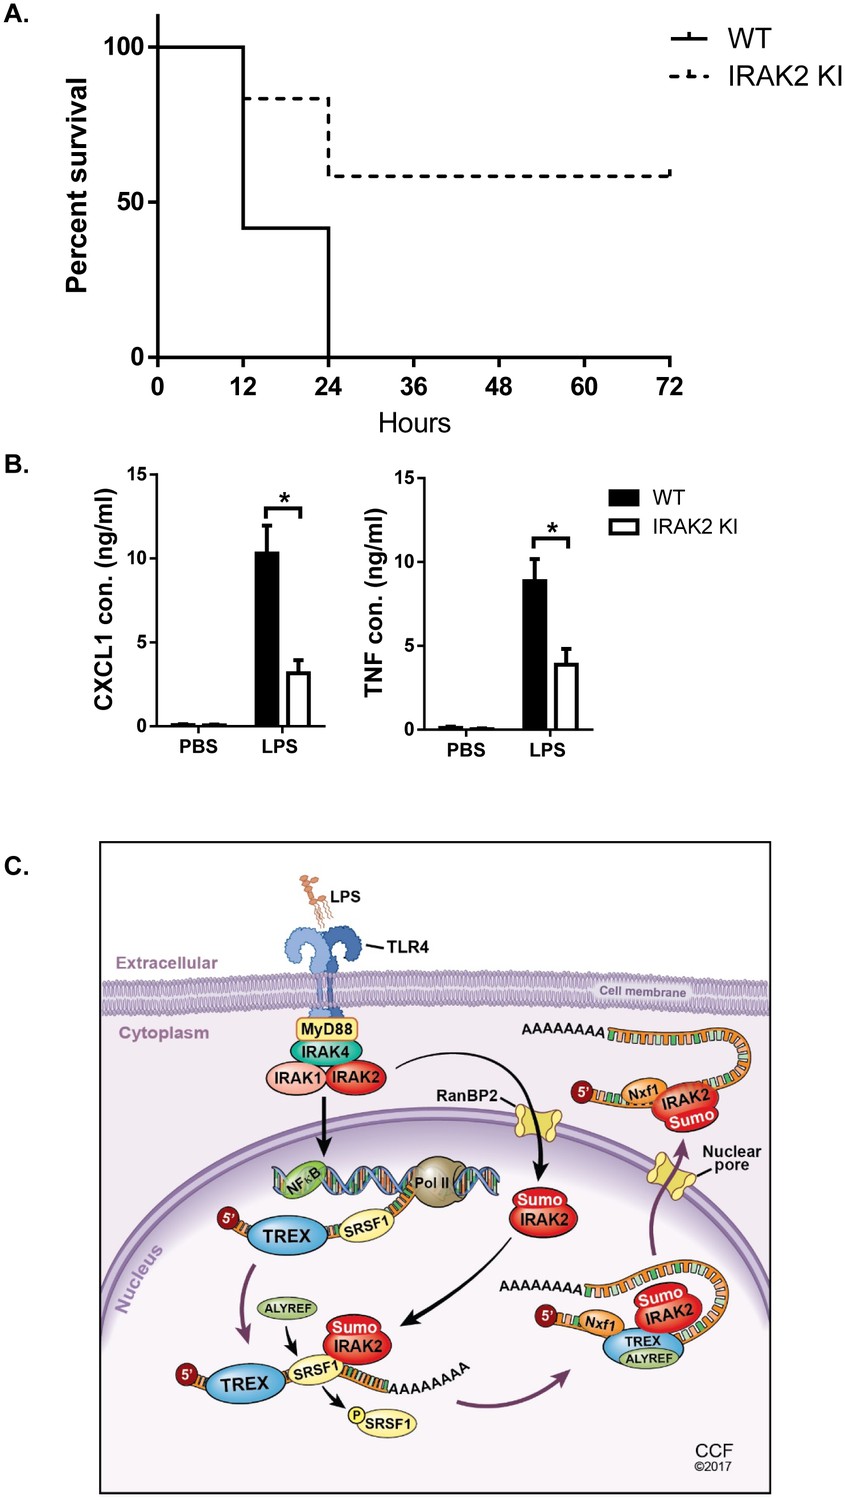
IRAK2 kinase-inactive knock-in mice are resistant to LPS-induced septic shock.
10 pairs Wild-type (WT) and IRAK2 kinase-inactive (KI) mice were injected intraperitoneally with 10 mg LPS/kg, and the survival of injected mice was monitored for 72 hr. (A) The survival curves were created by the method of Kaplan and Meier. (B) ELISA was performed for the levels of TNF and CXCL1 in the plasma 4 hr after LPS challenge. Data represent mean ± SEM; *p<0.05 by Student’s t test. (C) Model for the nuclear function of IRAK2. Upon LPS stimulation, IRAK2 is activated, followed by RanBP2-mediated sumoylation and subsequent nuclear translocation. Nuclear IRAK2 then phosphorylates SRSF1 and reduces SRSF1 binding to the target mRNAs which promotes the RNA binding of the nuclear export adaptor ALYREF and export receptor Nxf1 loading for export of mRNAs.
-
Figure 7—source data 1
The numerical data for the graphs in Figure 7.
- https://doi.org/10.7554/eLife.29630.036
Additional files
-
Transparent reporting form
- https://doi.org/10.7554/eLife.29630.037
Download links
A two-part list of links to download the article, or parts of the article, in various formats.
Downloads (link to download the article as PDF)
Open citations (links to open the citations from this article in various online reference manager services)
Cite this article (links to download the citations from this article in formats compatible with various reference manager tools)
IRAK2 directs stimulus-dependent nuclear export of inflammatory mRNAs
eLife 6:e29630.
https://doi.org/10.7554/eLife.29630


