Temporal network analysis identifies early physiological and transcriptomic indicators of mild drought in Brassica rapa
- Dartmouth College, United States
- University of Wyoming, United States
- Donald Danforth Plant Science Center, United States
Figures
Figure 1
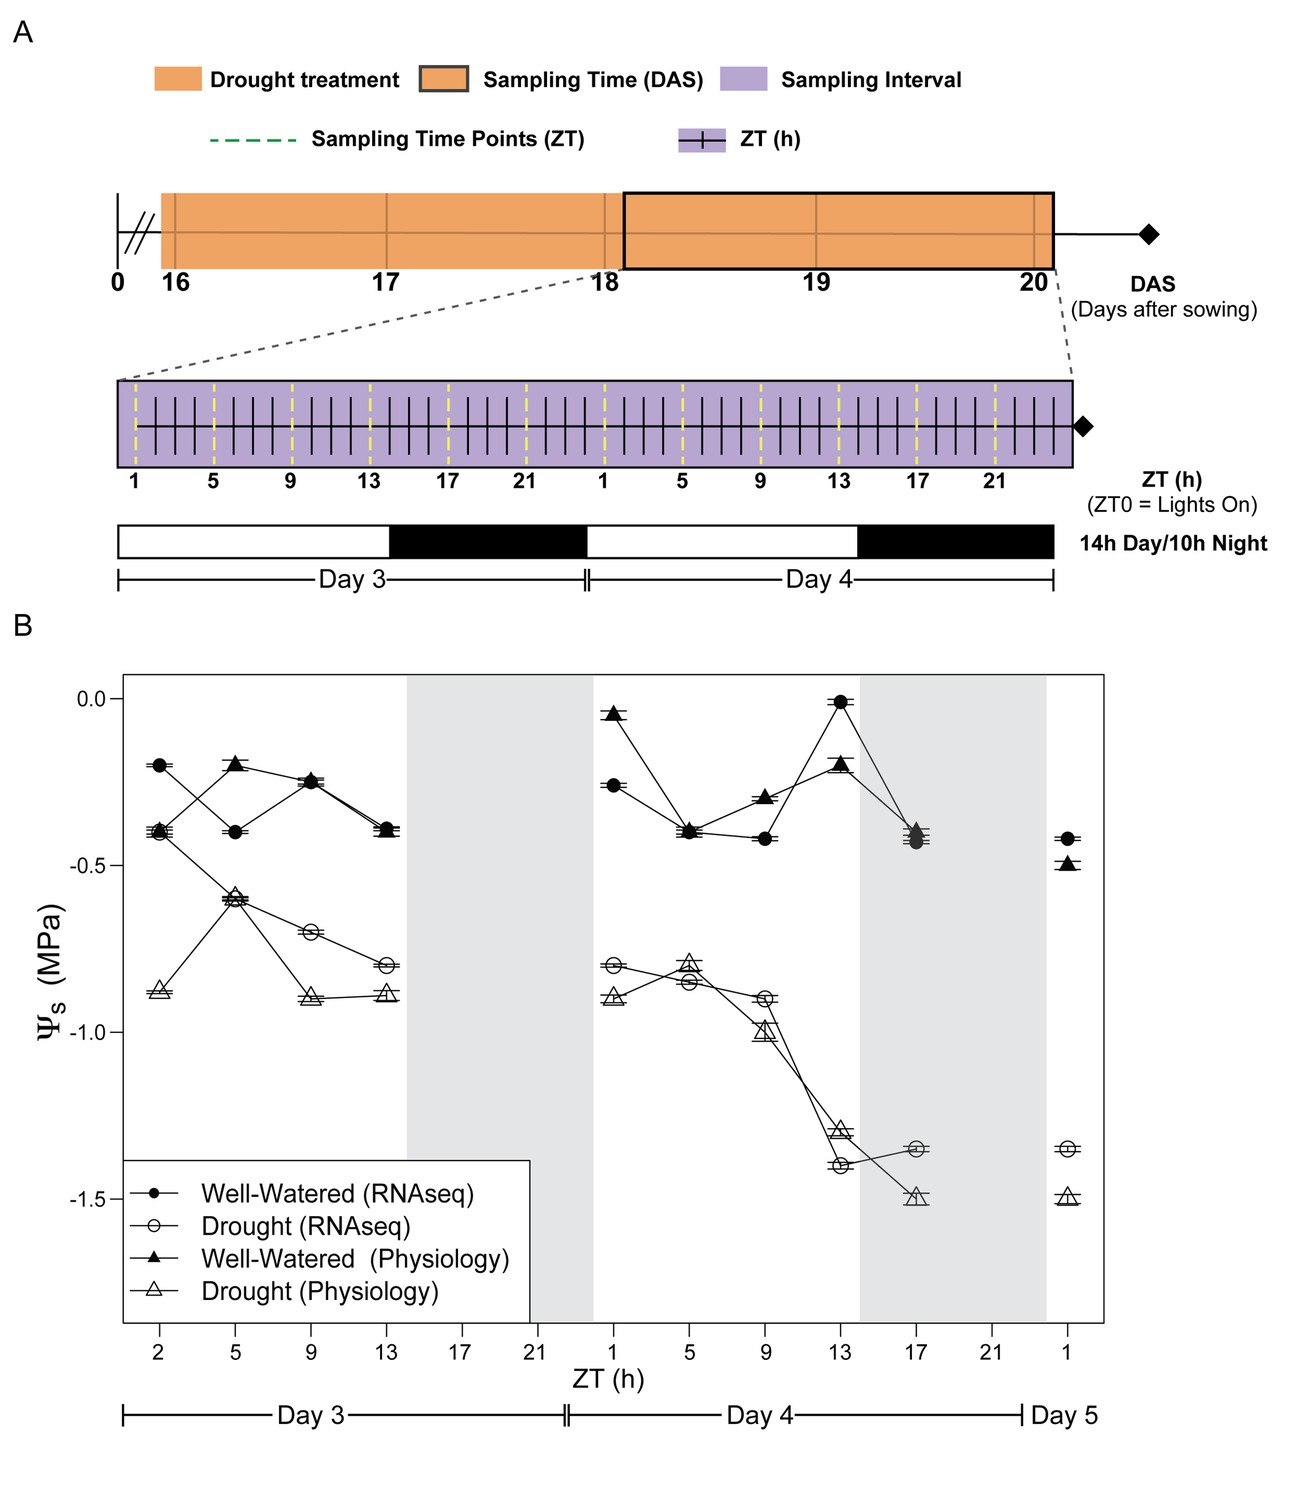
Experimental design for evaluation of early effects of mild drought treatment on Brassica rapa R500 plants and soil water potential during the experiment.
(A) Schematic illustration of the experimental design with days of the experiment and collection/measurement times. Top: The time of the experiment in days after sowing (DAS) is plotted with the orange shade representing the days of mild drought treatment starting at the end of 15 DAS. Center: Purple shade (between 18 and 20 DAS) indicates the 2 days of continuous collection/measurements. The x-axis represents the 48 hr of the experiment in Zeitgeber Time (ZT0 = lights on in the growth chambers). The dotted yellow lines represent the ZT times for collection and measurements of both well-watered and droughted plants. Bottom: White and black bars represent the photoperiod in the growth chambers (14 hr/10 hr; Day/Night) for Days 3 and 4. (B) Soil water potential (Ψs) progression for well-watered (solid symbols) and mild droughted (open symbols) B. rapa R500 plants (n = at least 6) after the start of the drought treatment during the physiology (triangles) and RNA-seq (circles) time-course experiments.
-
Figure 1—source data 1
Growth conditions and reproducibility of the mild drought treatment.
- https://doi.org/10.7554/eLife.29655.004
Figure 2
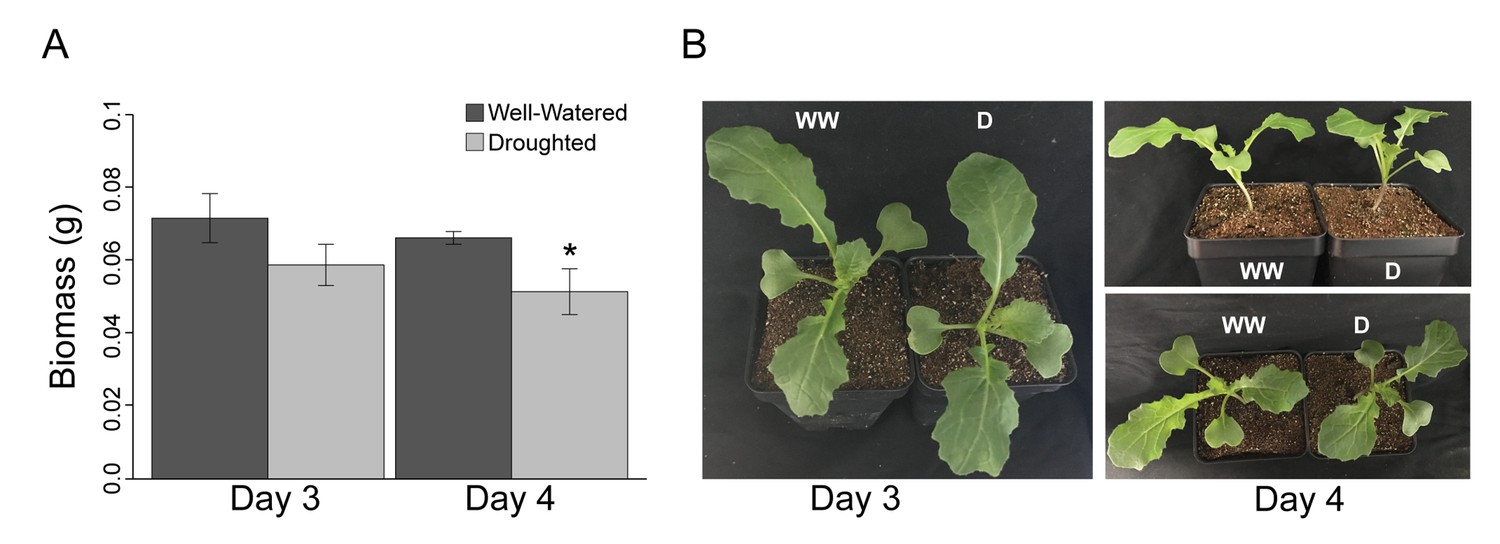
Despite a significant (p<0.001) decrease in dry biomass accumulation, Brassica rapa R500 plants did not reach the wilting point in mild drought.
(A) Grams of dry above-ground biomass in well-watered (dark gray) and mild droughted (light gray) B. rapa R500 plants (n = 12) collected on Day 3 and Day 4. On both days, above-ground biomass was collected at ZT9. (B) Top and lateral view of well-watered and droughted B. rapa R500 plants on Day 3 and Day 4 of the experiment.
Figure 3 with 1 supplement

Specific time-of-day differences in physiology and in dynamics of Non-Structural Carbohydrates (NSC) were observed in B. rapa R500 plants subjected to mild drought relative to control plants.
(A) Photosynthetic rate, A (μmol CO2 m−2s−1) of well-watered controls (green) and mild droughted (orange) plants. (B) Stomatal conductance, gs (mmol H2O m−2s−1) of well-watered controls (green) and mild droughted (orange) plants. (C) Maximum efficiency of PSII in light adapted conditions, Fv’/Fm’ of well-watered controls (green) and mild droughted (orange) plants. (D) NSC accumulation in well-watered (green) and mild droughted (orange) plants. NSC content is expressed as dry weight and refers to the sum of leaves and cotyledon biomass. Tissue collection was carried out every 4 hr during the 2 day time course except for ZT9 when no sugar extraction was performed. White and black bars and gray shading represent the dark period in the growth chambers (14 hr/10 hr; Day/Night). All represented values are averages of at least eight replicates ± SE, asterisks represent a significant difference (p<0.01) between treatments. See Figure 3—figure supplement 1.
-
Figure 3—source data 1
Physiology measurements of well-watered (WW) and droughted (D) plants during Day 3 and Day 4 of the drought time course.
- https://doi.org/10.7554/eLife.29655.008
Figure 3—figure supplement 1
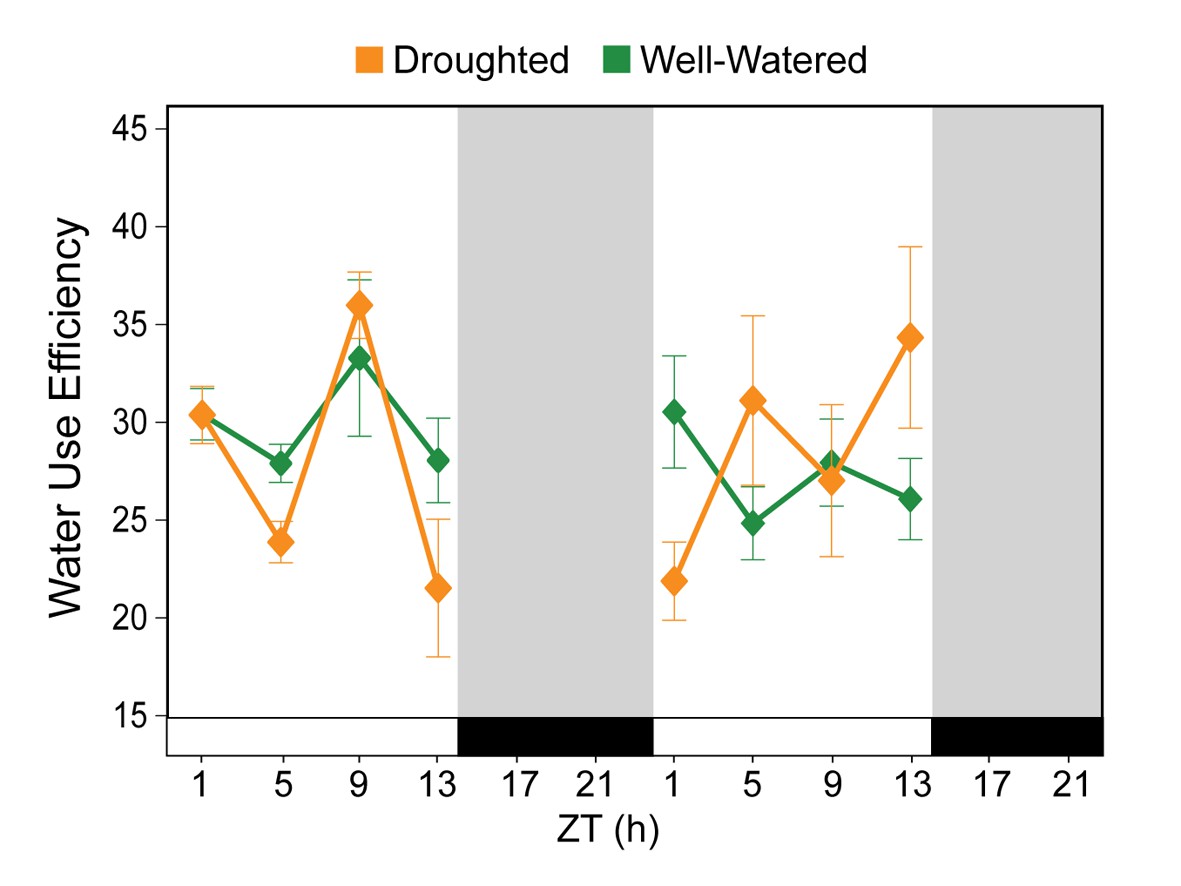
Water use efficiency (WUE) is not an accurate measure of plant response to drought.
Variation of intrinsic WUE (as A/gs) for well-watered controls (green) and mildly droughted (orange) plants. Gray shading indicates dark period.
Figure 4
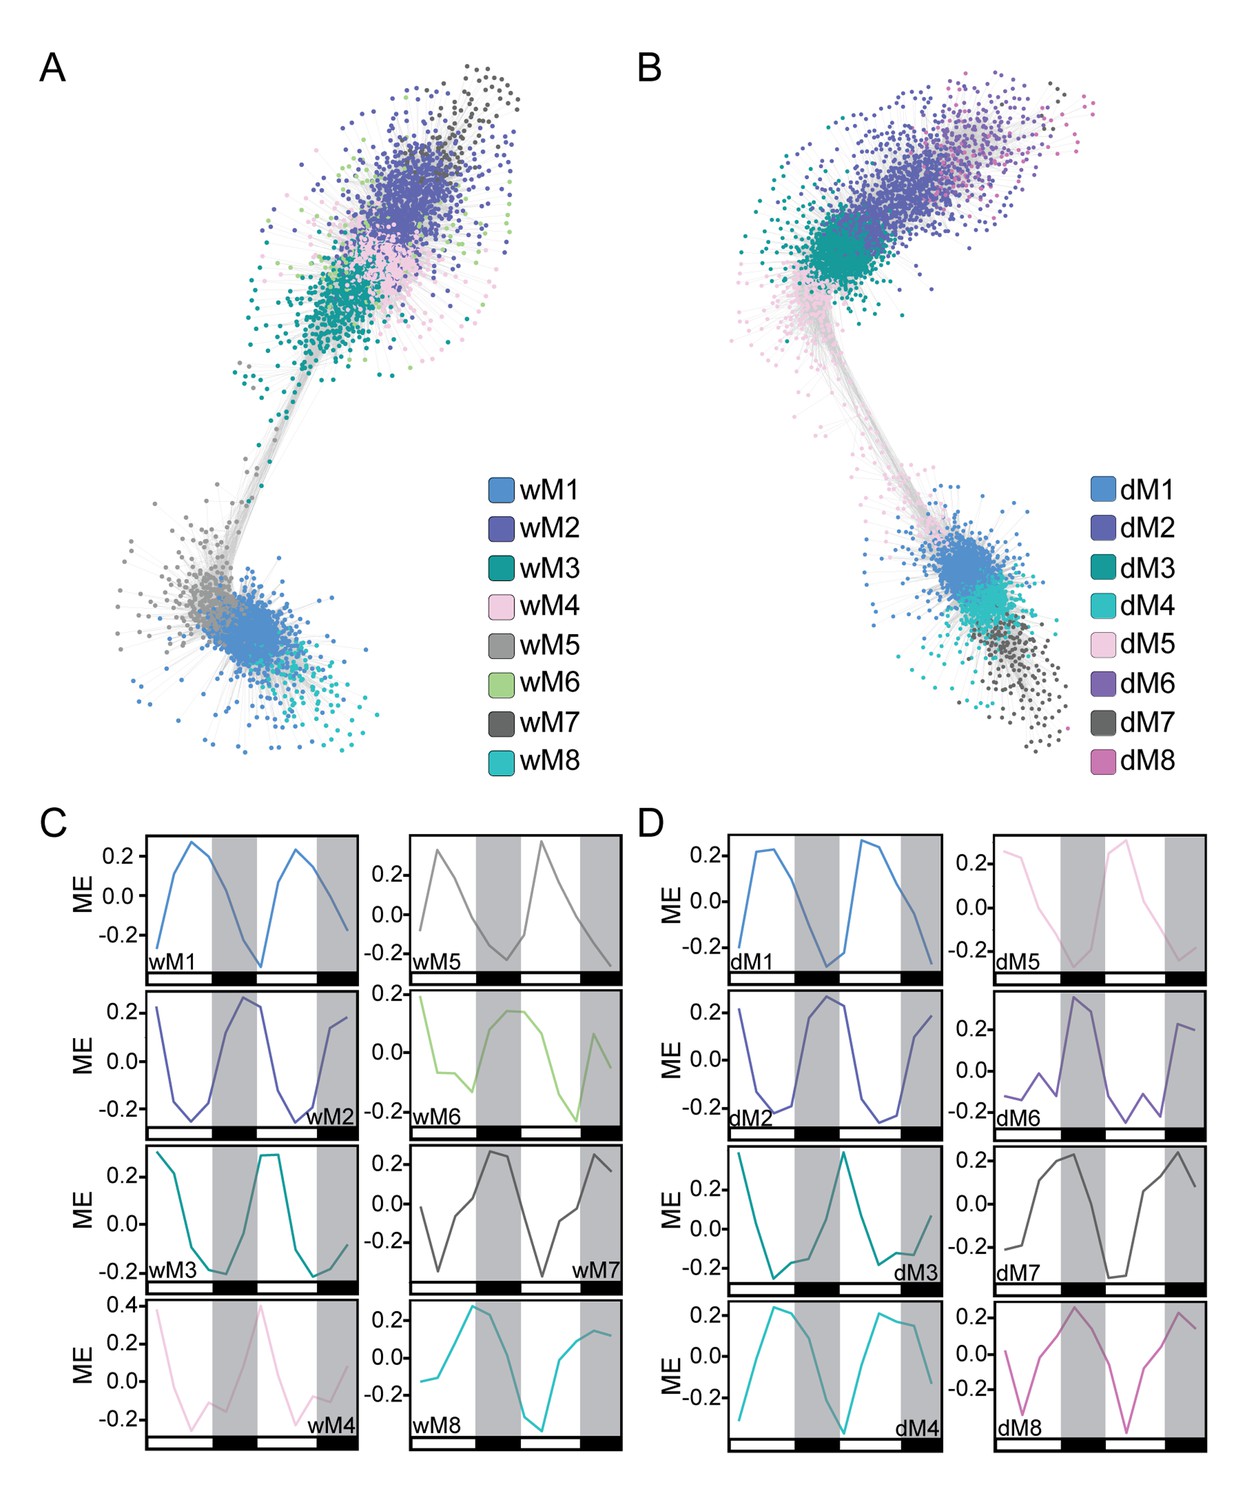
Co-expression network analysis identifies modules of temporally regulated genes with similar phase patterns.
(A and B) The well-watered (A) and droughted (B) networks are shown with gene nodes colored by module membership. Network visualization was done in Cytoscape using a ForceDirected layout with an edge threshold cutoff of 0.1. Modules with significant overlap of gene membership between the well-watered and drought networks are similarly colored. (C and D) The module eigengene (ME) plots for the well-watered (C) and droughted (D) modules reveal temporal regulation of the top eight modules in each network containing ~80–85% of expressed genes. The ME plots are colored based on the modules in the network visualizations. White and black bars along the x-axis represent the day and night time points respectively.
Figure 5
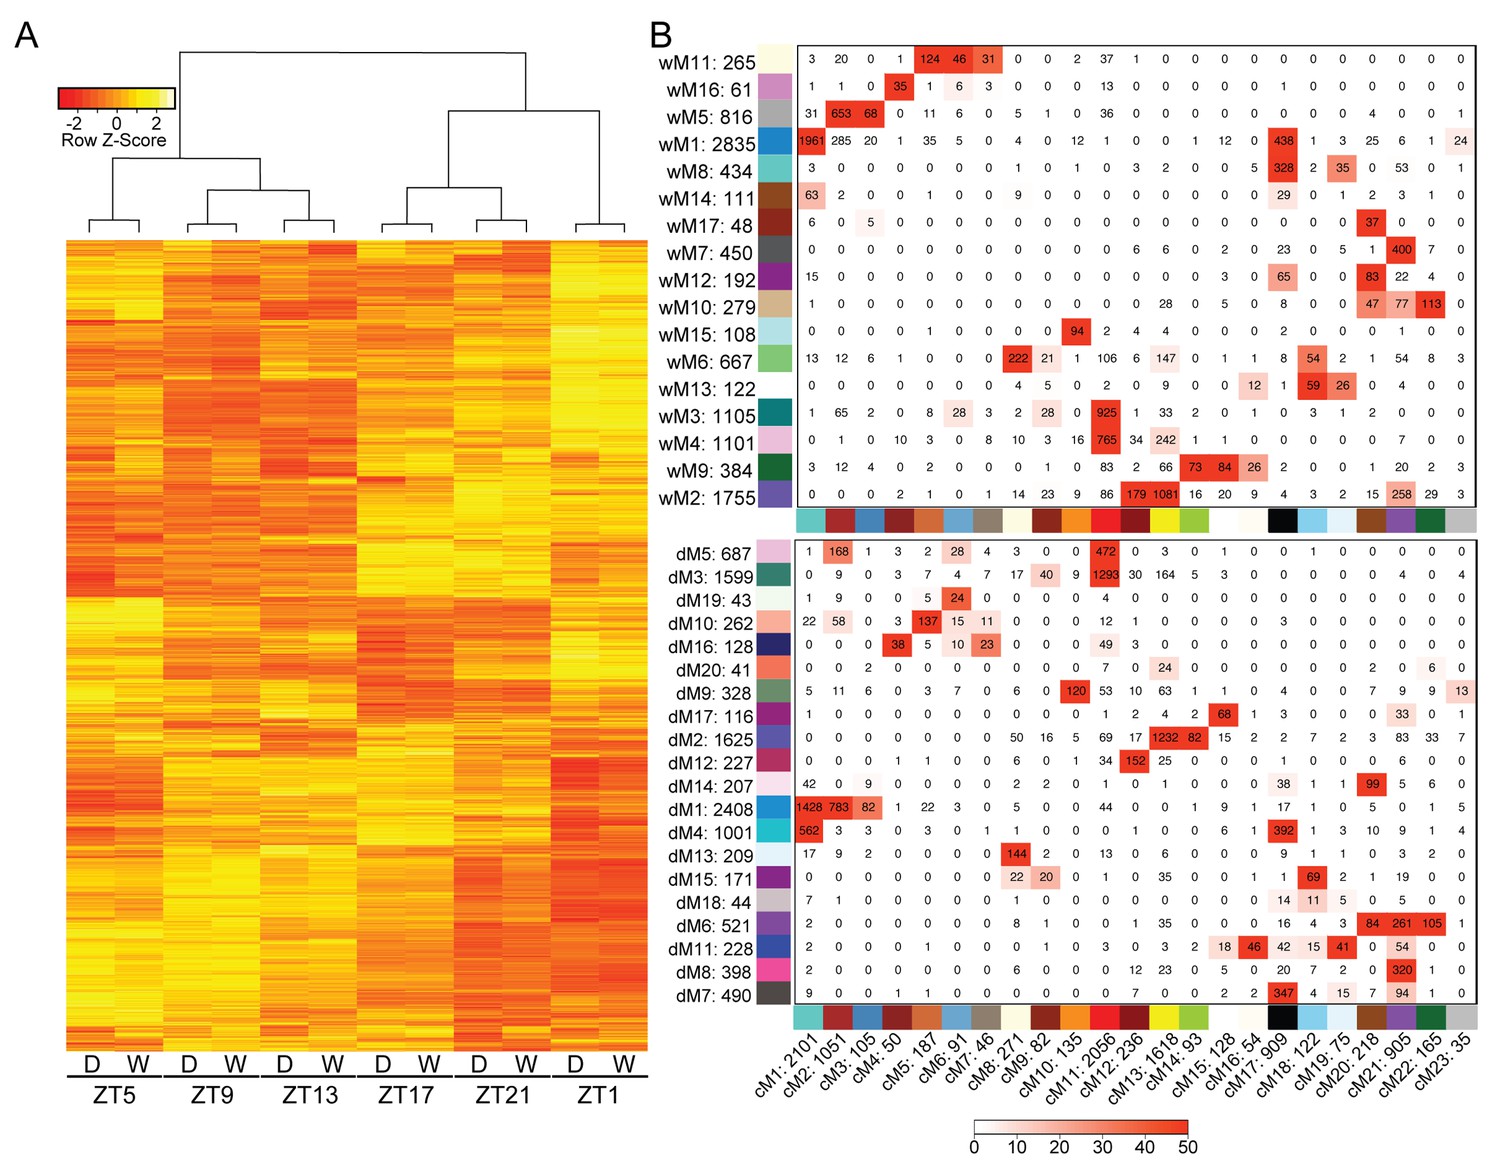
Variation in gene expression over a day is greater than the effects of mild drought.
(A) Hierarchical clustering was performed on the log2 FPKM values for the Day 4 time points for well-watered and droughted plants. (B) Consensus network matrix for the well-watered (top) and droughted (bottom) networks. Consensus modules are listed along the bottom of both matrices with the well-watered and droughted modules along the side. Numbers beside the module number are the total gene counts for that module. Numbers inside the matrix are the number of genes in common between the two modules. Red numbers have significant overlap in gene count based on Fisher’s exact test with the –log(p) of the p-value encoding the coloring (0 = -log(1) and 50 = -log(1E-50)).
Figure 6

Expansion of gene expression patterns uncovered in the droughted network.
(A) The wM5 module from the well-watered network is shown with the mean log2 FPKM expression profiles for the genes in the wM5 network that overlap with dM1, dM5, and dM10 modules. (B) The nodes in the wM5 module are highlighted based on their membership in the dM1, dM5, and dM10 modules from the droughted network. The mean log2 FPKM expression values for the genes in common between the wM5 module and each droughted module is shown. Grey shading in the expression profile plots represents the standard error of the mean log2 FPKM expression levels. White and black bars along the x-axis represent the day and night time points, respectively.
Figure 7

Dynamic changes in physiology are correlated with co-expression networks.
(A and B) Correlations between module eigengenes and physiology measurements for well-watered (A) and droughted (B) plants. The numbers within the heat map represent correlations and P values (in parentheses; red, positively correlated, blue, negatively correlated) for the module – trait associations. (C) Scatterplots of gene significance versus module membership for the photosynthetic rate with dM1 (red), PSII efficiency with dM6 (blue), and stomatal conductance with dM13 (black). Significant correlations imply that hub genes within the module are also highly correlated with the physiology measure.
Figure 8
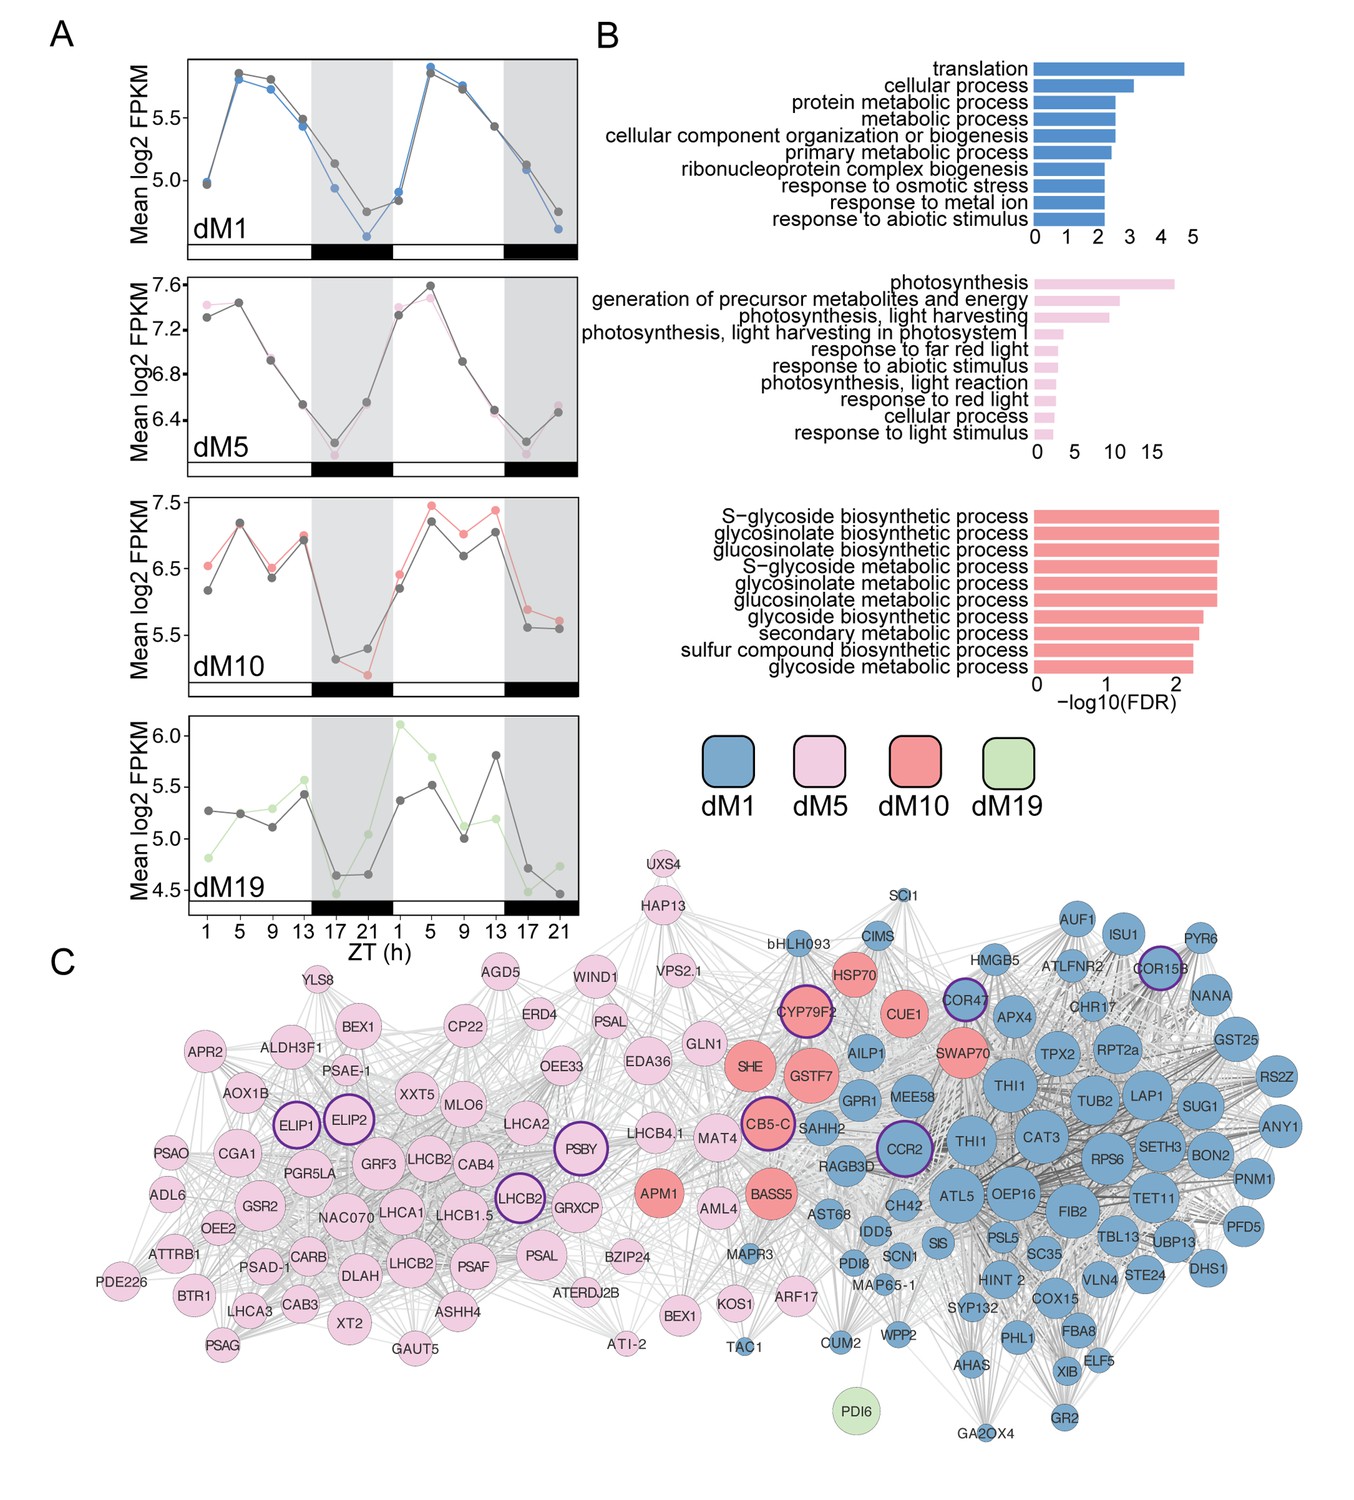
Modules positively correlated with physiology are associated with metabolism and light harvesting processes.
(A) Mean log2 FPKM expression profiles of genes in the dM1, dM5, dM10, and dM19 modules that are positively correlated with stomatal conductance and identified by JTK-CYCLE as having an amplitude change between well-watered and droughted samples. Grey lines are always well-watered. White and black bars along the x-axis represent the day and night time points, respectively. (B) Top 10 associated GO terms for dM1 (top), dM5 (middle), and dM10 (bottom). (C) Genes identified in the dM1, dM5, dM10, and dM19 modules with known Arabidopsis orthologs are shown in the network view. Nodes are colored based on module and size based on module membership. The larger nodes are highly connected within a module and have greater ‘hubness’. The nodes circled in purple were validated by Nanostring.
Figure 9
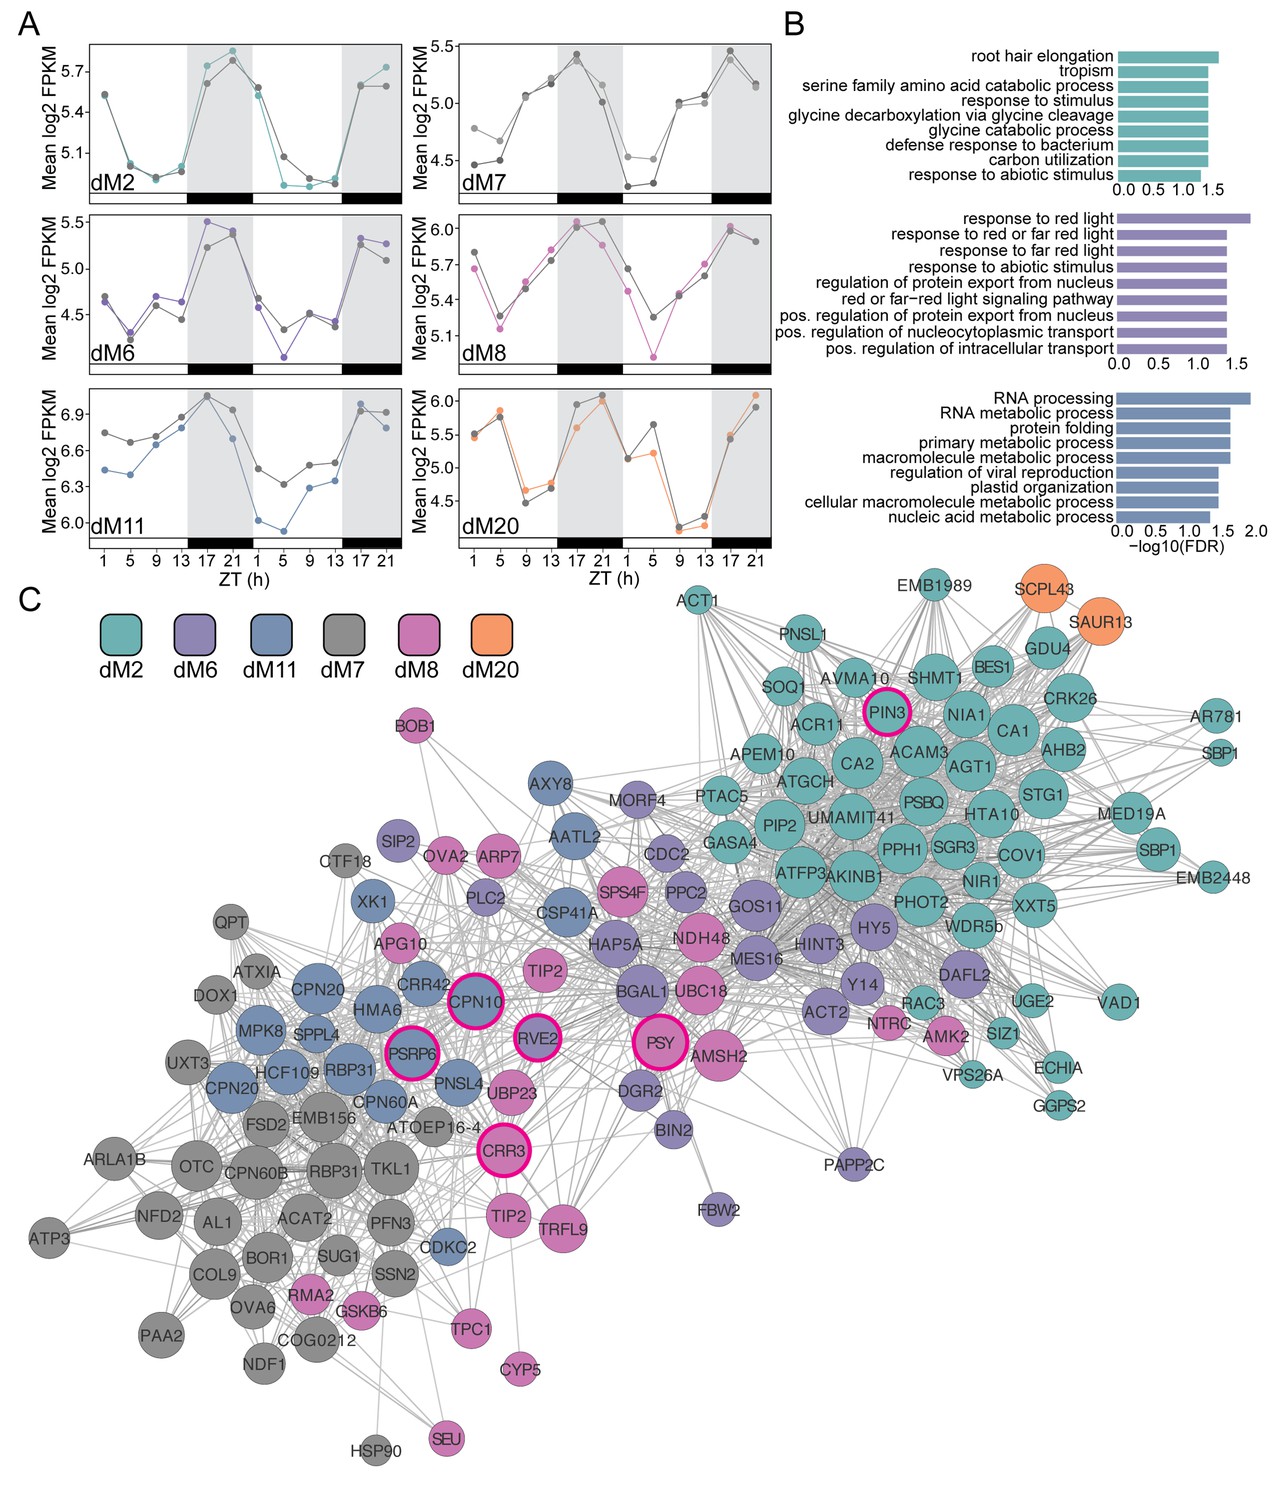
Modules negatively correlated with physiology are associated with abiotic stress and light response.
(A) Mean log2 FPKM expression profiles and of genes in the dM2, dM6, dM7, dM8, dM11, and dM20 modules that are negatively correlated with stomatal conductance and identified by JTK-CYCLE as having an amplitude change between well-watered and droughted samples. Grey lines are always well-watered. White and black bars along the x-axis represent the day and night time points, respectively. (B) Top 10 associated GO terms for dM2 (top), dM6 (middle), and dM11 (bottom). (C) Genes identified in the dM2, dM6, dM7, dM8, dM11, and dM20 modules with known Arabidopsis orthologs are shown in the network view. Nodes are colored based on module and size based on module membership. The larger nodes are highly connected within a module and have greater ‘hubness’. The nodes circled in magenta were validated by Nanostring.
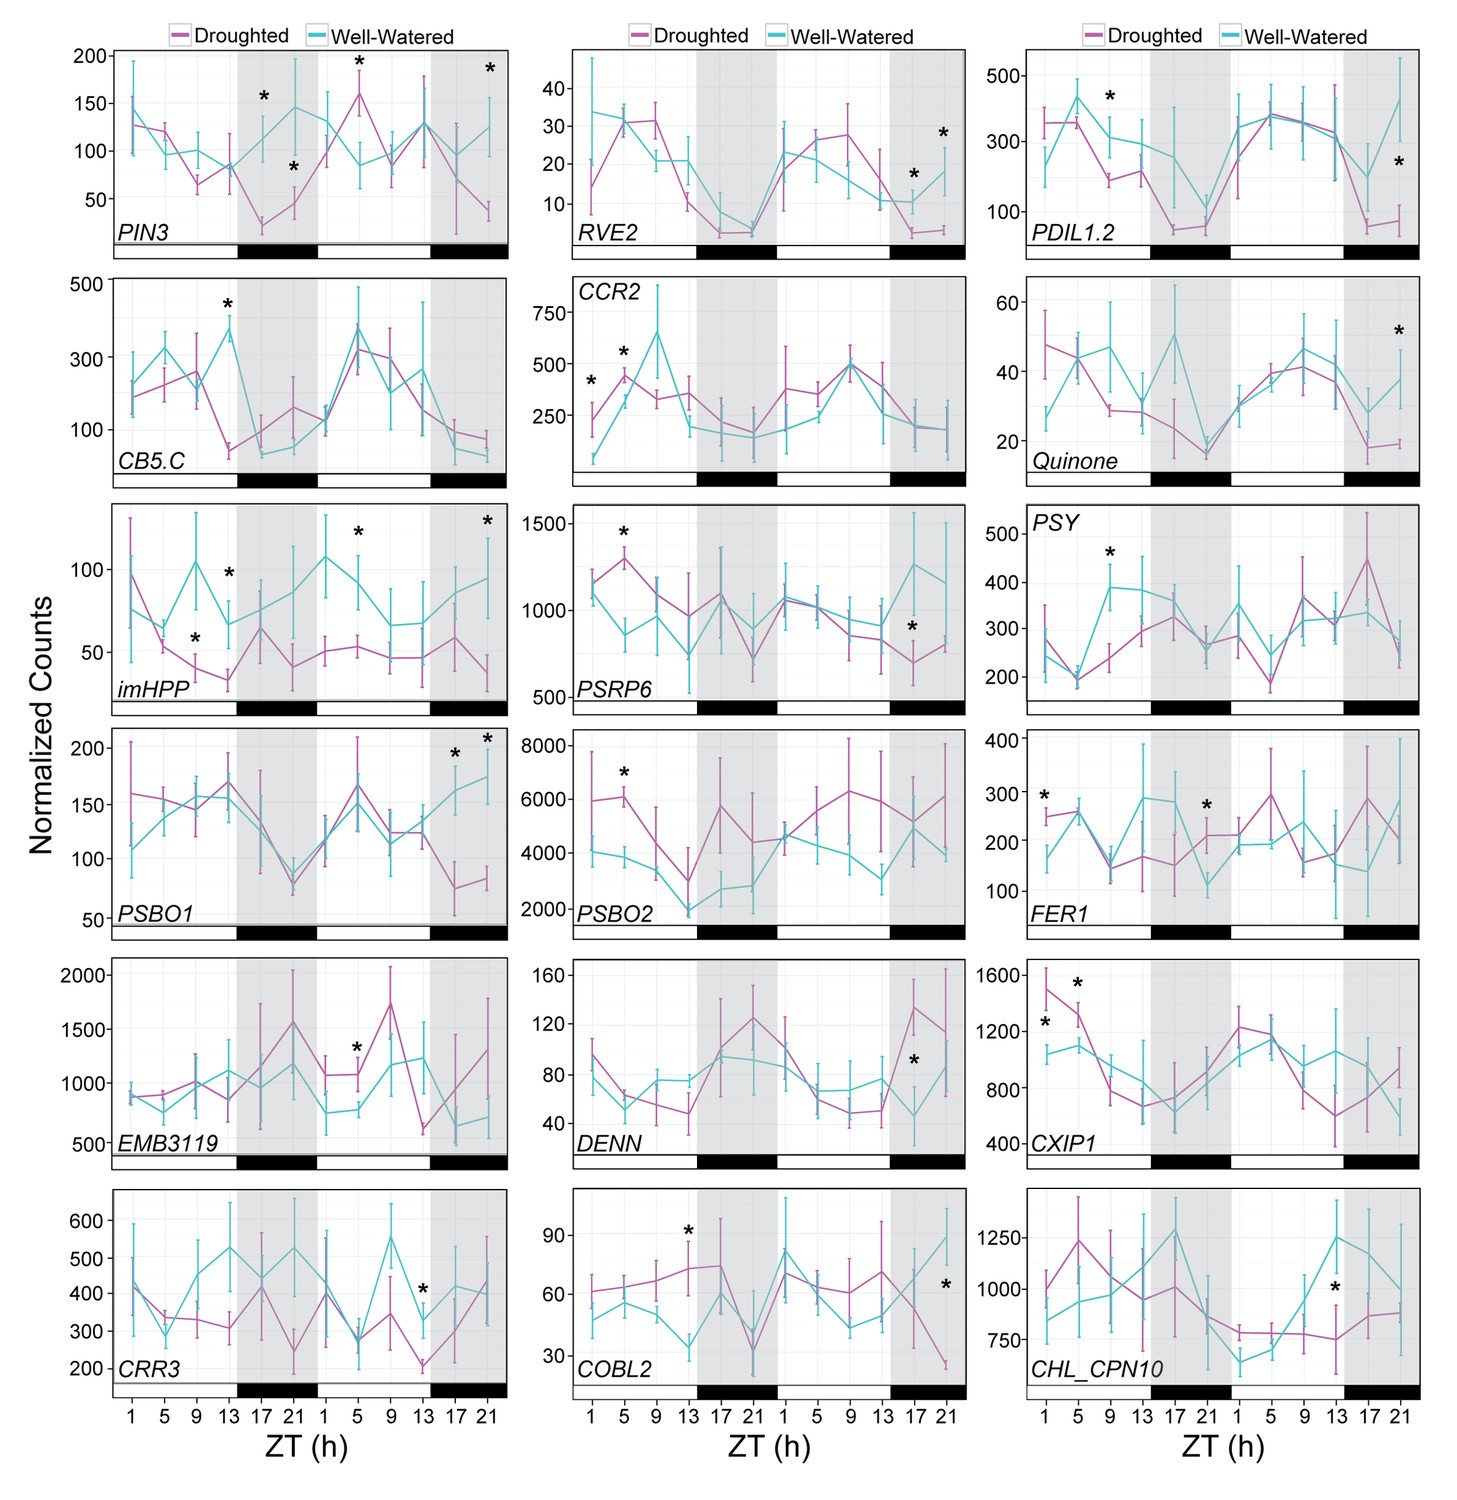
Figure 10 with 2 supplements
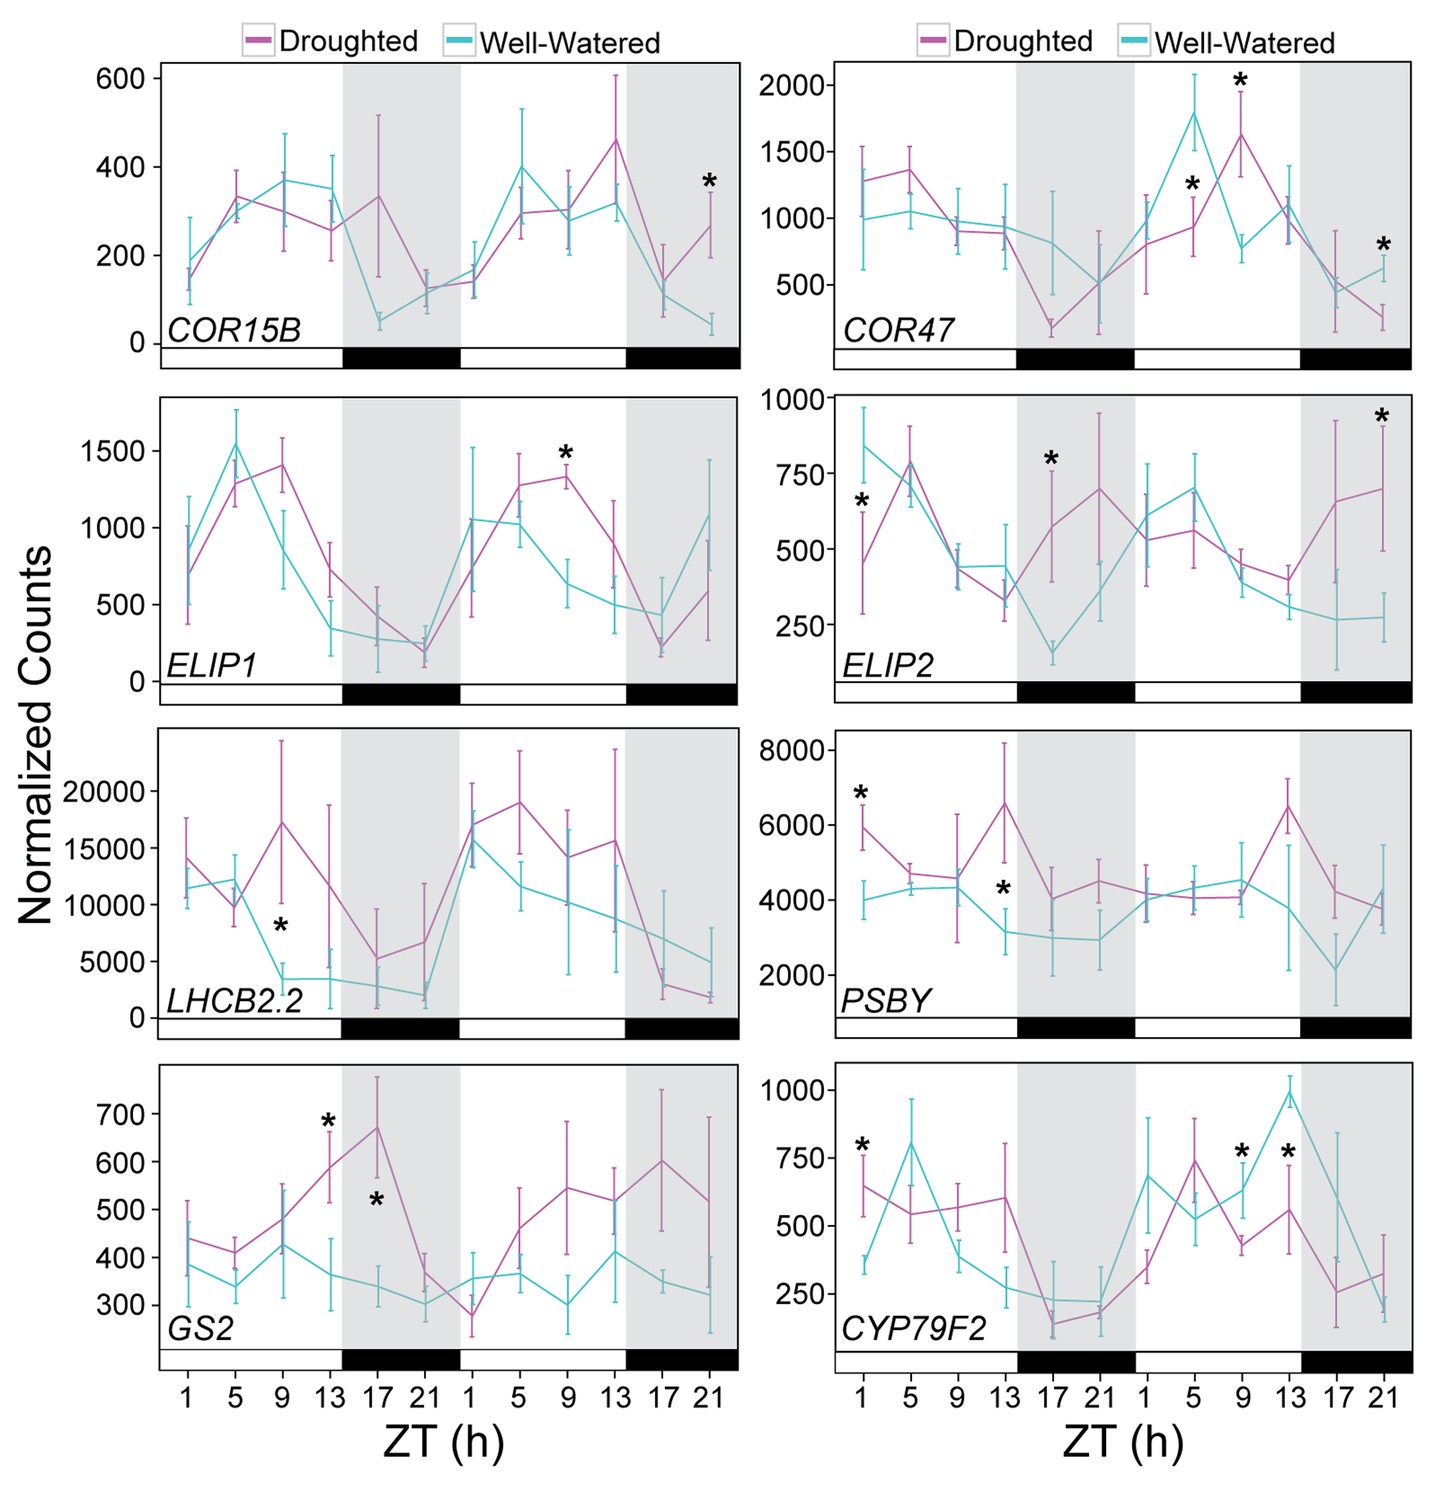
Validation of drought-responsive genes supports alterations of light harvesting processes and metabolism.
Gene expression for a set of drought-responsive genes identified from the JTK-CYCLE filter. NanoString was performed on RNA isolated from leaf tissue harvested during the RNA-seq time course experiment. Each data point represents the mean of 5 individual plants. Gene counts were normalized to Bra021441, Bra014841, and Bra020305. Error bars represent SE. Grey shading indicates the dark period. Asterisks indicate significant difference (p<0.05). See Figure 10—figure supplement 1.
-
Figure 10—source data 1
List of genes selected for gene expression validation using NanoString.
- https://doi.org/10.7554/eLife.29655.018
Figure 10—figure supplement 1
Validation of drought responsive genes.
Gene expression for a set of drought-responsive genes identified from the JTK-CYCLE filter. NanoString was performed on RNA isolated from leaf tissue harvested during the RNA-seq time course experiment. Each data point represents the mean of 5 individual plants. Gene counts were normalized to Bra021441, Bra014841, and Bra020305. Error bars represent SE. Black bars and grey shading indicates the dark period. Asterisks indicate significant difference (p<0.05).
Figure 10—figure supplement 2
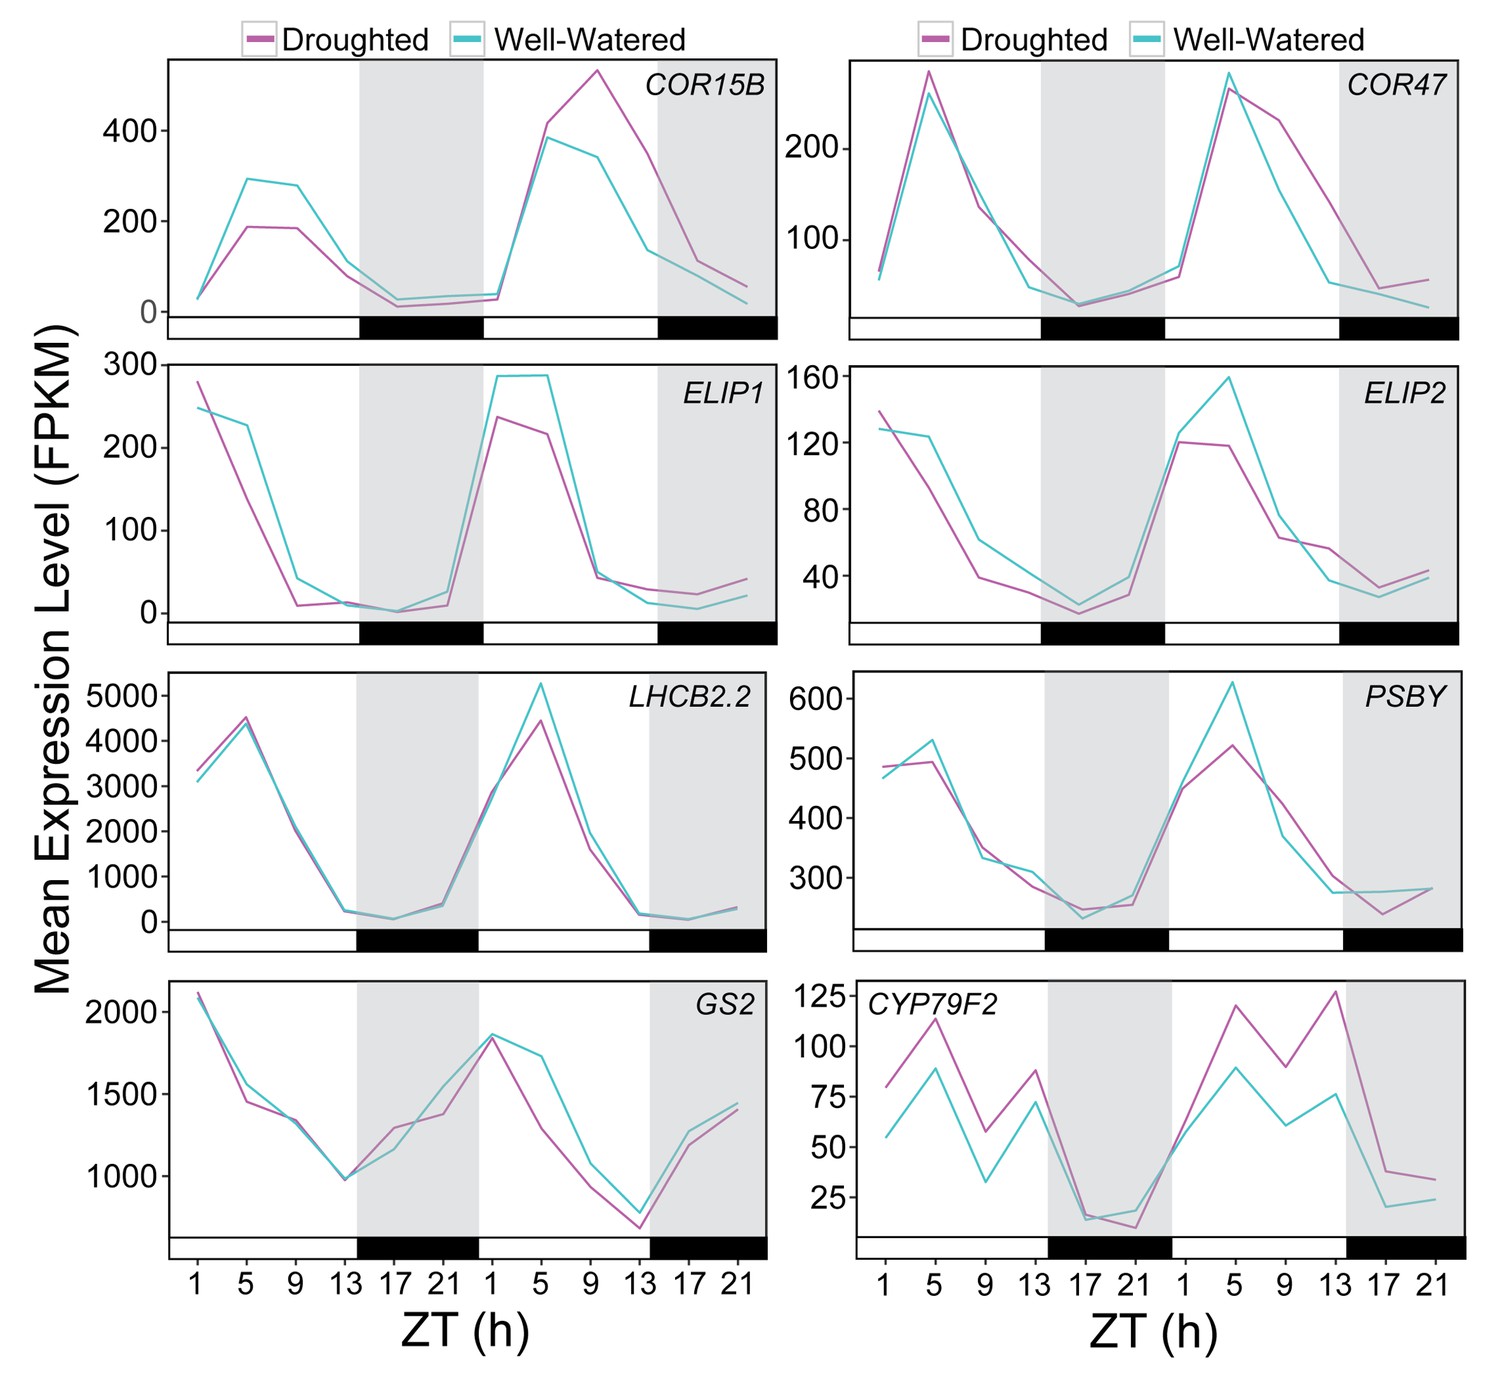
RNA-seq expression of drought responsive genes assessed by NanoString.
FPKM expression values for the drought responsive genes analyzed by Nanostring and shown in Figure 10. Each data point represents the mean of two biological replicates. Black bars and grey shading indicates the dark period.
Additional files
-
Supplementary file 1
WGCNA network gene lists with module membership and gene significance for each physiology measure.
- https://doi.org/10.7554/eLife.29655.019
-
Supplementary file 2
JTK-Cycle analysis results for genes from trait correlated modules with gene significance p.value scores less than 0.01.
- https://doi.org/10.7554/eLife.29655.020
-
Supplementary file 3
mRNA Purification Protocol for RNA‐seq Library Preparation
- https://doi.org/10.7554/eLife.29655.021
-
Transparent reporting form
- https://doi.org/10.7554/eLife.29655.022
Download links
A two-part list of links to download the article, or parts of the article, in various formats.
Downloads (link to download the article as PDF)
Open citations (links to open the citations from this article in various online reference manager services)
Cite this article (links to download the citations from this article in formats compatible with various reference manager tools)
Temporal network analysis identifies early physiological and transcriptomic indicators of mild drought in Brassica rapa
eLife 6:e29655.
https://doi.org/10.7554/eLife.29655


