Temporal network analysis identifies early physiological and transcriptomic indicators of mild drought in Brassica rapa
- Dartmouth College, United States
- University of Wyoming, United States
- Donald Danforth Plant Science Center, United States
Abstract
The dynamics of local climates make development of agricultural strategies challenging. Yield improvement has progressed slowly, especially in drought-prone regions where annual crop production suffers from episodic aridity. Underlying drought responses are circadian and diel control of gene expression that regulate daily variations in metabolic and physiological pathways. To identify transcriptomic changes that occur in the crop Brassica rapa during initial perception of drought, we applied a co-expression network approach to associate rhythmic gene expression changes with physiological responses. Coupled analysis of transcriptome and physiological parameters over a two-day time course in control and drought-stressed plants provided temporal resolution necessary for correlation of network modules with dynamic changes in stomatal conductance, photosynthetic rate, and photosystem II efficiency. This approach enabled the identification of drought-responsive genes based on their differential rhythmic expression profiles in well-watered versus droughted networks and provided new insights into the dynamic physiological changes that occur during drought.
https://doi.org/10.7554/eLife.29655.001eLife digest
Around 60% of the food produced worldwide relies entirely on rain for its water supply. However, in the decades ahead global climate change is predicted to cause droughts to happen more often and become more severe in many regions. Therefore, in order to sustain our food supply we need to better understand how plants respond to drought and then use that knowledge to improve the ability of crops to cope with it.
Unlike animals, plants cannot move away from drought or other stressful situations so they must face these difficulties ‘head on’. For example, when water is in short supply, plants close pores known as stomata on the surface of their leaves to reduce water loss. However, these pores need to be open to allow carbon dioxide gas, which plants use to make sugars in a process called photosynthesis, to enter the plant. Their response to drought must therefore be carefully controlled to make sure that the plant is still capable of performing photosynthesis.
Turnip, napa cabbage, bok choy and field mustard are all varieties of a crop species known as Brassica rapa. These crops are grown in relatively dry regions such as the Canadian prairies and northern China, making drought stress a major threat to production.
Previous studies had shown that drought stress causes changes in the activities of genes at certain times of day. To investigate this further, Greenham, Guadagno et al. studied how young B. rapa plants grown in a controlled environment with a steady supply of water responded when watering stopped. The experiments show that, even before the plants show obvious signs of drought stress such as wilting, there are extensive changes in the activity of many genes and processes inside plant cells that vary according to the time of day.
Greenham, Guadagno et al. used an analysis technique to bring together all of the data into a network based on similar patterns of changes over time. This identified groups of genes whose changes in activity match the timing of the observed changes in the opening and closing of stomata, photosynthesis and other processes. These represent very early responses to drought stress in the plant.
This work emphasizes the importance of time of day on plant stress responses. Changes that occurred only in the morning could not have been detected by measurements taken in the afternoon, and vice versa. The next step is to find out which of the changes observed in this work are most important in making plants resistant to drought. In the future, these findings may help researchers to develop strategies that would improve drought resistance in crop plants.
https://doi.org/10.7554/eLife.29655.002Introduction
Projected impacts of climate change on crop yields vary widely depending on crop type and location; however, rising temperatures, with attendant increases in drought as well as insect and disease outbreaks, are predicted to result in net losses in yield of North American crops by the end of the 21st century (Settele et al., 2014). Water stress accounts for the largest proportion of crop loss in the U.S., and an estimated 45% of U.S. land surface suffers from low water availability (DeLucia et al., 2014). To mitigate the predicted increase in water stress on plants (Blum, 2005; Jones and Corlett, 1992; Anderegg et al., 2012) and achieve maximal crop yield potential, locally adapted stress tolerance traits are needed.
In response to soil water deficit, plants can exhibit either drought escape or drought resistance mechanisms (Levitt, 1980; Harb et al., 2010). Under drought escape, plants complete their life cycle before the onset of stress. Drought resistance can occur through dehydration avoidance or through tolerance (Levitt, 1980). With dehydration avoidance, plants maintain high cellular water potential by lowering stomatal conductance and/or reducing water loss through changes in leaf area or orientation and by increasing resource allocation to roots. Drought tolerant plants conserve cell turgor through osmotic adjustments to survive the drought stress (Levitt, 1980) and may also tolerate lower cell water potentials through anisohydric water potential regulation (Franks et al., 2007) while maintaining cellular metabolism (Sade et al., 2012). Depending on the plant species and genotype, a combination of avoidance and tolerance traits may be utilized (Chaves and Oliveira, 2004). The potential allocation changes in drought-stressed plants also depend on selection by herbivores and the true cost of defensive molecules as leaf carbon fixation is reduced by drought (Züst and Agrawal, 2017; Hamilton et al., 2001). Achieving maximum yield while breeding for drought stress responses will likely rely on a balance between avoidance and tolerance strategies (Tuberosa, 2012).
A commonly used measure for assessing drought resistance is the intrinsic water use efficiency (WUE), which is defined as the ratio between stomatal conductance (gs) and CO2 assimilation (A) (Condon et al., 2002). WUE is often used as a proxy for drought resistance, but it is not always an accurate predictor of yield capacity under drought (Medrano et al., 2012) especially when biomass allocation to roots increases in response to drought (Edwards et al., 2016) or when yield is tightly correlated with water use (Blum, 2009). Smaller plants that limit water use and have moderate growth or short growing seasons often have higher WUE but low yield potential (Blum, 2005). This argues for using the individual gs and A measures to separately assess the impact of CO2 supply and demand effects on yield.
Studies in numerous plant species have explored transcript level changes following various degrees of drought stress (Zhang et al., 2012; Yamaguchi-Shinozaki and Shinozaki, 2006; Smita et al., 2013; Seki et al., 2002; Shinozaki and Yamaguchi-Shinozaki, 2007; Degenkolbe et al., 2009) and the plant responses to drought at physiological and molecular levels (Sakuma et al., 2006; Yu et al., 2008; Ning et al., 2010). Few studies have evaluated physiological and molecular responses in plants experiencing mild drought (Watkinson et al., 2003; Vásquez-Robinet et al., 2010), although mild drought is more relevant to intensive agricultural settings than severe drought. Many drought-responsive genes are under circadian regulation (Covington et al., 2008) resulting in specific time-of-day responses to drought (Wilkins et al., 2010; Dubois et al., 2017). To associate the relevant transcriptomic changes with physiology, these time-of-day effects must be considered. Temporal changes complicate the assessment of differential gene expression in response to an abiotic stress due to the differences in the phasing of maximal and minimal expression levels for transcripts under circadian or diel control (Greenham and McClung, 2015). Because time-of-day changes in transcript phasing are dominant relative to the responses to drought status, comparisons of gene expression levels at any single time point will chiefly capture time-of-day expression differences rather than drought responses.
Network analysis is a powerful way to extract meaningful differences across treatments, development, or time by providing pathway structure (Priest et al., 2014; Gehan et al., 2015; Righetti et al., 2015). In addition, a network approach facilitates the integration of multiple datasets that can provide support to the network structure and can be used to generate predictive regulatory networks (Langfelder et al., 2011; Krouk et al., 2013). Here, we applied a co-expression network approach to analyze both transcriptome and physiological parameters over a two-day time course in drought-stressed and control plants, providing temporal resolution necessary for correlation of network modules with dynamic changes in drought response.
We performed these studies in the crop species Brassica rapa. The genus Brassica includes the closest crop relatives of Arabidopsis and therefore is an excellent crop model for comparative studies, including analyses of adaptive drought responses. There is tremendous morphological diversity within Brassica species with important vegetable, oilseed, and forage crops that have acquired a range of stress response traits (Ashraf and Mehmood, 1990). Rapeseed (B. napus), an allopolyploid derived via hybridization between B. rapa and B. oleracea, is the second largest oil crop after soybean with an annual global production of 70 million tons (http://faostat.fao.org, 2014). The majority of Brassica crops are grown in arid and semi-arid regions making drought stress a major determinant of yield. B. rapa shows a wide spectrum of drought responses (Yarkhunova et al., 2016; Edwards et al., 2012), suggesting that there is extensive genetic variation to explore. Further, quantitative genetic analyses of B. rapa under well-watered and drought conditions found opposite correlations between WUE and shoot biomass: plants with low WUE had higher biomass under well-watered conditions, whereas those with high WUE were larger under drought conditions (Edwards et al., 2012; El-Soda et al., 2014). Subsequent studies revealed quantitative trait locus (QTL) allele contributions to the association between gs and total biomass (Edwards et al., 2016).
Here, our objective was to associate the earliest transcriptomic responses to a water deficit with the dynamic changes in physiology throughout the day. To clarify the gene reprogramming under mild drought we focused our attention on the early response to drought stress. We measured several physiological traits and transcript abundances in B. rapa over 48 hr of controlled mild drought. To identify important regulatory pathways contributing to drought responses we applied a circadian guided co-expression network approach to correlate changes in temporally regulated transcripts with photosynthetic rate (A), stomatal conductance (gs; a measure of CO2 supply), and maximum efficiency of photosystem II (PSII) in light conditions (Fv’/Fm’; a measure of available energy for CO2 demand). Gene reprogramming was altered over the time course of drought treatment, and significant changes in temporal dynamics of gs and Fv’/Fm’ reveal them to be reliable indicators of early drought perception.
Results and discussion
Establishing the mild drought treatment
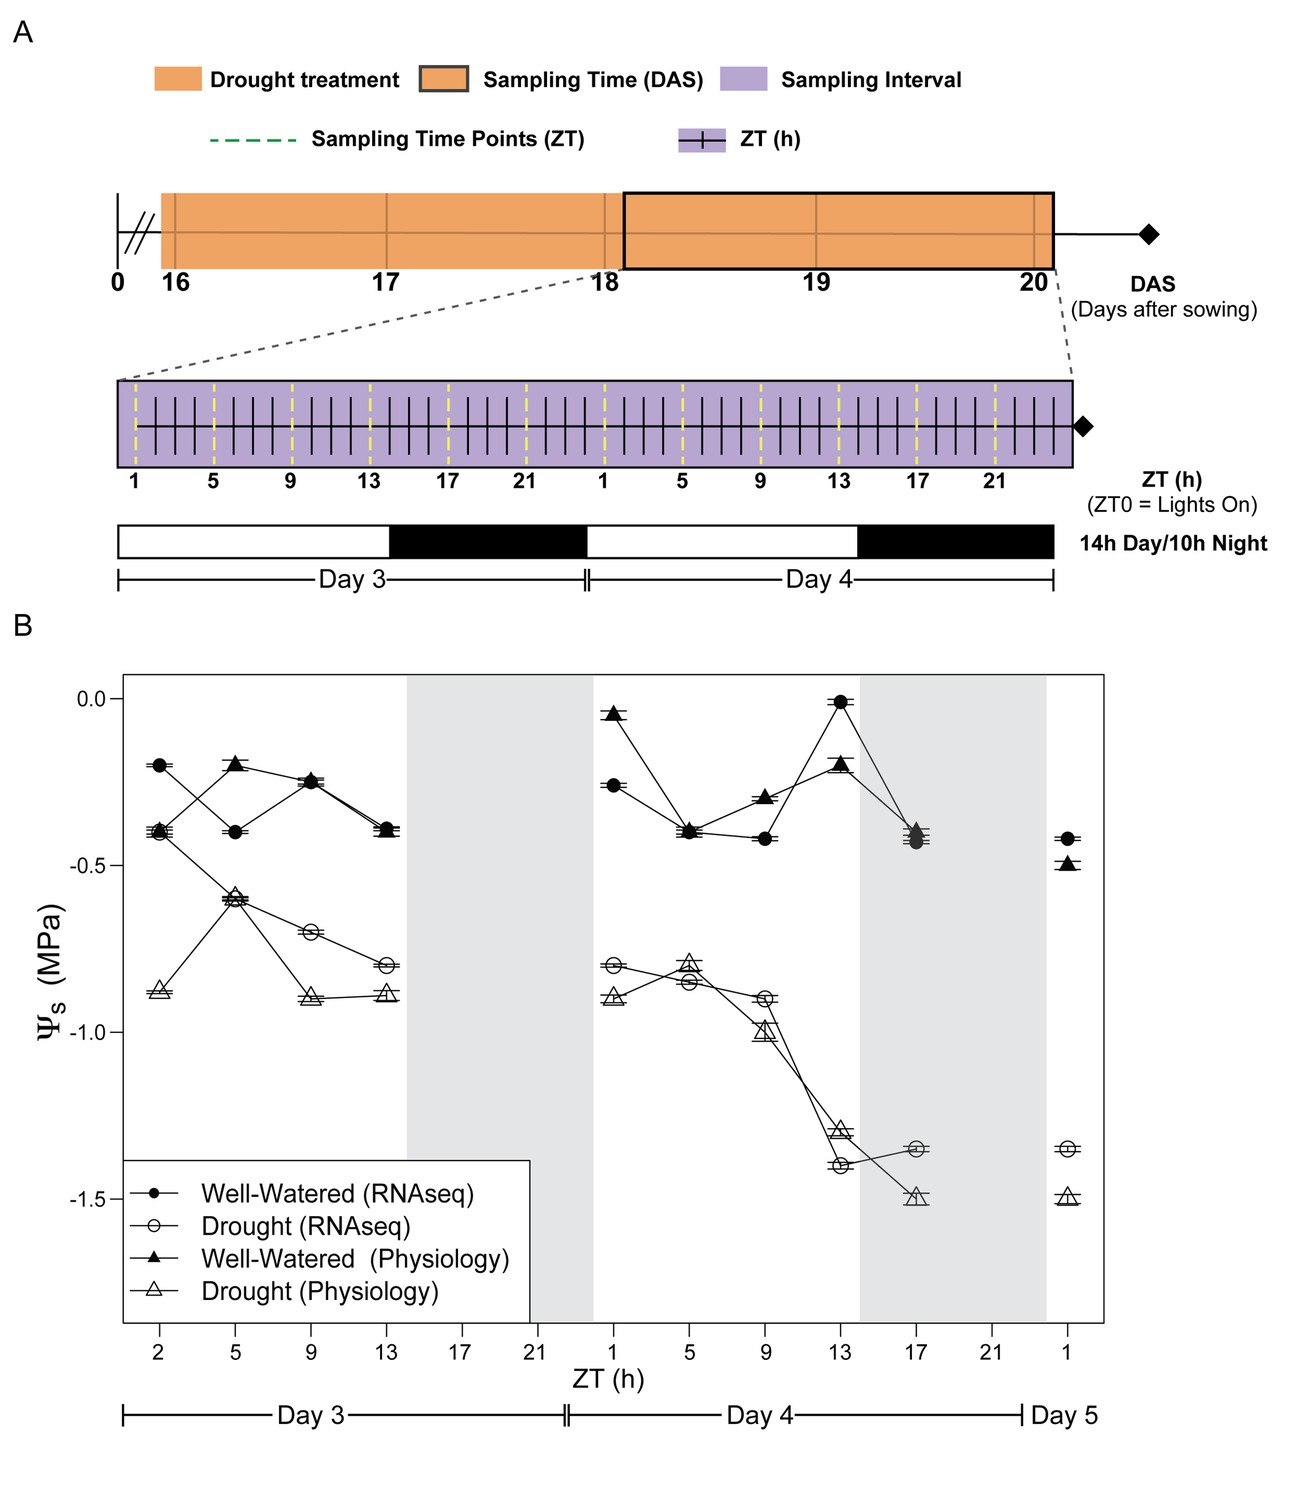
We assessed the early stages of mild drought, completely withholding water for the droughted cohort of B. rapa (Yellow Sarson) R500 beginning at 16 days after sowing (DAS). Tissue sampling and physiological measurements were conducted on Day 3 and 4 of drought, 18 and 19 DAS, respectively (Figure 1A, Figure 1—source data 1). The experiment was performed twice under similar temperature, photoperiod, and soil moisture conditions (Figure 1A, Figure 1—source data 1). In order to assess the reproducibility of our conditions, Fv’/Fm’ and above-ground biomass were monitored in both experiments, and there were no significant differences between the temporal replicates. After four days of drought, soil water potential (Ψs) had declined progressively to −1.5 MPa, whereas Ψs was relatively constant between 0 and −0.5 MPa for the well-watered soil (Figure 1B, Figure 1—source data 1). The droughted plants showed a significant decrease in dry above-ground biomass by the end of Day 4 (Figure 2A); however, there was no wilting during the experiment (Figure 2B). In a previous experiment, prolonged progressive drought resulted in Ψs equal to approximately −5 MPa, yet some R500 plants were able to recover upon re-watering and maintained their gas exchange (Guadagno et al., 2017). Therefore, the drought conditions applied in this study capture the early perception of drought stress (Harb et al., 2010).
Figure 1
Experimental design for evaluation of early effects of mild drought treatment on Brassica rapa R500 plants and soil water potential during the experiment.
(A) Schematic illustration of the experimental design with days of the experiment and collection/measurement times. Top: The time of the experiment in days after sowing (DAS) is plotted with the orange shade representing the days of mild drought treatment starting at the end of 15 DAS. Center: Purple shade (between 18 and 20 DAS) indicates the 2 days of continuous collection/measurements. The x-axis represents the 48 hr of the experiment in Zeitgeber Time (ZT0 = lights on in the growth chambers). The dotted yellow lines represent the ZT times for collection and measurements of both well-watered and droughted plants. Bottom: White and black bars represent the photoperiod in the growth chambers (14 hr/10 hr; Day/Night) for Days 3 and 4. (B) Soil water potential (Ψs) progression for well-watered (solid symbols) and mild droughted (open symbols) B. rapa R500 plants (n = at least 6) after the start of the drought treatment during the physiology (triangles) and RNA-seq (circles) time-course experiments.
-
Figure 1—source data 1
Growth conditions and reproducibility of the mild drought treatment.
- https://doi.org/10.7554/eLife.29655.004
Figure 2
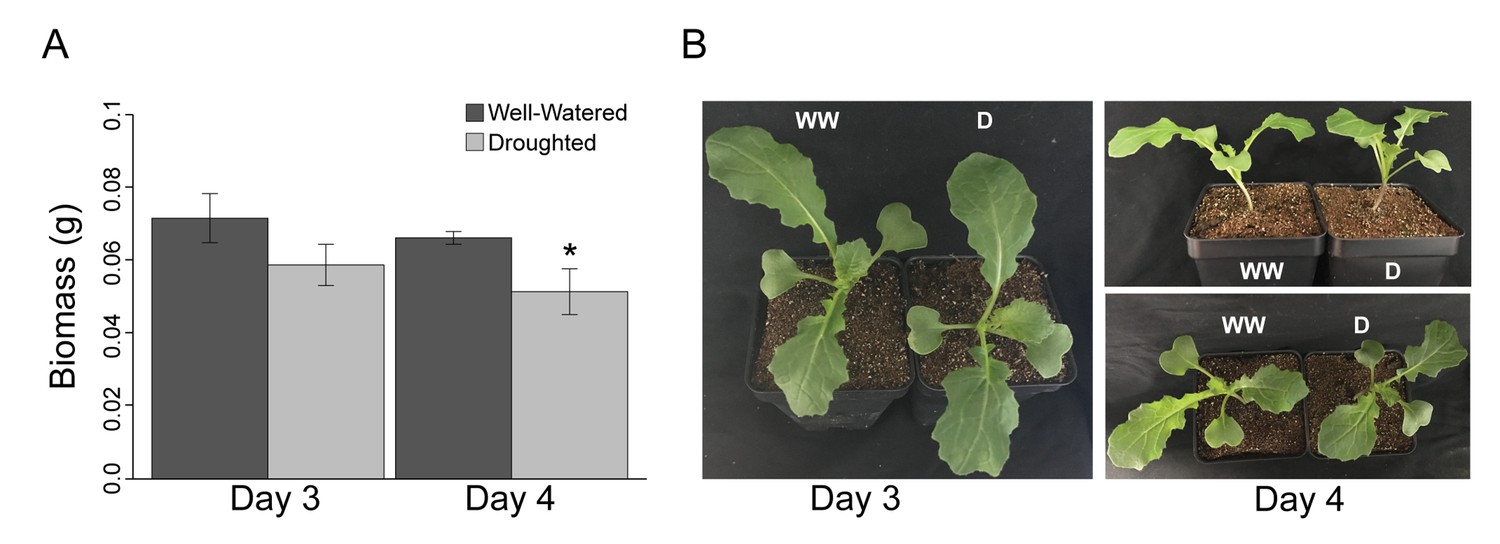
Despite a significant (p<0.001) decrease in dry biomass accumulation, Brassica rapa R500 plants did not reach the wilting point in mild drought.
(A) Grams of dry above-ground biomass in well-watered (dark gray) and mild droughted (light gray) B. rapa R500 plants (n = 12) collected on Day 3 and Day 4. On both days, above-ground biomass was collected at ZT9. (B) Top and lateral view of well-watered and droughted B. rapa R500 plants on Day 3 and Day 4 of the experiment.
Gas-exchange and chlorophyll a fluorescence changes in response to drought
We observed diurnal changes in gas exchange in the well-watered plants, expressed as WUE and as its components A (Figure 3A, Figure 3—figure supplement 1) and gs (Figure 3B, Figure 3—source data 1). As expected based on a previous analysis (Medrano et al., 2012), WUE did not provide an accurate measure of the plant response to drought stress due to limited drought severity and duration (Figure 3A, Figure 3—figure supplement 1). On both Day 3 and Day 4 of drought, A peaked at Zeitgeber Time (ZT) five where ZT0 corresponded to lights on (Figure 1A). At this time point, we recorded a net CO2 uptake of 12 ± 2 μmol m−2s−1 (Figure 3A). Droughted plants had photosynthetic capacity similar to well-watered plants for the duration of the experiment (Figure 3A), in agreement with previous studies of anisohydric plants where overall photosynthetic capacity was not disturbed by mild drought stress (Chaves et al., 2009; Cornic and Massacci, 1996; Flexas and Medrano, 2002). In contrast, there were significant differences in gs between droughted versus well-watered plants with a reduction of 50% late in the day (ZT13) and 30% at night (between ZT17 and ZT21) on both Day 3 and Day 4 (Figure 3B). Thus, in late afternoon and at night gs responds to small changes in soil water potential and seems to play an important role in the early response to drought. Our results show that B. rapa, like many crops, can reduce CO2 supply before A is impacted (Edwards et al., 2016).
Figure 3 with 1 supplement see all

Specific time-of-day differences in physiology and in dynamics of Non-Structural Carbohydrates (NSC) were observed in B. rapa R500 plants subjected to mild drought relative to control plants.
(A) Photosynthetic rate, A (μmol CO2 m−2s−1) of well-watered controls (green) and mild droughted (orange) plants. (B) Stomatal conductance, gs (mmol H2O m−2s−1) of well-watered controls (green) and mild droughted (orange) plants. (C) Maximum efficiency of PSII in light adapted conditions, Fv’/Fm’ of well-watered controls (green) and mild droughted (orange) plants. (D) NSC accumulation in well-watered (green) and mild droughted (orange) plants. NSC content is expressed as dry weight and refers to the sum of leaves and cotyledon biomass. Tissue collection was carried out every 4 hr during the 2 day time course except for ZT9 when no sugar extraction was performed. White and black bars and gray shading represent the dark period in the growth chambers (14 hr/10 hr; Day/Night). All represented values are averages of at least eight replicates ± SE, asterisks represent a significant difference (p<0.01) between treatments. See Figure 3—figure supplement 1.
-
Figure 3—source data 1
Physiology measurements of well-watered (WW) and droughted (D) plants during Day 3 and Day 4 of the drought time course.
- https://doi.org/10.7554/eLife.29655.008
Our findings are consistent with studies showing that plants can lose as much as 30% of the daily water budget overnight (Dawson et al., 2007; Caird et al., 2007). Night transpiration is hypothesized to occur to enhance nutrient uptake (Matimati et al., 2014) and responds quickly to atmospheric and soil drought (Neumann et al., 2014; Schoppach et al., 2014) as shown here. It is likely that the low nighttime gs observed in R500 plants (Figure 3B) contributed to the maintenance of turgor throughout the four days of drought (Figure 2B). Plants were still far from the wilting point (between −1.7 and −2 MPa) for R500 (Guadagno et al., 2017).
Although signaling mechanisms are not fully understood, diurnal patterns of gs are sensitive to rapid changes in leaf water potential, causing both gs and leaf hydraulic function to decline under stress (Brodribb and Cochard, 2009; Domec et al., 2009) with ABA synthesis as a major control over anisohydric responses (Brodribb and McAdam, 2013). Although an understanding of the relationships between the circadian clock, night transpiration, and nutrient uptake would dramatically improve predictive understanding of drought, information is scarce on how anisohydric plants behave at night in drought conditions (Rogiers et al., 2009; Klein, 2014; Martínez-Vilalta et al., 2014; Attia et al., 2015).
The maintenance of photosynthetic capacity in droughted plants despite the significant decrease in gs may be partly explained by Fv’/Fm’, which was significantly greater for droughted than well-watered plants on both Days 3 and 4 of drought during the middle of the light period (Figure 3C). Fv’/Fm’ presented a diurnal pattern with the highest values early in the day (ZT1 and ZT5) in both droughted and well-watered plants. Elevated Fv’/Fm’ fully compensated for reduced gas exchange under mild drought conditions. Our results are consistent with recent work showing that the circadian clock optimizes photosynthetic capacity by modulating temporal dynamics of Fv’/Fm’ (García-Plazaola et al., 2017).
Dynamics of non-structural carbohydrates under drought
As expected, non-structural carbohydrates (NSC) accumulated during the day and decreased during the night in well-watered conditions (Figure 3D). In droughted plants, NSC levels were elevated throughout the night compared to well-watered controls. The presence of above-ground NSC accumulation suggested that the reduction in biomass observed (Figure 2A) was not due to a reduction in carbon availability but rather to the decreased nighttime conductance that preserves leaf turgor and high water potential (Chaves, 1991) at the cost of sugar translocation to growing tissues (Sevanto, 2014). That NSC levels were elevated at night in droughted plants highlights the close association between water use and carbon dynamics. Specifically, early perception of drought will influence carbon allocation by lowering gas exchange and respiration rate as we observe (Figure 3A). As previously reported, the lower level of respiration led to a decrease in biomass accumulation, and carbon remains in the chloroplasts because of slower transport of sugars out of the leaves (McDowell, 2011). Our results are supported by previous studies under fluctuating environmental conditions in which sugars such as glucose, fructose, and sucrose play a crucial role in maintaining cell turgor and vascular integrity in more extreme drought conditions than those studied here (Volaire, 1995; Sala et al., 2012).
Our time course analysis revealed physiological drought responses between ZT13 and ZT21 of each day, with higher magnitude on Day 4 than on Day 3. Early in drought, plants had lower gs and higher levels of NSC in the above-ground tissues with respect to well-watered plants (Figure 3B,D). We found gs to be the best physiological indicator of the early perception of drought stress in the plant, consistent with the view that A and gs are regulated separately (Dodd et al., 2004; von Caemmerer et al., 2004) and that small decreases in gs do not lead directly to reductions in A under mild drought.
Co-expression network analysis reveals extensive temporal regulation of transcript level differences in well-watered and droughted plants
In parallel with the leaf physiological measurements, transcriptomic analysis (RNA-seq) was performed on leaf tissue to capture the temporal changes in transcript levels during the initial stages of drought. The breadth of circadian and diel regulation of gene expression results in time-of-day-dependent changes in the transcriptome (Harmer et al., 2000; Covington et al., 2008; Michael et al., 2008). Consequently, the response to abiotic stress, and in particular drought, has been shown to be dependent on the time of day in Arabidopsis and poplar, with the maximal transcriptome response occurring late in the day (Dubois et al., 2017; Wilkins et al., 2009; Wilkins et al., 2010) as was found in the physiological traits (Figure 3). To capture the diel transcriptome changes in the early stages of drought we applied a weighted gene co-expression network analysis (WGCNA, Langfelder and Horvath, 2008, Langfelder and Horvath, 2012Langfelder and Horvath, 2012) approach to classify genes based on their expression patterns throughout the day.
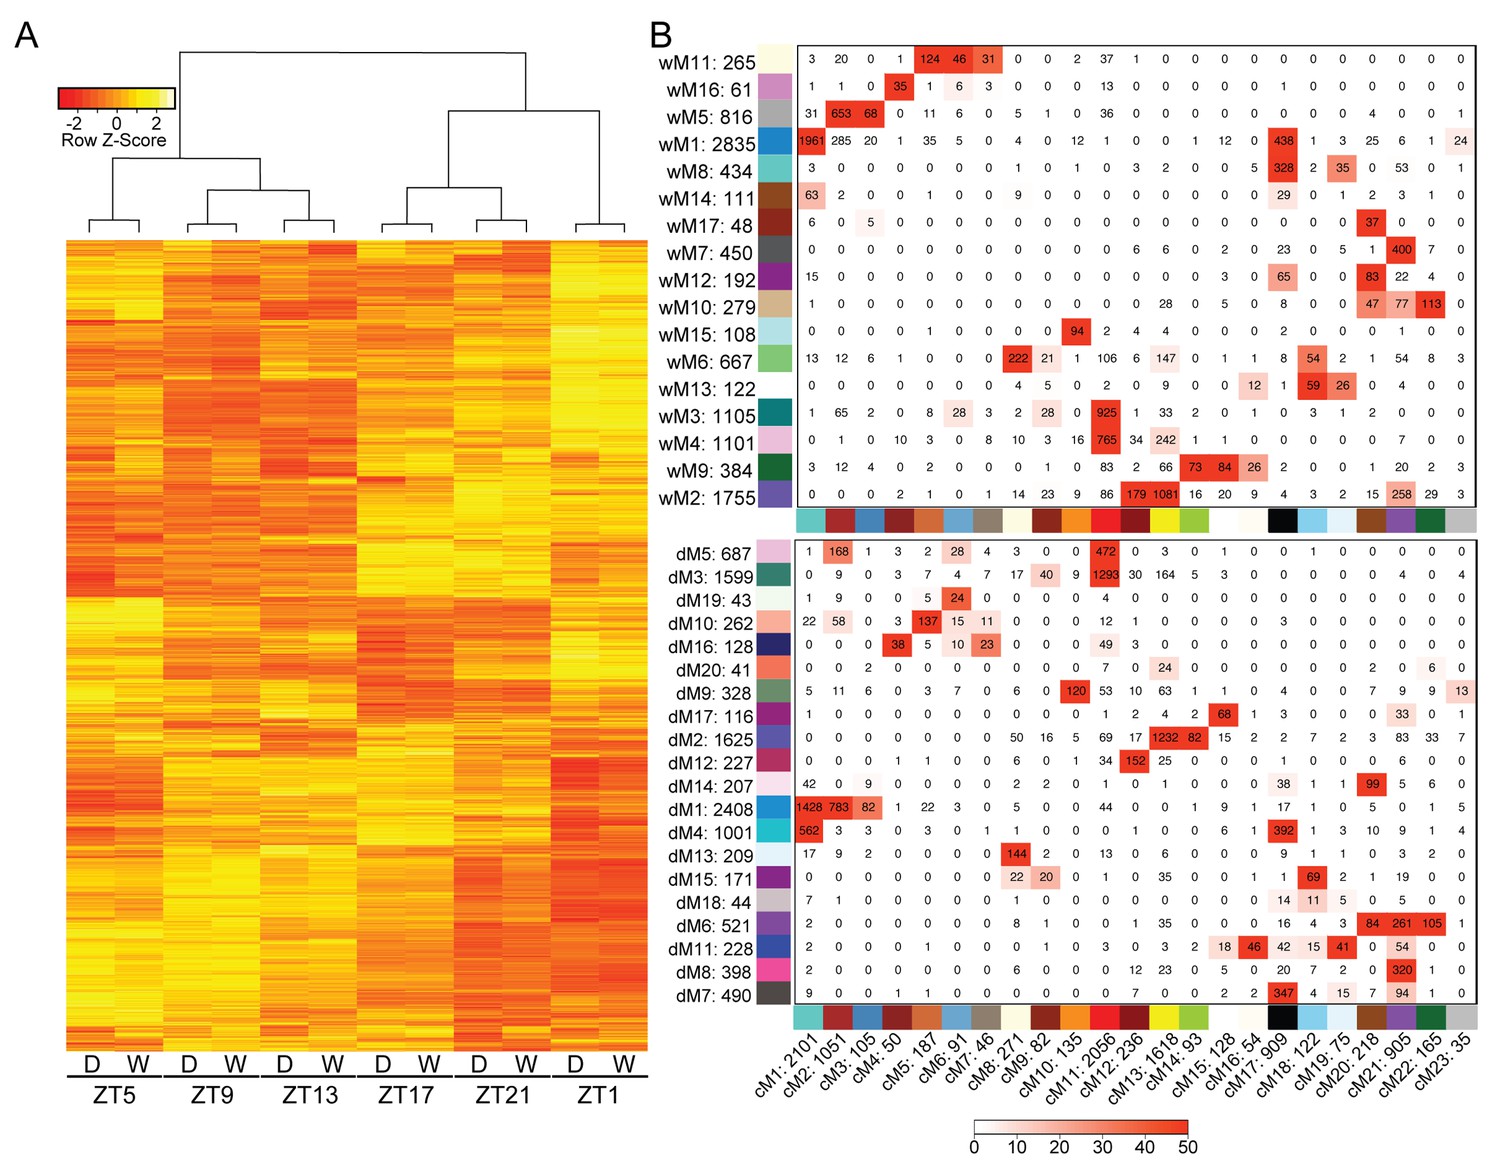
We first generated well-watered and droughted networks and examined the module eigengenes, or principal components, of the gene profiles for each module in the two networks. Not surprisingly, the top eight modules, containing 80–85% of the genes in the network analysis (see Materials and methods, Supplementary file 1), showed strong temporal expression patterns across the two-day time course (Figure 4). Previous studies have shown that time-of-day effects on the transcriptome are often greater than the effect of stress treatment (Wilkins et al., 2010). We performed hierarchical clustering of Day 4 samples from droughted and well-watered plants. In agreement with time-course transcriptome studies in Arabidopsis, poplar, and soybean (Wilkins et al., 2009; Wilkins et al., 2010; Rodrigues et al., 2015; Dubois et al., 2017) samples clustered based on time of day, rather than treatment, revealing that the transcriptome varied more with time of day than due to drought (Figure 5A). To examine the conservation in network topology between the droughted and well-watered transcriptomes, a consensus network to identify modules shared between the two networks was generated as previously described (Langfelder and Horvath, 2008). The consensus network contained significant overlaps in module classifications between the droughted and well-watered networks, consistent with the strong diurnal effects on the transcriptome (Figure 5B).
Figure 4
Co-expression network analysis identifies modules of temporally regulated genes with similar phase patterns.
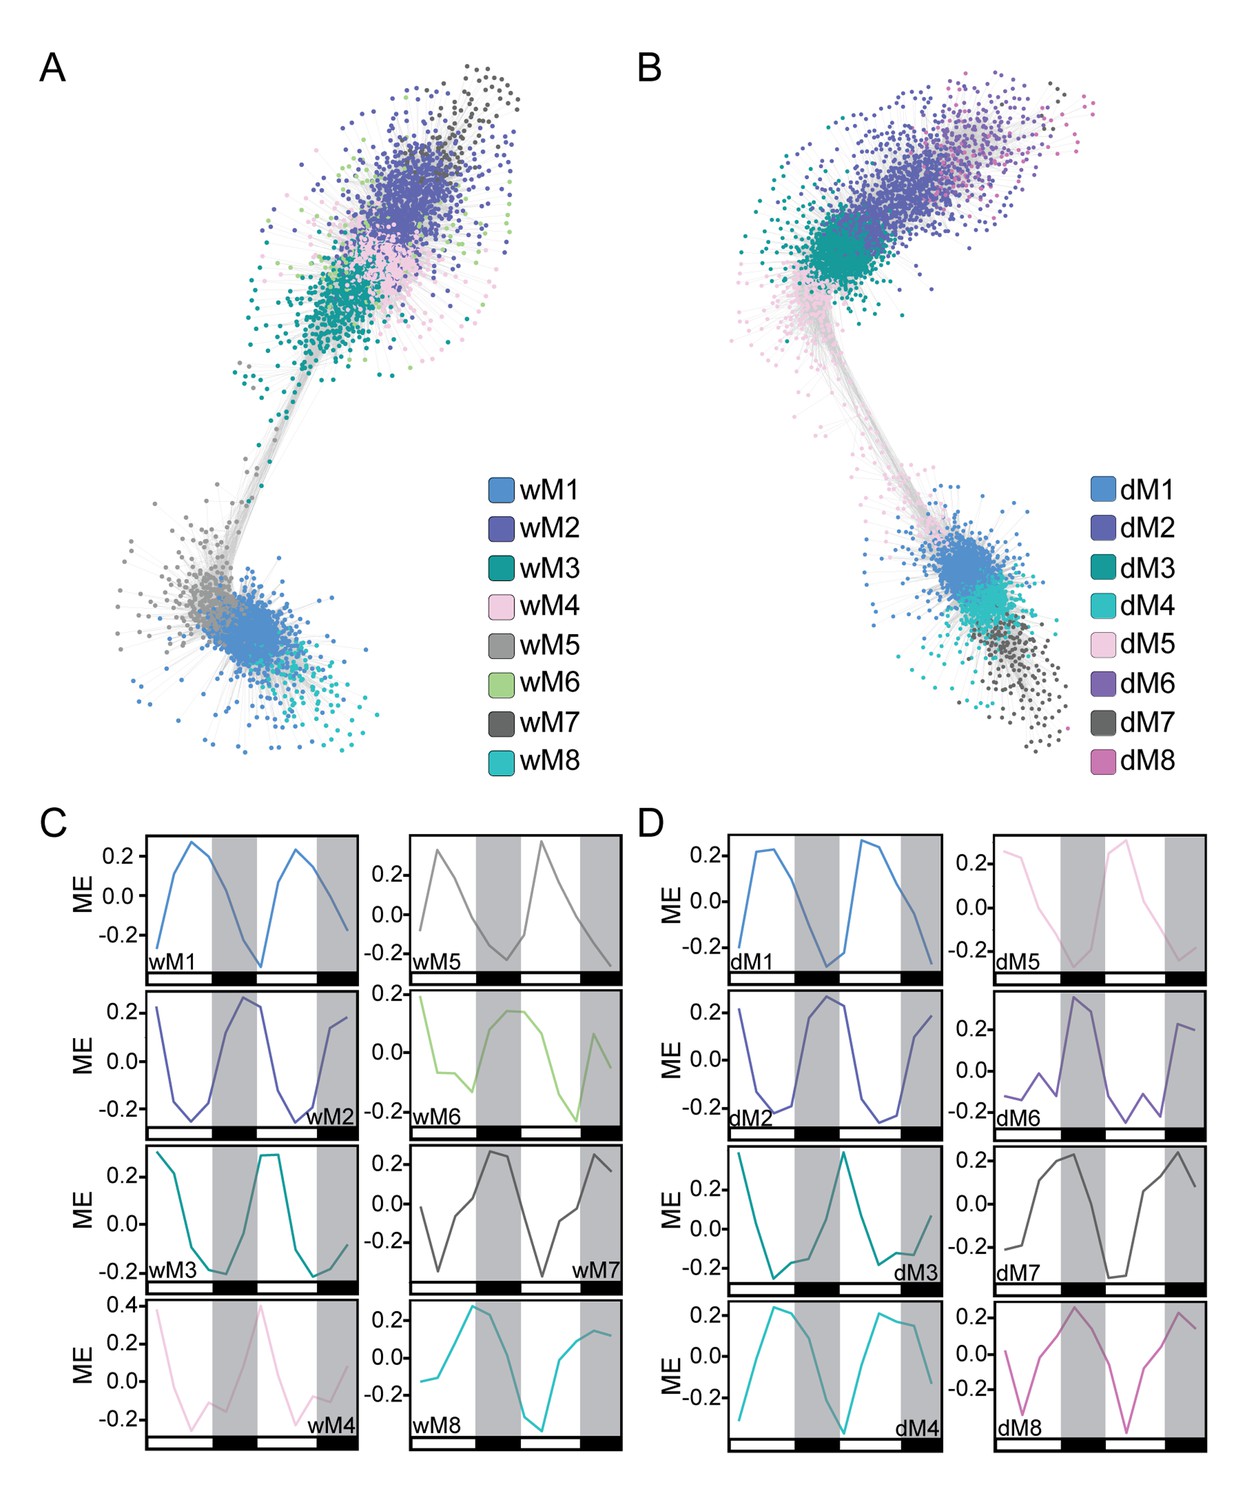
(A and B) The well-watered (A) and droughted (B) networks are shown with gene nodes colored by module membership. Network visualization was done in Cytoscape using a ForceDirected layout with an edge threshold cutoff of 0.1. Modules with significant overlap of gene membership between the well-watered and drought networks are similarly colored. (C and D) The module eigengene (ME) plots for the well-watered (C) and droughted (D) modules reveal temporal regulation of the top eight modules in each network containing ~80–85% of expressed genes. The ME plots are colored based on the modules in the network visualizations. White and black bars along the x-axis represent the day and night time points respectively.
Figure 5
Variation in gene expression over a day is greater than the effects of mild drought.
(A) Hierarchical clustering was performed on the log2 FPKM values for the Day 4 time points for well-watered and droughted plants. (B) Consensus network matrix for the well-watered (top) and droughted (bottom) networks. Consensus modules are listed along the bottom of both matrices with the well-watered and droughted modules along the side. Numbers beside the module number are the total gene counts for that module. Numbers inside the matrix are the number of genes in common between the two modules. Red numbers have significant overlap in gene count based on Fisher’s exact test with the –log(p) of the p-value encoding the coloring (0 = -log(1) and 50 = -log(1E-50)).
The well-watered and droughted networks contained 17 and 20 modules, respectively, suggesting that there are additional expression patterns in the droughted network due to rearrangement of the transcriptome in response to the drought treatment. For example, module 5 from the well-watered network (wM5) contained genes with expression patterns that produce a peak in transcript levels at ZT5 (Figure 6A). Roughly 95% of the genes in the wM5 module resolved into three distinct droughted modules, highlighted by the different color nodes in the network view (Figure 6B). The mean expression of the genes in the droughted modules revealed a change in expression pattern upon drought treatment (Figure 6B). The droughted module 5 (dM5) appeared to be most similar to the wM5 profile, whereas dM1 showed a shift in the phase of the time of lowest transcript level and dM10 shows a bi-phasic expression peak in both days (Figure 6B). Extensive rearrangement of the transcriptomic network, shown graphically in Figure 4, occurred as expected for anisohydric plants adjusting to a mild drought (Dal Santo et al., 2016). Similarly colored modules between the well-watered and droughted networks contained a significant overlap of genes with a common consensus network module (Figure 5B), consistent with their similar eigengene profiles (Figure 4C,D). As demonstrated by the network views (Figure 4A,B), there was visible rearrangement of the genes within the overlapping modules (wM2-4 compared to dM2-5). The co-expression network approach successfully incorporated time-of-day information to group genes based on their diurnal patterns of expression providing a more integrated view of the well-watered and drought transcriptomes.
Figure 6

Expansion of gene expression patterns uncovered in the droughted network.
(A) The wM5 module from the well-watered network is shown with the mean log2 FPKM expression profiles for the genes in the wM5 network that overlap with dM1, dM5, and dM10 modules. (B) The nodes in the wM5 module are highlighted based on their membership in the dM1, dM5, and dM10 modules from the droughted network. The mean log2 FPKM expression values for the genes in common between the wM5 module and each droughted module is shown. Grey shading in the expression profile plots represents the standard error of the mean log2 FPKM expression levels. White and black bars along the x-axis represent the day and night time points, respectively.
Correlating network modules with phenotypic traits
To relate the gene expression modules to the physiology time-course data, we used WGCNA to correlate the module eigengenes with the mean values of each individual physiology measurement (A, gs, NSC, and Fv’/Fm’) at each time point. Gene significance measures were calculated as the absolute value of the correlation with the physiological data (Supplementary file 1, Horvath et al., 2006; Fuller et al., 2007). Several modules in both networks were positively or negatively correlated with various physiological measurements (Figure 7A,B). Modules in both networks with similar phasing had similar trait correlations. For example, the wM5 and dM5 modules with peak expression between ZT1-5 were positively correlated with the A, gs, and Fv’/Fm’, which had similarly phased peaks (Figure 7A,B). Conversely, wM7 and dM8, which peak around ZT17, were negatively correlated with A, gs, and Fv’/Fm’. Both sets of modules had a significant overlap of genes with consensus module 21 (Figure 5B). wM11, wM16, and dM10 were positively correlated with and wM7, wM10, wM12, dM6, and dM8 were negatively correlated with A, gs, NSC, and Fv’/Fm’ (Figure 7A,B). Within the modules there were genes that had high gene significance measures with the physiology and high module membership with the module eigengenes (Figure 7C). The similar correlations observed for both well-watered and droughted networks are to be expected with a treatment that causes mild changes to physiology; however, we did observe significant differences in Fv’/Fm’, gs, and NSC measurements in response to drought, suggesting that these traits are valid predictors of the early perception of drought stress in the plant when sampled throughout the day. We focused on these traits and selected the modules in the droughted network that were significantly correlated with these measures.
Figure 7

Dynamic changes in physiology are correlated with co-expression networks.
(A and B) Correlations between module eigengenes and physiology measurements for well-watered (A) and droughted (B) plants. The numbers within the heat map represent correlations and P values (in parentheses; red, positively correlated, blue, negatively correlated) for the module – trait associations. (C) Scatterplots of gene significance versus module membership for the photosynthetic rate with dM1 (red), PSII efficiency with dM6 (blue), and stomatal conductance with dM13 (black). Significant correlations imply that hub genes within the module are also highly correlated with the physiology measure.
Applying a circadian-guided approach to identify drought responsive genes
Many of the genes within the modules in the droughted network that were significantly correlated with the physiology data were also correlated in the well-watered network making it difficult to identify drought-specific changes. The rhythmic patterns of gene expression and physiology inherent in the data make it amenable to circadian data analyses. In order to identify genes that are differentially expressed in response to drought we applied a circadian transcript analysis program, JTK-CYCLE, to compare the rhythmic profiles of the genes within the modules of interest between the two networks. JTK-CYCLE is a non-parametric statistical algorithm designed to identify circadian regulated transcripts and estimates period, phase, and amplitude (Hughes et al., 2010). The genes within the droughted network modules that were positively (dM1, dM5, dM10, dM16, and dM19) or negatively (dM2, dM6, dM7, dM8, dM11, dM14, dM17, and dM20) correlated with gs and Fv’/Fm’ (Figure 7B) with p<0.01 (Supplementary file 1) were selected for analysis. The expression levels from both the well-watered and droughted datasets were used for JTK-CYCLE with period parameters set at 24 hr since our data was collected under 24 hr light/dark cycles. Genes were classified as rhythmic using a cut-off q-value <0.01 (Supplementary file 2).
Drought-responsive candidate genes were identified based on two criteria. First, we selected transcripts that were not rhythmic in the well-watered dataset but which became rhythmic upon the imposition of drought. Second, among the transcripts that were rhythmic under both conditions, we were interested in transcripts that changed (either increased or decreased) in amplitude of expression upon the imposition of drought. To identify these transcripts we calculated the difference in amplitude for each transcript between the droughted and well-watered datasets and chose transcripts with an amplitude difference greater than 10 for further analysis (Supplementary file 2). To examine the expression change for the selected genes we re-grouped them based on their modules in the droughted network and plotted the mean expression profiles of these genes for each module. We first examined the positively correlated modules (Figure 8A). The log2 mean expression profiles of dM1 and dM5 genes exhibit peak expression levels at ZT5 as do the gs data, consistent with the positive correlation of these modules with gs. In both modules, genes appeared to be down regulated at the end of the light period and into the night for dM1 and down regulated early in the night for dM5. The dM10 module, which was correlated with Fv’/Fm’, showed an elevated level of expression on Day 4 relative to Day 3, consistent with the elevated Fv’/Fm’ in droughted plants on Day 4 (Figure 3C).
Figure 8
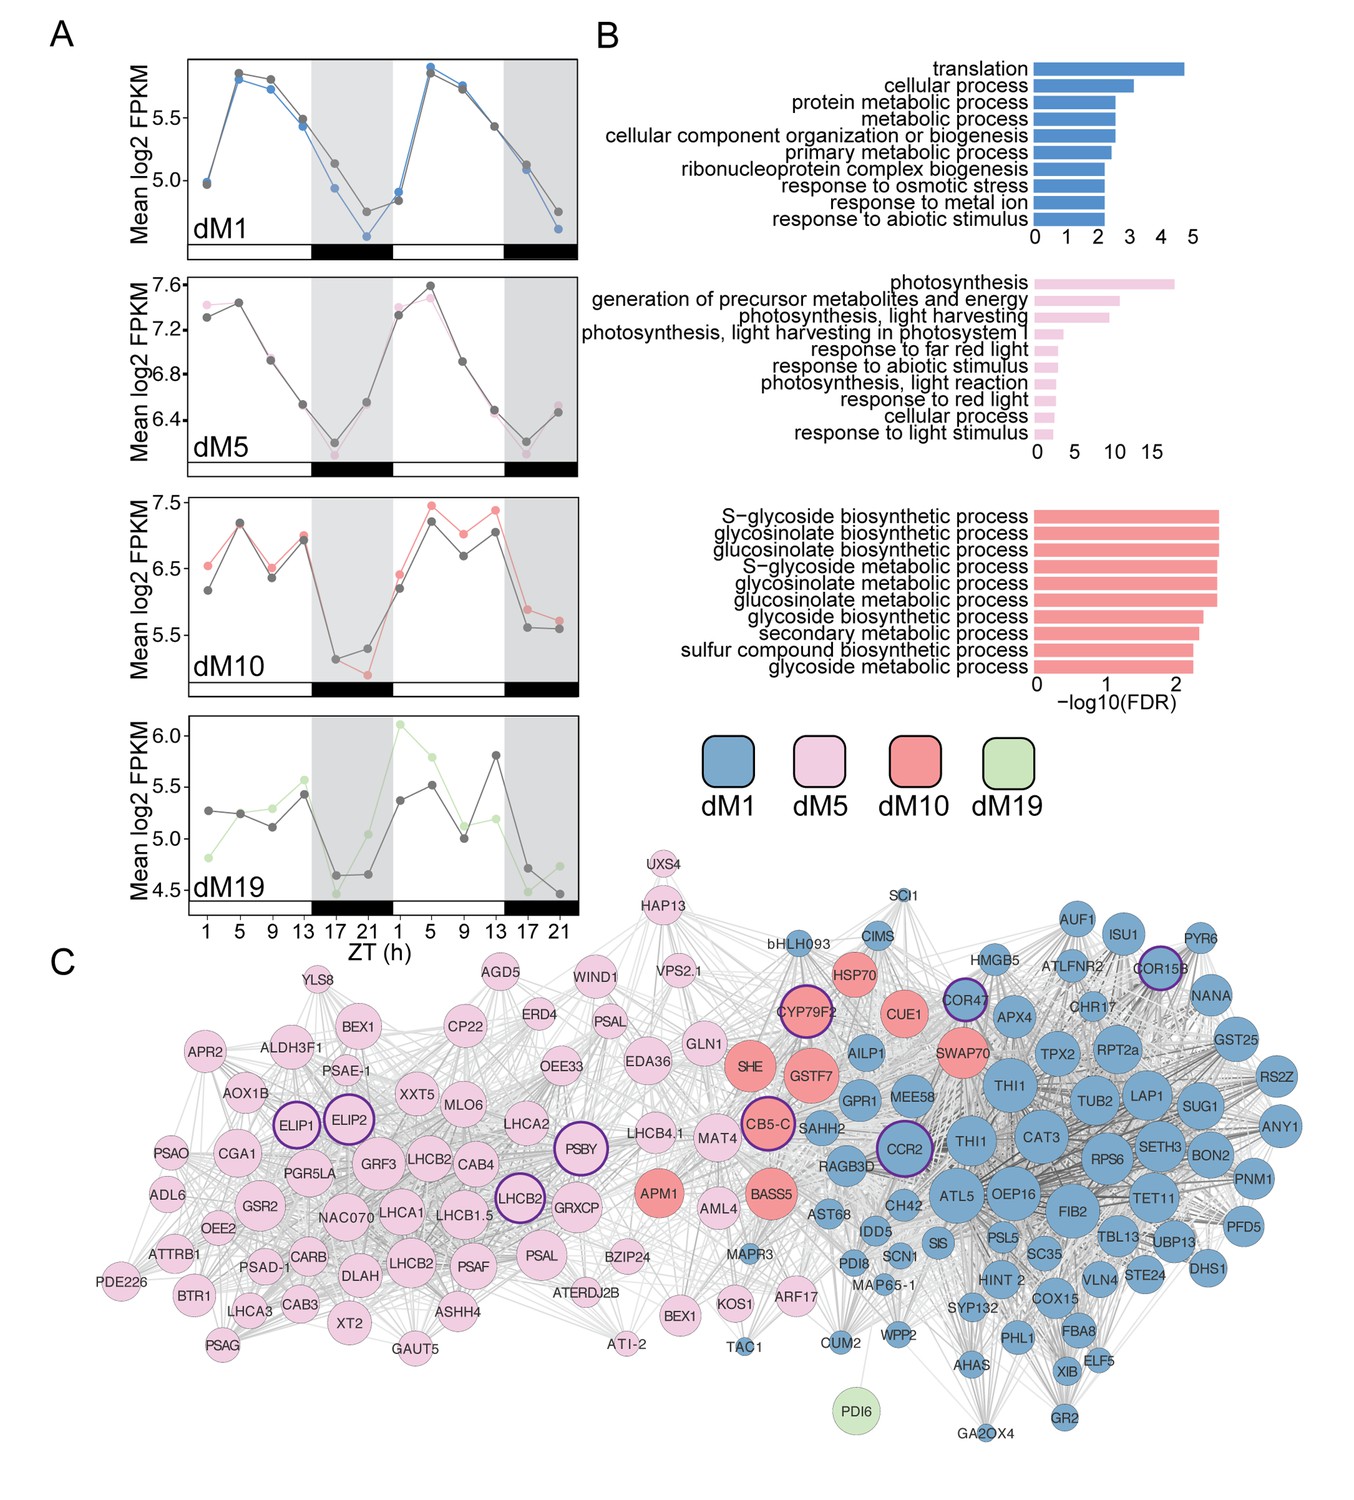
Modules positively correlated with physiology are associated with metabolism and light harvesting processes.
(A) Mean log2 FPKM expression profiles of genes in the dM1, dM5, dM10, and dM19 modules that are positively correlated with stomatal conductance and identified by JTK-CYCLE as having an amplitude change between well-watered and droughted samples. Grey lines are always well-watered. White and black bars along the x-axis represent the day and night time points, respectively. (B) Top 10 associated GO terms for dM1 (top), dM5 (middle), and dM10 (bottom). (C) Genes identified in the dM1, dM5, dM10, and dM19 modules with known Arabidopsis orthologs are shown in the network view. Nodes are colored based on module and size based on module membership. The larger nodes are highly connected within a module and have greater ‘hubness’. The nodes circled in purple were validated by Nanostring.
To validate the biological relevance of the selected genes from these modules, we analyzed the top 10 enriched GO categories for the positively and negatively correlated module lists containing at least five genes with Arabidopsis syntenic orthologs. The dM1 module was enriched for primary metabolism and response to abiotic stimulus (Figure 8B,C). dM5 was enriched for photosynthesis, response to light, and abiotic stress stimulus (Figure 8B,C). Abiotic stress response is expected under mild drought in anisohydric plants because the mesophyll cells are exposed to lower water potentials earlier in the drought than in isohydric plants (Dal Santo et al., 2016). Interestingly, the dM10 module with the bi-phasic peaks contained genes involved in glucosinolate biosynthesis and metabolism (Figure 8B,C). Previous work has shown that abiotic stress leads to an increase in secondary metabolism that is likely the result of carbon reallocation (Del Carmen Martínez-Ballesta et al., 2013). At Day 4, the stage in the mild drought treatment at which Fv’/Fm’ was beginning to decrease, the transcript data suggested that the plant is altering glucosinolate production. Although the exact purpose of this response is unclear (Del Carmen Martínez-Ballesta et al., 2013), growth-defense tradeoffs are expected when stress reduces growth (Züst and Agrawal, 2017) and secondary metabolism alterations can change circadian clock outputs (Kerwin et al., 2011) that potentially include drought responses.
We next examined the modules that were negatively correlated with gs and Fv’/Fm’. Consistent with the significant decrease in gs on Day 4 in droughted plants compared to well-watered plants, the genes in these modules showed a decrease in expression on Day 4 and in the case of dM6 an increase in expression on Day 3 as well (Figure 9A). Interestingly, dM6 and dM8 displayed slight phase shifts in expression pattern with an earlier peak in expression on Day 3 compared to Day 4 suggesting that these genes contribute to the initial stages of the drought response. The genes in these modules are related to photosystem efficiency and light response pathways (Figure 9B,C), consistent with the decrease in Fv’/Fm’ observed on Day 4. dM7, dM11, and dM17 show dramatic decreases in expression on Day 4 relative to well-watered plants and contain genes involved in nitrogen metabolism, amino acid biosynthesis, and phosphatase activity (Figure 9B,C).
Figure 9
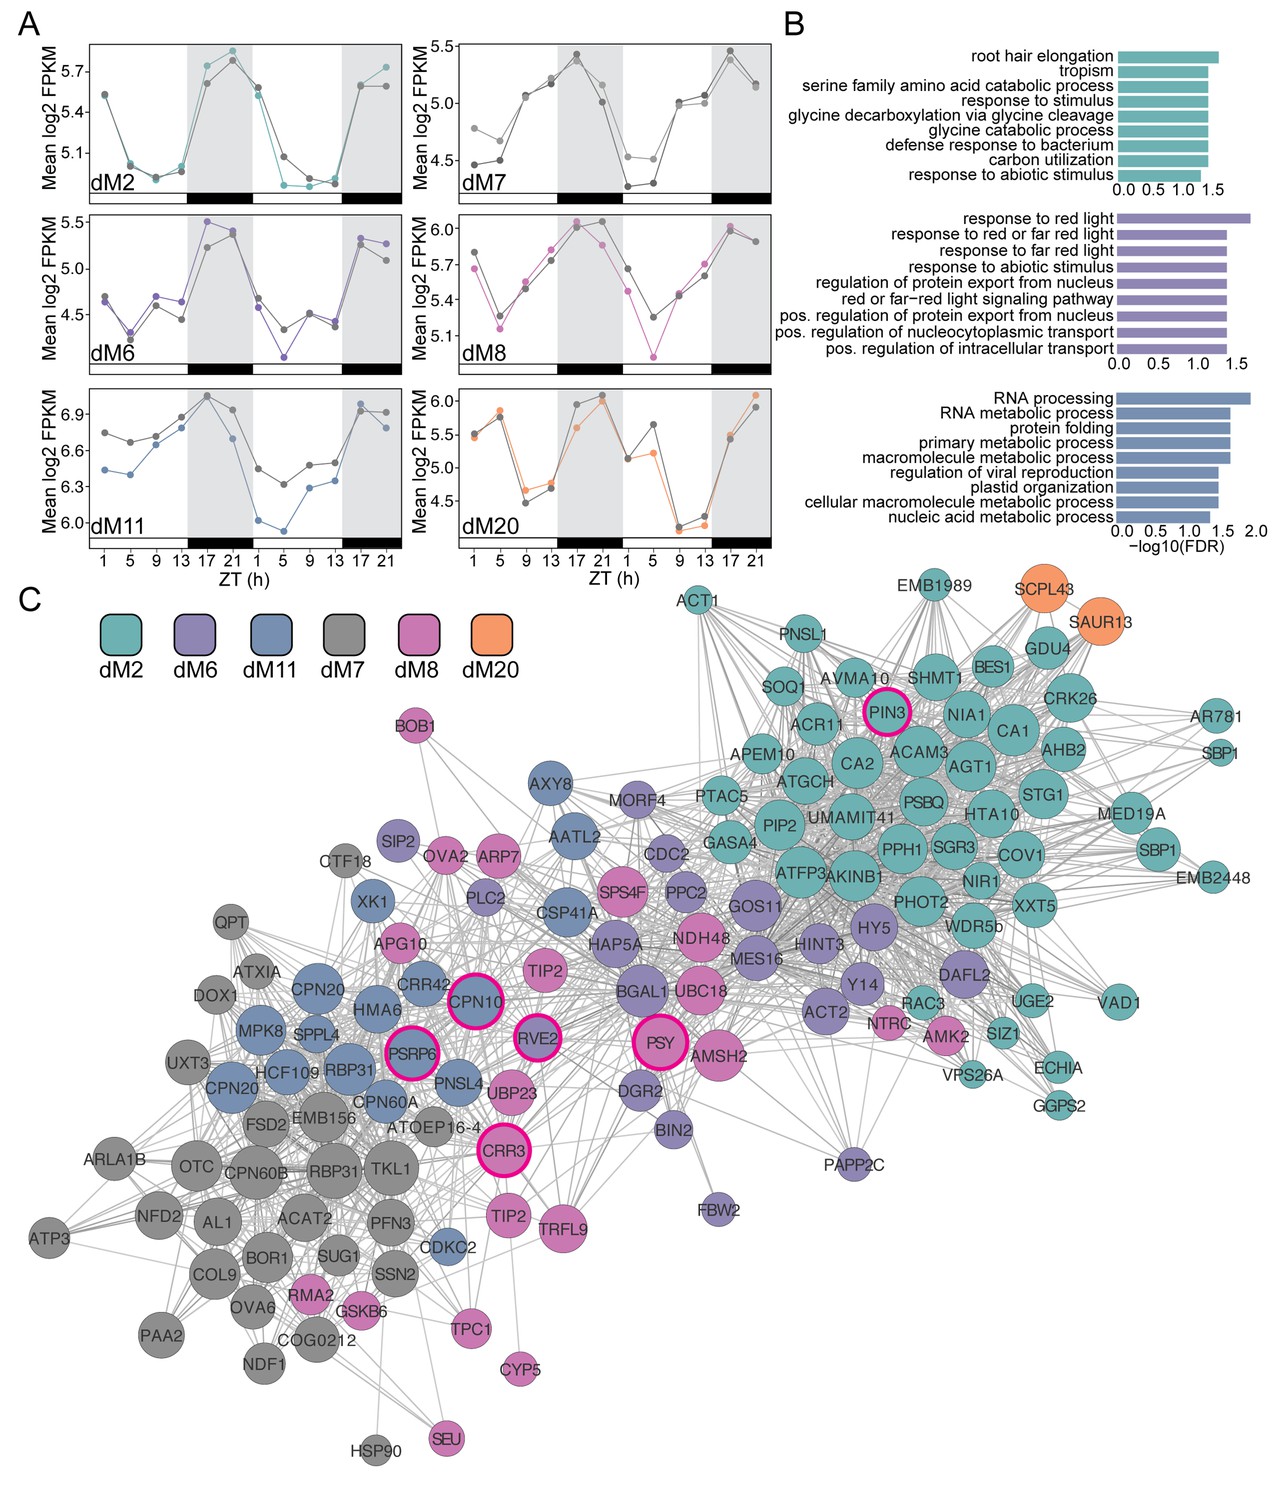
Modules negatively correlated with physiology are associated with abiotic stress and light response.
(A) Mean log2 FPKM expression profiles and of genes in the dM2, dM6, dM7, dM8, dM11, and dM20 modules that are negatively correlated with stomatal conductance and identified by JTK-CYCLE as having an amplitude change between well-watered and droughted samples. Grey lines are always well-watered. White and black bars along the x-axis represent the day and night time points, respectively. (B) Top 10 associated GO terms for dM2 (top), dM6 (middle), and dM11 (bottom). (C) Genes identified in the dM2, dM6, dM7, dM8, dM11, and dM20 modules with known Arabidopsis orthologs are shown in the network view. Nodes are colored based on module and size based on module membership. The larger nodes are highly connected within a module and have greater ‘hubness’. The nodes circled in magenta were validated by Nanostring.
Comparing circadian features proved to be an effective way of identifying genes with altered patterns in the droughted relative to the well-watered network as seen by the significant GO enrichment of the selected genes (Figures 8 and 9) that not only validates the biological relevance of the module structure but also the potential importance of the selected genes within these pathways. For this analysis, we chose an amplitude change of 10 as a cutoff based on an initial screen of rhythmic gene expression profiles but there are likely to be genes outside of this cutoff that exhibit a biologically meaningful change and genes within the list that do not. To validate some of the identified genes, we compared the expression levels in five biological replicate plants for each treatment, harvested during the drought experiment, without pooling of tissue from multiple plants as was done with the RNA-seq experiment. One of the limitations of time-course experiments is the cost associated with sequencing each time point at high replication. Using the JTK-CYCLE filtered gene list, we ranked the genes based on their module membership and selected the top three genes from the modules correlated with the physiology data (Figures 8 and 9). In addition, we selected genes from the list with GO ontologies associated with abiotic stress response and light harvesting processes. We identified a list of 36 genes for validation using the NanoString PlexSet technology.
The NanoString data supported the trends observed in the RNA-seq dataset. The diel expression patterns seen in the well-watered and droughted plants and specific time-of-day responses to drought were recapitulated for the genes evaluated (Figure 10, Figure 10—figure supplements 1 and 2, Figure 10—source data 1). The expression of two members of the C-repeat-binding factor (CBF) regulon COR15B and COR47 (dM1, Figure 8C) showed increased and shifted peak expression on Day 4 of droughted plants relative to well-watered plants (Figure 10) consistent with their known roles in abiotic stress response (Novillo et al., 2007). Consistent with the increase in Fv’/Fm’, several genes related to light harvesting and photosystem regulation showed elevated expression levels during the day in droughted plants. The EARLY LIGHT-INDUCIBLE PROTEIN 1 and 2 (ELIP1/2) genes (Figure 8C), members of chlorophyll a/b – binding (CAB) protein superfamily and postulated to be photoprotectants for PSII under various stress conditions (Hayami et al., 2015) were both elevated in expression level and showed phase-delayed expression profiles (Figure 10). Components of PSII, LIGHT-HARVESTING CHLOROPHYLL B-BINDING 2 (LHCB2.2) and PHOTOSYSTEM II BY (PSBY), also exhibited elevated expression during the day (Figure 8C, Figure 10). As with all studies that use a correlation in time to study gene expression to trait relationships, we could not address gene expression to trait relationships that take longer than 4 hr, our sampling frequency. Similarly, we note that changes in transcript abundance do not inevitably result in changes in protein abundance or activity and will not identify meaningful changes resulting from post-translational regulation (Graf et al., 2017).
Figure 10 with 2 supplements see all
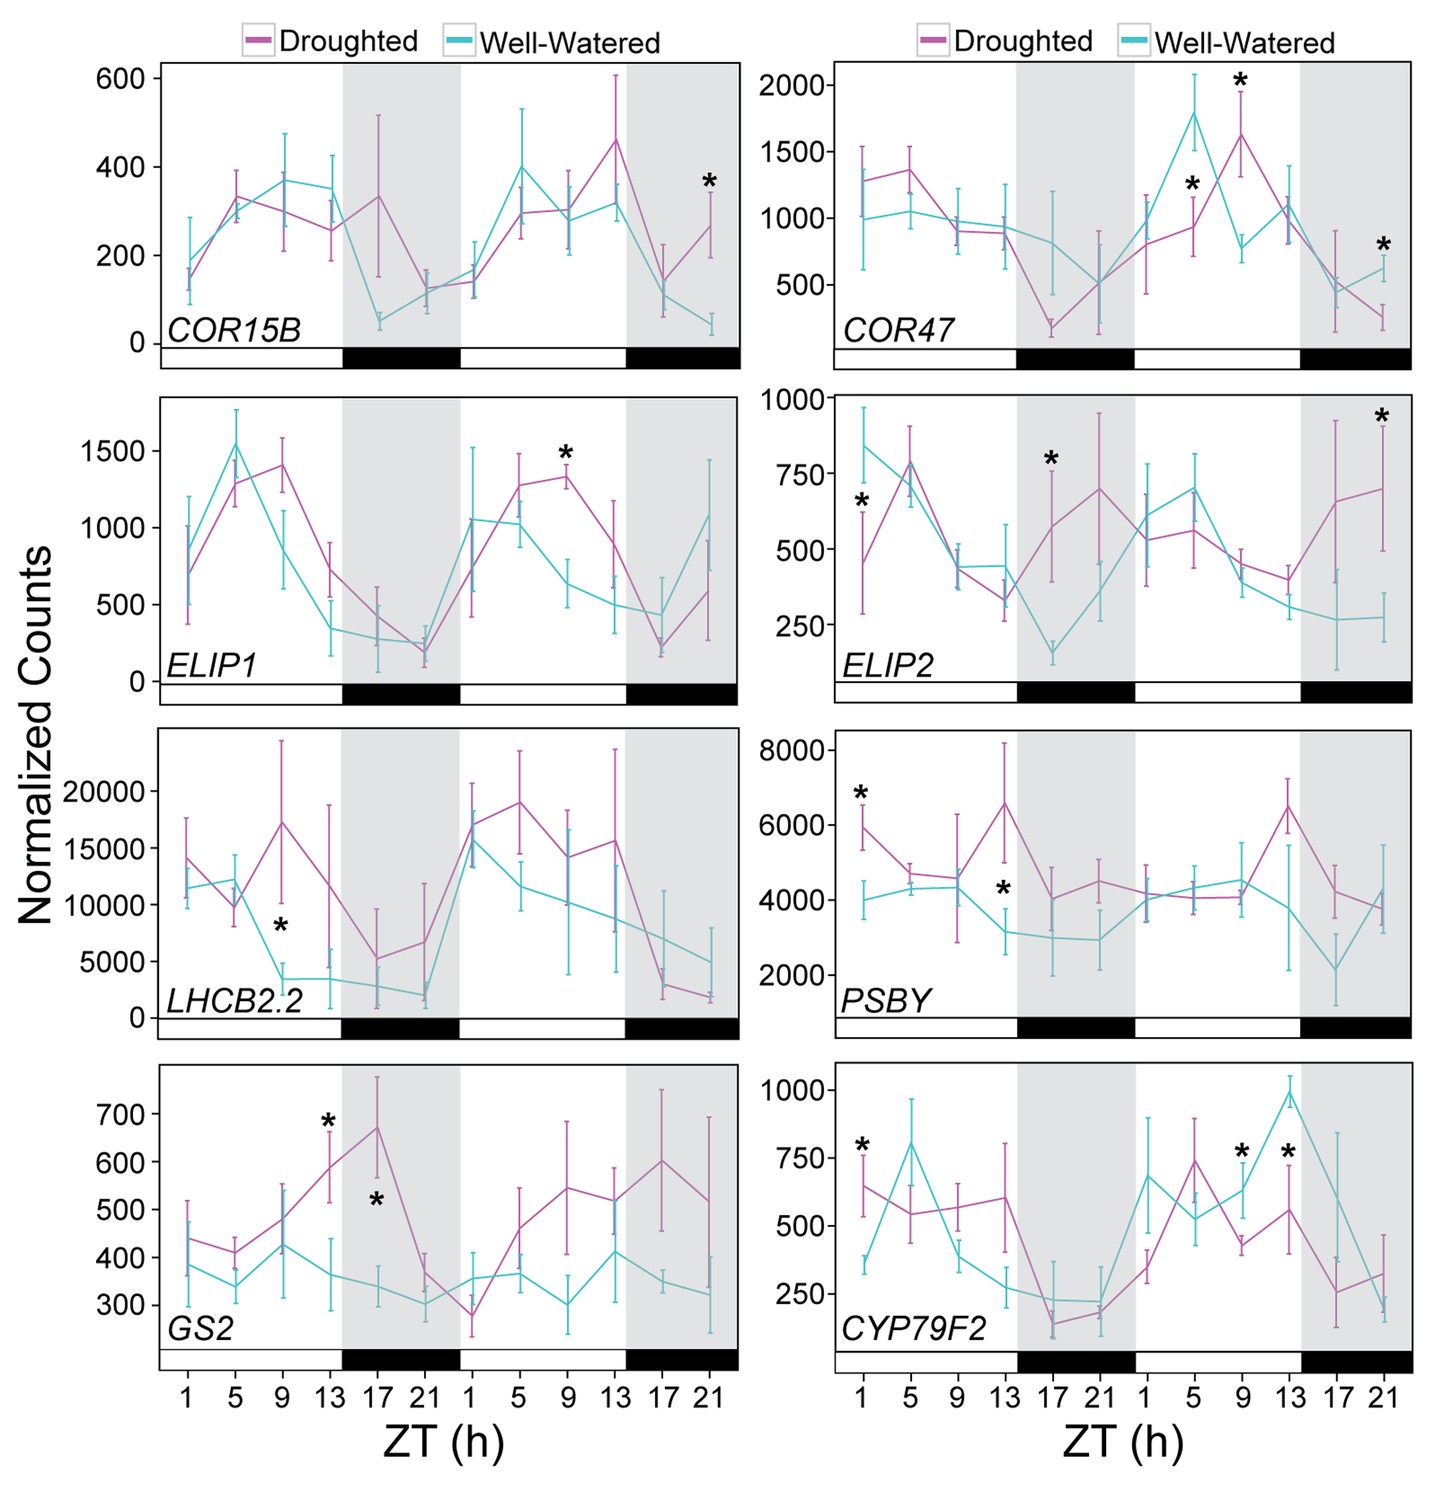
Validation of drought-responsive genes supports alterations of light harvesting processes and metabolism.
Gene expression for a set of drought-responsive genes identified from the JTK-CYCLE filter. NanoString was performed on RNA isolated from leaf tissue harvested during the RNA-seq time course experiment. Each data point represents the mean of 5 individual plants. Gene counts were normalized to Bra021441, Bra014841, and Bra020305. Error bars represent SE. Grey shading indicates the dark period. Asterisks indicate significant difference (p<0.05). See Figure 10—figure supplement 1.
-
Figure 10—source data 1
List of genes selected for gene expression validation using NanoString.
- https://doi.org/10.7554/eLife.29655.018
In addition to changes associated with light responses, altered expression for genes involved in nitrogen metabolism was confirmed. The GLUTAMINE SYNTHETASE 2 (GS2) gene, encoding the light- and CO2-induced chloroplastic glutamine synthetase GS2 that assimilates ammonium produced during photorespiration and nitrite reduction (Taira et al., 2004) was elevated late in the day in droughted plants (Figure 10, Figure 10—figure supplement 2). An overall reduction in expression of the mRNA encoding an integral membrane HPP family protein predicted to transport nitrite into plastids (Maeda et al., 2014) was observed in droughted plants (Figure 10—figure supplement 1). The decrease in nitrate transport is consistent with a decrease in nutrient uptake, and the increase in GS2 levels may be a response to ammonium produced from an increase in photorespiration. The drop in gs during the night and the accumulation of NSC in droughted plants on Day 4 of the treatment coincided with decreased expression of the gene encoding CYP79F2, which metabolizes long-chain aliphatic glucosinolates (Figure 8C, Figure 10). The nitrogen metabolism changes are consistent with the role of night transpiration in nitrogen uptake (Matimati et al., 2014) and the constitutive nature of nitrogen uptake and assimilation compared to other nutrients (Hole et al., 1990) and suggest a fruitful line of research on interactions among drought, nitrogen uptake and assimilation, and the circadian clock. Knockdown of CYP79F2 using RNAi in Arabidopsis led to a drop in aliphatic glucosinolates and an increase in indole glucosinolates as well as storage carbohydrates such as fructose and galactose in addition to changes in several hormone levels (Chen et al., 2012). The significant drops that we observed in CYP79F2 expression occurred at the ZT9 and ZT13 time points on Day 4 of the treatment when sugar accumulation was observed (Figures 3D and 10). These temporal changes in gene expression are examples of the rearrangements seen in the drought network and offer new insights into the dynamic transcriptome level changes occurring following early drought perception in B. rapa.
In this study we characterized the onset of drought response by using temporal changes in physiology to support the biological significance of transcriptome changes. This approach validated the need for time-of-day resolution to observe the dynamic changes in physiology and to filter out the diel changes that cause transcript abundance variations independent of treatment. Integrating these dynamic changes in physiology with the transcriptome data using a circadian-guided network approach uncovered changes in expression of several photosynthetic and metabolic genes, suggesting an early sensing of the drought treatment at the molecular level. Future work is needed to compare the time-of-day dependent drought response of these genes in genetically and phenotypically diverse plants in order to associate the unique transcript dynamics with specific physiological responses to drought.
Materials and methods
Plant material and growth conditions
Request a detailed protocolSeeds of Brassica rapa subsp. trilocularis (Yellow Sarson) R500 were planted in pots (156 cm3) filled with a soil mix (Miracle-Gro Moisture control Potting Mix (20% v/v), Marysville, OH, and Profile Porous Ceramic (PPC) Greens Grade (80% v/v), Buffalo Grove, IL) amended with 2 ml of Osmocote 18-6-12 fertilizer (Scotts, Marysville, OH) per pot. Plants were randomized per treatment into four growth chamber compartments (PGC-9/2 Percival Scientific, Perry, IA). Chambers were set to a 14 hr/10 hr (day/night) photoperiod with a photosynthetic photon flux density (PPFD) at the plant height of ~130 μmol photons m−2 s−1. Temperature was set to 21°C (±2)/18°C (day/night) cycle with relative humidity maintained between 28–33%.
Experimental design
Request a detailed protocolPlants were watered daily to maintain moist soil conditions until 16 days after sowing (DAS) when water was withheld from half the plants (Droughted; Figure 1A). Sampling began two days after drought onset (18 DAS), with samples collected every 4 hr over 48 hr beginning 1 hr after lights on (ZT1) on the third day of drought (Figure 1A). The well-watered soils maintained soil water potential (Ψs) between 0 and −0.5 MPa throughout the experiment (Figure 1B). Ψs declined progressively to −1.5 MPa over the 48 hr for the droughted plants (Figure 1B). Physiological data and leaf tissue for RNA-seq were collected in separate experiments performed under identical conditions (Figure 1B) in order to minimize duration of sampling and to avoid potential alterations of gene expression in response to perturbations associated with the physiological measurements. To assess whether the two experiments elicited similar physiological responses to drought, Fv’/Fm’ was measured at 4 hr intervals during the day and above-ground biomass was determined at ZT17 on Day 3 and Day 4 for each experiment; neither showed any significant difference between the two experiments (Supplementary file 1). Accordingly, for these two traits, we pooled data from the replicate experiments (Figure 3—source data 1).
Gas exchange
Request a detailed protocolPhotosynthetic rate (A) and stomatal conductance (gs) were measured on the youngest fully expanded leaves according to the protocol described by Long and Bernacchi (Long and Bernacchi, 2003) using three portable gas exchange systems provided with a 2 cm2 leaf chamber fluorimeter (LI-COR-6400XT; LI- COR Biosciences Inc., Lincoln, NE, USA). All spot measurements were taken in the same growth chamber compartment where plants were growing, and environmental conditions in the cuvette matched those in the growth chamber. The following conditions were set for the LiCOR measurements: flow rate, 300 μmol s−1; CO2 concentration, 400 μmol mol−1; VPD, 1.3–1.9 kPa; PPFD, 150 μmol photons m−2 s−1; leaf temperature, 22°C; and the cuvette fan was set to fast. Measurements in the dark (ZT14 through ZT24 on Day 3 and Day 4) were taken with the same cuvette settings except that a dim green light (~1 μmol photons m−2 s−1) was used. For each replicate, gas exchange values were recorded after stabilization of the readings (max 4 min). The intrinsic WUE was calculated as A/gs according to Seibt et al. (Seibt et al., 2008).
Chlorophyll a fluorescence
Request a detailed protocolChlorophyll a fluorescence (Humplík et al., 2015) was measured using a hand-held fluorimeter (Fluopen FP100, PSI, Brno, Czech Republic) as Fv’/Fm’, maximum efficiency of PSII in light conditions. The actinic light source of the FluorPen was maintained at ~200 μmol photons m−2 s−1. Fv’/Fm’ was measured using a saturation pulse (0.800 s;~2200 photons μmol m−2 s−1). Calculations of Fo' used the following equation from Oxborough and Baker (Oxborough and Baker, 1997) where Fo’=Fo/(FvFm +Fo/Fm'). For the nighttime samples (ZT14 through ZT24 on Day 3 and Day 4), Fv/Fm, maximum efficiency of PSII in dark-adapted conditions, was measured as described previously (Murchie and Lawson, 2013); the measuring light of the FluorPen was set at ~1,500 μmol photons m−2 s−1 with a saturation pulse at ~2200 photons μmol m−2 s−1. All dark measurements were taken using a dim green light (~1 μmol photons m−2 s−1).
Above-ground biomass
Request a detailed protocolAt ZT17 on Day 3 and Day 4, six replicate plants from each treatment were harvested for fresh and dry biomass measures. Above-ground tissue was cut at the soil level with a razor blade, weighed, oven-dried for 10 days at 65°C and weighed again for dry biomass.
Non-structural carbohydrates
Request a detailed protocolNSC were measured using the anthrone method (Seifter et al., 1950). Above-ground plant tissue (leaves and cotyledons) was collected, flash-frozen, and ground. The powder (~0.1 g), after air-drying, was extracted in 10 ml of 80% ethanol, incubated at 80°C for 30 min, and centrifuged for 5 min. The pellets were extracted two more times with 80% ethanol. An aliquot of the extract was hydrolyzed in 5 ml anthrone solution (4 g anthrone in 1000 ml 95% H2SO4; Sciencelab.com, Houston, TX) in a boiling water bath for 15 min. After cooling, the sugar concentration was determined spectrophotometrically at 620 nm using glucose as a standard.
Statistical analysis for physiology data
Request a detailed protocolWe averaged all replicate samples for each physiological trait and calculated standard errors for each time point. The two treatments were compared at every time point using a one-tailed unpaired Student’s t-test.
Collection of leaf tissue for RNA-sequencing
Request a detailed protocolFor RNA-seq, ~1 cm2 sections were cut from the youngest fully developed leaf and immediately flash frozen in liquid nitrogen. Preserved tissue was placed in long-term storage at −80°C until RNA extraction. At each time point, tissue from 10 plants in the same treatment was collected and five plants were pooled for each biological replicate, resulting in two biological replicates per treatment at each time point.
RNA-sequencing library preparation and processing
Request a detailed protocolWe used a modified mRNA isolation protocol (Supplementary file 3) to isolate mRNA directly from B. rapa R500 leaf tissue. The mRNA was used to make strand specific libraries according to the low-cost library protocol from Wang et al. (Wang et al., 2011a). Library quality and size were verified using a 2100-bioanalyzer (Agilent Technologies, Santa Clara, CA). Libraries were pooled into 12 sample sets and sequenced across 4 lanes (12 time points/time course +2 replicates of each treatment = 48 libraries) as 101 bp paired-end reads using Illumina HiSeq2500 (Illumina, San Diego, CA). Raw data has been submitted to GEO (http://www.ncbi.nlm.nih.gov/geo) under accession number GSE90841. The raw fasta reads were filtered using trimmomatic (RRID:SCR_011848; http://www.usadellab.org/cms/index.php?page=trimmomatic) with mostly default settings (ILLUMINACLIP:./TruSeq3-PE-2.fa:2:30:10 LEADING:3 TRAILING:3 SLIDINGWINDOW:4:25 HEADCROP:14 MINLEN:50). Prior to aligning to the Chiifu reference genome (Wang et al., 2011b), existing R500 DNA-seq data (https://www.ncbi.nlm.nih.gov/sra; SRR065676) were used to call SNPs in the Chiifu genome using GATK (RRID:SCR_001876; https://www.broadinstitute.org/gatk/) with default settings. The vcf file generated by GATK was filtered to remove any SNPs with a quality score below 30, coverage below 10 and all heterozygous SNPs. The remaining SNPs were used to replace the Chiifu reference genome using the vcf-consensus tool in the VCFtools package (RRID:SCR_001235; http://vcftools.sourceforge.net/perl_module.html). Tophat2 (RRID:SCR_013035) was used to align the RNA-seq reads to the modified Chiifu genome file using default settings and first-strand library type. Transcripts were assembled using cufflinks with the Chiifu reference Brassica_rapa.IVFCAASv1.19.gtf annotation file. FPKM values were generated using cuffdiff (RRID:SCR_001647) with –-no-diff –-no-js-tests options (Trapnell et al., 2010; 2012).
WGCNA network analysis
View detailed protocolThe well-watered and drought time course datasets were filtered to remove any genes that did not reach an FPKM value of 10 in at least one time point in order to remove non-varying or low-abundance genes that introduce noise into the network analysis. Log2 normalized FPKM values were used to generate the co-expression networks using the WGCNA (RRID:SCR_003302) package in R (Team RC, 2016; Langfelder and Horvath, 2008; Langfelder and Horvath, 2012). Independent signed networks were constructed from the well-watered and drought time-course samples. An adjacency matrix was constructed using a soft threshold power of 16. Network interconnectedness was measured by calculating the topological overlap using the TOMdist function with a signed TOMType. Average hierarchical clustering using the hclust function was performed to group the genes based on the topological overlap dissimilarity measure (1-TOM) of their connection strengths. Network modules were identified using a dynamic tree cut algorithm with minimum cluster size of 30 and merging threshold function at 0.25. To visualize the expression profiles of the modules, the eigengene (first principal component) for each module was plotted using ggplot2 in R. To identify hub genes within the modules, the module membership (MM) for each gene was calculated based on the Pearson correlation between the expression level and the module eigengene. Genes within the module with the highest MM are highly connected within that module. To relate the physiology measurements with the network, the module eigengenes were correlated with the physiology data. Correlations were performed for each physiology trait separately using the mean values at each time point to associate the diel patterns between the physiology and eigengenes. To associate individual genes with the physiology we calculated Gene Significance (GS) as described in the WGCNA package as the absolute value of the correlation between gene expression and physiology across the time series.
NanoString sample preparation and analysis
Request a detailed protocolTo validate a subset of genes identified in the WGCNA and JTK-CYCLE analysis, five individual plants from the well-watered and drought conditions were collected during the time course experiment alongside the plants harvested for RNA-seq. Leaf tissue was ground in Lysis Binding Buffer (LBB) as described in the mRNA extraction protocol (Supplementary file 3). Following the centrifugation in LBB, 400 μl of lysate was used for RNA extraction using the Zymo Research Plant RNA MiniPrep kit (Zymo, Irvine, CA). RNA purity was assessed with a NanoDrop spectrophotometer (Thermo Fisher Scientific, Waltham MA), and concentration was determined using the Qubit broad range RNA assay kit according to the manufacturer’s instructions (Thermo Fisher Scientific, Waltham MA). An initial RNA titration test was performed for each probeset with 50 ng, 100 ng, 150 ng and 200 ng probe to optimize the concentration. We chose 150 ng for the full time course assay. All five replicate samples for each time point and treatment were randomly arranged across 96-well plates with a random set of technical replicates. The NanoString PlexSet assay was performed according to the manufacturer’s instructions (NanoString Technologies, Seattle, WA) at the Molecular Biology Core Facility at Dartmouth College. Normalization was performed using the NanoString nSolver Analysis Software 3.0 with default settings. The housekeeping genes selected for Content Normalization were Bra021411, Bra014841, and Bra020305. These genes were selected based on criteria including absence from the rhythmic modules and JTK-CYCLE list of cycling genes and low level of overall change in FPKM across the 2 day time course in both the well-watered and droughted samples. These genes also represent low, medium, and high expression levels. For the CodeSet normalization, a row of the plate containing technical replicates of two pooled RNA samples (droughted samples Day 3 ZT5 and Day4 ZT39) were used. Normalized data were exported and further analyzed in R. Based on the technical replicate comparisons it was evident that there are occasional spurious probe counts for a single gene within a sample that were not reproduced in the technical replicate indicating a technical problem rather than biological. To remove these probe counts we calculated the modified Z-score for each probe across all samples and removed probes above 3. For all samples with technical replicates we selected the sample with the lowest maximum modified Z-score. The five biological replicate samples were averaged, and standard errors calculated for each time point and a one-tailed unpaired Student’s t-test was performed to compared data from the well-watered and droughted samples at every time point.
Data availability
-
Network analysis identifies temporal regulation of transcriptomic and physiological responses to early drought perception in Brassica rapa.Publicly available at the NCBIGene Expression Omnibus (accession no: GSE90841).
References
-
Linking definitions, mechanisms, and modeling of drought-induced tree deathTrends in Plant Science 17:693–700.https://doi.org/10.1016/j.tplants.2012.09.006
-
Response of four Brassica species to drought stressEnvironmental and Experimental Botany 30:93–100.https://doi.org/10.1016/0098-8472(90)90013-T
-
Growth and physiological responses of isohydric and anisohydric poplars to droughtJournal of Experimental Botany 66:4373–4381.https://doi.org/10.1093/jxb/erv195
-
Drought resistance, water-use efficiency, and yield potential—are they compatible, dissonant, or mutually exclusive?Australian Journal of Agricultural Research 56:1159–1168.https://doi.org/10.1071/AR05069
-
Abscisic acid mediates a divergence in the drought response of two conifersPlant Physiology 162:1370–1377.https://doi.org/10.1104/pp.113.217877
-
Mechanisms underlying plant resilience to water deficits: prospects for water-saving agricultureJournal of Experimental Botany 55:2365–2384.https://doi.org/10.1093/jxb/erh269
-
Effects of water deficits on carbon assimilationJournal of Experimental Botany 42:1–16.https://doi.org/10.1093/jxb/42.1.1
-
BookLeaf photosynthesis under drought stressIn: Baker NR, editors. Photosynthesis and the Environment. New York: Springer Netherlands. pp. 347–366.
-
Expression profiling of rice cultivars differing in their tolerance to long-term drought stressPlant Molecular Biology 69:133–153.https://doi.org/10.1007/s11103-008-9412-7
-
The physiological importance of glucosinolates on plant response to abiotic stress in BrassicaInternational Journal of Molecular Sciences 14:11607–11625.https://doi.org/10.3390/ijms140611607
-
The theoretical limit to plant productivityEnvironmental Science & Technology 48:9471–9477.https://doi.org/10.1021/es502348e
-
Time of day determines arabidopsis transcriptome and growth dynamics under mild droughtPlant, Cell & Environment 40:180–189.https://doi.org/10.1111/pce.12809
-
Endogenous circadian rhythms in pigment composition induce changes in photochemical efficiency in plant canopiesPlant, Cell & Environment 40:1153–1162.https://doi.org/10.1111/pce.12909
-
Transcriptional networks-crops, clocks, and abiotic stressCurrent Opinion in Plant Biology 24:39–46.https://doi.org/10.1016/j.pbi.2015.01.004
-
Integrating circadian dynamics with physiological processes in plantsNature Reviews Genetics 16:598–610.https://doi.org/10.1038/nrg3976
-
JTK_CYCLE: an efficient nonparametric algorithm for detecting rhythmic components in genome-scale data setsJournal of Biological Rhythms 25:372–380.https://doi.org/10.1177/0748730410379711
-
Current topics in drought physiologyJournal of Agricultural Science 119:291–296.https://doi.org/10.1017/S0021859600012144
-
Fast R functions for robust correlations and hierarchical clusteringJournal of Statistical Software 46:i11.
-
Is my network module preserved and reproducible?PLoS Computational Biology 7:e1001057.https://doi.org/10.1371/journal.pcbi.1001057
-
BookResponses of Plants to Environmental Stresses, vol. 2Kozlowski T. T, editors. Madison, WI: Academic Press.
-
Gas exchange measurements, what can they tell us about the underlying limitations to photosynthesis? Procedures and sources of errorJournal of Experimental Botany 54:2393–2401.https://doi.org/10.1093/jxb/erg262
-
Nitrite transport activity of a novel HPP family protein conserved in cyanobacteria and chloroplastsPlant and Cell Physiology 55:1311–1324.https://doi.org/10.1093/pcp/pcu075
-
A new look at water transport regulation in plantsNew Phytologist 204:105–115.https://doi.org/10.1111/nph.12912
-
Nitrogen regulation of transpiration controls mass-flow acquisition of nutrientsJournal of Experimental Botany 65:159–168.https://doi.org/10.1093/jxb/ert367
-
Mechanisms linking drought, hydraulics, carbon metabolism, and vegetation mortalityPlant Physiology 155:1051–1059.https://doi.org/10.1104/pp.110.170704
-
BookPhotosynthesis water-use efficiencyIn: Flexas J, Loreto F, Medrano H, editors. Terrestrial Photosynthesis in a Changing Environment. New York: Cambridge University Press. pp. 529–543.
-
Chlorophyll fluorescence analysis: a guide to good practice and understanding some new applicationsJournal of Experimental Botany 64:3983–3998.https://doi.org/10.1093/jxb/ert208
-
Does night-time transpiration contribute to anisohydric behaviour in a Vitis vinifera cultivar?Journal of Experimental Botany 60:3751–3763.https://doi.org/10.1093/jxb/erp217
-
Risk-taking plants: anisohydric behavior as a stress-resistance traitPlant Signaling & Behavior 7:767–770.https://doi.org/10.4161/psb.20505
-
Carbon dynamics in trees: feast or famine?Tree Physiology 32:764–775.https://doi.org/10.1093/treephys/tpr143
-
The estimation of glycogen with the anthrone reagentArchives of Biochemistry 25:191–200.
-
BookTerrestrial and inland water systemsIn: Field CB, editors. Climate Change 2014: Impacts, Adaptation, and Vulnerability. Part A: Global and Sectoral Aspects. Contribution of Working Group II to the Fifth Assessment Report of the Intergovernmental Panel on Climate Change. New York: Cambridge Univ. Press. pp. 271–359.
-
Phloem transport and droughtJournal of Experimental Botany 65:1751–1759.https://doi.org/10.1093/jxb/ert467
-
Gene networks involved in drought stress response and toleranceJournal of Experimental Botany 58:221–227.https://doi.org/10.1093/jxb/erl164
-
Phenotyping for drought tolerance of crops in the genomics eraFrontiers in Physiology 3:347.https://doi.org/10.3389/fphys.2012.00347
-
Stomatal conductance does not correlate with photosynthetic capacity in transgenic tobacco with reduced amounts of RubiscoJournal of Experimental Botany 55:1157–1166.https://doi.org/10.1093/jxb/erh128
-
The genome of the mesopolyploid crop species Brassica rapaNature Genetics 43:1035–1039.https://doi.org/10.1038/ng.919
-
Transcriptional regulatory networks in cellular responses and tolerance to dehydration and cold stressesAnnual Review of Plant Biology 57:781–803.https://doi.org/10.1146/annurev.arplant.57.032905.105444
-
Trade-offs between plant growth and defense against insect herbivory: an emerging mechanistic synthesisAnnual Review of Plant Biology 68:513–534.https://doi.org/10.1146/annurev-arplant-042916-040856
Article and author information
Author details
Carmela Rosaria Guadagno

C Robertson McClung
Funding
National Science Foundation (IOS-1202779)
- Kathleen Greenham
National Science Foundation (IOS-1202682)
- Malia A Gehan
National Science Foundation (IOS-1025965)
- Todd C Mockler
- Cynthia Weinig
- Brent E Ewers
- C. Robertson McClung
National Science Foundation (IOS-1547796)
- Cynthia Weinig
- Brent E Ewers
- C. Robertson McClung
Rural Development Administration (SSAC PJ01106904)
- C. Robertson McClung
The funders had no role in study design, data collection and interpretation, or the decision to submit the work for publication.
Acknowledgements
We thank Matti J Salmela, Rachel N Strawn, Kaleb Kenneaster, Stanley DeVore, Bridger Huhn, Colter Huhn, Brady Hickerson and William Mandeville for assistance in data collection. The authors acknowledge the Genomics and Molecular Biology Shared Resource Facility at the Norris Cotton Cancer Center at Dartmouth with NCI Cancer Center Support Grant 5P30 CA023108-37.
Copyright
© 2017, Greenham et al.
This article is distributed under the terms of the Creative Commons Attribution License, which permits unrestricted use and redistribution provided that the original author and source are credited.
Metrics
-
- 6,180
- views
-
- 1,091
- downloads
-
- 107
- citations
Views, downloads and citations are aggregated across all versions of this paper published by eLife.
Citations by DOI
-
- 107
- citations for umbrella DOI https://doi.org/10.7554/eLife.29655
Download links
A two-part list of links to download the article, or parts of the article, in various formats.
Downloads (link to download the article as PDF)
Open citations (links to open the citations from this article in various online reference manager services)
Cite this article (links to download the citations from this article in formats compatible with various reference manager tools)
Temporal network analysis identifies early physiological and transcriptomic indicators of mild drought in Brassica rapa
eLife 6:e29655.
https://doi.org/10.7554/eLife.29655


