RNG105/caprin1, an RNA granule protein for dendritic mRNA localization, is essential for long-term memory formation
- National Institute for Basic Biology, Japan
- SOKENDAI, Japan
- Okazaki Institute for Integrative Bioscience, Japan
- Tokyo University of Science, Japan
- Tokyo University of Pharmacy and Life Sciences, Japan
- Niigata University, Japan
- Kobe City College of Nursing, Japan
- Brain Science Institute, Japan
Figures
Figure 1 with 1 supplement
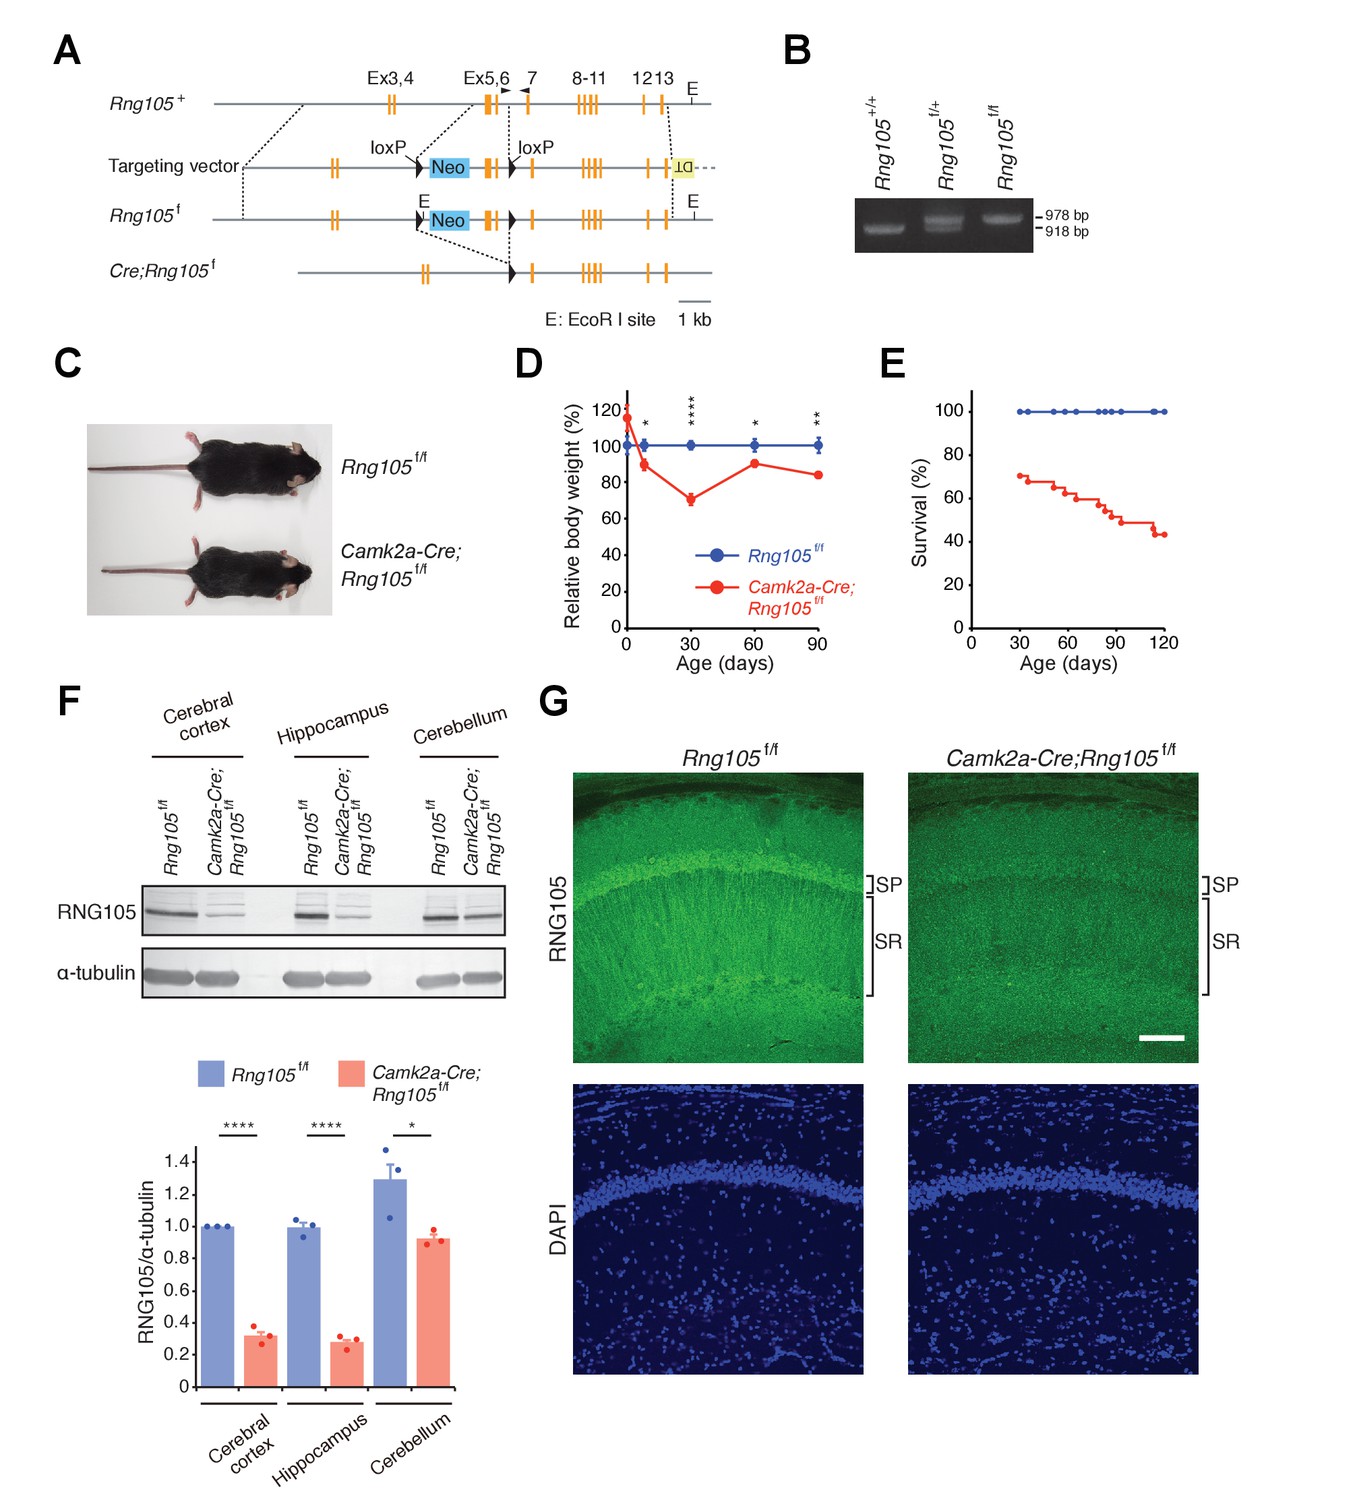
Generation of RNG105 conditional deletion mice.
(A) Gene structure of the Rng105 genome, targeting vector, floxed Rng105, and after excision of the floxed sequence. Arrowheads indicate PCR primers for genotyping. (B) PCR analysis of the indicated genotypes. (C) Male littermates at postnatal 9 (P9) weeks. (D) Relative body weight of Camk2a-Cre;Rng105f/f mice compared with Rng105f/f mice. n = 5 and 3 (P0), 10 and 6 (P8), 27 and 22 (P30), 6 and 6 (P60), 9 and 8 (P90) for Rng105f/f and Camk2a-Cre;Rng105f/f mice, respectively. *p<0.05, **p<0.01, ****p<0.001 using two-way ANOVA followed by Student's t-test. Data are represented as the mean ± s.e.m. (E) Survival curves of Rng105f/f and Camk2a-Cre;Rng105f/f mice. The number of Camk2a-Cre;Rng105f/f mice was 70.4% of Rng105f/f mice at P30 (n = 402 and n = 283 for Rng105f/f and Camk2a-Cre;Rng105f/f, respectively). Thereafter, survival was analyzed in 13 Rng105f/f mice and 26 Camk2a-Cre;Rng105f/f mice. (F) Western blotting of indicated brain extracts from Rng105f/f and Camk2a-Cre;Rng105f/f mice for RNG105 and α-tubulin as a control. Bottom, quantification of the RNG105 band intensity normalized to α-tubulin. Data are represented as the mean ± s.e.m. with dot plots of individual values. n = 3. *p<0.05, ****p<0.001 using Student's t-test. (G) Staining of hippocampal slices with anti-RNG105 antibody and DAPI. SP, stratum pyramidale; SR, stratum radiatum. Scale bar, 50 µm. See also Figure 1—figure supplement 1.
Figure 1—figure supplement 1
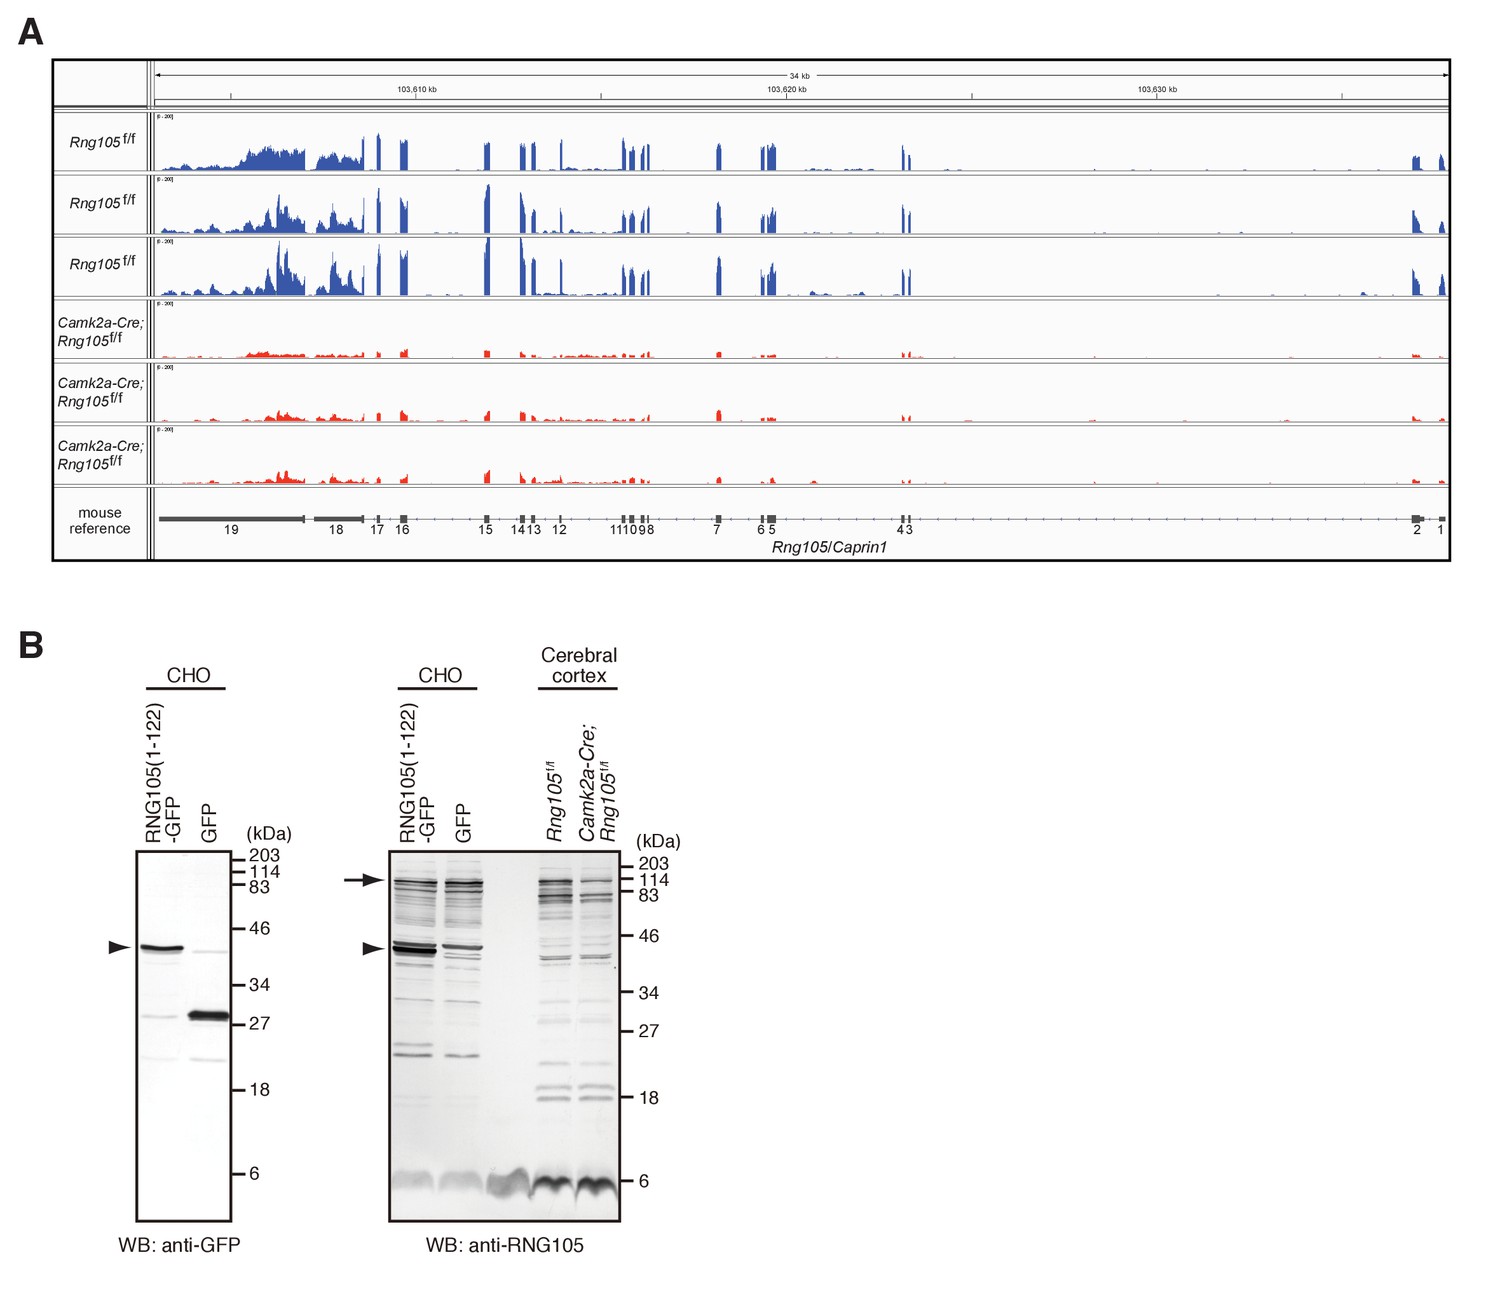
Reduced expression of RNG105 without the expression of truncated forms in the cerebrum of Camk2a-Cre;Rng105f/f mice.
(A) Reduction of Rng105 transcripts in Camk2a-Cre;Rng105f/f mice compared to Rng105f/f mice. RNA-seq read coverage across the Rng105 genome for triplicate RNA samples from the hippocampus of Rng105f/f and Camk2a-Cre;Rng105f/f mice is shown. The perpendicular axis shows the number of reads standardized among the samples. Numbers indicate exon numbers of the Rng105 gene. Note that not only transcripts of exons 5–6 but also those of the other exons were reduced in amount in Camk2a-Cre;Rng105f/f mice. (B) No truncated form of RNG105 protein is detected in the cerebrum of Camk2a-Cre;Rng105f/f mice. Left, western blotting for truncated RNG105 (a.a. 1–122)-GFP (an arrowhead) expressed in CHO cells with an anti-GFP antibody. Right, western blotting of CHO cells expressing the truncated RNG105-GFP and the cerebral cortex from Rng105f/f and Camk2a-Cre;Rng105f/f mice with the anti-RNG105 antibody. The anti-RNG105 antibody detected the truncated RNG105-GFP (an arrowhead). Although the molecular mass of the truncated RNG105 (a.a. 1–122) is expected to be ~13 kDa, no such band was detected in the cerebrum of Camk2a-Cre;Rng105f/f mice even after intensive exposure of the membrane to the detecting solution. Because of the intensive exposure, RNG105 band intensity was saturated, and bands other than RNG105 were also detected. An arrow denotes endogenous RNG105.
Figure 2
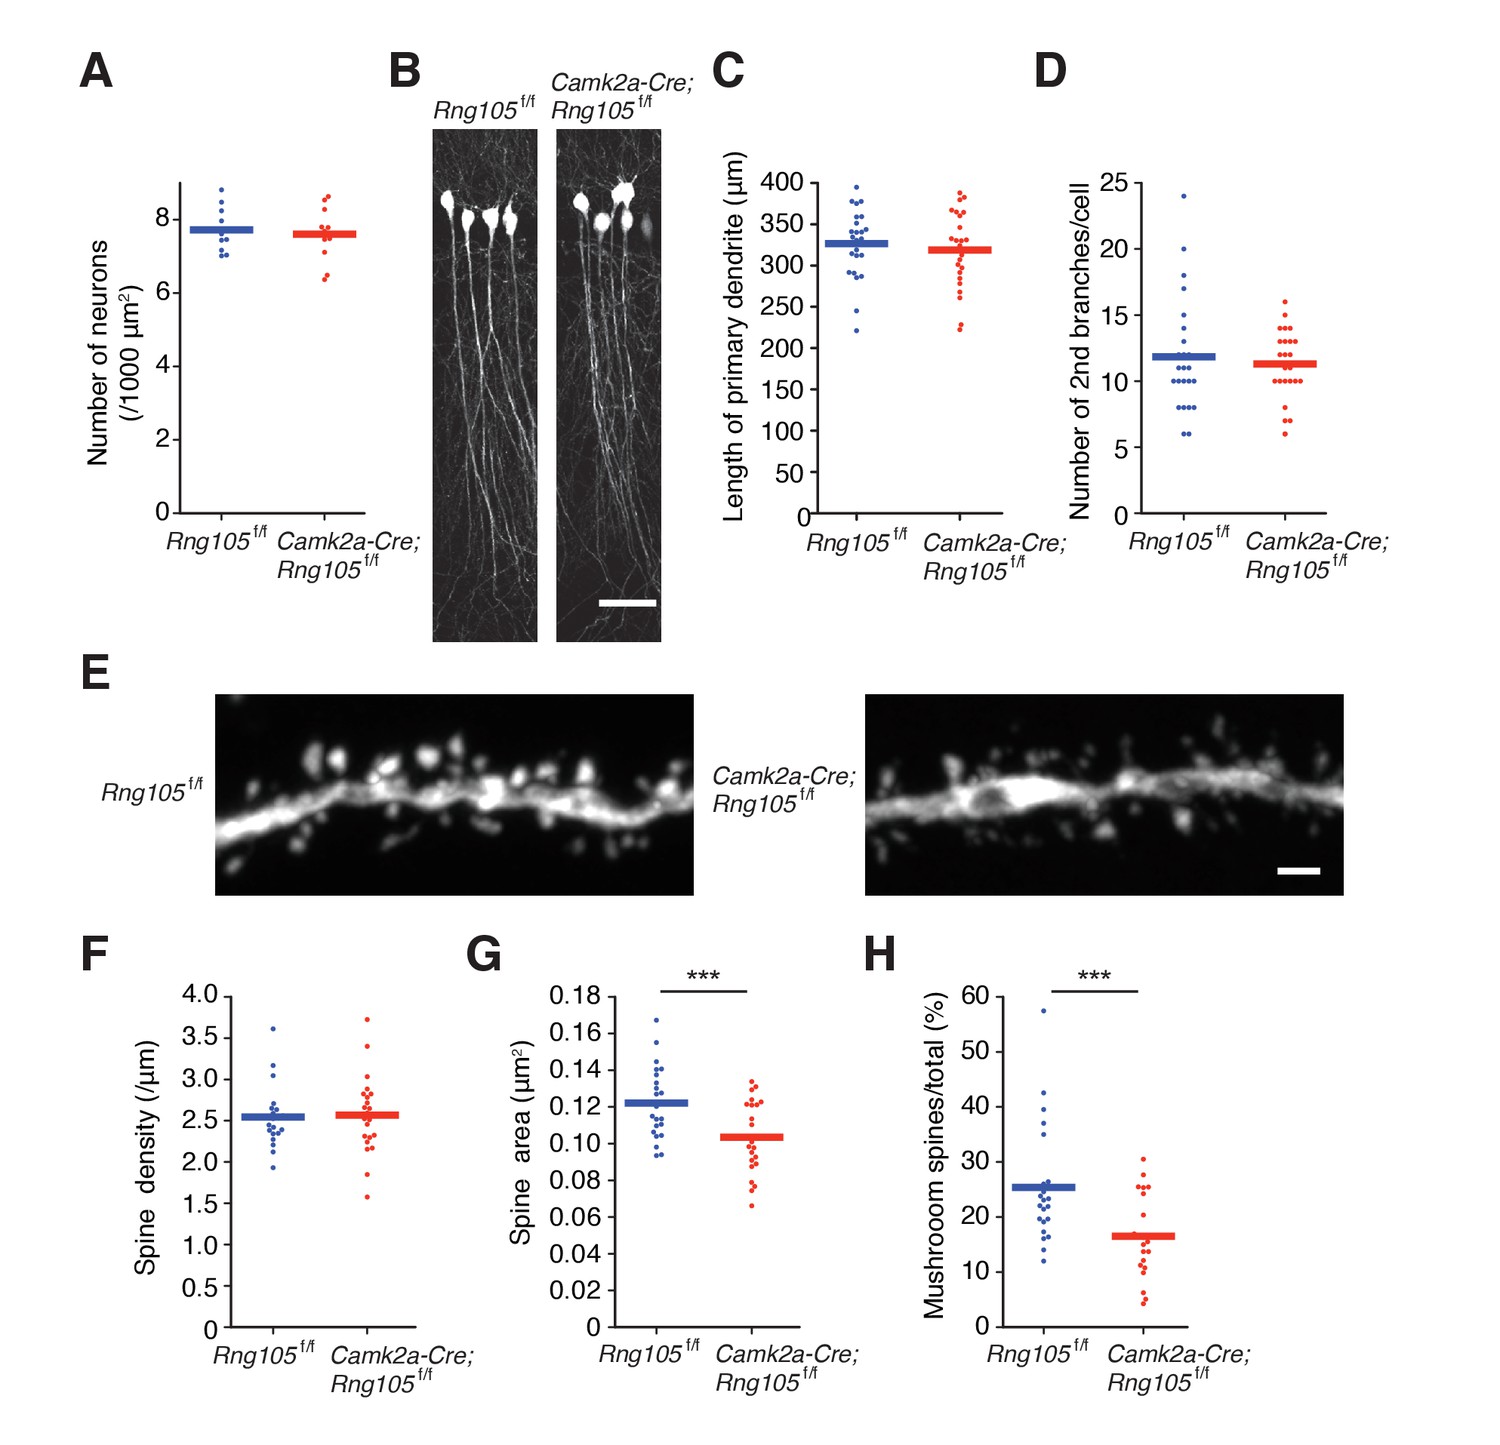
RNG105-deficient mice have small dendritic spines.
(A) Density of CA1 hippocampal neurons measured by nuclear staining in the SP. n = 11. Student's t-test, p=0.674. (B) CA1 pyramidal neurons imaged with Thy1-GFP. Scale bar, 50 µm. (C and D) Length of primary dendrites (C) and the number of 2nd branches (D) in the CA1 pyramidal neurons. n = 24. Student's t-test, p=0.554 (C), p=0.605 (D). (E) Representative magnified images of a dendrite of a CA1 neuron. Scale bar, 1 µm. (F−H) Spine density (F), spine size (G), and the ratio of the number of mushroom spines to total spines (H) in the CA1 pyramidal neurons. n = 22 dendritic branches. Student's t-test, p=0.857 (F), ***p=0.00380 (G), ***p=0.00278 (H). Data are represented by dot plots with the mean.
Figure 3
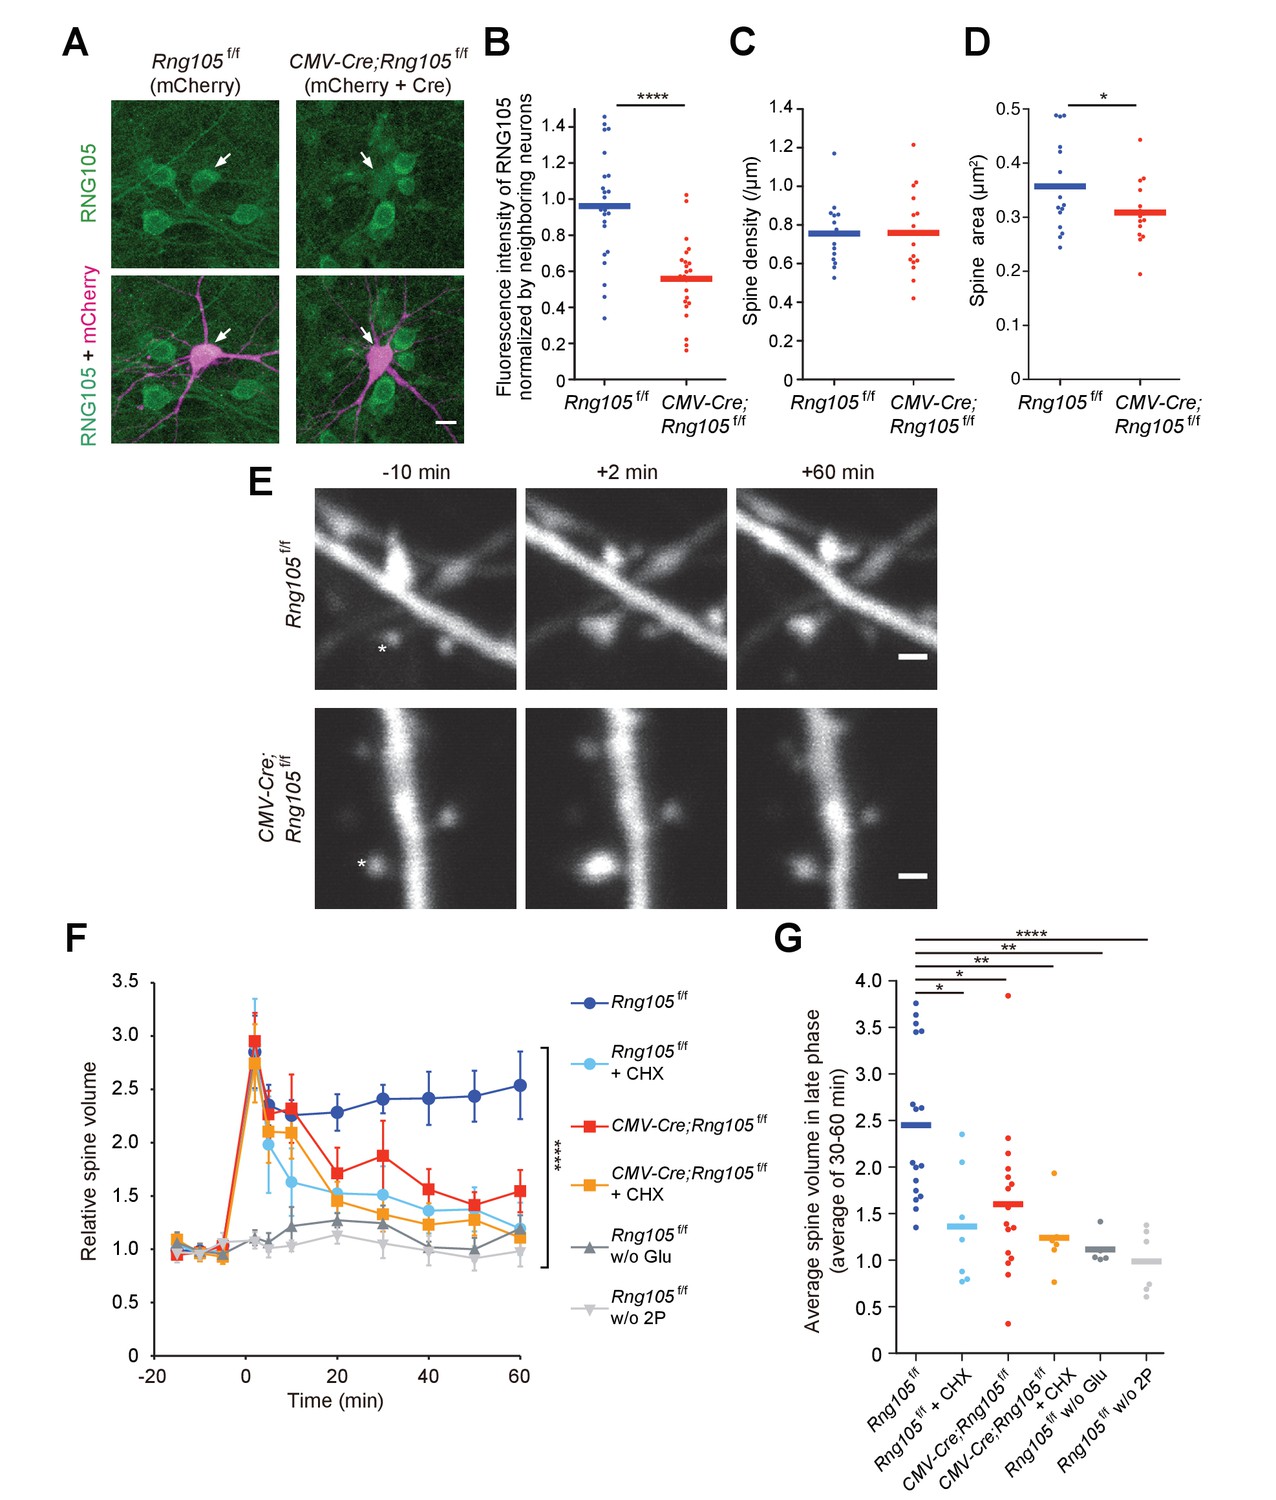
RNG105 deficiency impairs structural plasticity of dendritic spines.
(A) Fluorescence images of cultured hippocampal neurons from Rng105f/f mice transfected with mCherry (left) or both mCherry and CMV-Cre (right), and immunostained for RNG105. Arrows indicate transfected neurons. Scale bar, 10 µm. (B) Immunofluorescence intensity of RNG105 in the transfected neurons normalized to that in neighboring mCherry-negative neurons. n = 24. Student's t-test, ****p=1.33E-6. (C and D) Density (C) and size (D) of dendritic spines in the transfected neurons. n = 15 neurons. Student's t-test, p=0.483 (C), *p=0.0407 (D). (E) Representative time-lapse images of dendritic spines before and after the induction of structural plasticity by two-photon glutamate uncaging. Asterisks indicate the location of uncaging. Scale bar, 1 µm. (F) Time course of spine volume change in stimulated spines. CHX, addition of cycloheximide; w/o Glu and 2P, mock experiments without caged glutamate or two-photon laser irradiation. n = 17, 7, 16, 6, 5 and 6, from top to bottom, respectively. ****p<0.001 using two-way repeated measures ANOVA. Data are represented as the mean ± s.e.m. (G) Average spine volume over 30–60 min in (F). *p<0.05, **p<0.01, ****p<0.001 using one-way ANOVA followed by Tukey-Kramer test. In B−D and G, data are represented by dot plots with the mean.
Figure 4
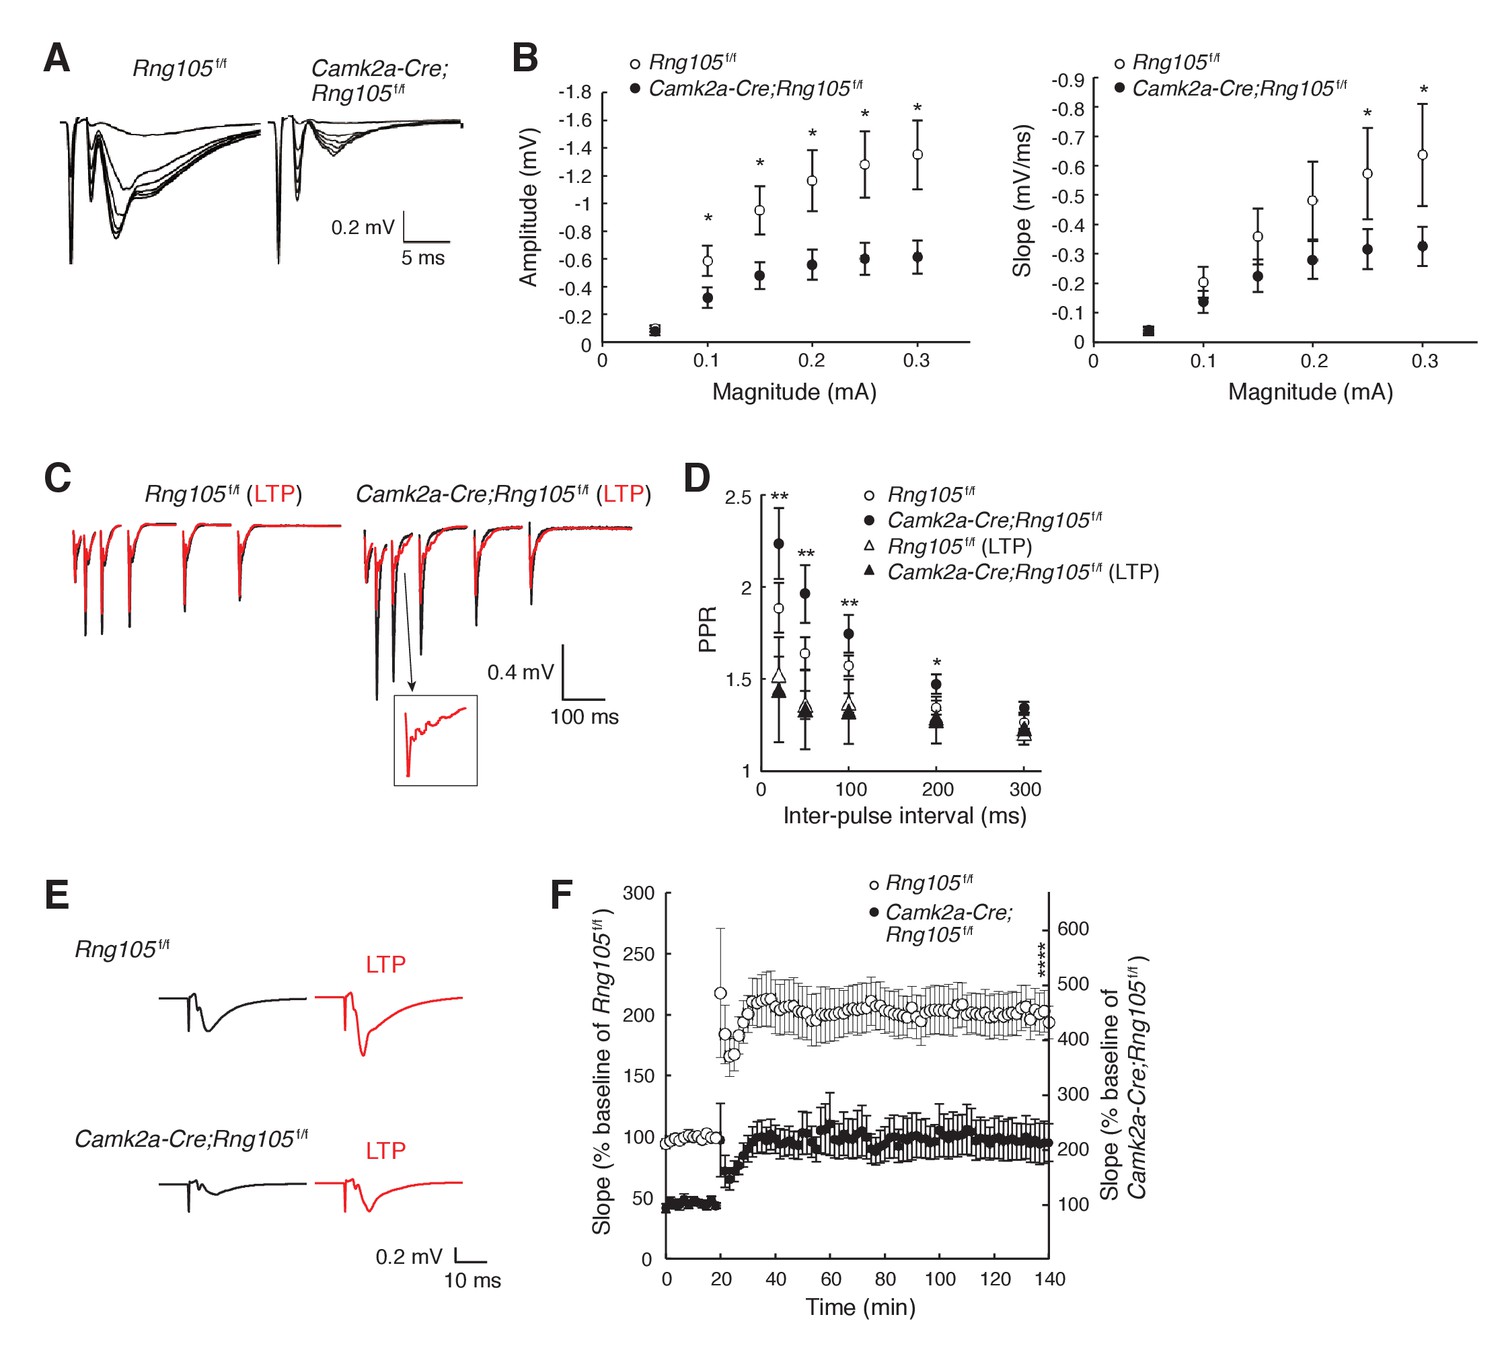
RNG105 deficiency reduces fEPSP amplitude in hippocampal CA1.
(A) Representative fEPSP traces evoked by different stimulation intensities. (B) Input-output (I/O) relationship between CA3 stimulation magnitude and CA1 fEPSP responses. n = 10 (Rng105f/f) and 13 (Camk2a-Cre;Rng105f/f). *p<0.05 using two-way repeated measures ANOVA followed by Bonferroni post-hoc t-test. (C) Representative paired-pulse ratio (PPR) with different inter-pulse intervals at CA3-CA1 synapses before (black) and after (red) LTP induction. The inset shows a magnified image. (D) Relationship between inter-pulse intervals and PPR. n = 7 (Rng105f/f), 10 (Camk2a-Cre;Rng105f/f), 7 (Rng105f/f, LTP), and 8 (Camk2a-Cre;Rng105f/f, LTP). *p<0.05, **p<0.01, between Camk2a-Cre;Rng105f/f and Camk2a-Cre;Rng105f/f (LTP), using two-way repeated measures ANOVA, Bartlett’s test, and one-way ANOVA followed by Tukey-Kramer test. There was no significant difference between the genotypes. (E) Representative fEPSP traces before (black) and after (red) LTP induction. (F) Time course of LTP in CA1 neurons. n = 7. Because the I/O response in Camk2a-Cre;Rng105f/f mice was reduced to 45.1% of that in Rng105f/f mice (at max value), the baseline fEPSP slope for Camk2a-Cre;Rng105f/f mice is set at 45.1% of that for Rng105f/f mice. Left and right scales are for Rng105f/f mice and Camk2a-Cre;Rng105f/f mice, respectively (the right scale is 45.1% of the left scale). ****p=0.0004 using Student's t-test at 140 min with the I/O normalization. Data in B, D and F are represented as the mean ± s.e.m.
Figure 5 with 1 supplement
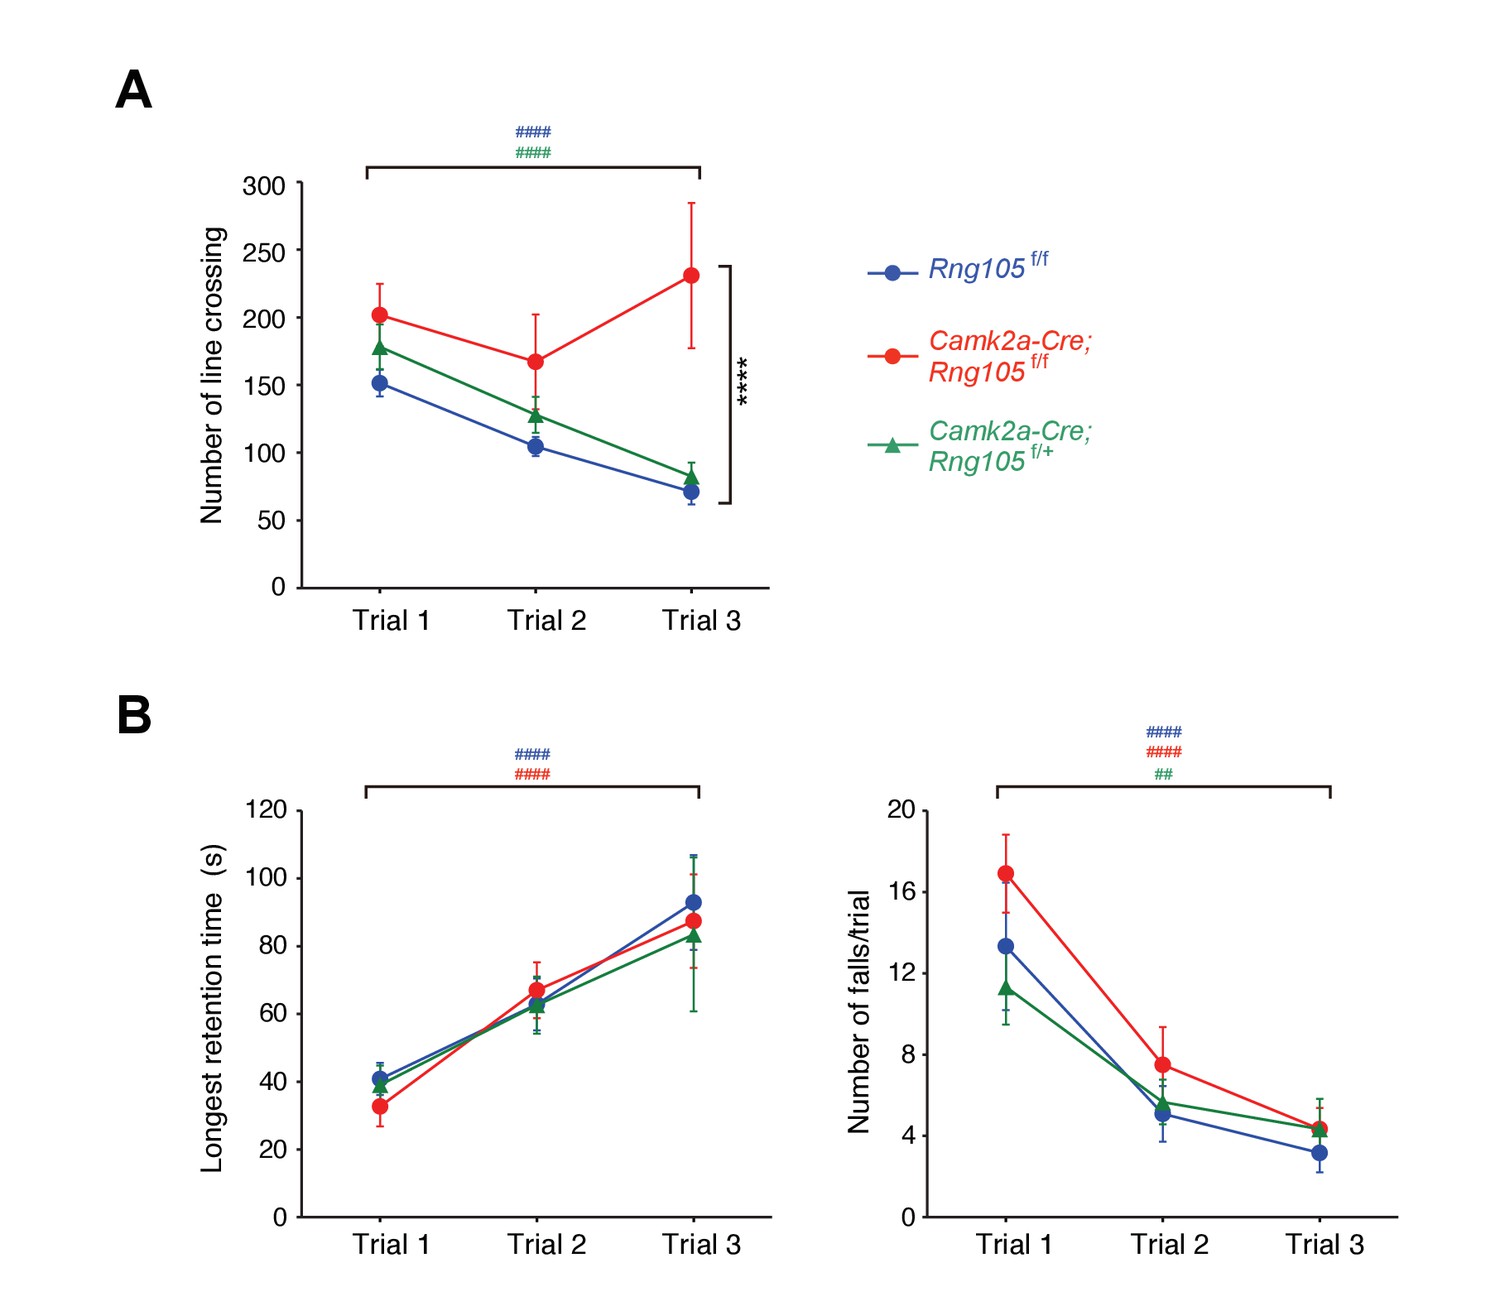
Impaired habituation to a novel place and normal motor skill learning in Camk2a-Cre;Rng105f/f mice.
(A) Open field test. The number of line crossings during a 5 min trial on 3 consecutive days. n = 14 (Rng105f/f), 9 (Camk2a-Cre;Rng105f/f) and 10 (Camk2a-Cre;Rng105f/+). ****p<0.001 (genotype effect) in the trial 3 using two-way repeated measures ANOVA and one-way ANOVA. (B) Rotarod test. Longest retention time on the rod (left) and the number of falls from the rod (right) during a 3 min trial on 3 consecutive days. n = 12 (Rng105f/f), 12 (Camk2a-Cre;Rng105f/f) and 6 (Camk2a-Cre;Rng105f/+). In A and B, ##p<0.01, ####p<0.001 (trial effect) using one-way repeated measures ANOVA for each genotype. ‘#” is colored corresponding to the genotype. Data are represented as the mean ± s.e.m. See also Figure 5—figure supplement 1.
Figure 5—figure supplement 1

Normal anxiety-like behavior and reduced novel object preference in Camk2a-Cre;Rng105f/f mice.
(A) Light/dark transition test. Left, distance traveled in the light (L) and dark (D) chambers; middle, time spent in the light chamber; right, the number of transition during a 5 min trial. n = 13 (Rng105f/f), 14 (Camk2a-Cre;Rng105f/f) and 13 (Camk2a-Cre;Rng105f/+). No significant differences were detected among the genotypes using two-way repeated measures ANOVA or one-way ANOVA. (B) Novel object recognition test. The number of interactions with the indicated objects during a 5 min exploration. Object two was replaced by a novel object 3 in the 2nd session. n = 6 (Rng105f/f) and 4 (Camk2a-Cre;Rng105f/f). *p<0.05 using two-way repeated measures ANOVA followed by paired t-test. Data are represented by dot plots with the mean.
Figure 6 with 1 supplement
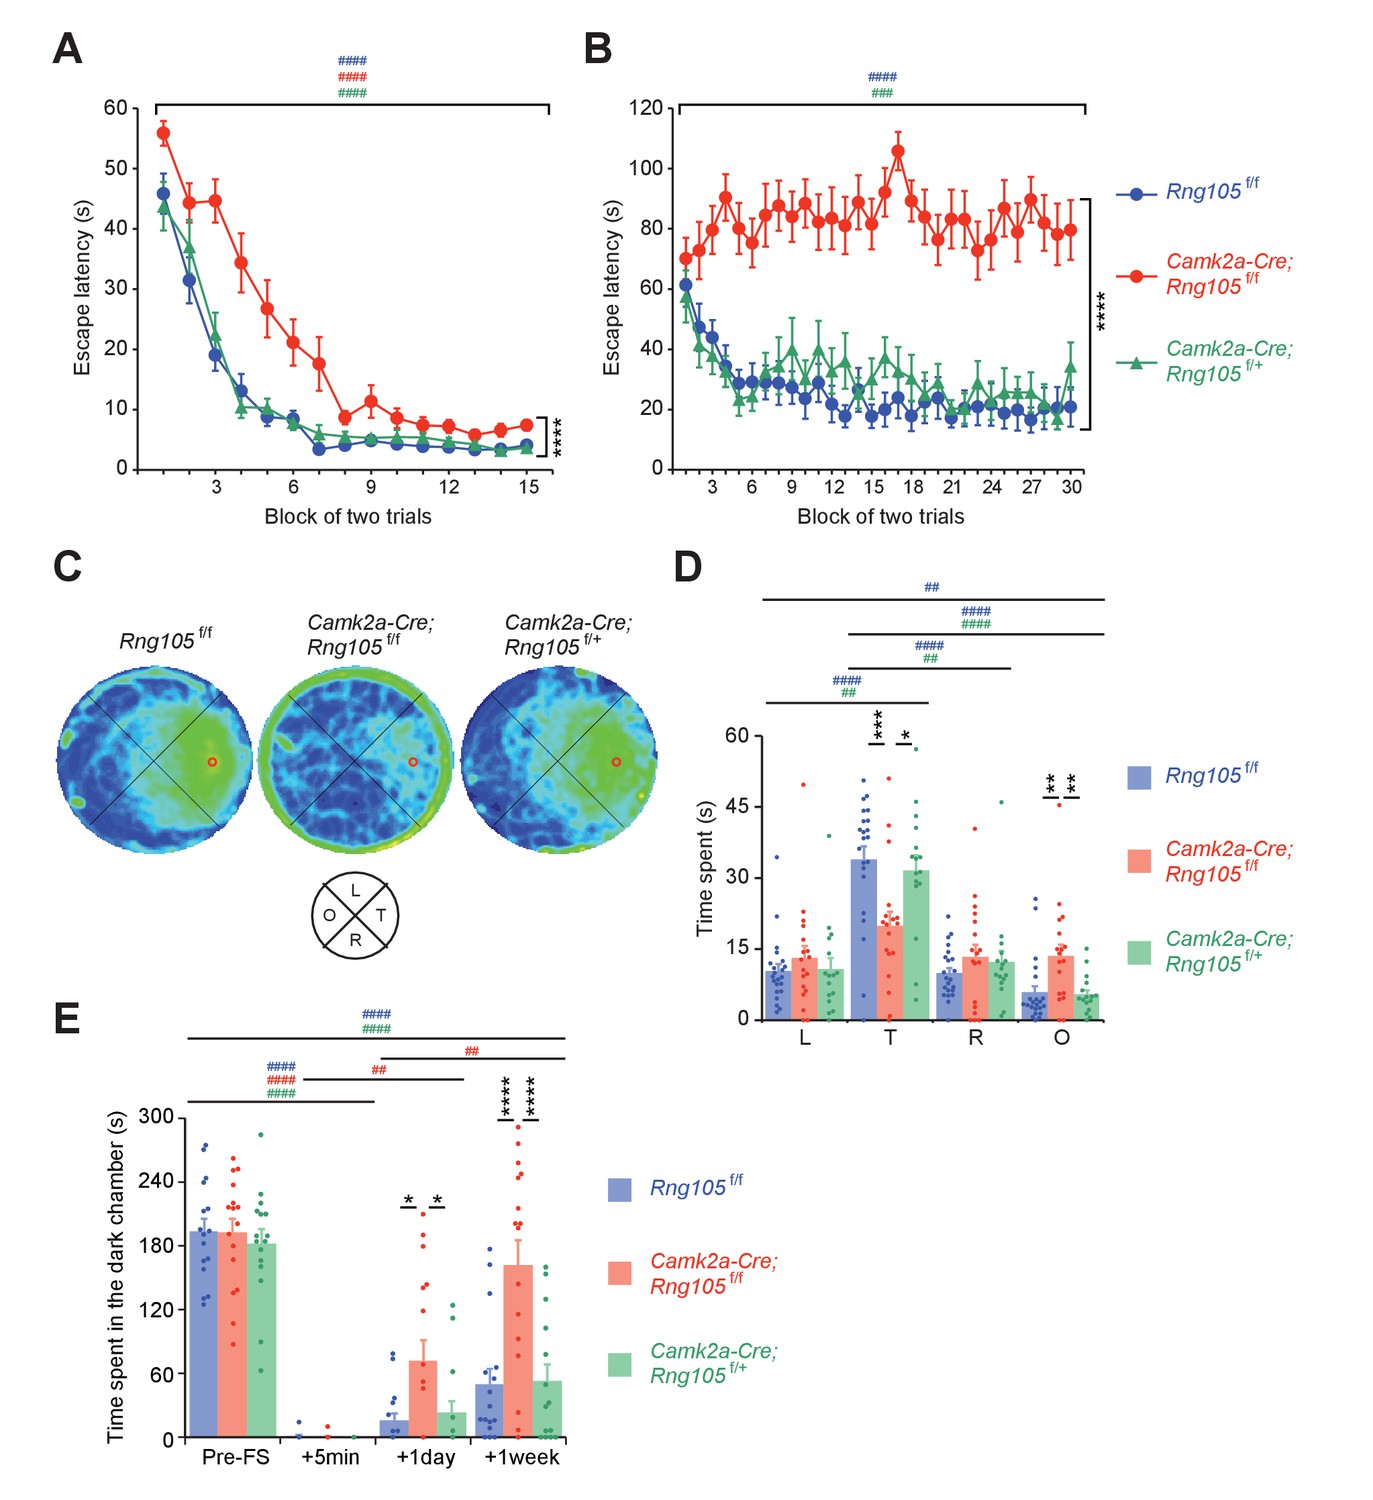
RNG105 conditional deletion mice display impaired long-term memory.
(A−D) Morris water maze. Escape latency to the platform in visible (A) and hidden (B) platform tasks. Density plot of swim paths averaged from all mice (C) and the time spent in each quadrant (D) during the probe test. In C, occupancy time is indicated by blue (low) to yellow (high) gradient. Red circles in C, platform location; T, target; R, right; L, left; O, opposite quadrants. n = 22 (Rng105f/f), 18 (Camk2a-Cre;Rng105f/f) and 16 (Camk2a-Cre;Rng105f/+). In A and B, ****p<0.001 (genotype effect) using two-way repeated measures ANOVA; ###p<0.005, ####p<0.001 (trial effect) using two-way and one-way repeated measures ANOVA for each genotype. In D, *p<0.05, **p<0.01, ***p<0.005 (genotype effect) using two-way repeated measures ANOVA and one-way ANOVA followed by Tukey-Kramer test; ##p<0.01, ####p<0.001 (quadrant effect) using two-way and one-way repeated measures ANOVA followed by Bonferroni post-hoc paired t-test. (E) Contextual fear conditioning test. Time spent in the dark chamber before foot shock (Pre-FS) and at 5 min, 1 day and 1 week after the conditioning. n = 16 (Rng105f/f), 16 (Camk2a-Cre;Rng105f/f) and 14 (Camk2a-Cre;Rng105f/+). *p<0.05, ****p<0.001 (genotype effect) using two-way repeated measures ANOVA and one-way ANOVA followed by Tukey-Kramer test; ##p<0.01, ####p<0.001 (trial effect) using two-way and one-way repeated measures ANOVA followed by Bonferroni post-hoc paired t-test. ‘#” is colored corresponding to the genotype. Data are represented as the mean ± s.e.m. In D and E, individual values are plotted by dots. See also Figure 6—figure supplement 1.
Figure 6—figure supplement 1
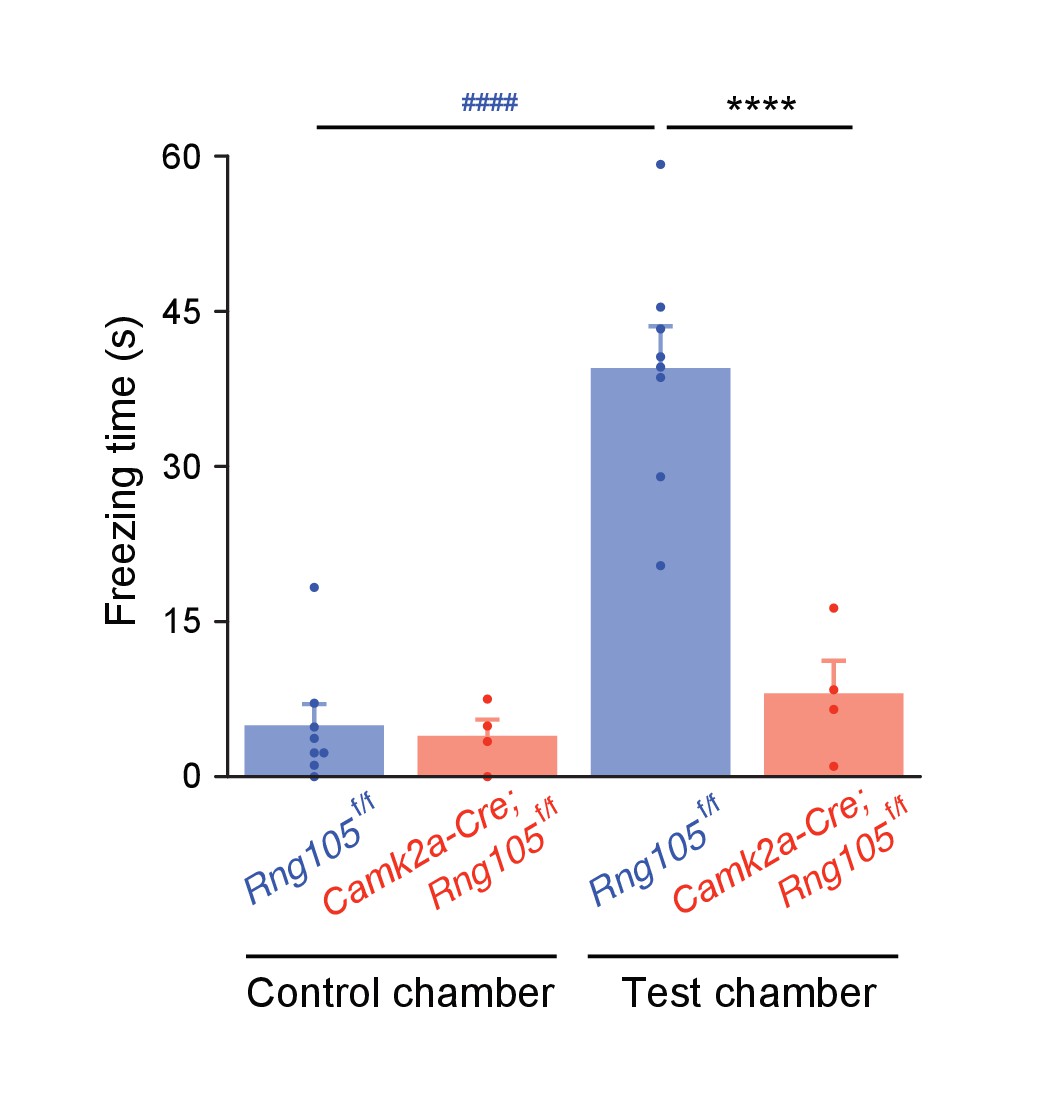
Camk2a-Cre;Rng105f/f mice exhibit less freezing behavior in a contextual fear conditioning test.
Freezing time in a test chamber, in which the mouse had received foot shock 5 days before. n = 8 (Rng105f/f) and 4 (Camk2a-Cre;Rng105f/f). ****p<0.001 (genotype effect) using two-way repeated measures ANOVA followed by Student's t-test. ####p<0.001 (context effect) using two-way repeated measures ANOVA followed by paired t-test. Data are represented as the mean ± s.e.m. with dot plots of individual values.
Figure 7
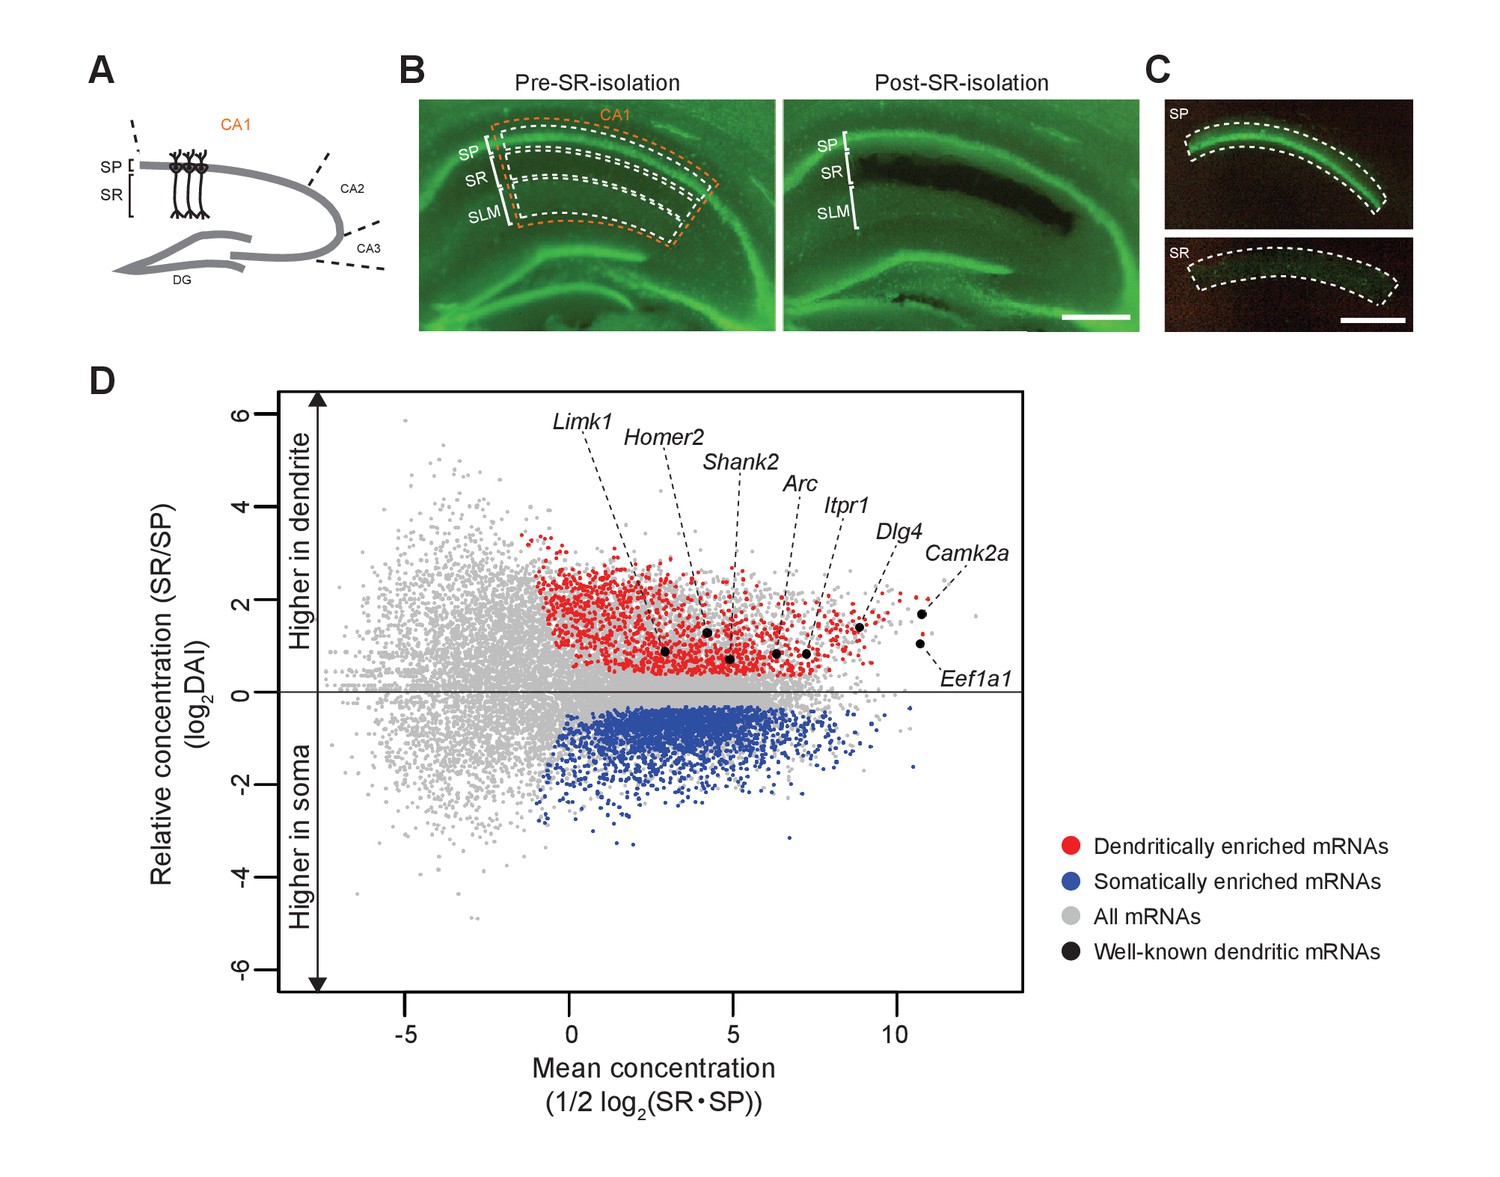
Identification of somatically and dendritically enriched mRNAs (S- and D-mRNAs) in the hippocampal CA1.
(A) Schematic diagram of a mouse hippocampal slice. (B) A hippocampal slice from an adult mouse (P12 weeks) before (left) and after (right) isolation of CA1 SR. Nuclei are stained with Yo-Pro1 (green). SP, stratum pyramidale; SR, stratum radiatum; SLM, stratum lacunosum-moleculare. (C) Isolated SP (top) and SR (bottom). Scale bars in B and C, 500 µm. (D) An MA plot of mRNAs showing their relative enrichment in dendrites (SR) vs. soma (SP) in control (Rng105f/f) mice. D- and S-mRNAs were identified statistically from three independent experiments with RNA-seq analysis. DAI, dendritic accumulation index.
Figure 8
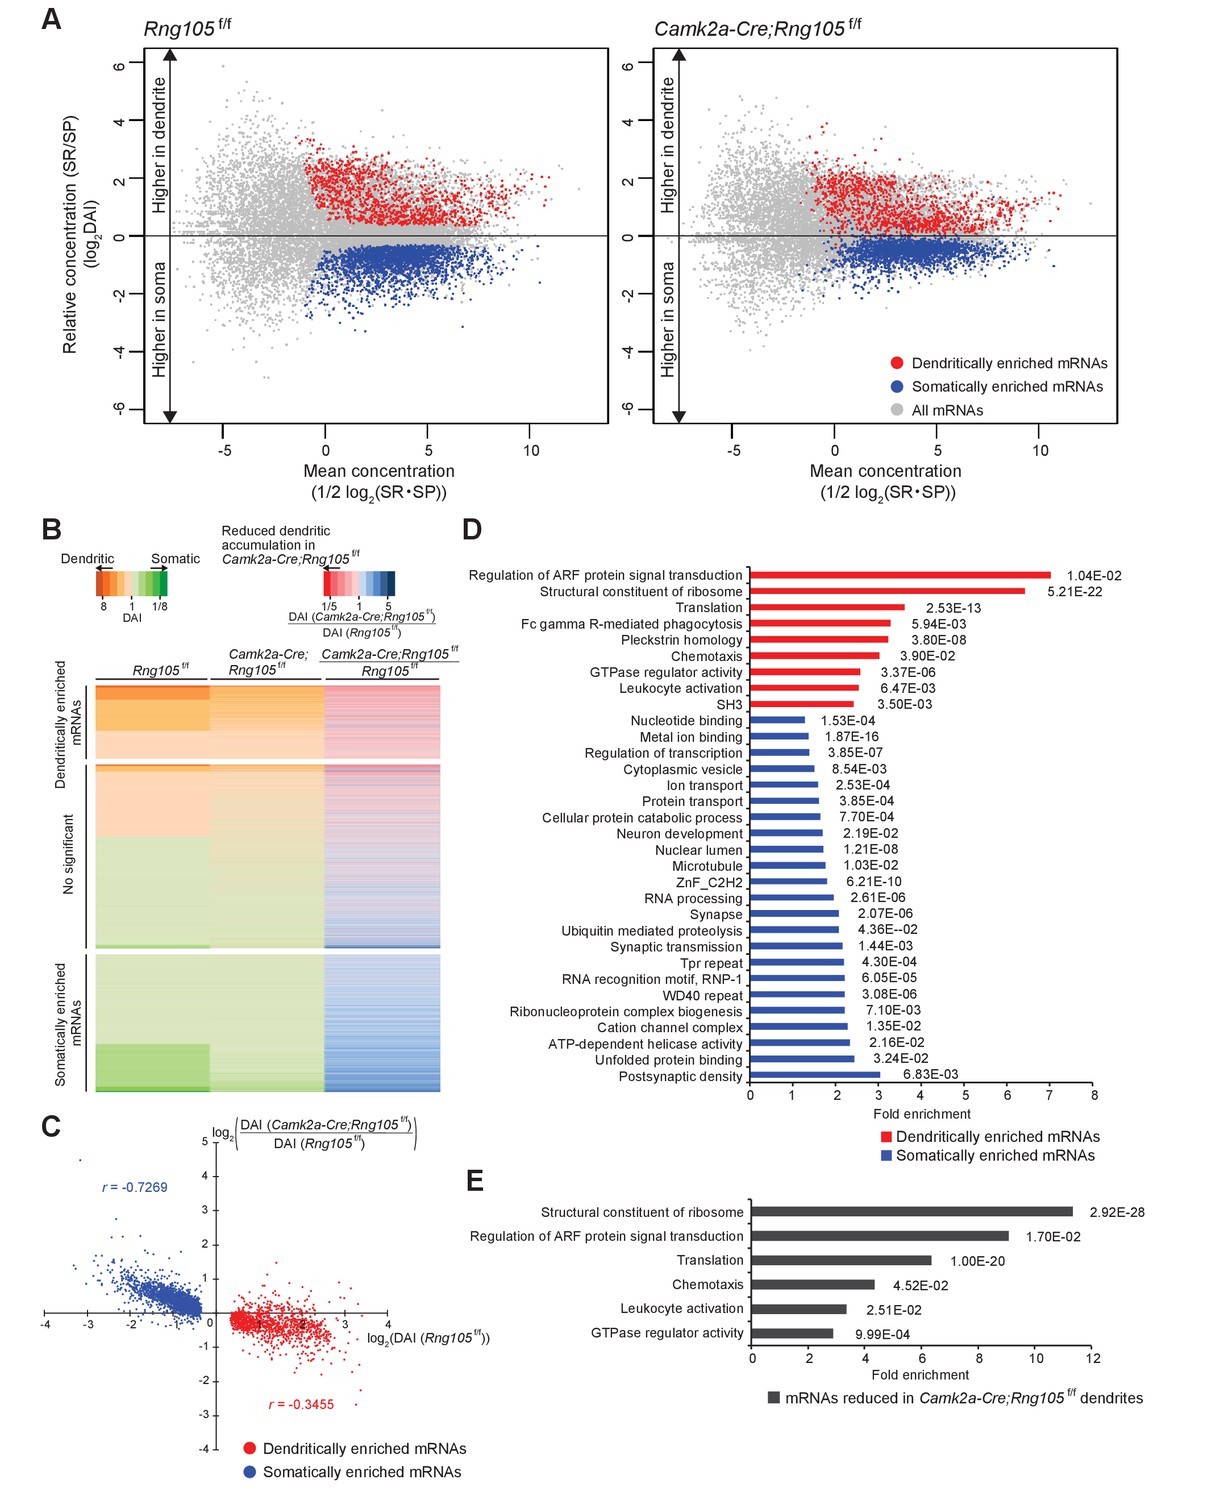
Reduced dendritic localization of D-mRNAs in RNG105-deficient mice.
(A) MA plots of mRNAs in the hippocampal CA1 of Rng105f/f mice (left) and Camk2a-Cre;Rng105f/f mice (right). (B) Heat maps showing DAI of each mRNA in Rng105f/f mice (left lane), in Camk2a-Cre;Rng105f/f mice (middle lane), and relative DAI of each mRNA in Camk2a-Cre;Rng105f/f mice compared with Rng105f/f mice (right lane). (C) Relationship between somato-dendritic localization and RNG105 conditional deletion-dependent localization changes of D- and S-mRNAs. (D) Gene ontology enrichment analysis of D-mRNAs (red) and S-mRNAs (blue). (E) Gene ontology enrichment analysis of D-mRNAs whose localization to dendrites was reduced in Camk2a-Cre;Rng105f/f mice (the relative DAI was below 0.8). The numbers in D and E indicate Benjamini values.
Figure 9
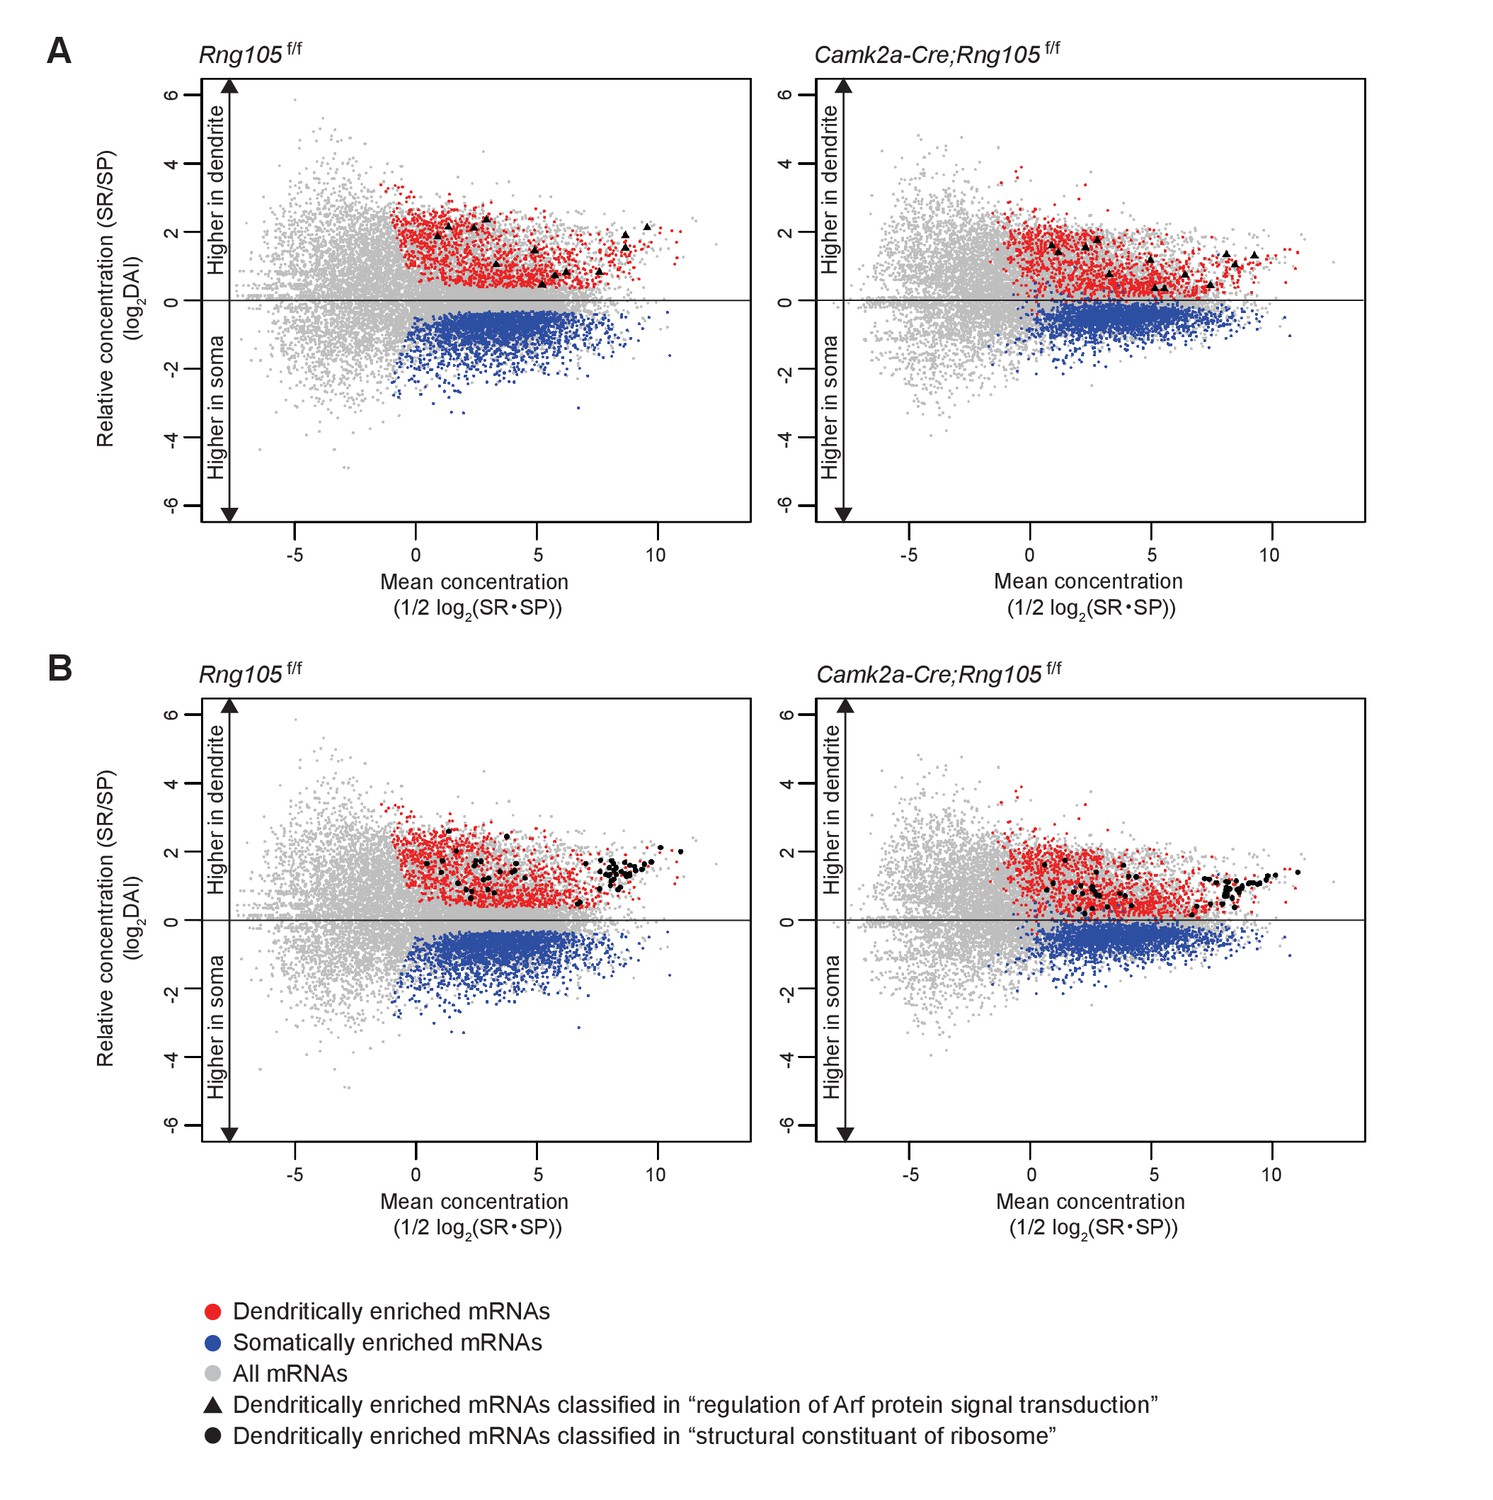
Dendritic accumulation of mRNAs classified in ‘regulation of Arf protein signal transduction’ and ‘structural constituent of ribosome’ is reduced by RNG105 deficiency.
(A and B) MA plots of mRNAs classified in ‘regulation of Arf protein signal transduction’ (A) and ‘structural constituent of ribosome’ (B) in Rng105f/f mice (left) and Camk2a-Cre;Rng105f/f mice (right). Gray, all mRNAs; red, D-mRNAs; blue, S-mRNAs. D-mRNAs classified in ‘regulation of Arf protein signal transduction’ (▲) and ‘structural constituent of ribosome’ (●) are accentuated. DAI, dendritic accumulation index.
Figure 10 with 1 supplement
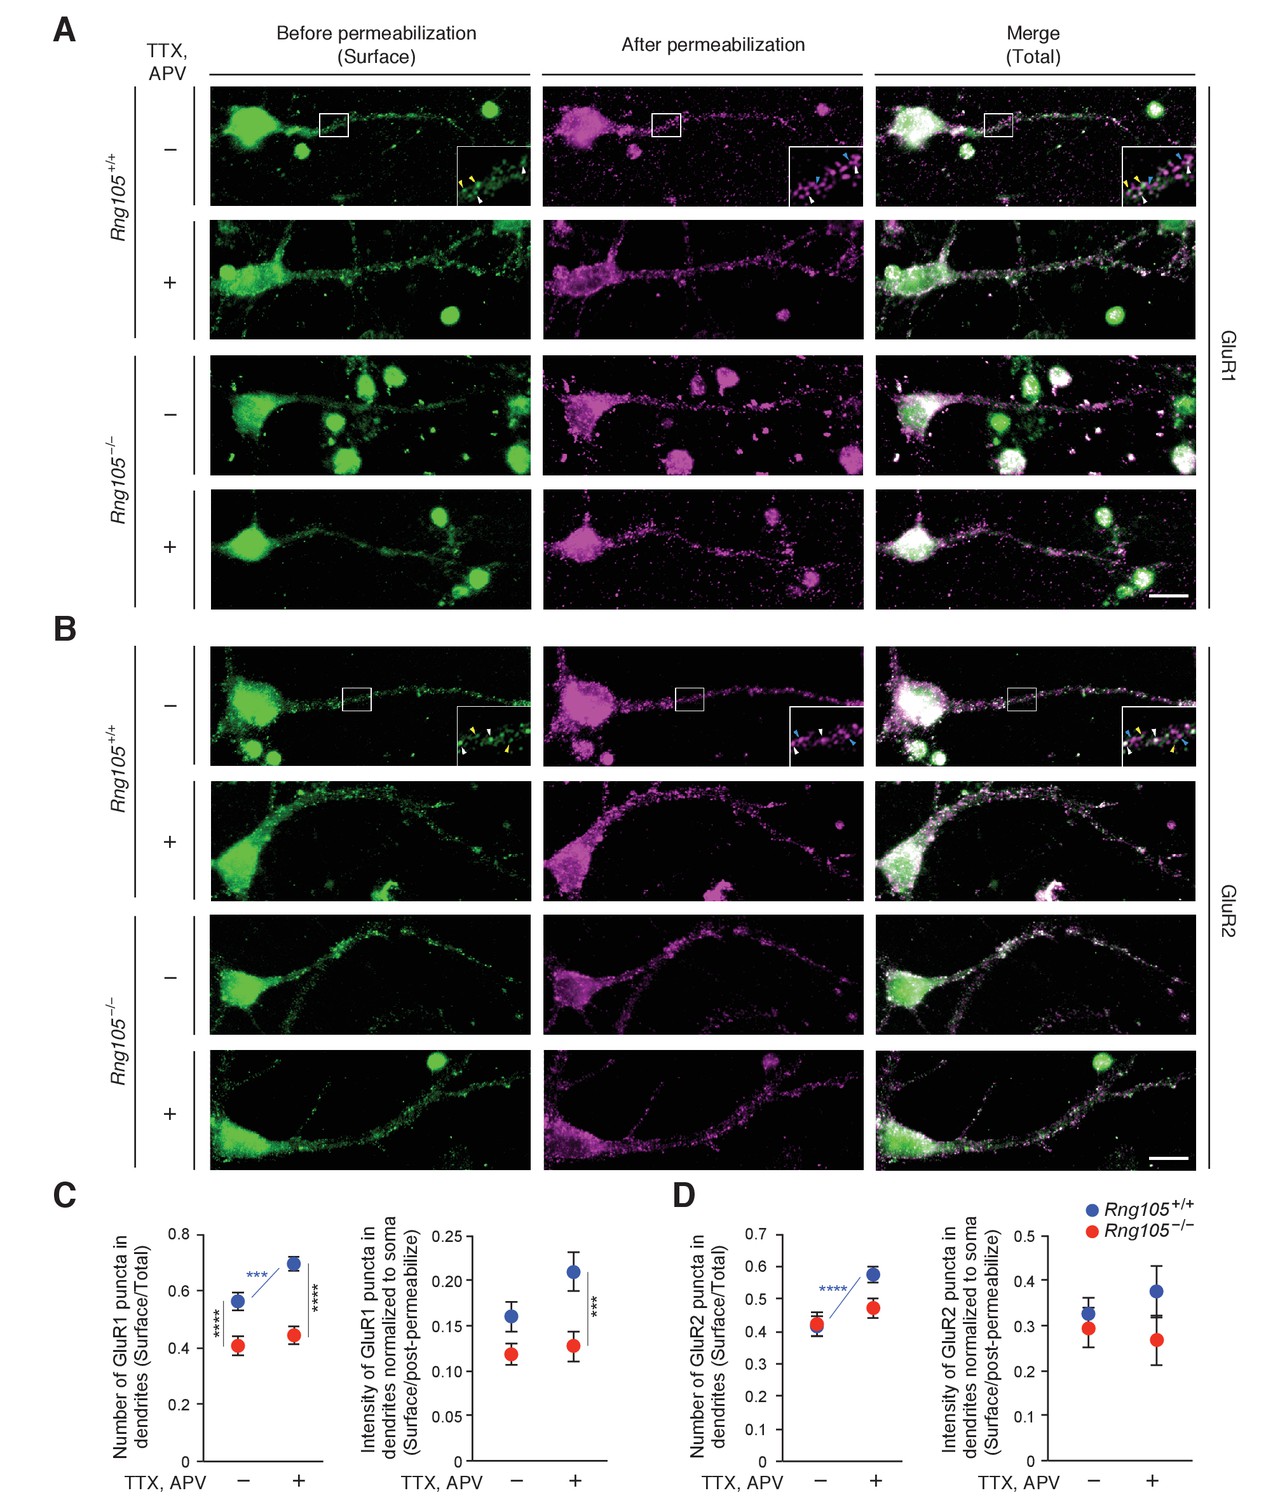
RNG105 deficiency impairs AMPAR scaling in response to activity deprivation.
(A and B) Immunostaining for GluR1 (A) and GluR2 (B) in cultured neurons (9 DIV) from the cerebral cortex of E17.5 Rng105+/+ and Rng105−/− littermates. The neurons were cultured with (+) or without (-) TTX and APV prior to the staining. GluR1 and GluR2 staining before permeabilization (green, surface proteins), after permeabilization (magenta, intracellular and residual surface proteins), and merged images (total proteins) are shown. GluR1 and GluR2 are distributed in a punctate manner both in the soma and dendrites. The insets show magnified images of boxed areas. Arrowheads denote representative GluR1 and GluR2 puncta which were stained both before and after permeabilization (white), only before permeabilization (yellow) and only after permeabilization (blue). Scale bars, 10 µm. (C and D) Quantitative analysis of GluR1 and GluR2 surface expression in dendrites. C, the number of surface GluR1 puncta in dendrites normalized by the number of total GluR1 puncta (left), and fluorescence intensity of surface GluR1 puncta in dendrites normalized by GluR1 fluorescence intensity after permeabilization and in the soma (right). D, the same quantification for GluR2. Data are represented as the mean ± s.e.m. In C, n = 31 (Rng105+/+, −), 35 (Rng105+/+, +), 34 (Rng105−/−, −), and 33 (Rng105−/−, +) neurons from 4 experiments. In D, n = 39 (Rng105+/+, −), 40 (Rng105+/+, +), 39 (Rng105−/−, −), and 38 (Rng105−/−, +) neurons from 4 experiments. ***p<0.005, ****p<0.001 using two-way ANOVA followed by post-hoc Student's t-test. See also Figure 10—figure supplement 1.
Figure 10—figure supplement 1
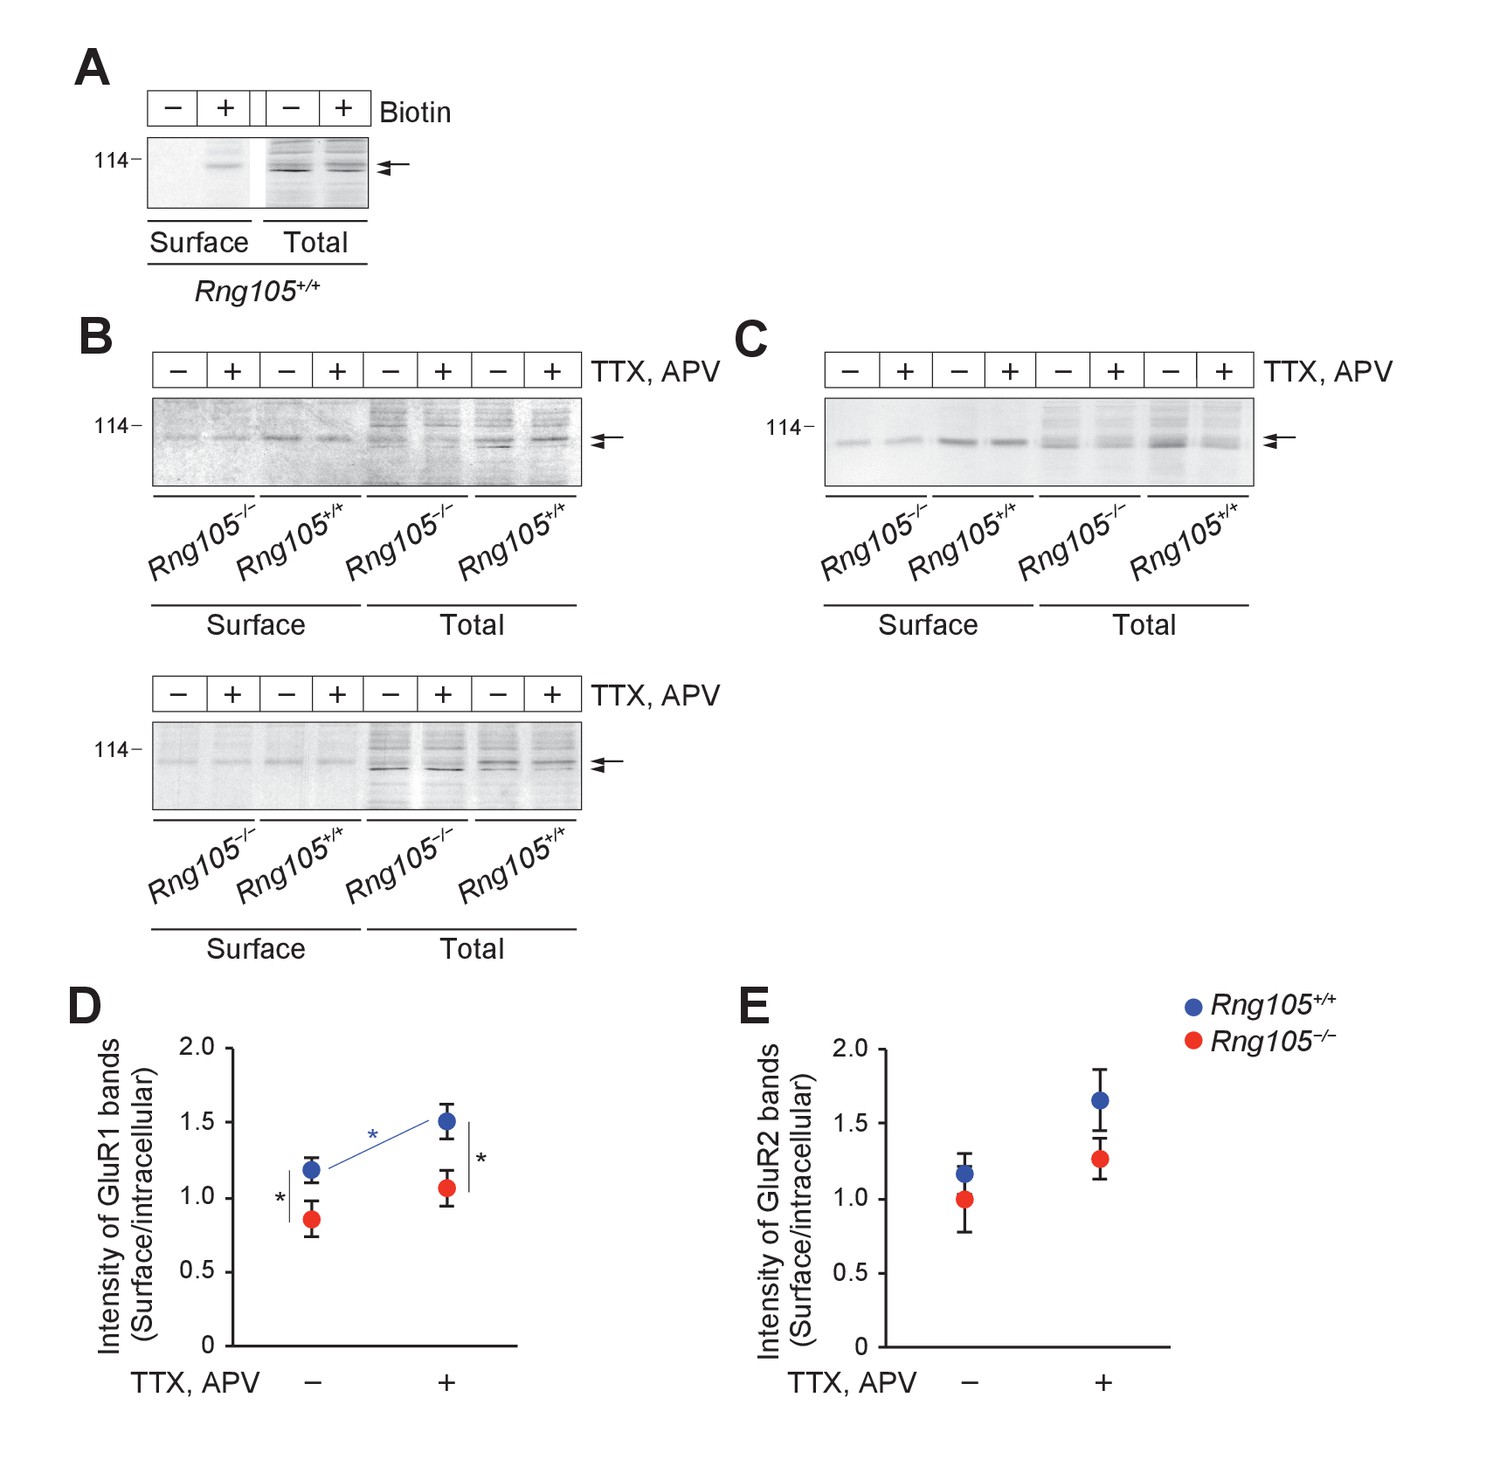
RNG105 deficiency impairs AMPAR scaling in response to activity deprivation (biotinylation assay).
(A) Total cell lysates of surface-biotinylated primary cultured neurons (9 DIV) from E17.5 wild-type mouse cerebral cortex (total), and avidin agarose beads-bound fractions of the lysates (surface), were immunoblotted with the anti-GluR1 antibody. Control neurons were mock-treated without biotin. Arrow and arrowhead indicate biotin-labeled surface GluR1 and non-labeled intracellular GluR1, respectively. Lanes were cut and moved horizontally in the same membrane. (B and C) TTX/APV-treated and untreated primary cultured neurons (9 DIV) from Rng105+/+ and Rng105−/− littermates (E17.5) were surface biotinylated and analyzed as in A. Immunoblotting for GluR1 (B) and GluR2 (C). Arrows and arrowheads indicate biotin-labeled surface GluR1/2 and non-labeled intracellular GluR1/2, respectively. In the bottom panel in B, twice the amount of samples from Rng105−/− neurons were loaded, which showed more clearly that the ratio of surface/intracellular GluR1 was lower in Rng105−/− neurons than in Rng105+/+ neurons. In A−C, numbers on the left indicate molecular mass (kDa). (D and E) Quantitative analysis of the ratio of surface/intracellular GluR1 and GluR2 in the biotinylation assay. The intensity of upper GluR1/2 bands in the avidin beads-bound fraction (arrows in B and C) and lower GluR1/2 bands in the total lysate (arrowheads in B and C) was measured and the surface/intracellular ratio was calculated. D, GluR1; E, GluR2. Data are represented as the mean ± s.e.m. n = 9 from 3 littermates each of Rng105+/+ and Rng105−/− mice. *p<0.05 using two-way ANOVA followed by post-hoc Student's t-test. Attached Files.
Videos
Video 1
RNG105 conditional deletion mice exhibit seizures.
This movie shows a seizure in a Camk2a-Cre;Rng105f/f mouse just after the contextual fear conditioning test (passive avoidance).
Additional files
-
Supplementary file 1
Differential mRNA enrichment analysis between SP and SR of hippocampus − All mRNAs (36,701)
- https://doi.org/10.7554/eLife.29677.018
-
Supplementary file 2
(A) mRNAs eliminated from the candidates for dendritic mRNAs. (B) mRNAs eliminated from the candidates for somatic mRNAs
- https://doi.org/10.7554/eLife.29677.019
-
Supplementary file 3
(A) Dendritically enriched mRNAs (1,122). (B) Somatically enriched mRNAs (2,106). (C) mRNAs not significantly enriched in dendrites nor soma (2,814)
- https://doi.org/10.7554/eLife.29677.020
-
Supplementary file 4
(A) Dendritic mRNAs classified in ‘regulation of Arf protein signal transduction’. (B) Dendritic mRNAs classified in ‘structural constituent of ribosome’. (C) Dendritic mRNAs classified in ‘translation’. (D) Dendritic mRNAs classified in ‘Fc gamma R-mediated phagocytosis’. (E) Dendritic mRNAs classified in ‘pleckstrin homology’. (F) Dendritic mRNAs classified in ‘chemotaxis’. (G) Dendritic mRNAs classified in ‘GTPase regulator activity’. (H) Dendritic mRNAs classified in ‘leukocyte activation’. (I) Dendritic mRNAs classified in ‘SH3’
- https://doi.org/10.7554/eLife.29677.021
-
Supplementary file 5
(A) mRNAs for AMPA receptor subunits and dendritic mRNAs for AMPA receptor regulators. (B) SR-enriched mRNAs involved in membrane potential regulation
- https://doi.org/10.7554/eLife.29677.022
-
Supplementary file 6
mRNAs reduced in Camk2a-Cre;Rng105f/f soma
- https://doi.org/10.7554/eLife.29677.023
-
Supplementary file 7
Statistical reporting table
- https://doi.org/10.7554/eLife.29677.024
-
Transparent reporting form
- https://doi.org/10.7554/eLife.29677.025
Download links
A two-part list of links to download the article, or parts of the article, in various formats.
Downloads (link to download the article as PDF)
Open citations (links to open the citations from this article in various online reference manager services)
Cite this article (links to download the citations from this article in formats compatible with various reference manager tools)
RNG105/caprin1, an RNA granule protein for dendritic mRNA localization, is essential for long-term memory formation
eLife 6:e29677.
https://doi.org/10.7554/eLife.29677


