Many si/shRNAs can kill cancer cells by targeting multiple survival genes through an off-target mechanism
- Northwestern University, United States
- European Bioinformatics Institute (EMBL-EBI), United Kingdom
- National Institute of Arthritis and Musculoskeletal and Skin Diseases, National Institutes of Health, United States
- Feinberg School of Medicine, Northwestern University, United States
Figures
Figure 1 with 2 supplements
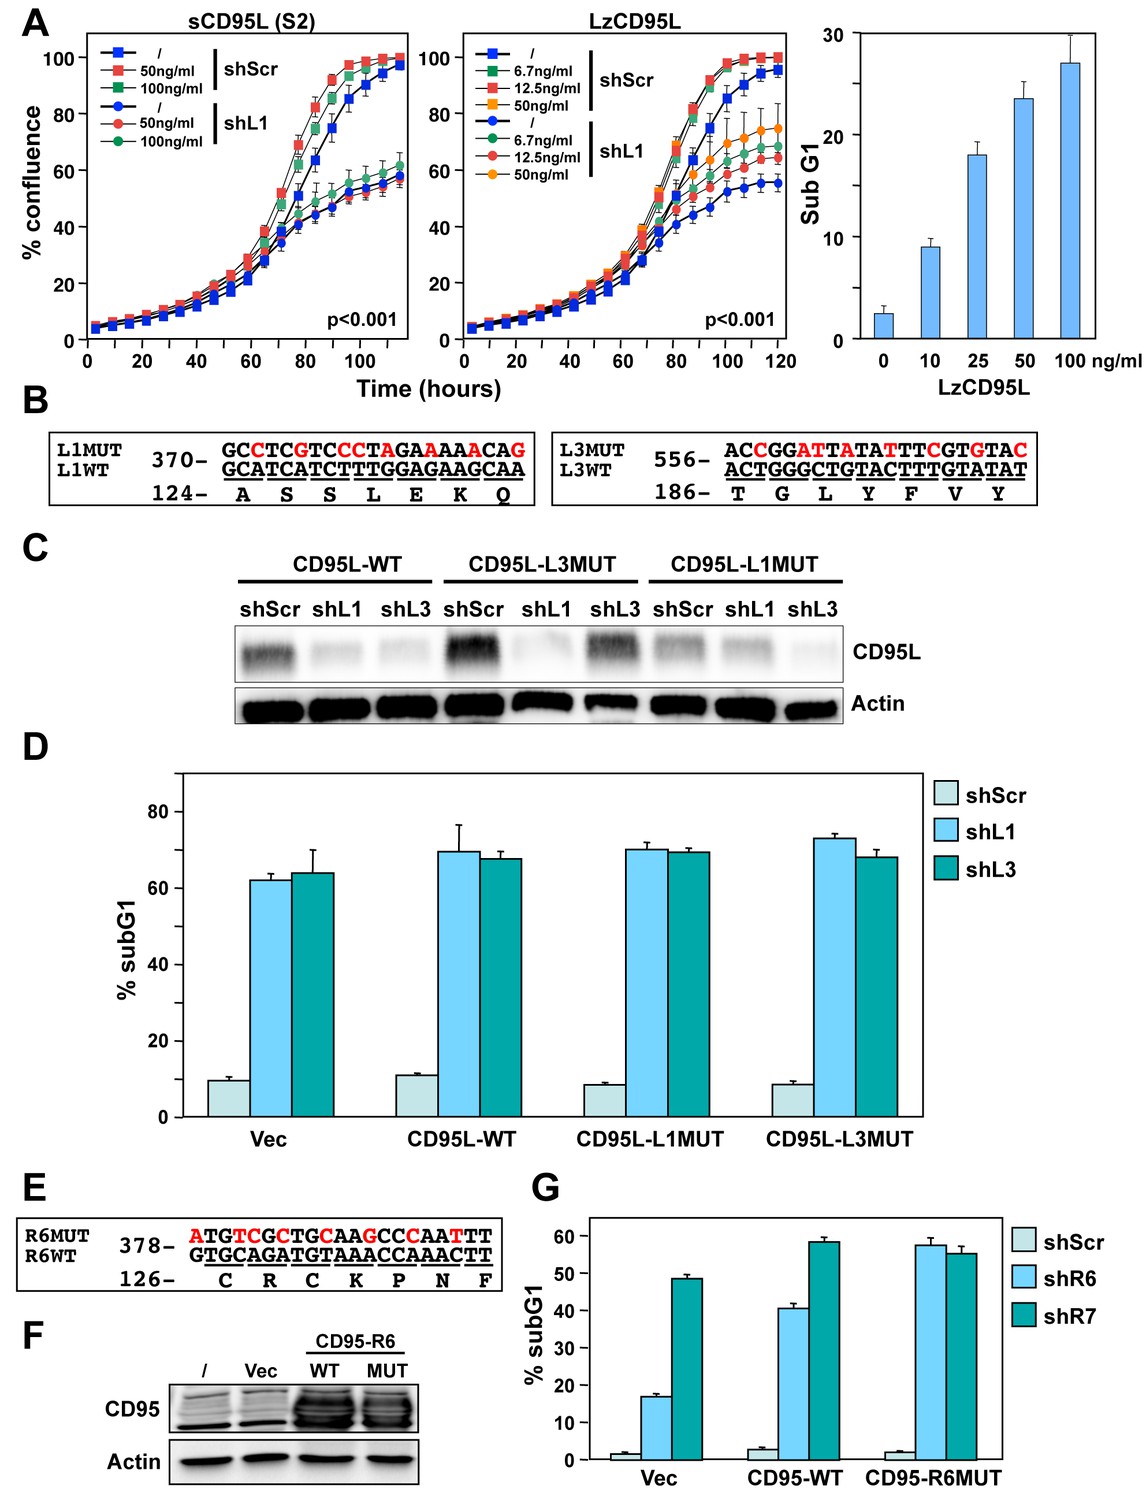
Exogenous CD95L or CD95 proteins do not protect cells from toxicity of CD95L/CD95-derived shRNAs.
(A) Left: Percent cell confluence over time of NB7 cells after infection with either pLKO-shScr or pLKO-shL1 and concurrent treatment with different concentrations of soluble CD95L protein (S2). Two-way ANOVA was performed for pairwise comparisons of % confluence over time between shScr expressing cells untreated (/) or treated with 100 ng/ml S2. Each data point represents mean ±SE of three replicates. Center: Percent cell confluence over time of NB7 cells after infection with either pLKO-shScr or pLKO-shL1 and concurrent treatment with different concentrations of leucine zipper-tagged (Lz)CD95L protein. Two-way ANOVA was performed for pairwise comparisons of % confluence over time between shScr-expressing cells untreated or treated with 50 ng/ml LzCD95L. Each data point represents mean ±SE of three replicates. Right: Percent nuclear PI staining of MCF-7 cells 24 hrs after adding different amounts of LzCD95L. (B) Schematic of the eight silent mutations introduced to the shL1 and the shL3 target sites of CD95L. (C) Western blot analysis of CD95L and β-actin in NB7 cells over-expressing CD95L-WT, CD95L-L1MUT, or CD95L-L3MUT 3 days after infection with pLKO-shScr, pLKO-shL1, or pLKO-shL3. Shown is one of two repeats of this analysis. (D) Percent nuclear PI staining of NB7 cells expressing empty pLenti vector, CD95L-WT, CD95L-L1MUT, or CD95L-L3MUT 6 days after infection with either pLKO-shScr, pLKO-shL1, or pLKO-shL3. Each bar represents mean ±SD of three replicates. (E) Schematic of the eight silent mutations introduced at the shR6 site of CD95. (F) Western blot analysis of CD95 and β-actin in MCF-7 cells over-expressing CD95-WT or CD95-R6MUT. (G) Percent nuclear PI staining of MCF-7 cells expressing empty pLNCX2 vector, CD95-WT, or CD95-R6MUT 6 days after infection with pLKO-shScr, pLKO-shR6, or pLKO-shR7. Each bar represents mean ±SD of three replicates.
Figure 1—figure supplement 1
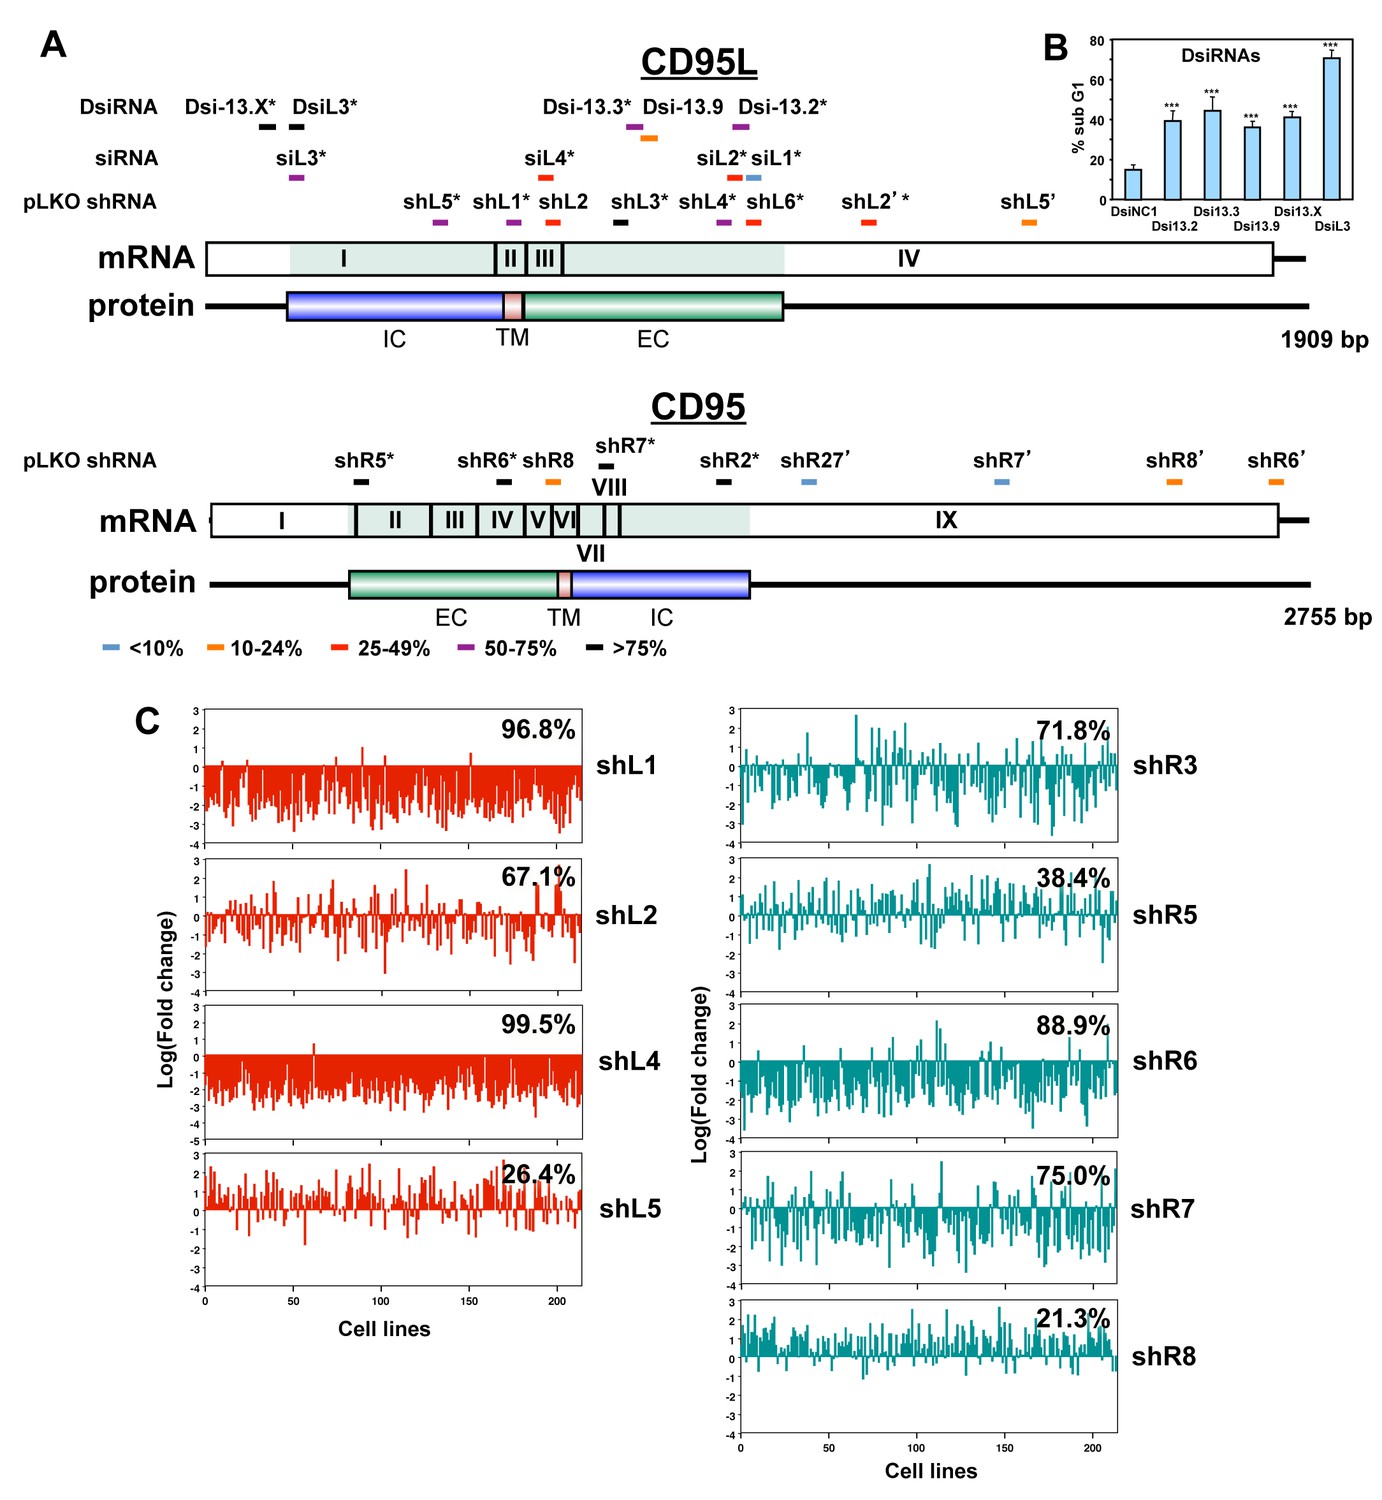
The majority of siRNAs and shRNAs targeting CD95L or CD95 are toxic.
(A) Location of target sites, growth inhibitory activities and toxicity of all tested siRNAs, DsiRNAs, and pLKO-shRNAs targeting CD95L and CD95. Experiments were performed in HeyA8 cells at an MOI of 3 for pLKO-shRNA infection, transfected with 25 nM of siRNAs, or 5 nM of DsiRNAs. Color code indicates the level of growth reduction caused by each sh/siRNA. sh/siRNAs labeled with an asterisk induced significant cell death as monitored by nuclear PI staining. Both exon/intron structure and protein domains are shown for both CD95L and CD95. EC, extracellular domain; TM, transmembrane domain; IC, intracellular domain. Data on growth reduction of DsiRNAs were performed in triplicates and in two independent experiments. Data on growth reduction of siRNAs were performed in four replicates and in two independent experiments. Data on growth reduction of shRNAs were performed in triplicate and in two independent experiments. Data on nuclear fragmentation by siRNAs were performed in triplicate in two independent experiments. Data on nuclear fragmentation by shRNAs were performed in triplicate. (B) PI staining was used to quantify percent subG1 of HeyA8 cells 4 days after transfection with 5 nM of CD95L-derived DsiRNAs. Data are representative of three independent experiments. Each bar represents mean ±SD of four replicates (p-value ***p<0.0001, unpaired t-test). (C) Level of underrepresentation (toxicity) of shRNAs targeting either CD95L (left column) or CD95 (right column) across 216 human cancer cell lines as described in (Cowley et al., 2014). The fraction of cell lines for which an shRNA was found to be toxic is given as a percentage, for shL5, data were only available on 197 cell lines. This screen did not include shL3, but another CD95 derived shRNA we did not test (we now call shR3) was found to be toxic to 71.8% of the 216 cell lines.
Figure 1—figure supplement 2
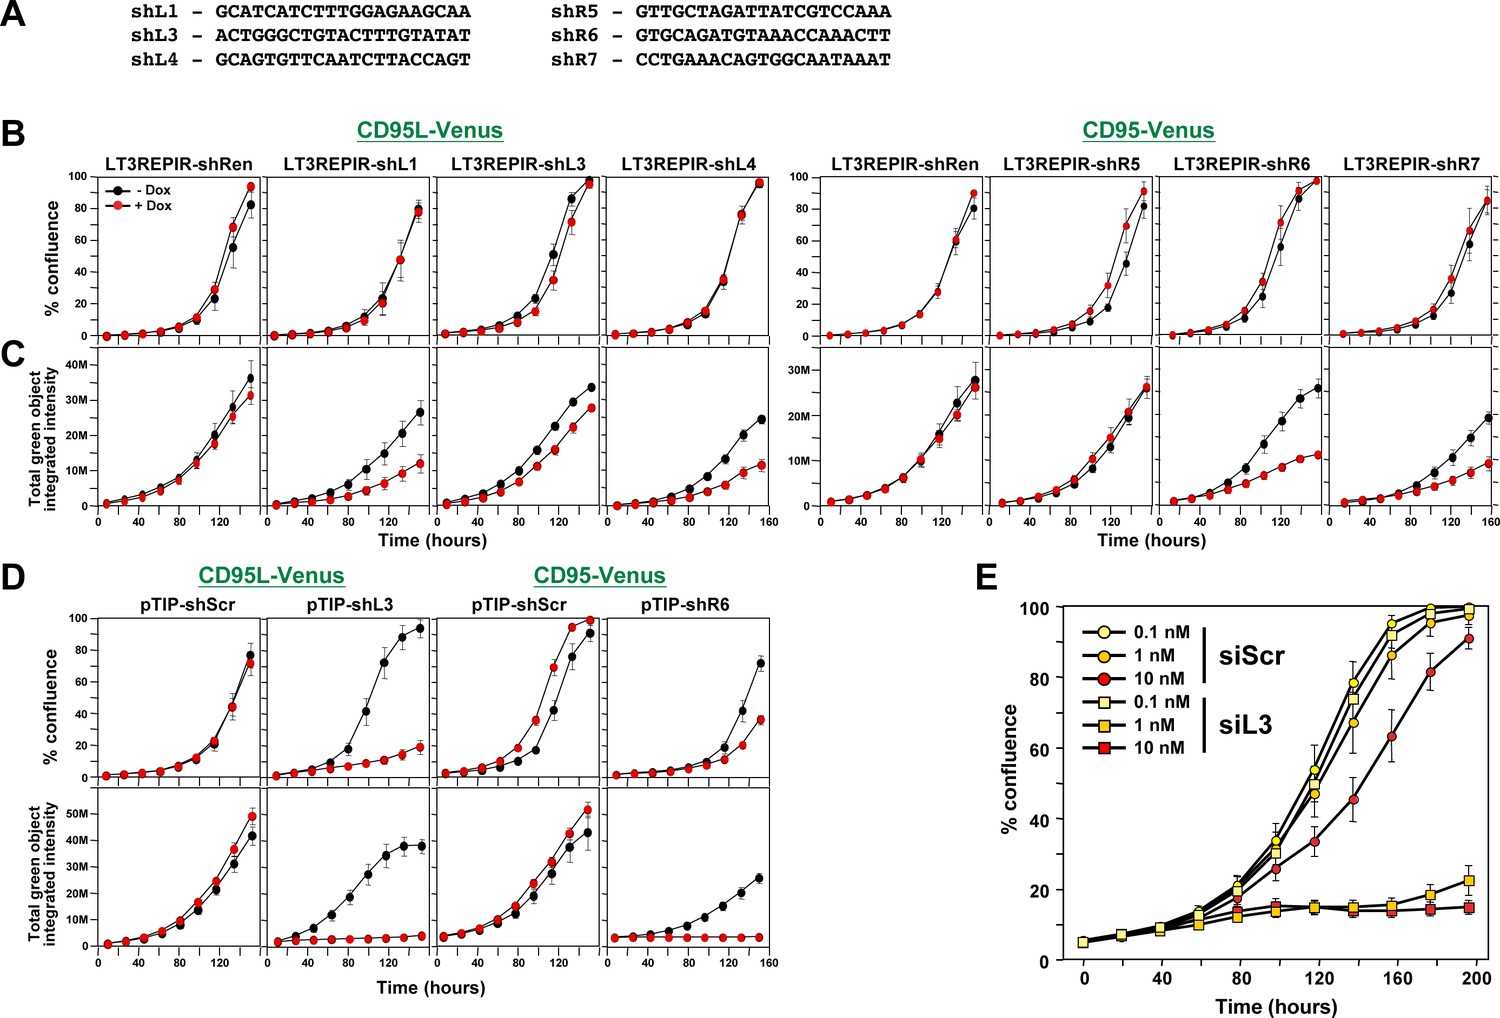
Toxicity of si/shRNAs is dose dependent.
(A) Sequences of the six toxic TRC shRNAs (pLKO vector) that were converted into miR-30-based shRNAs (Tet inducible LT3REPIR vector). (B) Confluence over time of NB7-Venus-CD95L (left) or NB7-Venus CD95 (right) cells infected with the LT3REPIR vector minus/plus Dox to induce expression of the indicated shRNAs. (C) Total green fluorescence over time of the experiment shown in B. (D) Confluence (top) and total green fluorescence (bottom) over time of NB7-Venus-CD95L (left) or NB7-Venus CD95 (right) cells infected with the pTIP vector minus/plus Dox to induce expression of the indicated shRNAs. (E) Confluence over time of HeyA8 cells transfected with the indicated concentration of either siScr or siL3. Each data point represents mean ±SE of six replicates. The experiment was repeated three times.
Figure 2 with 1 supplement

CD95 and CD95L derived si/shRNAs kill cells in the absence of the targeted sites in CD95 or CD95L.
(A) Schematic of the genomic locations and sequences of the gRNAs used to excise the siL3 (Δ64bp) and shL3 (Δ41bp) target sites from CD95L. PAM site is underlined. Green indicates a gRNA targeting the sense strand. Blue indicates a gRNA targeting the antisense strand. (B) Schematic showing the genomic locations and sequences of the gRNAs used to excise the shR6 (Δ227bp) target site. Mix, pool of three 293T clones with the homozygous shL3 deletion. (C) PCR with flanking (top panels) and internal (bottom panels) primers used to confirm the Δ41 deletion in the shL3 site in one of the three homozygous deletion 293T clones generated. Cells transfected with Cas9 only (Cas9) are wild-type. (D) Quantitative PCR for endogenous CD95L with a primer downstream of the Δ41 shL3 deletion and another primer internal to the deleted region. nd, not detectable. Each bar represents mean ±SD of three replicates. (E) PCR with flanking (top row) and internal (bottom row) primers used to confirm the presence of the shL3 Δ41 (top panel), siL3 Δ64 (middle panel), and shR6 Δ227 (bottom panel) deletions in HeyA8 clones. Mix, HeyA8 cells after transfection with Cas9 and gRNAs but before single cell cloning. (F) Quantitative PCR for CD95 in HeyA8 cells transfected with Cas9 plasmid (Cas9) alone, or the HeyA8 ΔshR6 clone #11. RNA was extracted 5 days after infection with pLKO-shScr, pLKO-shR6, pLKO-shR2, or pLKO-shR6’ (targeting the 3'UTR). Each bar represents mean ±SD of three replicates. (G) Percent cell confluence over time of 293T cells (left) and a pool of three 293T clones with a homozygous deletion of the shL3 target site (right) infected with pTIP-shScr or pTIP-shL3 and treatment with or without Dox. Data are representative of two independent experiments. Each data point represents mean ±SE of six replicates. (H) Left: Percent confluence over time of HeyA8 cells infected with pLKO-shScr, pLKO-shR6, or pLKO-shL3. Center: Percent confluence over time of a HeyA8 clone with a homozygous deletion of the shR6 target site infected with either pLKO-shScr or pLKO-shR6. Right: Percent confluence over time of a pool of three HeyA8 clones with a homozygous deletion of the shL3 site infected with either pLKO-shScr or pLKO-shL3. Data are representative of two independent experiments. Each data point represents mean ±SE of three replicates. (I) Percent confluence over time of a pool of three HeyA8 clones harboring a homozygous deletion of the siRNA siL3 target site after transfection with different concentrations of siScr or siL3. Data are representative of three independent experiments. Each data point represents mean ±SE of three replicates.
Figure 2—figure supplement 1
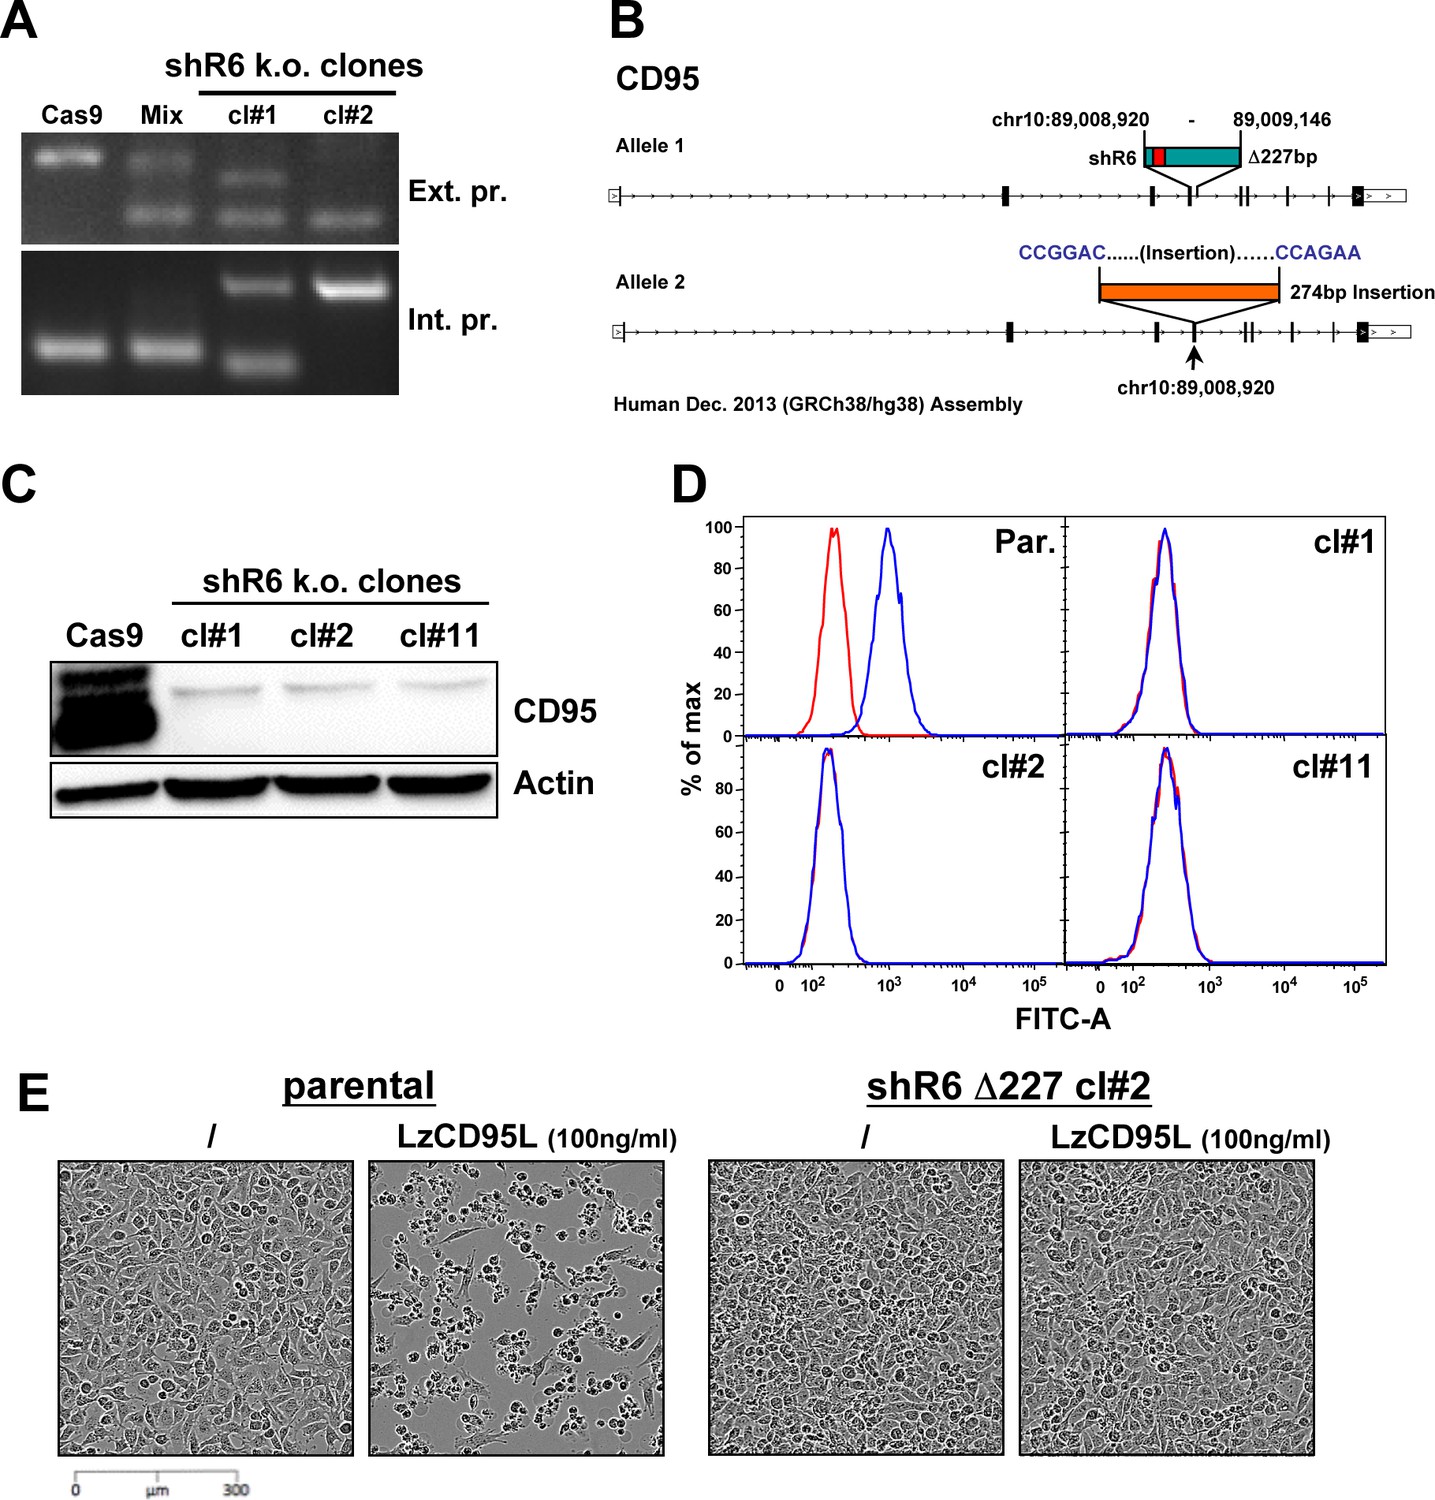
Knockout of CD95 in HeyA8 cells.
(A) PCR showing a Δ227 shR6 deletion and insertions in HeyA8 clones #1 and #2. (B) Schematic of the Δ227 deletion in allele #1 and partial insertion of a pSC-B plasmid fragment in allele #2 in HeyA8 clone #2 based on Sanger sequencing of isolated bands from PCR shown in A. Note, cl#1 and #2 have the expected Δ227 shR6 deletion in one allele and an insertion in the other. cl#11 has a homozygous Δ227 shR6 deletion. The deleted region is shown in green containing the shR6 target site in red. pSC-B vector sequences are shown in blue letters, and the insertion is shown in orange. (C) Western blot for CD95 and β-actin in Cas9-control transfected HeyA8 cells and HeyA8 shR6 k.o. clones #1, #2, and #11. Shown is one of two repeats of this analysis. (D) Surface staining for CD95 in parental HeyA8 cells and HeyA8 shR6 knockout clones #1, #2, and #11. Shown is one of two repeats of this analysis. (E) Images showing apoptosis induction with LzCD95L treatment (4.5 hr) in parental HeyA8 cells but not in clone #2.
Figure 3

Toxicity of CD95L-derived siRNAs involves canonical RNAi activity.
(A) Percent cell confluence (left) and total green object integrated intensity (right) over time of a HeyA8 CD95 knockout clone (ΔR6 cl#2) expressing the Venus-CD95L sensor either untreated (Ctr) or after transfection with 25 nM of single-stranded sense, single-stranded antisense, or double-stranded (ds) siScr or siL3 siRNAs. The CD95L sensor is schematically shown and comprises the Venus ORF fused to the CD95L ORF lacking the A of the ATG start codon (X). Data are representative of two independent experiments. Each data point represents mean ±SE of three replicates. (B) Percent cell confluence (left) and total green object integrated intensity (right) over time of the HeyA8 CD95L sensor cell used in Figure 3A after transfection with 5 nM siScr or siL3 double-stranded RNA (dsRNA) or double-stranded DNA (dsDNA). Data are representative of two independent experiments. Each data point represents mean ±SE of three replicates. (C) Summary of experiments to test whether siL3 and siL2 siRNAs modified as indicated (left) were active (check mark) or not (X) in reducing green fluorescence or cell growth (both >70% reduction at end point) when transfected at 25 nM (except for blunt end oligonucleotides which were used at 5 nM and compared to 5 nM of siL3) into HeyA8 CD95L sensor cells used in Figure 3A. Endpoints were 164 hrs for blunt end siRNA transfection, 180 hrs for modified siL3 and 144 hrs for modified siL2 siRNA transfections. Every data row is based on cell growth and green fluorescence quantification data executed as shown in A. Each analysis was done in triplicate and based on two independent repeats. (D) Red object count over time of HeyA8 cells (expressing NucRed) after transfection with different ratios of siL3 and mutant siL3 (siL3MUT). Data are representative of two independent experiments. Each data point represents mean ±SE of three replicates. (E) Percent cell confluence over time of HCT116 parental (left) or Dicer-/- (clone #43, another Dicer-/- clone, #45, gave a similar result, data not shown), or Drosha-/- (right) cells after infection with either shScr, shL3 or shR6 pLKO viruses. Inserts show the level of protein expression levels of Drosha/Dicer and AGO2 levels in the tested cells. Data are representative of three independent experiments. Each data point represents mean ±SE of four replicates. Drosha-/- cells were more sensitive to toxic shRNAs than wt cells (p<0.0001, according to a polynomial fitting model). (F) Western blot analysis of HCT116 wt, Dicer-/- or Drosha-/- cells 4 days after infection with either pLKO-shScr or pLKO-shR6. (G) Percent cell confluence over time of HCT116 wt, Dicer-/- (clone #43) and Drosha-/- cells after transfection with 25 nM siScr or siL3. Data are representative of four independent experiments (Dicer-/- clone #45, gave a similar result, data not shown). Each data point represents the mean ±SE of four replicates. Data in insert confirm similar uptake of transfected siRNA (25 nM of siGLO Red) into wild-type, Dicer-/- and Drosha-/- cells. Dicer-/- and Drosha-/- cells were more sensitive to siL3 than wt cells (p<0.0001, according to a polynomial fitting model). (H) Percent reduction in Venus expression (green) and in cell number (red object count [red]) over time of HeyA8 cells expressing the Venus-CD95L sensor and red nuclei after transfection with 5 nM of different chimeric siRNAs generated by substituting nucleotides in the toxic siL3 with the scrambled siRNA sequence beginning at either the seed match end (top) or the opposite end (bottom) of siL3 after 188 hr. The schematic in the middle shows the sequence of siL3 and the siScr siRNA (both sense and antisense strands). The 6mer seed sequence region of siL3 (positions 2 to 7) is highlighted in light blue. Nucleotides shared by siScr and siL3 are shown in grey font. Data are representative of two independent experiments. Each data point represents mean of three replicates. In another independent experiment cells were transfected with 25 nM with a very similar result (data not shown).
Figure 4 with 3 supplements
Toxic shRNAs derived from CD95 and CD95L cause downregulation of critical survival genes.
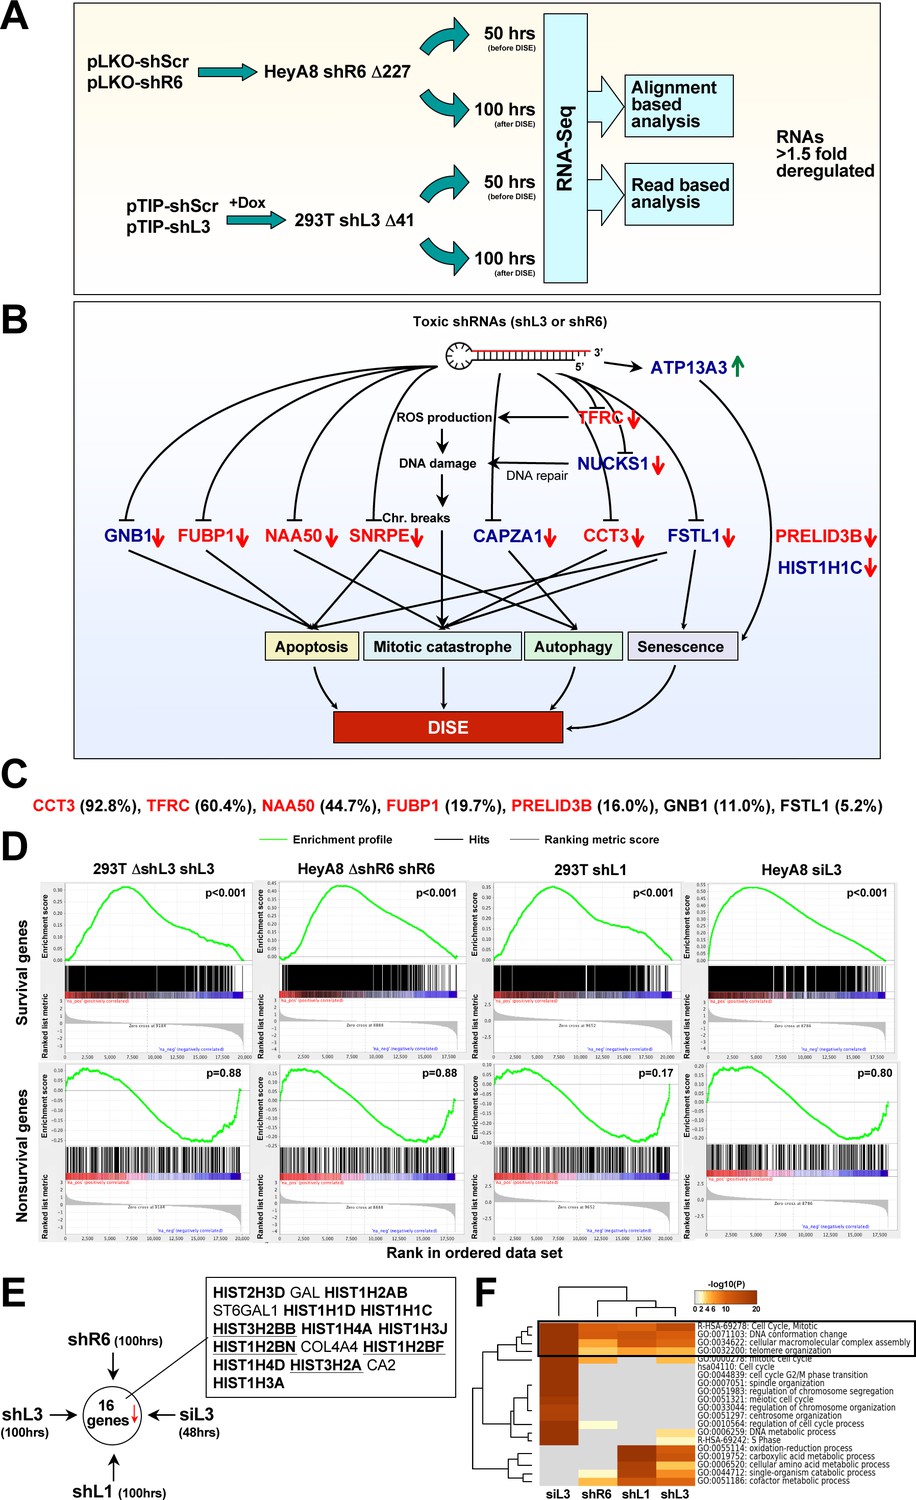
(A) Schematic of RNA-Seq work flow for total RNA sample prepared both before (50 hr) and during (100 hr) DISE after expressing either shR6 or shL3 from different vector systems (i.e. pLKO-shR6 and pTIP-shL3) in different cells (HeyA8 shR6 Δ227 cells and 293T shL3 Δ41 cells). (B) One mRNA was up and 11 mRNAs were downregulated in the cells treated with toxic shL3 and shR6 as shown in Figure 4A. mRNAs shown in red were found to be essential cancer survival genes in two genome-wide lethality screens. The number of essential genes was enriched from 6.6% of the tested genes (Blomen et al., 2015; Wang et al., 2015) to 54.5% in our study (p=3×10⁻⁶ according to binomial distribution). (C) The level of growth inhibition observed in HeyA8 cells transfected with siRNA SmartPools (25 nM) individually targeting the listed survival genes. Targeting the seven genes shown significantly reduced cell growth compared to cells transfected with a siScr pool at 140 hrs (samples done in quadruplicate in two independent experiments) with an ANOVA p<0.05. (D) Gene set enrichment analysis for a group of 1846 survival genes (top four panels) and 416 nonsurvival genes (bottom four panels) identified in a genome-wide CRISPR lethality screen (Wang et al., 2015) after introducing Dox-inducible shL3 in 293T ΔshL3 cells (left-most panels), shR6 in HeyA8 ΔshR6 cells (center-left panels), shL1 in parental 293T cells (center-right panels), and siL3 in HeyA8 cells (right-most panels). Scrambled sequences served as controls. p-values indicate the significance of enrichment. (E) Schematics showing all RNAs at least 1.5 fold downregulated (adj p-value<0.05) in cells treated as in Figure 4A. Histones that are underlined contain a 3’UTR. (F) Metascape analysis of the 4 RNA Seq data sets analyzed. The boxed GO term clusters were highly enriched in all data sets.
Figure 4—figure supplement 1
Down-regulation of critical survival genes after treatment with CD95 and CD95L-derived shRNAs and siRNAs.
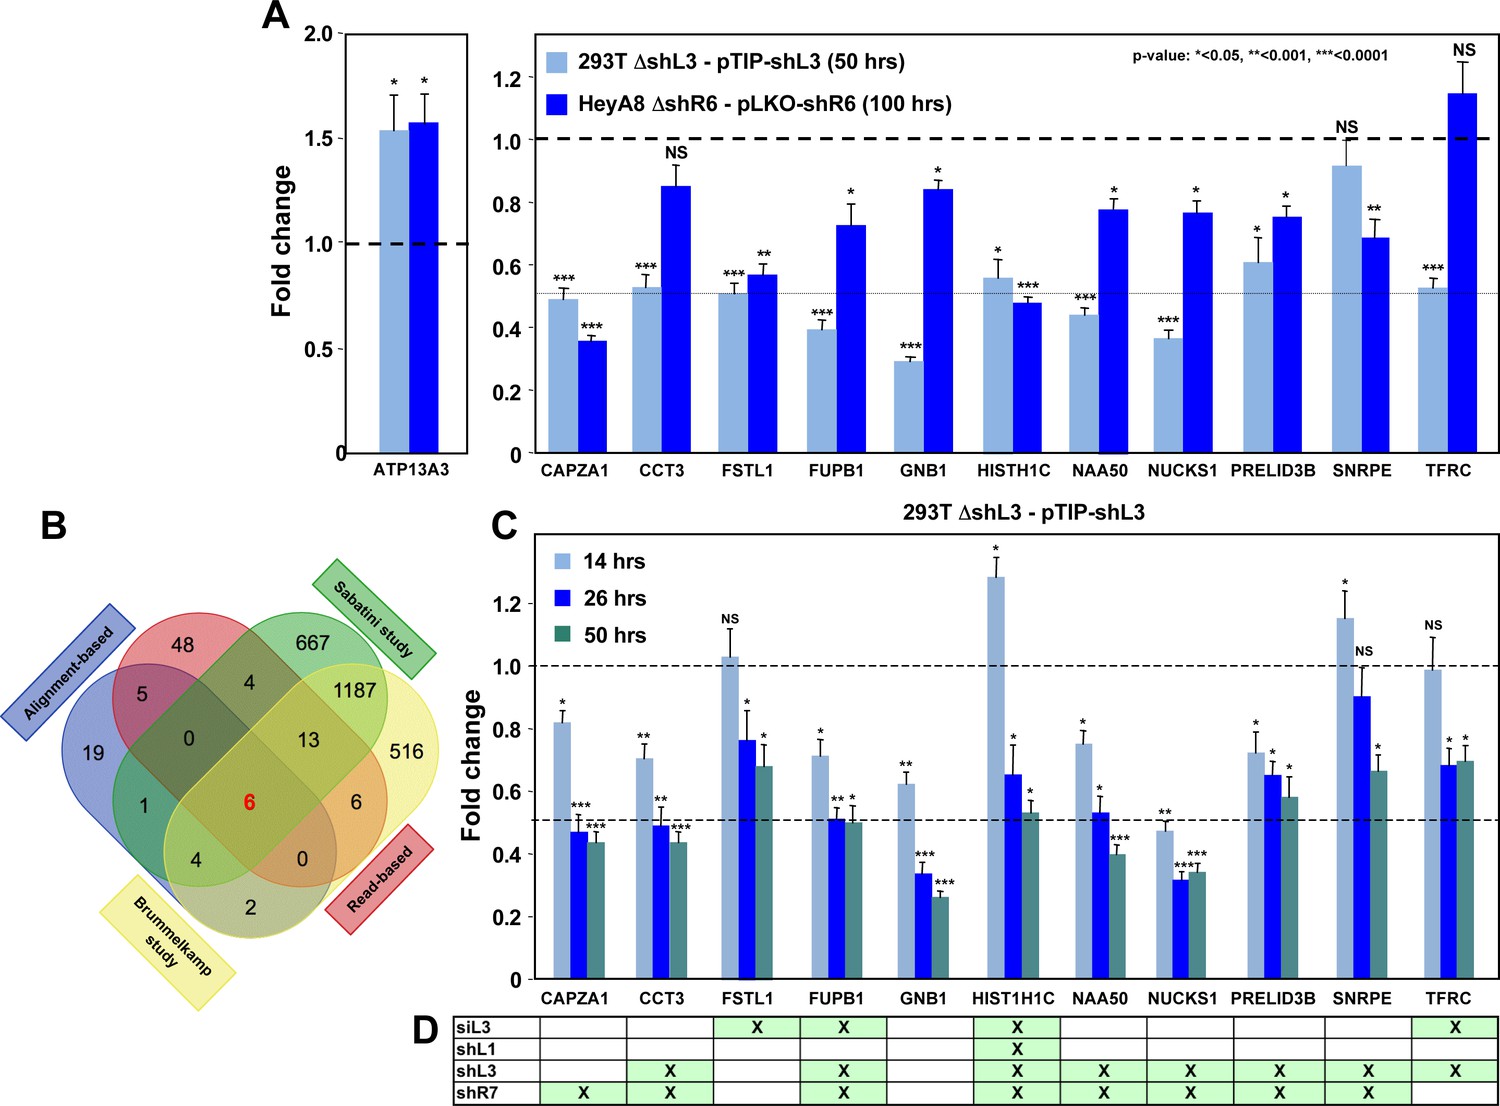
(A) Arrayed quantitative PCR of genes found to be down-regulated (or upregulated as with ATP13A3) in Figure 4B both in 293T ΔshL3-pTIP-shL3 cells 50 hrs post-Dox treatment and HeyA8 ΔshR6-pLKO-shR6 100 hrs post infection and puromycin selection. Data are representative of two independent experiments. Each bar represents mean ±SD of two biological replicates and two technical replicates (p-value *<0.05, **<0.005, unpaired t-test). (B) Venn diagram showing overlap of genes determined to be down-regulated with both read-based and alignment-based analyses of the RNA-Seq data depicted in Figure 4A with the critical survival genes found in the Sabatini and Brummelkamp studies (Blomen et al., 2015; Wang et al., 2015), all listed in Supplementary file 2. The Venn diagram was generated using http://bioinformatics.psb.ugent.be/webtools/Venn. (C) Kinetic quantitative PCR of the down-regulated genes in the 293T ΔshL3 pTIP-shL3 cells. RNA was collected at 14 hrs, 26 hrs, and 50 hrs after treatment with Dox. NS, not significant. Each bar represents mean ±SD of quadruplicates (p-value *<0.05, **<0.005, unpaired t-test). (D) Table showing which genes were significantly (p<0.05) down-regulated >1.5 fold (indicated by an ‘X’) in parental HeyA8 cells 80 hrs after transfection with siL3 or 100 hrs after infection and puromycin selection with pLKO-shL1, pLKO-shL3, or pLKO-shR7. The following describes the 11 genes that were significantly downregulated after introducing the toxic shRNAs shL3 or shR6 into cancer cells (see Figure 4B) and some of their cancer relevant activities. (1) CAPZA1 (capping actin protein of muscle Z-line alpha subunit 1) is an actin capping protein. CAPZA1 knockdown has been reported to cause disassembly of autophagosomes (Mi et al., 2015). It is overexpressed in malignant melanoma (Sun et al., 2011). (2) CCT3 (chaperonin containing TCP1 subunit 3) is part of a chaperone complex that folds various proteins including actin and tubulin. CCT3 is required for proper mitotic progression (Zhang et al., 2016). (3) FSTL1 (follistatin-like 1) is a putative activin-binding protein. Knockdown of FSTL1 in lung cancer cells resulted in mitotic arrest followed by apoptosis promoted by the activation of caspase-3 and −9 (Bae et al., 2016). FSTL1 is downregulated during cellular senescence of human mesenchymal stem cells (Yoo et al., 2013). (4) FUBP1 (far upstream element binding protein 1). A lack of FUBP1 causes a cell-autonomous defect in the maintenance of fetal and adult hematopoietic stem cells (HSCs). FUBP1-deficient adult HSCs exhibit significant transcriptional changes, including upregulation of the cell-cycle inhibitor p21 and the pro-apoptotic Noxa molecule, suggesting they undergo apoptosis (Rabenhorst et al., 2015). In addition, FUBP1 binds to an upstream element of the c-myc promoter and regulates c-myc mRNA level, thus regulating proliferation (Jang et al., 2009). Finally, FUBP1 is upregulated in many tumors and acts as an oncoprotein by stimulating proliferation and inhibiting apoptosis (Baumgarten et al., 2014). (5) GNB1 (G-protein beta submit 1) is tumor-promoting in breast cancer. Data suggest that GNB1 plays an important role in the mTOR-related anti-apoptosis pathway (Wazir et al., 2013). (6) HIST1H1C. A specific role of this particular histone in cancer cell survival has not yet been described. (Knockdown causes cell cycle arrest in MCF-7 cells; (Sancho et al., 2008). (7) NAA50 (N(alpha)-acetyltransferase 50, NatE catalytic subunit) is required for sister chromatid separation in vivo (Hou et al., 2007). (8) NUCKS1 (nuclear casein kinase and cyclin-dependent kinase substrate 1) is a chromatin-associated protein with a role in the DNA damage response. Knocking down NUCKS1 causes chromosomal breaks (Parplys et al., 2015). (9) PRELID3B (PRELI domain containing 3B) is an inner mitochondrial protein. Knocking down PRELID3B decreases cell viability (http://www.genecards.org/cgi-bin/carddisp.pl?gene=PRELID3B). (10) SNRPE (small nuclear ribonucleoprotein polypeptide E). siRNA-mediated depletion of SNRPE stimulated autophagy and led to a marked reduction of cell viability in breast, lung, and melanoma cancer cell lines, whereas it had little effect on the survival of the nonmalignant MCF-10A breast epithelial cells (Quidville et al., 2013). (11) TFRC (transferrin receptor). Blocking TFRC function with a neutralizing antibody inhibits cell proliferation and survival (Pham et al., 2014). Suppression of TFRC led to apoptosis of renal cells (Gui et al., 2013) and cell cycle arrest in esophageal squamous cell carcinoma cells (Chan et al., 2014).
Figure 4—figure supplement 2
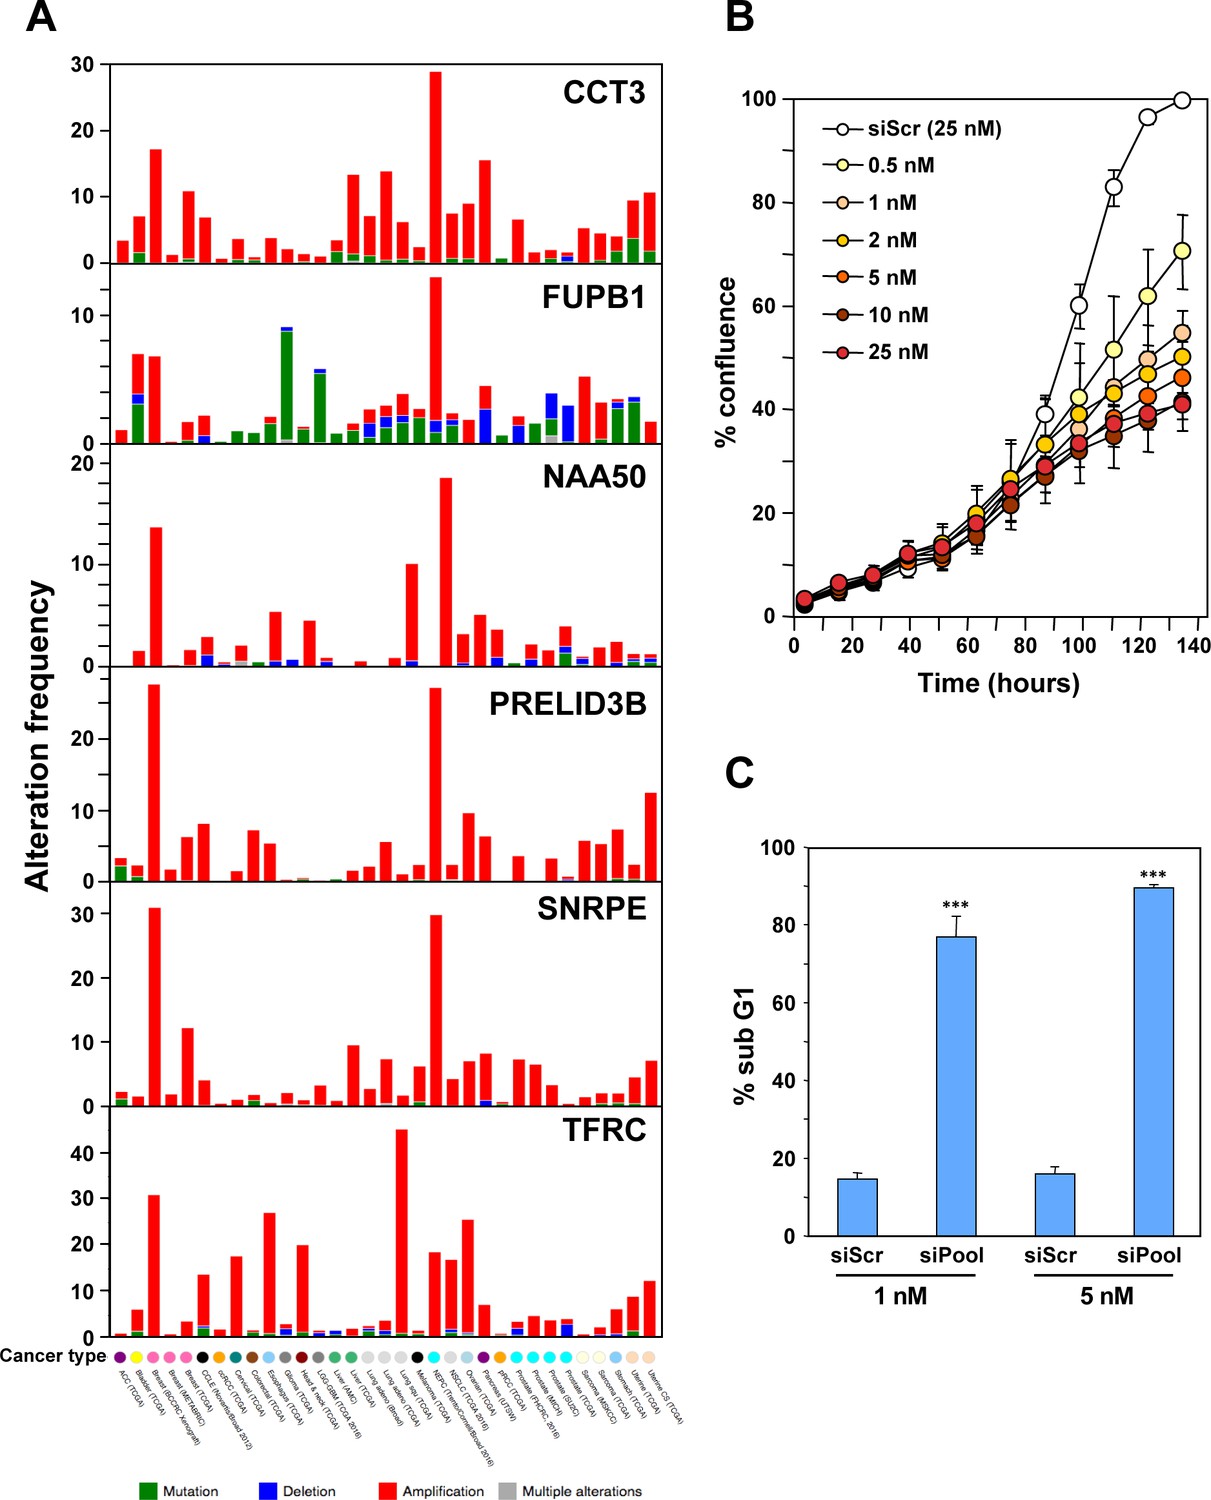
Characterization of the six genes downregulated in shL3 and shR6-treated cells and found to be critical survival genes in lethality screens.
https://doi.org/10.7554/eLife.29702.011
Figure 4—figure supplement 3
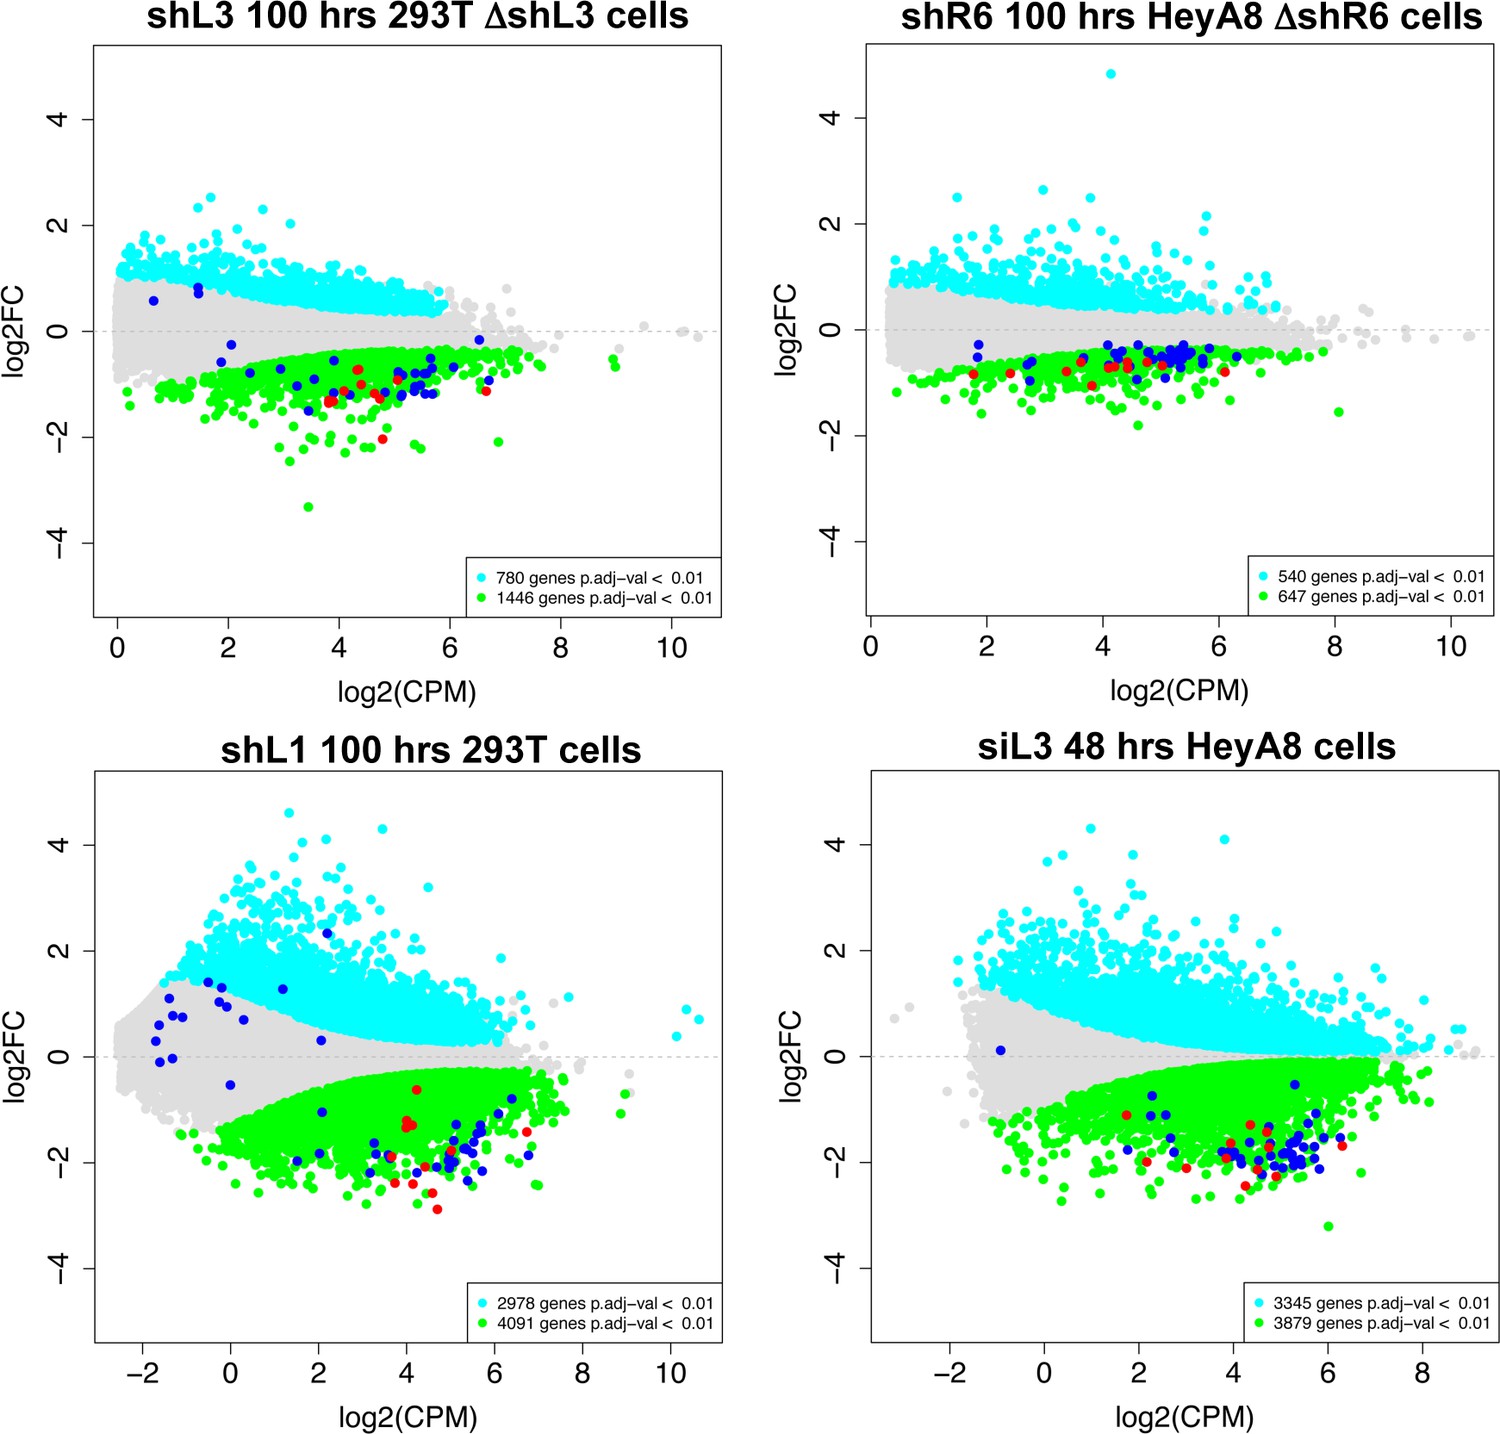
Histones are downregulated in all forms of DISE but are not the most highly expressed genes in cells.
MA plots comparing the expression level (counts per million, CPM) and fold change in the four RNA Seq data sets in this study. Shown are all RNAs that were >1.5 fold deregulated with an adjusted p-value of <0.01. Significantly downregulated RNAs are shown in green, upregulated RNAs in cyan. All 73 histones are shown as dark blue dots and the 12 histones downregulated in all four data sets are shown as red dots.
Figure 5 with 3 supplements

DISE inducing si/shRNAs target critical survival genes through RNAi.
(A) Sylamer plots for the list of genes in the shL3 experiment (left) and the shR6 experiment (right) ordered from down-regulated to up-regulated. The most highly enriched sequence is shown which in each case is the 8mer seed match of the introduced shRNA. The red line corresponds to a p-value threshold of 0.05 after Bonferroni correction for the number of words tested (65536). Bonferroni-adjusted p-values are shown. The unadjusted p-values are 1.58E-24 and 1.35E-26, respectively. The black line represents the sequences carrying the let-7 8mer seed match. (B) Location of the 6mer seed matches of either shL3 or shR6 in the 3'UTRs of the 11 genes (shown at scale) identified in the RNA-Seq experiment described in Figure 4A. Red font indicates a critical survival gene. (C) A series of six 2 × 2 contingency tables comparing whether or not a critical survival gene is downregulated after treatment with the indicated siRNA or shRNA to whether or not its 3’UTR contains at least one seed match for the introduced sh/siRNA. p-values were calculated using Fisher’s Exact Test to determine any significant relationship between gene downregulation and presence of seed matches in 3’UTR.
Figure 5—figure supplement 1
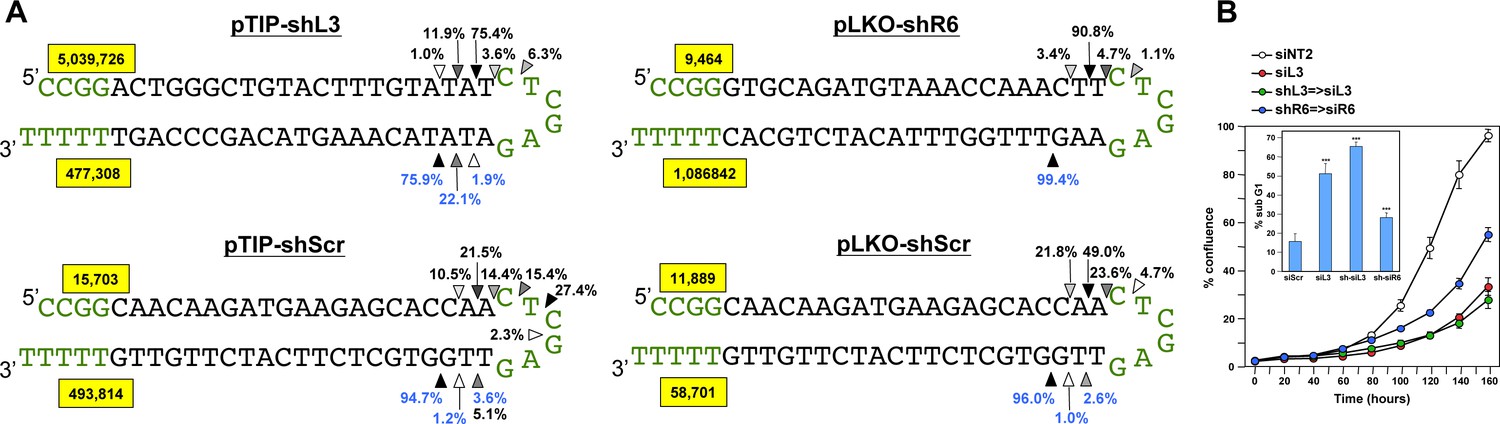
Quantification of the mature shRNA forms.
(A) Graphical representation of the percentage of the different Dicer cut sites to produce the mature passenger (top) and guide (bottom) strands of 3 shRNAs expressed from two vectors. All analyses were performed with cells 50 hrs after either Dox addition (in pTIP expressing cells) or 50 hrs post puromycin selection after infection with the pLKO virus. Letters in green: vector sequences; black: passenger and guide strands of shRNAs; Arrow heads label the most highly cleaved residues; the darker the arrow head the more highly cleaved. Numbers in yellow box represent total number of reads detected for passenger and guide strands. (B) Percent cell confluence in HeyA8 cells after transfection with shL3 => siL3 (shL3 converted to an siRNA) or shR6 => siR6 (shR6 converted to an siRNA). Conversion was based on the most common mature double-stranded RNA form produced as indicated by the results in A. Data are representative of two independent experiments. Each bar represents mean ±SE of four replicates. Insert: percent DNA fragmentation in the same samples. Data are representative of two independent experiments. Each bar represents mean ±SD of four replicates, ***p<0.0001, unpaired t-test.
Figure 5—figure supplement 2
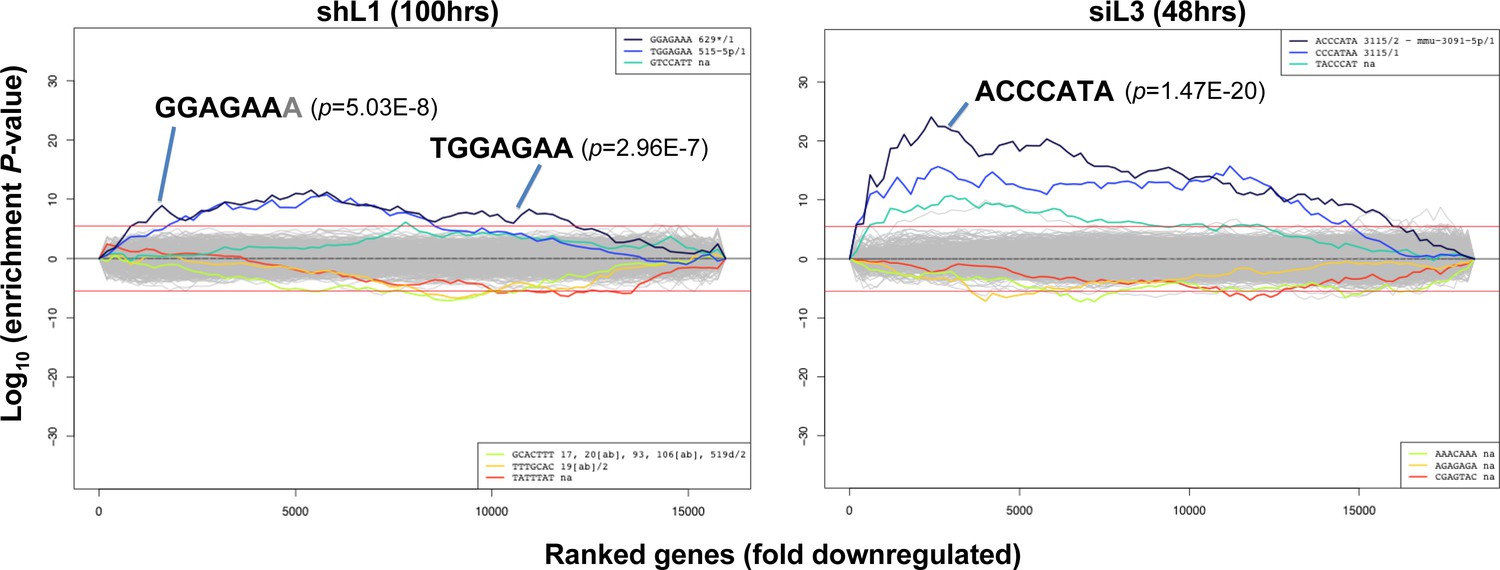
Identification of seed matches targeted by shL1 and siL3.
Sylamer plots for the list of genes in the shL1 experiment (293T cells 100 hrs post puromycin selection after infection with pLKO-shL1) (left) and the siL3 experiment (48 hrs after transfection of HeyA8 cells with siL3) (right) ordered from down-regulated to up-regulated. The most highly enriched sequences are shown which in each case is the 7mer seed match of the introduced shRNA. The red line corresponds to a p-value threshold of 0.05 after Bonferroni correction for the number of words tested. Bonferroni-adjusted p-values are shown.
Figure 5—figure supplement 3
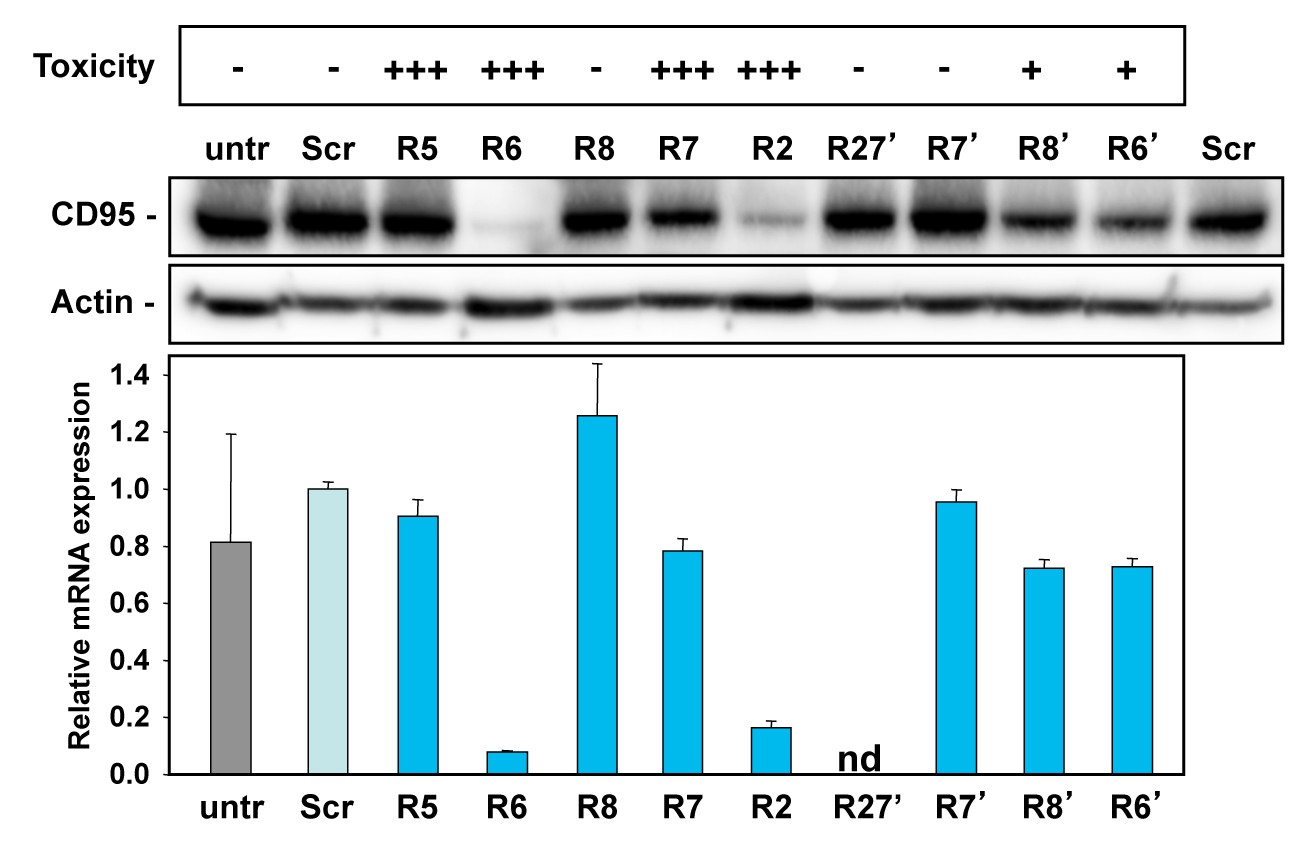
Activity to knockdown CD95 does not determine shRNA toxicity.
HeyA8 cells infected with the indicated shRNAs in the pLKO vector were analyzed for toxicity (top, % percent reduction at half maximal confluency), CD95 expression by Western blot analysis (center, 2 days after puromycin addition) and qPCR analysis (bottom, 3 days after puromycin addition). Shown data are representative of two independent experiments. +++,>75%; ++,>50%; +,>10%; -,<10% growth reduction.
Figure 6 with 2 supplements

Identifying all toxic shRNAs derived from CD95L and CD95.
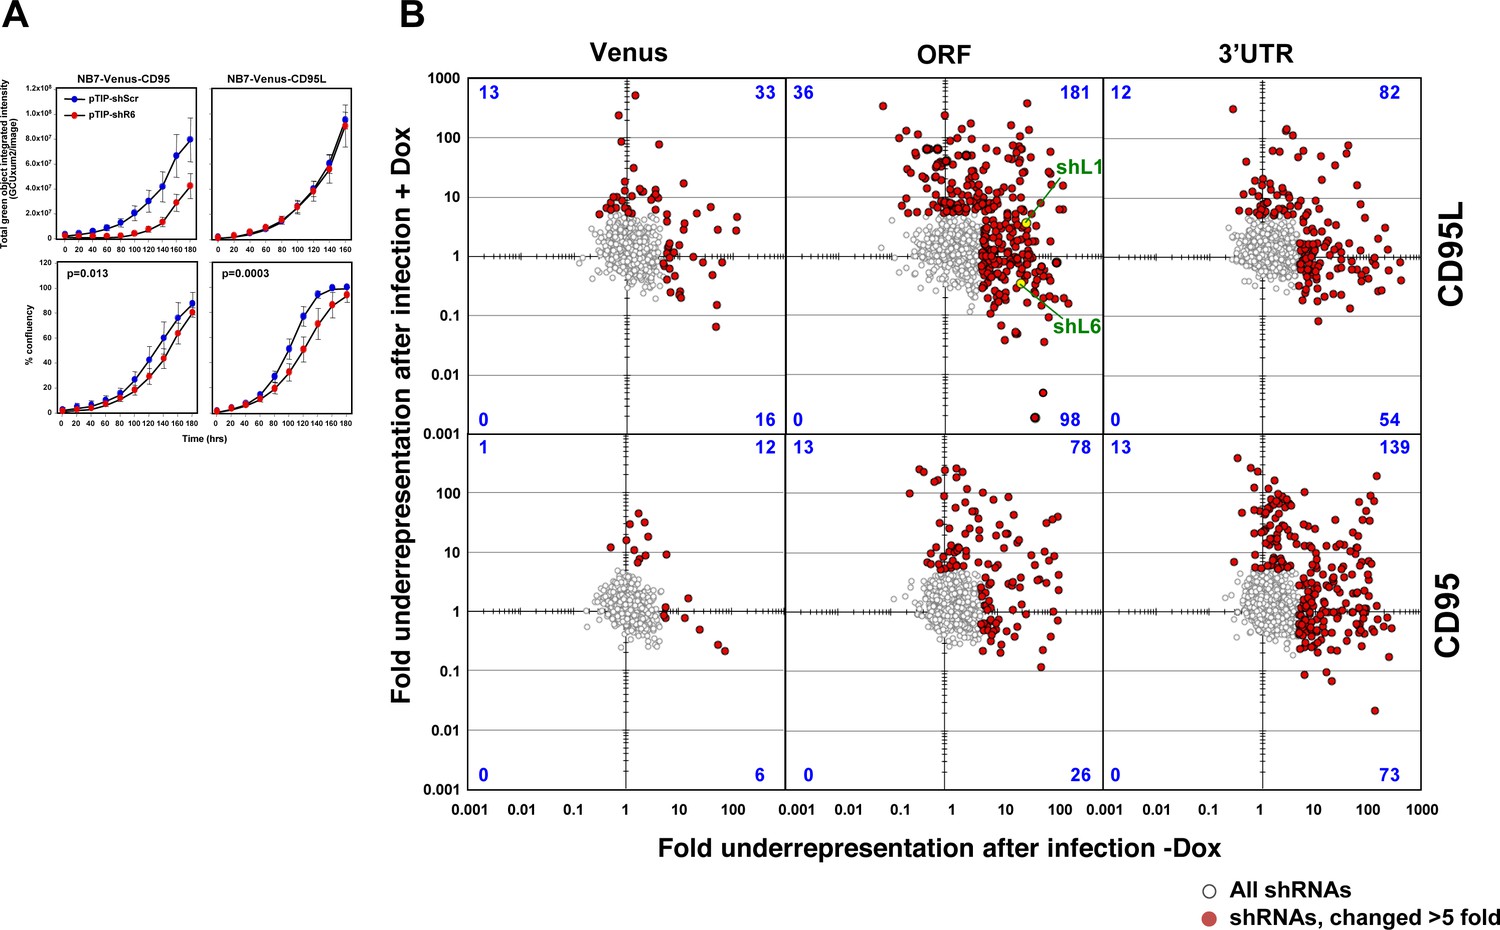
(A) Schematic showing the cloned shRNAs covering the ORF of Venus and the ORFs and 3'UTRs of CD95L and CD95. The 3’UTR is displayed as a dashed line because it was not included in the full-length Venus-CD95L/CD95 sensors. (B) Work-flow of pTIP-shRNA library synthesis, shRNA screen and data analysis. (C) Ranked fold reduction of shRNAs spanning Venus and CD95L (ORF and 3'UTR) (left three panels) and Venus and CD95 (ORF and 3'UTR) (right three panels). The ranked lists were separated into the shRNAs derived from Venus (top), the ORFs (center) and the 3'UTRs (bottom). The p-value of enrichment for each ranked set of shRNAs is given. Only the parts of the ranked lists are shown with the downregulated shRNAs. For all six panels, the top section of each panel (boxed in blue) contains the data on shRNAs downregulated after infection of cells and cultured for 9 days without Dox when compared to the composition of the shRNA plasmid library and the bottom half (boxed in orange) contains the data on shRNAs downregulated after culture with Dox for 9 days when compared to the culture without Dox. P-values were calculated using Mann Whitney U tests with a one-sided alternative that the rank was lower. (D) The location of all shRNAs significantly downregulated at least five fold along the sequences of Venus, CD95L ORF, CD95L 3'UTR (left panel) and Venus, CD95 ORF, and CD95 3'UTR (right panel). The top half of each sub panel (blue ticks) shows the shRNAs downregulated after infection and the bottom half (orange ticks) contains the data on shRNAs downregulated after culture with Dox for 9 days. Significance of enrichment in the different subpanels is shown. p-values were calculated according to statistical tests of two proportions. Each data set was compared to the corresponding Venus distribution. Green line: sequence that corresponds to the intracellular domain of CD95L.
Figure 6—figure supplement 1
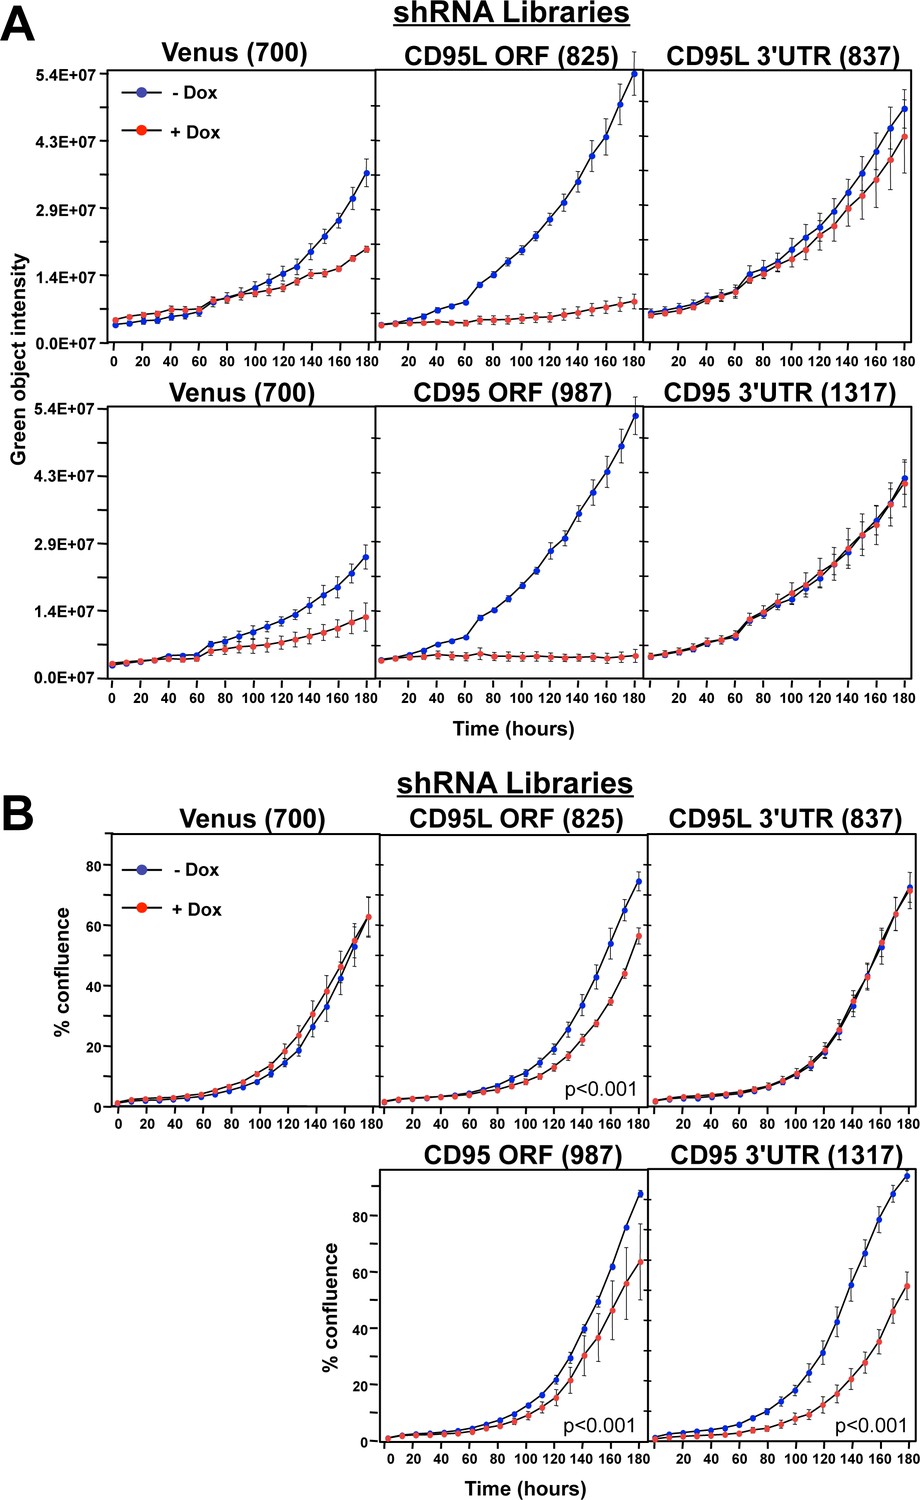
Toxicity and RNAi of individual shRNA pools.
(A) Top panels: Green object intensity over time of NB7 Venus-CD95L sensor cells infected with the pTIP-Venus shRNA pool (left panel), pTIP-CD95L ORF shRNA pool (center panel), or pTIP-CD95L 3’UTR shRNA pool (right panel) with or without Dox treatment. Bottom panels: Green object intensity over time of NB7 Venus-CD95 sensor cells infected with the pTIP-Venus shRNA pool (left panel), pTIP-CD95 ORF shRNA pool (center panel), or pTIP-CD95 3’UTR shRNA pool (right panel) with or without Dox treatment. Values were calculated from samples done in quadruplicates shown as mean ±SE. (B) Percent confluence over time of parental NB7 cells infected with the pTIP-Venus shRNA pool (top left panel), pTIP-CD95L ORF shRNA pool (top center panel), pTIP-CD95L 3’UTR shRNA pool (top right panel), pTIP-CD95 ORF-shRNA pool (bottom center panel), and pTIP-CD95 3’UTR shRNA pool (bottom right panel) with or without Dox treatment. Values were calculated from samples done in triplicate shown as mean ±SE. P-values were calculated using two-way ANOVA with a factor for Dox treatment and a factor for time. Similar data were obtained when either HCT116 or 293T cells were treated with each of the five shRNA pools (data not shown).
Figure 6—figure supplement 2
Fold change in shRNA representation after infection of NB7 cells and after treatment with Dox.
(A) Change in green fluorescence (top panels) and percent cell confluence (bottom panels) over time of NB7 cells expressing either Venus-CD95 (left panels) or Venus-CD95L (right panels). Cells were infected with the Tet-inducible pTIP-shR6 virus, selected for two days with puromycin and then subjected to an analysis in the IncuCyte Zoom. No Dox was added. Two other inducible constructs (pTIP-shL1 and pTIP-shL3) were tested in the same way and no evidence of leakiness was observed (data not shown), supporting the finding in the shRNA screen that certain shRNA constructs display leakiness while others do not. Values were calculated from samples done in triplicate shown as mean ±SE. (B) Scatterplot showing the fold down of shRNAs after infection of cells and culture for 9 days without Dox when compared to the composition of the shRNA plasmid library (X axis) and the fold down of shRNAs after culture with Dox for 9 days when compared to the culture without Dox (Y axis). The red dots are the shRNAs that were significantly downregulated at least five fold. The number of shRNAs labeled in red in each quartile is given in blue. Two of the shRNAs tested before are labeled in green.
Figure 7 with 1 supplement
In silico prediction of DISE activity tracks with experimental determined toxicity of shRNAs.
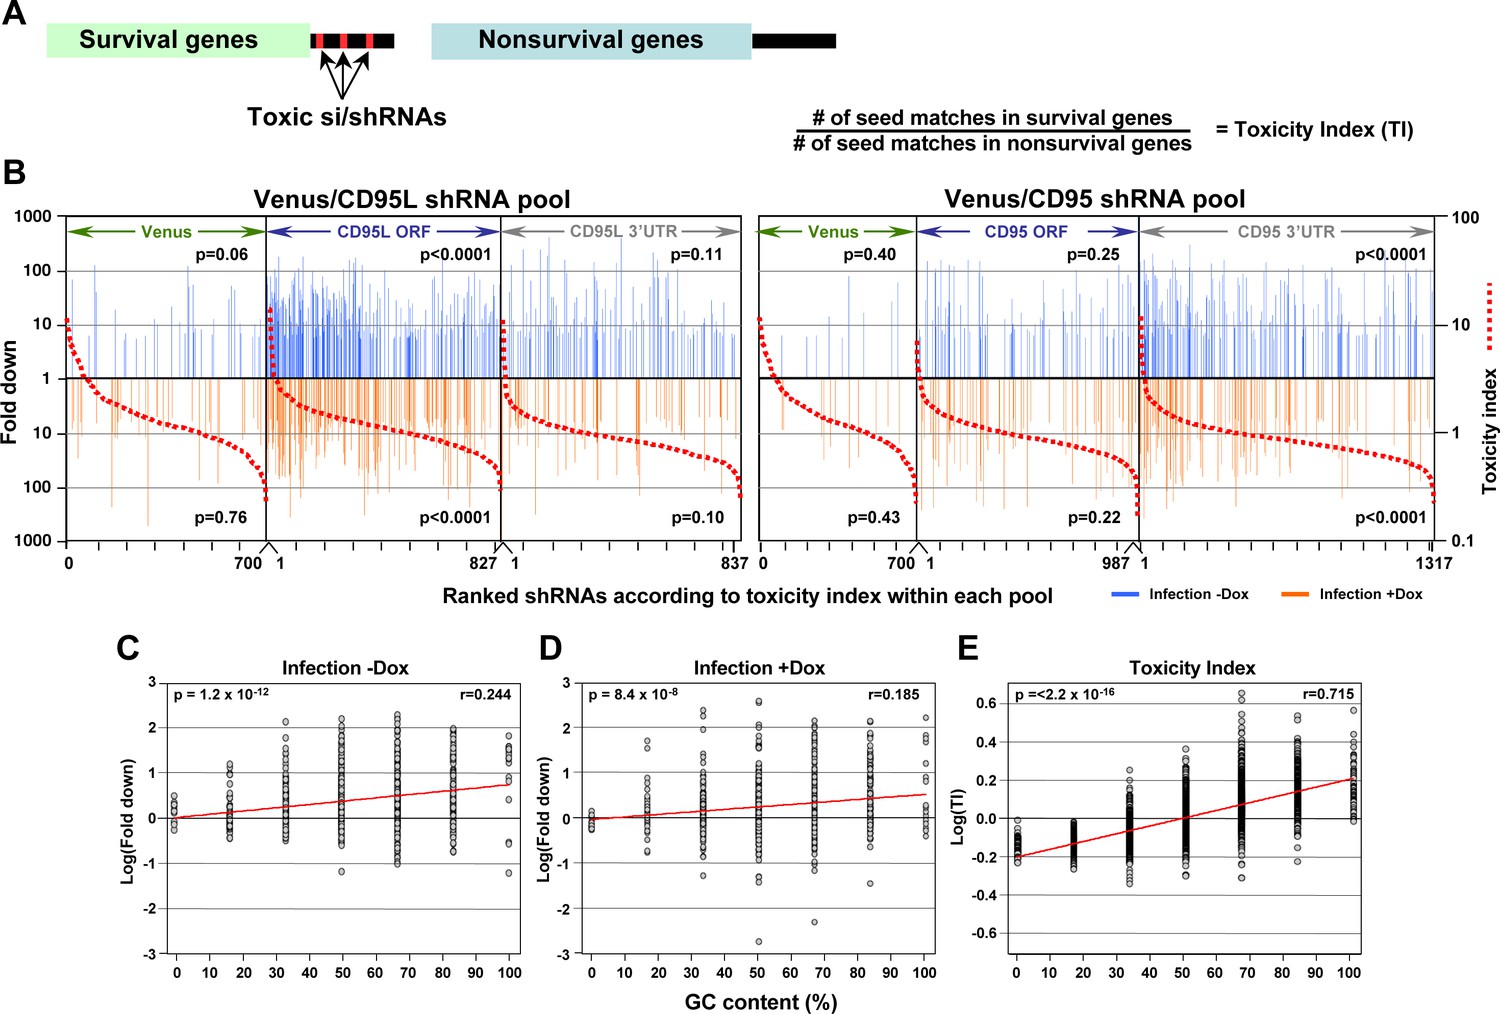
(A) Left: Schematic showing the preferential targeting of seed matches present in the 3'UTRs (red marks) of survival genes by toxic si/shRNAs. Right: The toxicity index (TI) is the normalized ratio of the number of 6mer or 8mer seed matches present in a list of survival genes versus a list of nonsurvival genes. (B) Fold downregulation versus ranked (8mer seed matched based) Toxicity Index for shRNAs of the Venus/CD95L pool (left three panels) and the Venus/CD95 pool (right three panels). Orange and blue tick marks indicate the same as in Figure 6D. To test if higher TI is enriched in shRNAs that were highly downregulated, p-values were calculated based on permutated datasets using Mann-Whitney U tests. The ranking of TI was randomly shuffled 10,000 times and the W statistic from our dataset was compared to the distribution of the W statistic of the permutated datasets. (C, D) Plot of fold downregulation of toxic shRNAs derived from CD95L ORF of the toxicity screens -Dox (left) or +Dox (center) versus GC content the 6mer seed in each shRNA. (E) Plot of the log(TI) of all 4092 possible 6mers versus GC content of the seeds. Pearson correlation coefficient and significance (p values) are given.
Figure 7—figure supplement 1
DISE does not just target all highly expressed genes.
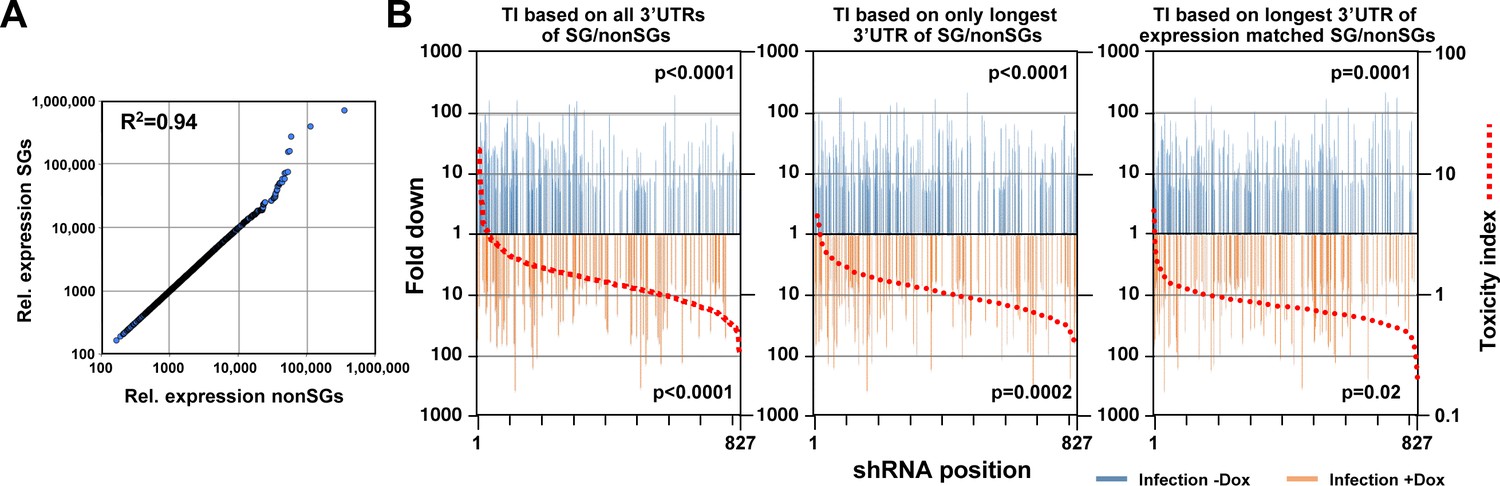
(A) Correlation between 850 survival genes (genes identified as critical survival genes in two genome-wide lethality screens (Blomen et al., 2015; Wang et al., 2015) and expressed at least at 100 reads in all of the 16 control RNA Seq samples in this study) and 850 expression matched nonsurvival genes (genes not identified as critical survival genes in two genome-wide lethality screens (Blomen et al., 2015; Wang et al., 2015) and expressed at least at 100 reads in all of the 16 control RNA Seq samples in this study). (B) Reanalysis of the CD95L ORF data in Figure 7B using two alternative ways to calculate the toxicity index (TI). Left: the analysis shown in Figure 7B with the data ranked using the original TI (using all known 3'UTRs for each gene group). Center: analysis with the data ranked using the original TI but based on only the longest 3'UTR for each gene. Right: analysis with the data ranked using the new TI based on expression matched SGs and nonSGs identified in A and using the longest 3'UTR for each gene. To test if higher TI is enriched in shRNAs that were highly downregulated, p-values were calculated based on permutated datasets using Mann-Whitney U tests.
Tables
Key resource table
| Reagent type (species) or resource | Designation | Source or reference | Identifiers | Additional information |
|---|---|---|---|---|
| Gene (Homo sapiens) | CD95L | NA | NM_000639 | |
| Gene (H. sapiens) | CD95 | NA | NM_000043 | |
| Cell line (H. sapiens) | NB7 | PMID: 10802708 | BRENDA Tissue and Enzyme Source Ontology: BTO_0003439; RRID:CVCL_8824 | Human neuroblastoma derived from autonomic ganglia; carries a deletion in both alleles of CASP8 |
| Cell line (H. sapiens) | HeyA8 | PMID: 4016745; PMID: 25984343 | RRID: CVCL_8878; RRID:CVCL_8878 | Human high grade ovarian serous adenocarcinoma; derived from parent Hey cells (RRID: CVCL_0297) |
| Cell line (H. sapiens) | HeyA8 ΔshL3 | this paper | NA | Pool of three HeyA8 cell clones with homozygous 41 nucleotide deletion of the shL3 target site (chr1:172,665,726–172,655,766; Human Dec. 2013 GRCh38/hg38 assembly) produced using CRISPR/Cas9 technology. |
| Cell line (H. sapiens) | HeyA8 ΔsiL3 | this paper | NA | Pool of three HeyA8 cell clones with homozygous 64 nucleotide deletion of the siL3 target site (chr1:172,669,178–172,659,241; Human Dec. 2013 GRCh38/hg38 assembly) produced using CRISPR/Cas9 technology. |
| Cell line (H. sapiens) | HeyA8 ΔshR6; shR6 k.o. clone #11 | this paper | NA | HeyA8 cell clone #11 with homozygous 227 nucleotide deletion of the shR6 target site (chr10:89,008,920–89,009,146; Human Dec. 2013 GRCh38/hg38 assembly) produced using CRISPR/Cas9 technology; verified homozygous CD95 protein knockout |
| Cell line (H. sapiens) | HeyA8 shR6 k.o. clone #1 | this paper | NA | HeyA8 cell clone #1 with a small deletion and the 227 nucleotide deletion of the shR6 target site and an insertion of the pMJ920 plasmid fragment in CD95 produced using CRISPR/Cas9 technology; verified homozygous CD95 protein knockout |
| Cell line (H. sapiens) | HeyA8 shR6 k.o. clone #2 | this paper | NA | HeyA8 cell clone #2 with a 227 nucleotide deletion of the shR6 target site (chr10:89,008,920–89,009,146; Human Dec. 2013 GRCh38/hg38 assembly) in one allele and an insertion of the pSCB plasmid fragment in the other in CD95 produced using CRISPR/Cas9 technology; verified homozygous CD695 protein knockout |
| Cell line (H. sapiens) | MCF-7 | ATCC | ATCC: HTB-22; RRID:CVCL_0031 | Human adenocarcinoma of the mammary gland, breast; derived from metastatic site: pleural effusion |
| Cell line (H. sapiens) | HCT116 | Korean Collection for Type Cultures (KCTC) | KCTC: cat#HC19023; ATCC: CCL_247; RRID:CVCL_0291 | Human colorectal carcinoma |
| Cell line (H. sapiens) | Drosha-/-; Drosha-/- clone #40 | Korean Collection for Type Cultures (KCTC); PMID: 26976605 | KCTC: cat#HC19020 | HCT116 clone #40 with homozygous protein knockout of Drosha; knockout achieved using CRISPR/Cas9 which resulted in a single nucleotide insertion in one allele and a 26 nuceotide deletion in the other |
| Cell line (H. sapiens) | Dicer-/-; Dicer-/- clone #43 | Korean Collection for Type Cultures (KCTC); PMID: 26976606 | KCTC: cat#HC19023 | HCT116 clone #43 with homozygous protein knockout of Dicer; knockout achieved using CRISPR/Cas9 which resulted in a three nucleotide insertion and 14 nucleotide deltion in one allele and a 35 nuceotide deletion in the other |
| Cell line (H. sapiens) | Dicer-/-; Dicer-/- clone #45 | Korean Collection for Type Cultures (KCTC); PMID: 26976607 | KCTC: cat#HC19024 | HCT116 clone #45 with homozygous protein knockout of Dicer; knockout achieved using CRISPR/Cas9 which resulted in a 53 nucleotide deltion in one allele and a 28 nuceotide deletion in the other |
| Cell line (H. sapiens) | 293T | ATCC | ATCC: CRL-3216; RRID:CVCL_0063 | Derived from HEK293 cells (ATCC: CRL-1573); express large T antigen; used for packaging viruses |
| Cell line (H. sapiens) | 293T ΔshL3 | this paper | NA | Pool of three 293T cell clones with homozygous 41 nucleotide deletion of the shL3 target site (chr1:172,665,726–172,655,766; Human Dec. 2013 GRCh38/hg38 assembly) produced using CRISPR/Cas9 technology. |
| Cell line (H. sapiens) | Phoenix-AMPHO | ATCC | ATCC: CRL-3213; RRID:CVCL_H716 | Second generation retrovirus producer cell line |
| Antibody | anti-β-actin antibody (mouse monoclonal) | Santa Cruz | Santa Cruz: cat#sc-47778; RRID:AB_626632 | 1:2000; for western blot; primary Ab |
| Antibody | anti-human CD95L (Mouse IgG1 monoclonal) | BD Biosciences | BD Biosciences: cat#556387; RRID:AB_396402 | 1:500; for western blot; primary Ab |
| Antibody | anti-human CD95 (rabbit polyclonal) | Santa Cruz | Santa Cruz: cat#sc-715; RRID:AB_2100386 | 1:1000; for western blot; primary Ab |
| Antibody | anti-human AGO2 (rabbit monoclonal) | Abcam | Abcam: cat#AB186733; RRID:AB_2713978 | 1:2000; for western blot; primary Ab |
| Antibody | anti-human Drosha (rabbit monoclonal) | Cell Signaling | Cell Signaling: cat#3364; RRID:AB_2238644 | 1:1000; for western blot; primary Ab |
| Antibody | anti-human Dicer (rabbit polyclonal) | Cell Signaling | Cell Signaling: cat#3363; RRID:AB_2093073 | 1:1000; for western blot; primary Ab |
| Antibody | Goat anti-rabbit, IgG-HRP | Southern Biotech | Southern Biotech: cat#SB-4030–05; RRID:AB_2687483 | 1:5000; for western blot; secondary Ab |
| Antibody | Goat anti-rabbit, IgG-HRP | Cell Signaling | Cell Signaling: cat#7074; RRID:AB_2099233 | 1:2000; for western blot; secondary Ab |
| Antibody | Goat anti-mouse; IgG1-HRP | Southern Biotech | Southern BioTech: cat#1070–05; RRID:AB_2650509 | 1:5000; for western blot; secondary Ab |
| Isotype control | FITC-mouse IgG1, κ isotype control | BD Biosciences | BD Biosciences: cat#551954; RRID:AB_394297 | 4 uL used for 1 × 10^6 cells; for flow cytometry |
| Antibody | FITC-mouse anti-Human CD95 | BD Biosciences | BD Biosciences: cat#556640; RRID:AB_396506 | 4 uL used for 1 × 10^6 cells; for flow cytometry |
| Recombinant protein reagent | sCD95L (S2) | PMID: 14504390 | NA | Soluble form of human CD95L (amino acids 137–281); recombinant protein |
| Recombinant protein reagent | LzCD95L | PMID: 14504390 | NA | Leucine zipper tagged CD95L; recombinant protein |
| Chemical compound | propidium iodide | Sigma-Aldrich | Sigma-Aldrich: cat#P4864 | Used for subG1 flow cytometry analysis |
| Chemical compound | puromycin | Sigma-Aldrich | Sigma-Aldrich: cat#P9620 | Used for selection of cells expressing puromycin resistance cassettes |
| Chemical compound | G418 | Affymetrix | Affymetrix: cat#11379 | Used for selection of cells expressing G418 resistance cassette |
| Recombinant DNA reagent | venus-CD95L sensor (plasmid) | this paper | NA | Modified CD510B-1 lentiviral vector (PMID: 25366259) was used as backbone; vector expresses a venus-human CD95L conjugate mRNA that can be used to monitor RNAi activity of si/shRNAs targeting CD95L using venus fluorescence. |
| Recombinant DNA reagent | venus-CD95 sensor (plasmid) | this paper | NA | Modified CD510B-1 lentiviral vector (PMID: 25366259) was used as backbone; vector expresses a venus-human CD95 conjugate mRNA that can be used to monitor RNAi activity of si/shRNAs targeting CD95 using venus fluorescence. |
| Recombinant DNA reagent | pLenti-GIII-CMV- RFP-2A-Puro vector; pLenti | ABM Inc | NA | pLenti control empty lentiviral vector; carries an RFP-2a-puromycin resistance cassette |
| Recombinant DNA reagent | pLNCX2 | Clontech | Clontech: cat#631503 | pLNCX2 control empty retroviral vector; carries a neomycin resistance cassette |
| Recombinant DNA reagent | pTIP | PMID: 24656822 | NA | Lentivirus used for doxycycline- induced expression of shRNAs; contains puromycin resistance cassette; modified from the original backbone which contained a GFP cassette instead of a puromycin cassette (PMID: 17311008); original backbone from the Rossi lab. |
| Recombinant DNA reagent | pLenti-CD95L-WT | this paper | NA | pLenti-GIII-CMV-RFP-2A-Puro vector that expresses human wild type CD95L cDNA (NM_000639.2); used to express wt human CD95L upon infection with lentiviral particles |
| Recombinant DNA reagent | pLenti-CD95L- L1MUT | this paper | NA | pLenti-GIII-CMV-RFP-2A-Puro vector that expresses human CD95L cDNA (NM_000639.2) with 8 silentmutations overlapping the shL1 target site (GCATCATCTTTGGAGAAGCAA - > GCCTCGTCCCTAGAAAAACAG); used to express shL1-resistant human CD95L upon infection with lentiviral particles |
| Recombinant DNA reagent | pLenti-CD95L- L3MUT | this paper | NA | pLenti-GIII-CMV-RFP-2A-Puro vector that expresses human CD95L cDNA (NM_000639.2) with 8 silent mutations overlapping the shL3 target site (ACTGGGCTGTACTTTGTATAT - > ACCGGATTATATTTCGTGTAC); used to express shL3-resistant human CD95L upon infection with lentiviral particles |
| Recombinant DNA reagent | pLNCX2-CD95-WT | this paper | NA | pLNCX2 vector that expresses human CD95 cDNA (BC012479.1); used to express wild type CD95 upon infection with lentiviral particles |
| Recombinant DNA reagent | pLNCX2-CD95-R6MUT | this paper | NA | pLNCX2 vector that expresses mutant human CD95 cDNA (BC012479.1) which contains 8 silent mutations overlapping the shR6 site (GTGTCGCTGTAAACCAAACTT - > ATGTCGCTGCAAGCCCAATTT); used to express shR6-resistant CD95 upon infection with lentiviral particles |
| Transfected construct | gRNA scaffold | PMID: 23287722 | IDT: synthesized as gene block | 455 nucleotide CRISPR/Cas9 gRNA scaffold synthesized as a gene block; contains promoter, gRNA scaffold, target sequence, and termination sequence; scaffold transcribes gRNAs that target Cas9 endonuclease to cut at target sites; target sequences consist of 19 nucleotides that are complementary to the target site of choice; co-transfected with Cas9 to catalyze cleavage. |
| Transfected construct | pMJ920 Cas9 plasmid | Addgene; PMID: 23386978 | Addgene: cat#42234 | Plasmid that expresses a human codon-optimized Cas9 tagged with GFP and HA; used to express Cas9 for CRISPR-mediated deletions. |
| Chemical compound | Lipofectamine 2000 | ThermoFisher Scientific | ThermoFisher Scientific: cat#11668019 | Transfection reagent |
| Chemical compound | Lipofectamine RNAiMAX | ThermoFisher Scientific | ThermoFisher Scientific: cat#13778150 | Transfection reagent; used for transfection of small RNAs such as siRNAs |
| Commercial assay or kit | StrataClone Blunt PCR Cloning Kit | Agilent Technologies | Agilent Technologies: cat#240207 | Used to blunt-end clone the gRNA scaffolds into the pSC-B plasmid |
| Commercial assay or kit | High-Capacity cDNA reverse transcription kit | Applied Biosystems | 4368814 | |
| Array cards preloaded with primers | 384-well TLDA cards | Applied Biosystems | 43422489 | |
| Commercial assay kit | Taqman Gene expression master mix | ThermoFisher Scientific | 4369016 | |
| Sequence-based reagent | shL3 flanking Fr primer | IDT | IDT: custom DNA oligo | Fr primer that flanks shL3 site; used to detect 41 nt shL3 deletion; 5’-TCTGGAATGGGAAGACACCT-3’ |
| Sequence-based reagent | shL3 flanking Rev primer | IDT | IDT: custom DNA oligo | Rev primer that flanks shL3 site; used to detect 41 nt shL3 deletion; 5’-CCTCCATCATCACCAGATCC-3’ |
| Sequence-based reagent | shL3 internal Rev primer | IDT | IDT: custom DNA oligo | Rev primer that overlaps with the shL3 site; used to detect 41 nt shL3 deletion; 5’-ATATACAAAGTACAGCCCAGT-3’ |
| Sequence-based reagent | shR6 flanking Fr primer | IDT | IDT: custom DNA oligo | Fr primer that flanks shR6 site; used to detect 227 nt shR6 deletion; 5’-GGTGTCATGCTGTGACTGTTG-3’ |
| Sequence-based reagent | shR6 flanking Rev primer | IDT | IDT: custom DNA oligo | Rev primer that flanks shR6 site; used to detect 227 nt shR6 deletion; 5’-TTTAGCTTAAGTGGCCAGCAA-3’ |
| Sequence-based reagent | shR6 internal Rev primer | IDT | IDT: custom DNA oligo | Rev primer that overlaps with the shR6 site; used to detect 227 nt shR6 deletion; 5’-AAGTTGGTTTACATCTGCAC-3’ |
| Sequence-based reagent | siL3 flanking Fr primer | IDT | IDT: custom DNA oligo | Fr primer that flanks siL3 site; used to detect 64 nt siL3 deletion; 5’-CTTGAGCAGTCAGCAACAGG-3’ |
| Sequence-based reagent | siL3 flanking Rev primer | IDT | IDT: custom DNA oligo | Rev primer that flanks siL3 site; used to detect 64 nt siL3 deletion; 5’-CAGAGGTTGGACAGGGAAGA-3’ |
| Sequence-based reagent | siL3 internal Rev primer | IDT | IDT: custom DNA oligo | Rev primer that is internal to the siL3 site; used to detect 64 nt siL3 deletion; 5’-ATATGGGTAATTGAAGGGCTG-3’. |
| Sequence-based reagent | siScr | IDT; Dharmacon | Dharmacon #D-001810-02-05 | sense: UGGUUUACAUGUUGUGUGA |
| Sequence-based reagent | siL1 | Dharmacon | L-011130-00-0005 | sense: UACCAGUGCUGAUCAUUUA |
| Sequence-based reagent | siL1 | IDT | customer synthesis | sense: UACCAGUGCUGAUCAUUUA |
| Sequence-based reagent | siL2 | IDT | customer synthesis | sense: CAACGUAUCUGAGCUCUCU |
| Sequence-based reagent | siL3 | IDT | customer synthesis | sense: GCCCUUCAAUUACCCAUAU |
| Sequence-based reagent | siL3MUT | IDT | IDT #51-01-14-03 | sense: GGACUUCAACUAGACAUCU |
| Sequence-based reagent | siL4 | IDT | customer synthesis | sense: GGAAAGUGGCCCAUUUAAC |
| Sequence-based reagent | shL3 => siL3 | IDT | customer synthesis | sense: GACUGGGCUGU ACUUUGUAdTdA antisense: UACAAAGUACA GCCCAGUUdTdT |
| Sequence-based reagent | shR6 => siR6 | IDT | customer synthesis | sense: GGGUGCAGAU GUAAACCAAAdCdT; antisense: UUUGGUUUACA UCUGCACUUdTdT |
| Sequence-based reagent | Dsi-13.2 | IDT | customer synthesis | sense: AUCUU ACCAGUGC UGAUCAUUUAdTdA |
| Sequence-based reagent | Dsi-13.3 | IDT | customer synthesis | sense: AAAGUAUACUU CCGGGGUCAAUCdTdT |
| Sequence-based reagent | Dsi-13.9 | IDT | customer synthesis | sense: CUUCCGGGG UCAAUCUUGCAACAdAdC |
| Sequence-based reagent | Dsi-13.x | IDT | customer synthesis | sense: CAGGACUGAGAAG AAGUAAAACCdGdT |
| Sequence-based reagent | DsiL3 | IDT | customer synthesis | sense: CAGCCCUUCAAU UACCCAUAUCCdCdC |
| Sequence-based reagent | siScr pool | Dharmacon | D-001810–10 | |
| Sequence-based reagent | smartpool siRNA targeting NUCKS1 | Dharmacon | L-014208–02 | |
| Sequence-based reagent | smartpool siRNA targeting CAPZA1 | Dharmacon | L-012212–00 | |
| Sequence-based reagent | smartpool siRNA targeting CCT3 | Dharmacon | L-018339–00 | |
| Sequence-based reagent | smartpool siRNA targeting FSTL1 | Dharmacon | L-013615–00 | |
| Sequence-based reagent | smartpool siRNA targeting FUBP1 | Dharmacon | L-011548–00 | |
| Sequence-based reagent | smartpool siRNA targeting GNB1 | Dharmacon | L-017242–00 | |
| Sequence-based reagent | smartpool siRNA targeting NAA50 | Dharmacon | L-014597–01 | |
| Sequence-based reagent | smartpool siRNA targeting PRELID3B | Dharmacon | L-020893–01 | |
| Sequence-based reagent | smartpool siRNA targeting SNRPE | Dharmacon | L-019719–02 | |
| Sequence-based reagent | smartpool siRNA targeting TFRC | Dharmacon | L-003941–00 | |
| Sequence-based reagent | smartpool siRNA targeting HIST1H1C | Dharmacon | L-006630–00 | |
| Sequence based reagent (human) | GAPDH primer | Thermofisher Scientific | Hs00266705_g1 | |
| Sequence based reagent (human) | CD95 primer | Thermofisher Scientific | custom probe | Fr primer: GGCTAACCCC ACTCTATGAATCAAT Rev primer: GGCCTGCCT GTTCAGTAACT Probe: CCTT TTGCTGAAATATC |
| Sequence based reagent (human) | CD95 primer (Figure 5—figure supplement 3) | Thermofisher Scientific | Hs00163653_m1 | |
| Sequence based reagent (human) | CD95L primers | Thermofisher Scientific | Hs00181226_g1; Hs00181225_m1 | |
| Sequence based reagent (human) | shL3 target site in CD95L | Thermofisher Scientific | custom probe | Fr primer: GGTGGCC TTGTGATCAATGAAA Rev primer: GCAAGA TTGACCCCGGAAGTATA Probe: CTG GGCTGTACTTTGTATATT |
| Sequence based reagent (human) | downstream of shL3 site | Thermofisher Scientific | custom probe | Fr primer: CCCC AGGATCTGGTGATGATG Rev primer: ACTG CCCCCAGGTAGCT Probe: CCCAC ATCTGCCCAGTAGT |
| Sequence based reagent (human) | GAPDH primer (TLDA card) | Thermofisher Scientific | Hs99999905_m1 | |
| Sequence based reagent (human) | ATP13A3 primer (TLDA card) | Thermofisher Scientific | Hs00225950_m1 | |
| Sequence based reagent (human) | CAPZA1 primer (TLDA card) | Thermofisher Scientific | Hs00855355_g1 | |
| Sequence based reagent (human) | CCT3 primer (TLDA card) | Thermofisher Scientific | Hs00195623_m1 | |
| Sequence based reagent (human) | FSTL1 primer (TLDA card) | Thermofisher Scientific | Hs00907496_m1 | |
| Sequence based reagent (human) | FUPB1 primer ( TLDA card) | Thermofisher Scientific | Hs00900762_m1 | |
| Sequence based reagent (human) | GNB1 primer (TLDA card) | Thermofisher Scientific | Hs00929799_m1 | |
| Sequence based reagent (human) | HIST1H1C primer (TLDA card) | Thermofisher Scientific | Hs00271185_s1 | |
| Sequence based reagent (human) | NAA50 primer (TLDA card) | Thermofisher Scientific | Hs00363889_m1 | |
| Sequence based reagent (human) | NUCKS1 primer (TLDA card) | Thermofisher Scientific | Hs01068059_g1 | |
| Sequence based reagent (human) | PRELID3B primer (TLDA card) | Thermofisher Scientific | Hs00429845_m1 | |
| Sequence based reagent (human) | SNRPE primer (TLDA card) | Thermofisher Scientific | Hs01635040_s1 | |
| Sequence based reagent (human) | TFRC primer (TLDA card) | Thermofisher Scientific | Hs00951083_m1 | |
| Software | Stata 14 | Stata | RRID:SCR_012763 | |
| Software | Rstudio (R3.3.1) | Rstudio | RRID:SCR_000432 | |
| sequence based reagent | shScr | Sigma | SHC002V | Non-targeting shRNA control transduction particles |
| sequence based reagent (human) | shL1 | Sigma | TRCN0000058998 | GCATCATCTTTGGAGAAGCAA |
| sequence based reagent (human) | shL2 | Sigma | TRCN0000058999 | CCCATTTAACAGGCAAGTCCA |
| sequence based reagent (human) | shL3 | Sigma | TRCN0000059000 | ACTGGGCTGTACTTTGTATAT |
| sequence based reagent (human) | shL4 | Sigma | TRCN0000059001 | GCAGTGTTCAATCTTACCAGT |
| sequence based reagent (human) | shL5 | Sigma | TRCN0000059002 | CTGTGTCTCCTTGTGATGTTT |
| sequence based reagent (human) | shL6 | Sigma | TRCN0000372231 | TGAGCTCTCTCTGGTCAATTT |
| sequence based reagent (human) | shL2' | Sigma | TRCN0000372232 | TAGCTCCTCAACTCACCTAAT |
| sequence based reagent (human) | shL5' | Sigma | TRCN0000372175 | GACTAGAGGCTTGCATAATAA |
| sequence based reagent (human) | shR2 | Sigma | TRCN0000218492 | CTATCATCCTCAAGGACATTA |
| sequence based reagent (human) | shR5 | Sigma | TRCN0000038695 | GTTGCTAGATTATCGTCCAAA |
| sequence based reagent (human) | shR6 | Sigma | TRCN0000038696 | GTGCAGATGTAAACCAAACTT |
| sequence based reagent (human) | shR7 | Sigma | TRCN0000038697 | CCTGAAACAGTGGCAATAAAT |
| sequence based reagent (human) | shR8 | Sigma | TRCN0000038698 | GCAAAGAGGAAGGATCCAGAT |
| sequence based reagent (human) | shR27' | Sigma | TRCN0000265627 | TTTTACTGGGTACATTTTATC |
| sequence based reagent (human) | shR7' | Sigma | TRCN0000255407 | TTAAATTATAATGTTTGACTA |
| sequence based reagent (human) | shR8' | Sigma | TRCN0000255408 | ATATCTTTGAAAGTTTGTATT |
| sequence based reagent (human) | shR6' | Sigma | TRCN0000255406 | CCCTTGTGTTTGGAATTATAA |
Additional files
-
Supplementary file 1
Results of the RNA-Seq analysis used to generate Figure 4B.
- https://doi.org/10.7554/eLife.29702.022
-
Supplementary file 2
Gene lists used in this work.
- https://doi.org/10.7554/eLife.29702.023
-
Supplementary file 3
shRNA screen data.
- https://doi.org/10.7554/eLife.29702.024
-
Supplementary file 4
The 6mer and 8mer toxicity index.
- https://doi.org/10.7554/eLife.29702.025
-
Supplementary file 5
Correlation between experimental shRNA toxicity and TI.
- https://doi.org/10.7554/eLife.29702.026
-
Transparent reporting form
- https://doi.org/10.7554/eLife.29702.027
Download links
A two-part list of links to download the article, or parts of the article, in various formats.
Downloads (link to download the article as PDF)
Open citations (links to open the citations from this article in various online reference manager services)
Cite this article (links to download the citations from this article in formats compatible with various reference manager tools)
Many si/shRNAs can kill cancer cells by targeting multiple survival genes through an off-target mechanism
eLife 6:e29702.
https://doi.org/10.7554/eLife.29702


