cAMP signaling regulates DNA hydroxymethylation by augmenting the intracellular labile ferrous iron pool
- University of Miami Miller School of Medicine, United States
- University of California, San Francisco, United States
- University of California, Berkeley, United States
- Bascom Palmer Eye Institute, University of Miami Miller School of Medicine, United States
- Sylvester Comprehensive Cancer Center, University of Miami Miller School of Medicine, United States
Figures
Figure 1 with 4 supplements
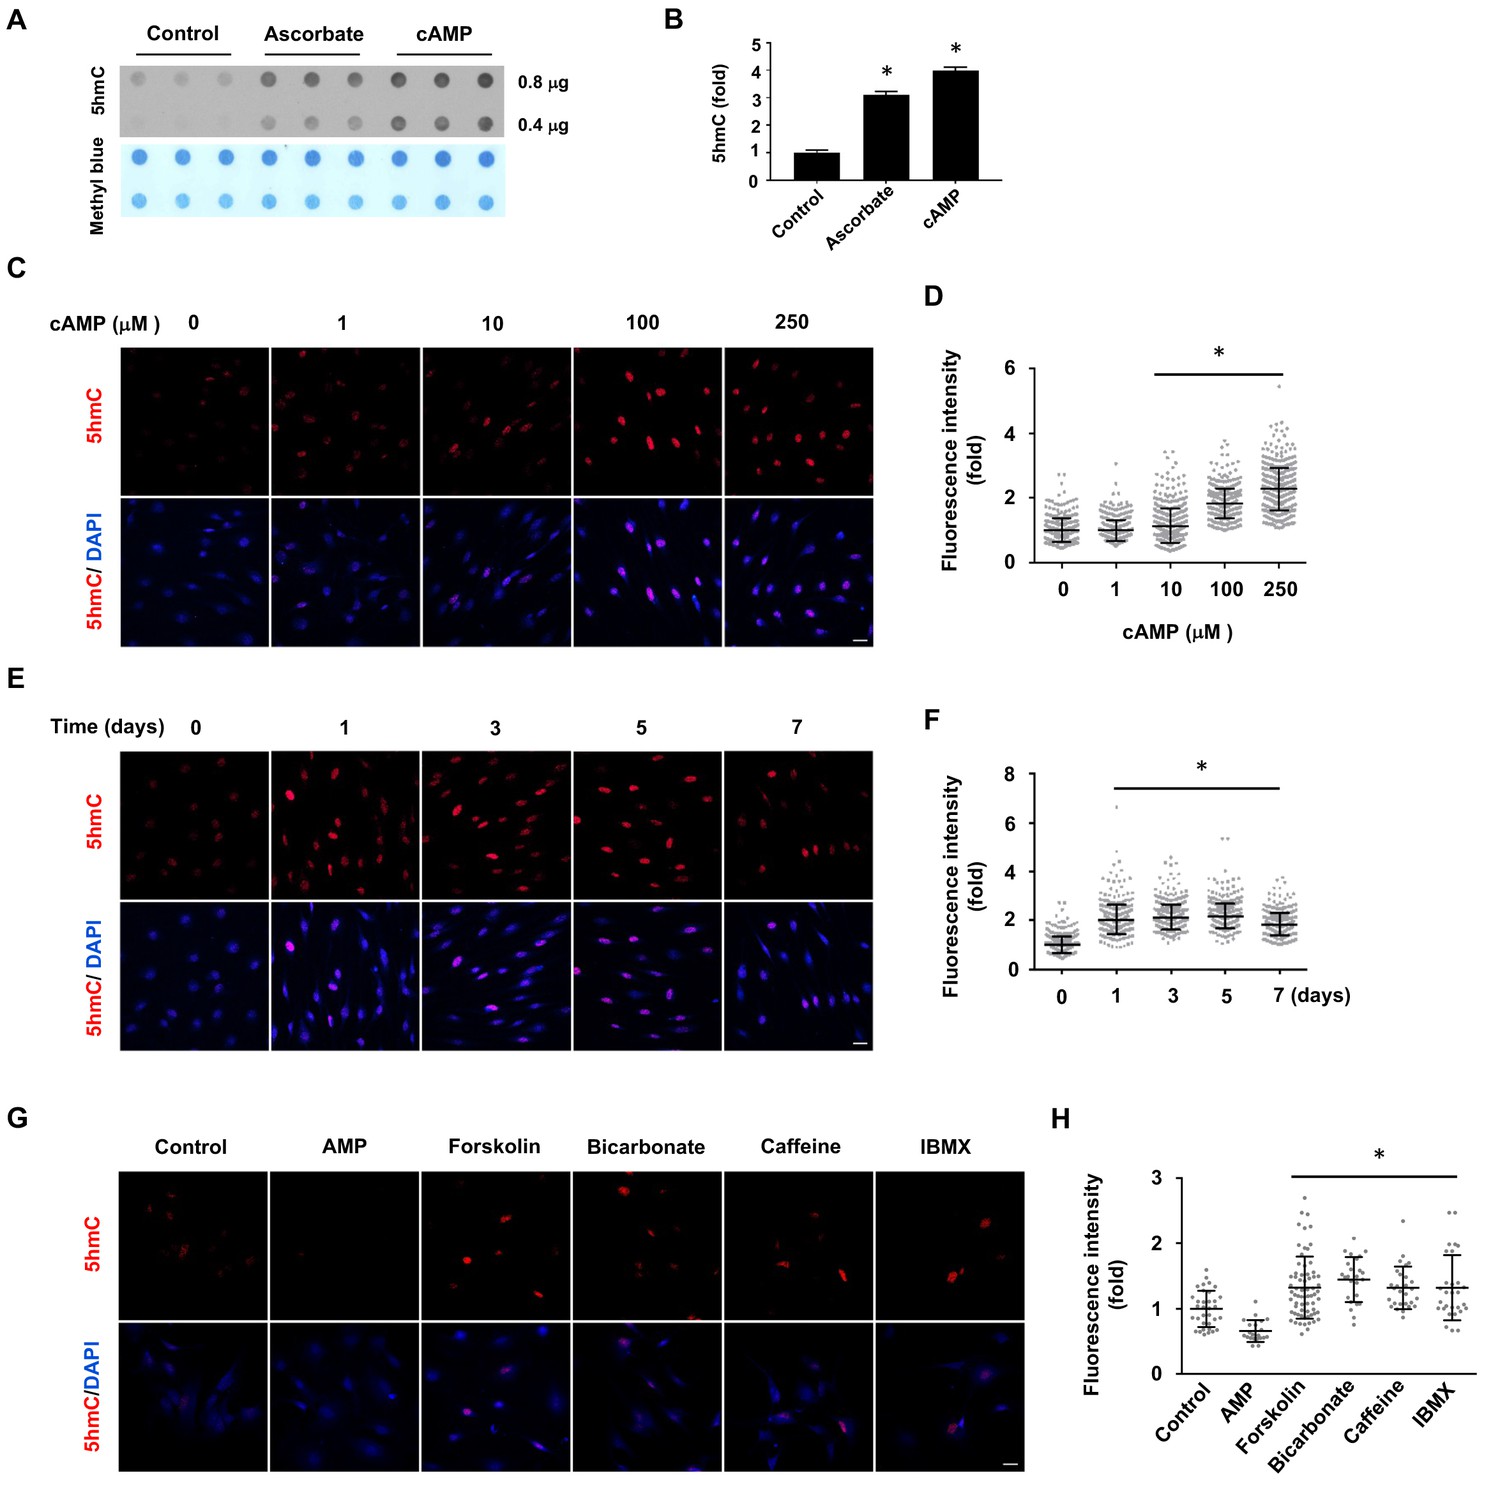
cAMP induces 5hmC in cells.
(A) Dot-blot shows that treatment with ascorbate (50 μM) for 3 days or cAMP (100 μM) for 7 days induced 5hmC in Schwann cells. (B) Semi-quantification of the dot-blot shows that both cAMP and ascorbate enhanced 5hmC generation in Schwann cells. (C) cAMP (10–250 μM) increased 5hmC in Schwann cells after 7 days treatment shown by IF. (D) IF quantification indicates the dose-dependent effect of cAMP on 5hmC in Schwann cells. (E) cAMP (100 μM) treatment for 1–7 days increased 5hmC in Schwann cells. (F) IF quantification shows that the effects of cAMP treatment from 1 to 7 days induces comparable effects on 5hmC in Schwann cells. (G) Endogenous cAMP promotes 5hmC in Schwann cells. AMP (100 μM) treatment for 2 days did not induce 5hmC while AC activators (forskolin (100 μM), bicarbonate (50 mM)), and PDE inhibitors (caffeine (100 μM), IBMX (100 μM)) enhanced 5hmC generation. (H) IF quantification indicates that forskolin, bicarbonate, caffeine and IBMX increase 5hmC in Schwann cells. *p<0.0005. Scale bar = 20 μm (n = 3 independent experiments with three biological replicates in each group, error bars denote standard deviation).
-
Figure 1—source data 1
Primers used for quantitative RT-PCR.
- https://doi.org/10.7554/eLife.29750.007
Figure 1—figure supplement 1
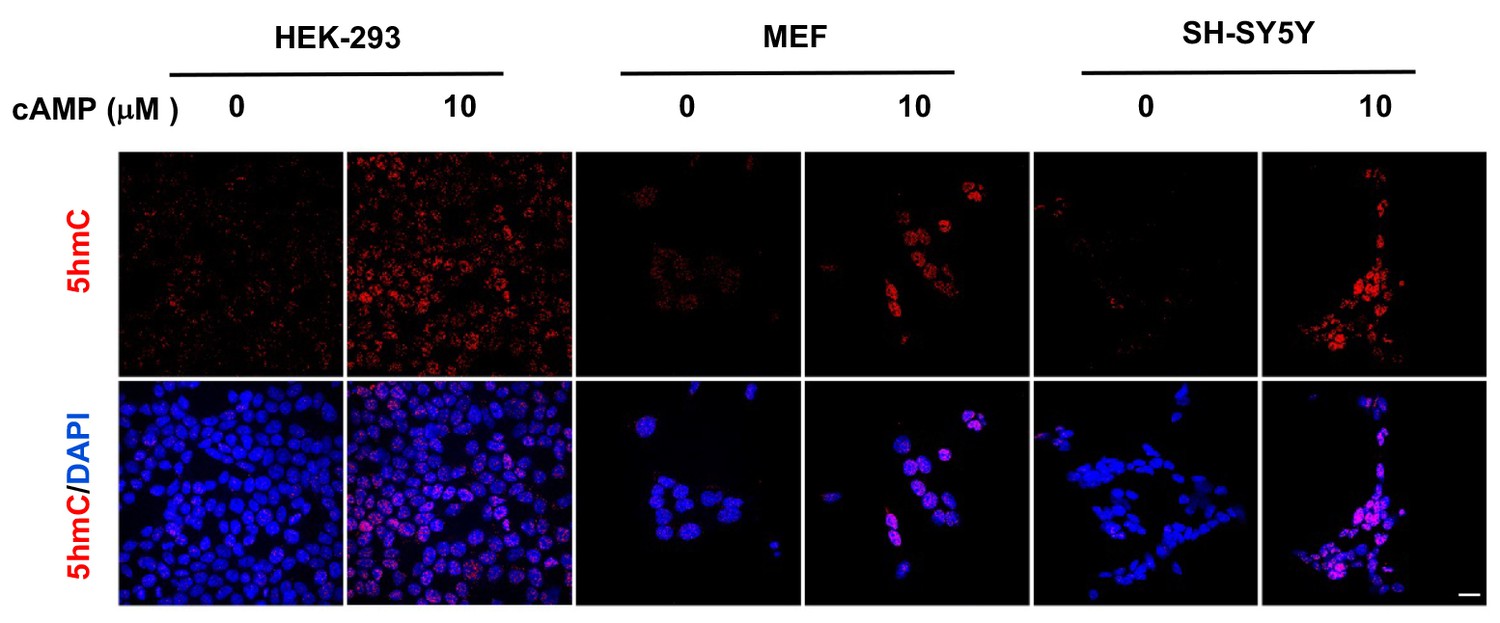
cAMP induces 5hmC in different cell types.
cAMP (10 μM) induced 5hmC in HEK-293 cells, MEF, and SH-SY5Y cells after treatment for 8 hr. Scale bar = 20 μm.
Figure 1—figure supplement 2
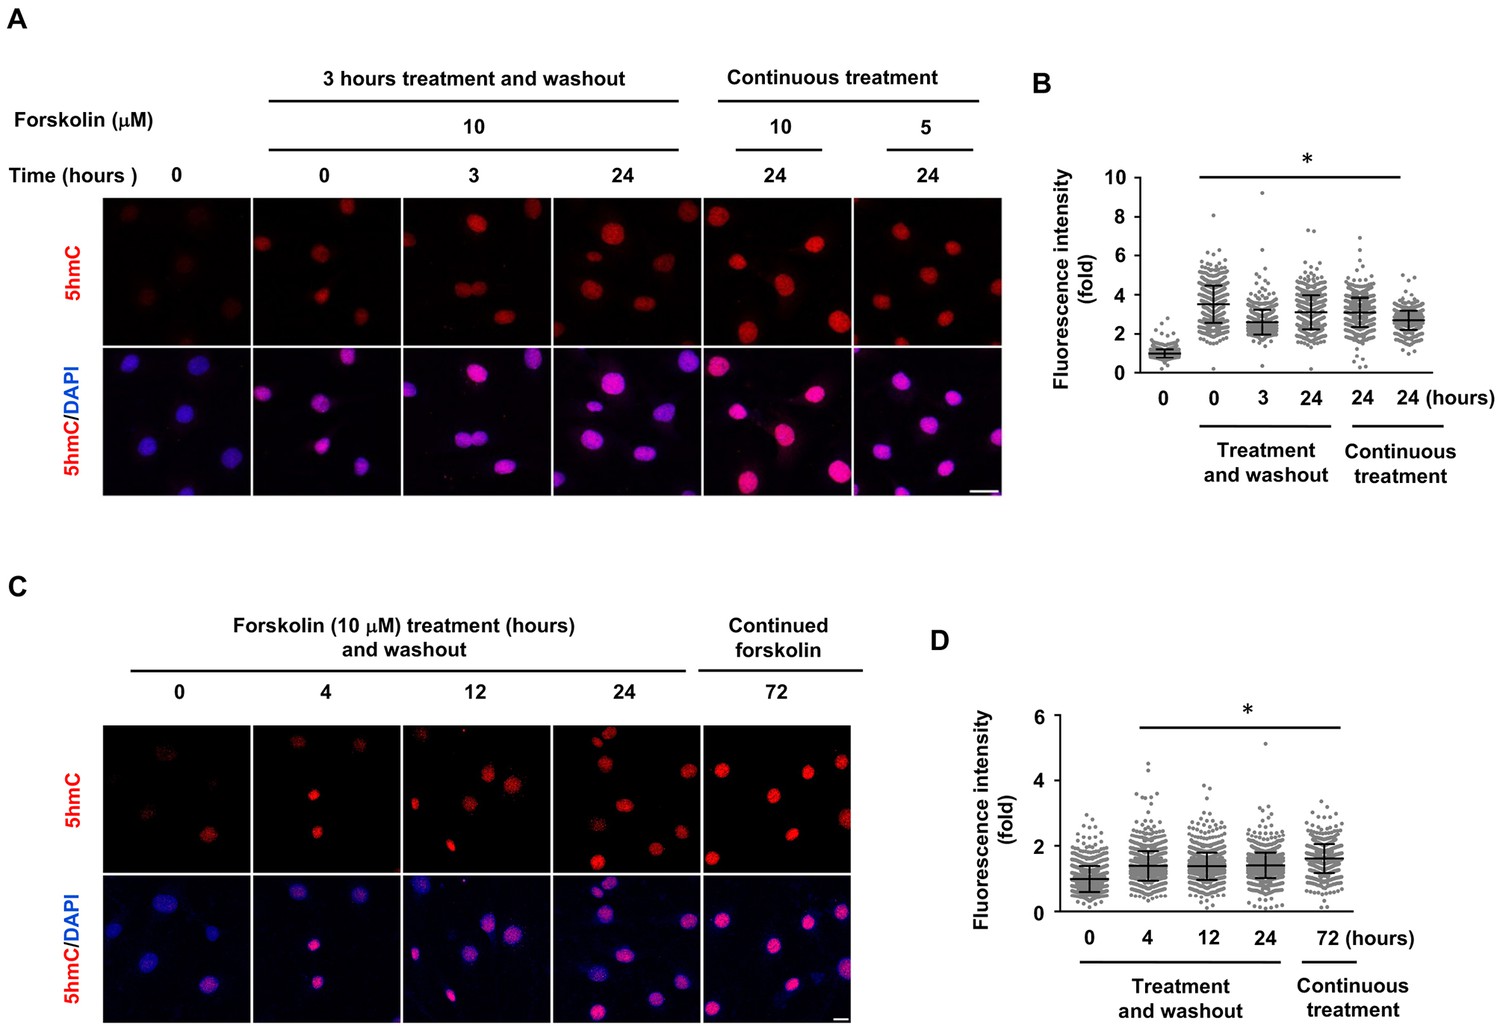
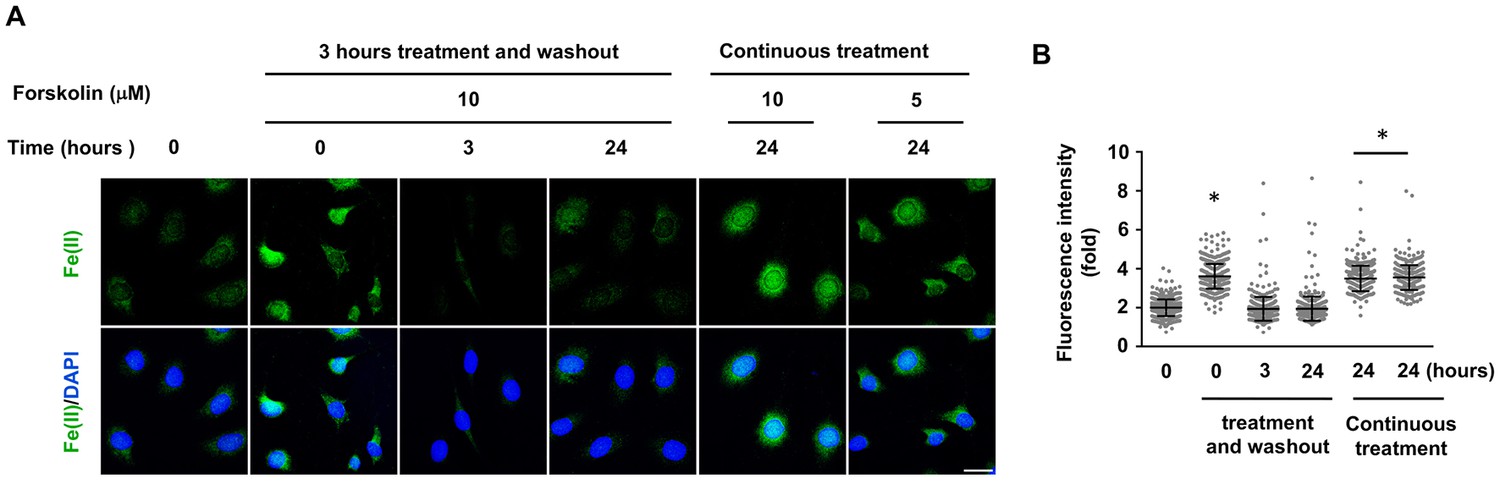
5hmC elevation by shorter treatment of forskolin in Schwann cells.
(A) Schwann cells were treated with forskolin (10 μM) for 3 hr followed by washout. 5hmC induction was detected at of 0, 3, and 24 hr time points following treatment. Cells continuously treated with forskolin (5, 10 μM) for 24 hr showed comparable 5hmC levels. Scale bar = 20 μm. (B) IF quantification indicate elevated 5hmC by forskolin treatments. (C) Schwann cells were treated with forskolin (10 μM) for 4, 12, or 24 hr followed by washout. 5hmC induction was then detected 72 hr following treatment. The elevated 5hmC was at similar levels in cells continuously treated with forskolin for 72 hr. Scale bar = 10 μm. (D) IF quantification indicate the elevated 5hmC by forskolin treatments. *p<0.0005. Scale bar = 20 μm (n = 2 independent experiments with three biological replicates in each group, error bars denote standard deviation).
Figure 1—figure supplement 3
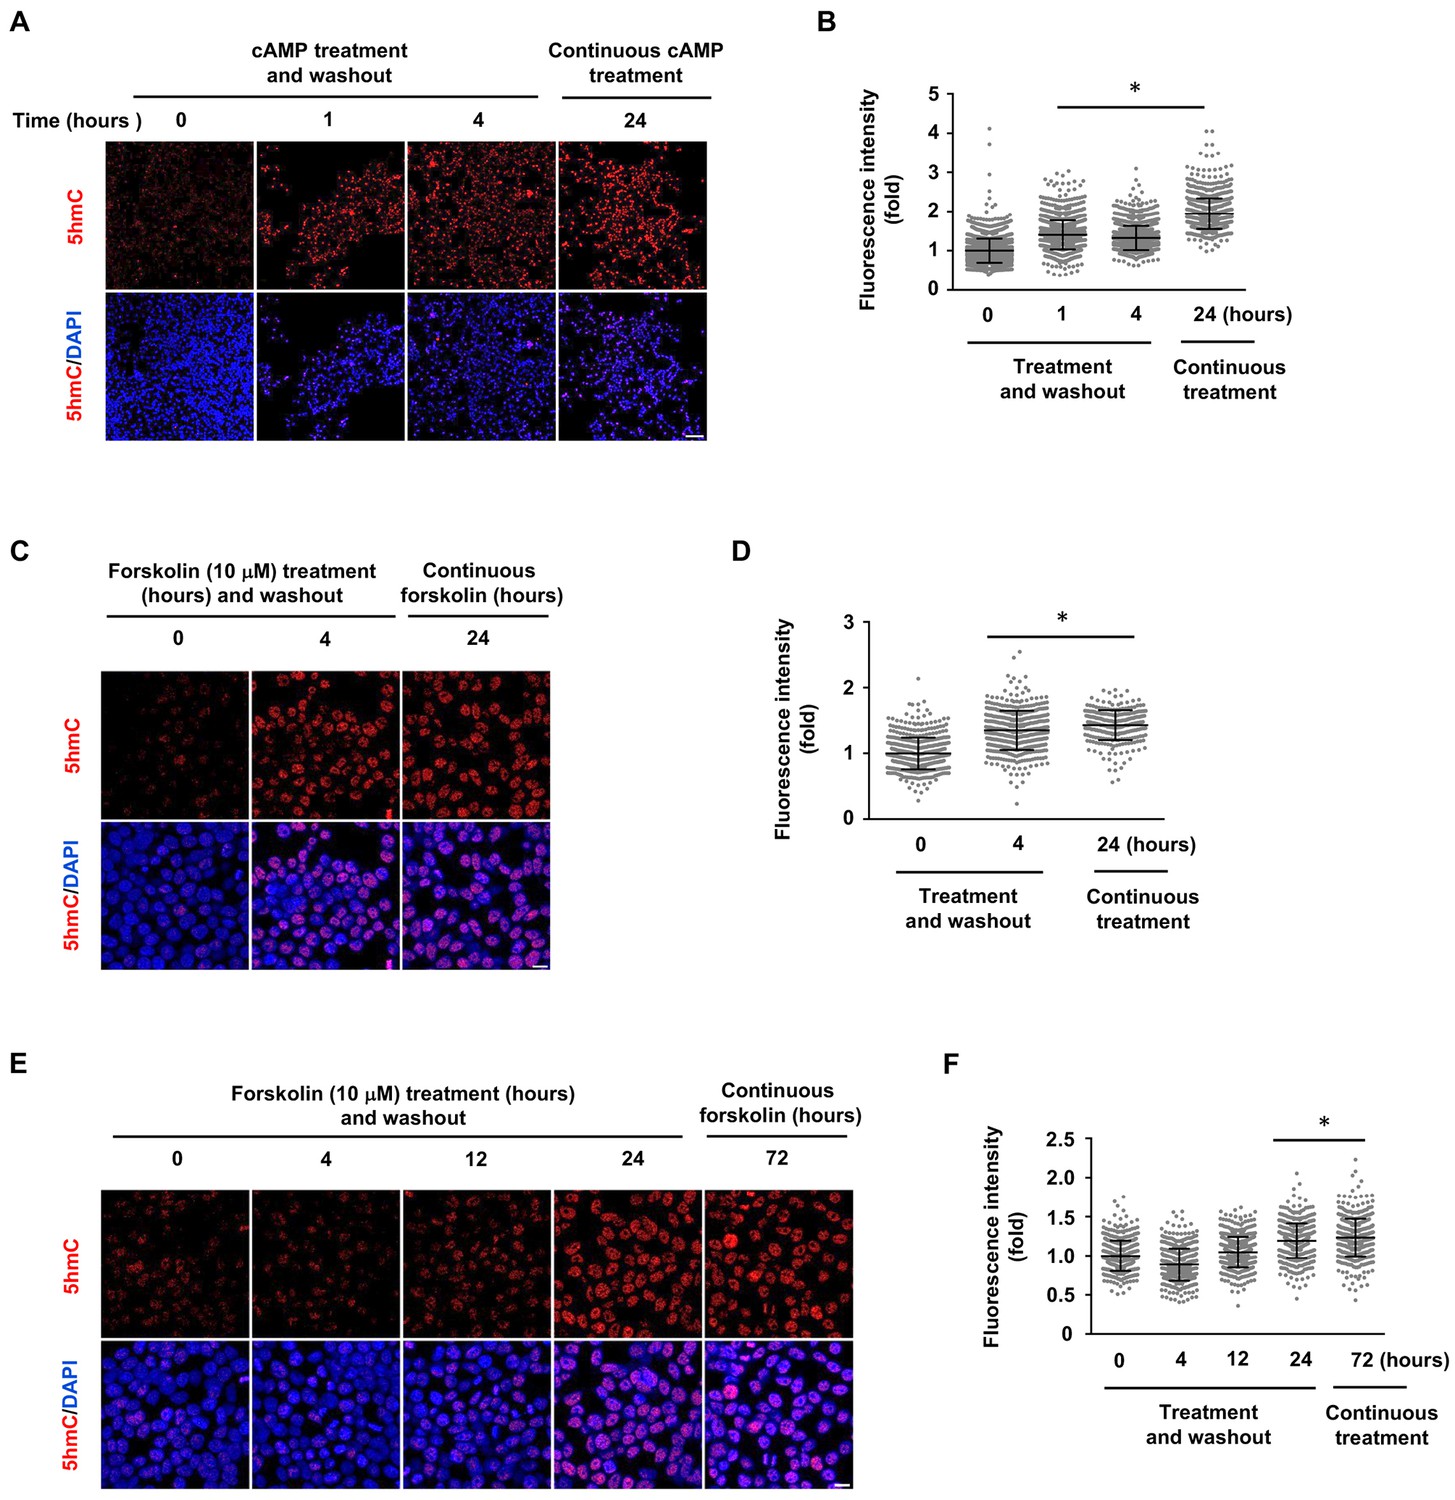
5hmC elevation by shorter treatment of cAMP and forskolin in HEK-293 cells.
(A) HEK-293 cells were treated with cAMP (10 μM) for 1 or 4 hr followed by washout. 5hmC was detected at the time point of 24 hr, which is at a level comparable to the continuous treatment (24 hr). Scale bar = 100 μm. (B) IF quantification shows the 5hmC elevation by cAMP. (C) HEK-293 cells were treated with forskolin (10 μM) for 4 hr followed by washout. 5hmC induction was detected at the 24 hr time point following treatment, which is comparable to the cells treated continuously with forskolin for 24 hr. Scale bar = 20 μm. (D) IF quantification indicate elevated 5hmC by forskolin treatments. (E) HEK-293 cells were treated with forskolin (10 μM) for 4, 12 or 24 hr followed by washout. 5hmC induction was then detected 72 hr following treatment. Levels of 5hmC in cells treated for 24 hr followed by washout were comparable to those treated continuously for 72 hr. However, there was no significant difference in 5hmC levels in the 4 or 12 hr treatment and washout groups compared to the controls. Scale bar = 20 μm. (F) IF quantification indicate the elevated 5hmC by forskolin treatments. *p<0.0005. (n = 2 independent experiments with three biological replicates in each group, error bars denote standard deviation).
Figure 1—figure supplement 4
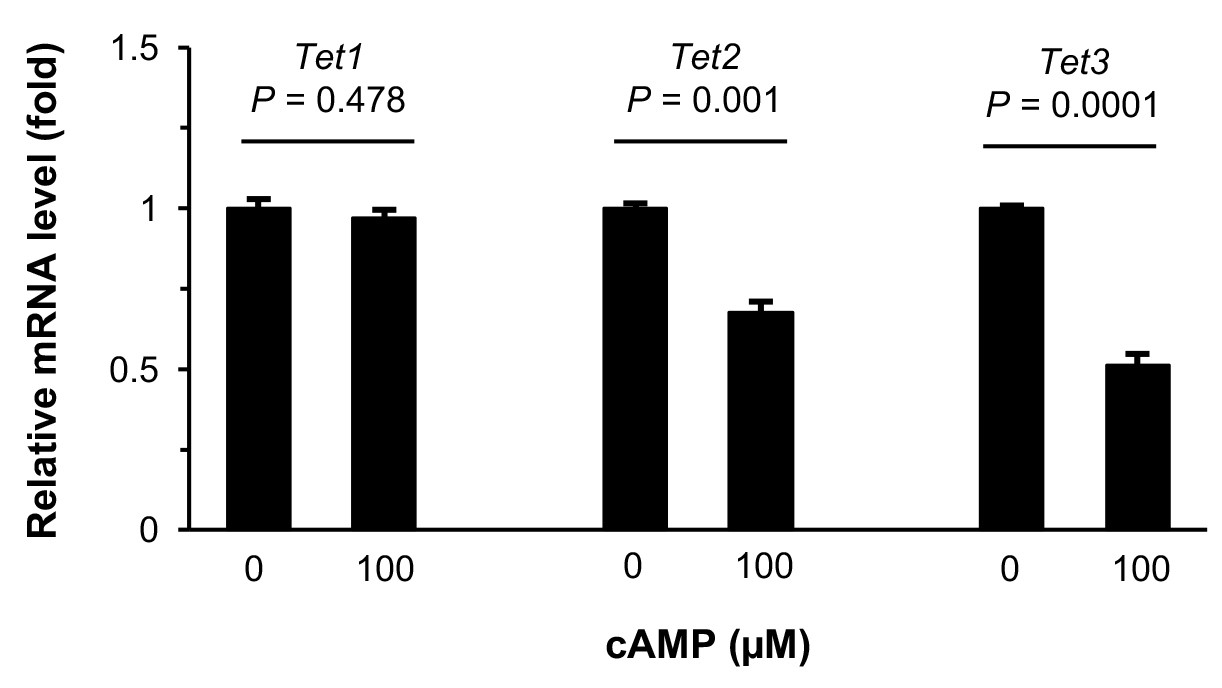
Treatment with cAMP does not increase Tet transcripts.
qRT-PCR shows that Tet1 mRNA remained at a similar level (p=0.478) after treatment of Schwann cells with cAMP (100 μM) for 1 day. In contrast, levels of Tet2 mRNA (p=0.001) and Tet3 mRNA (p=0.0001) were decreased after treatment of Schwann cells with cAMP (100 μM) for 1 day (n = 2 independent experiments with three biological replicates, error bars denote standard error).
Figure 2 with 3 supplements
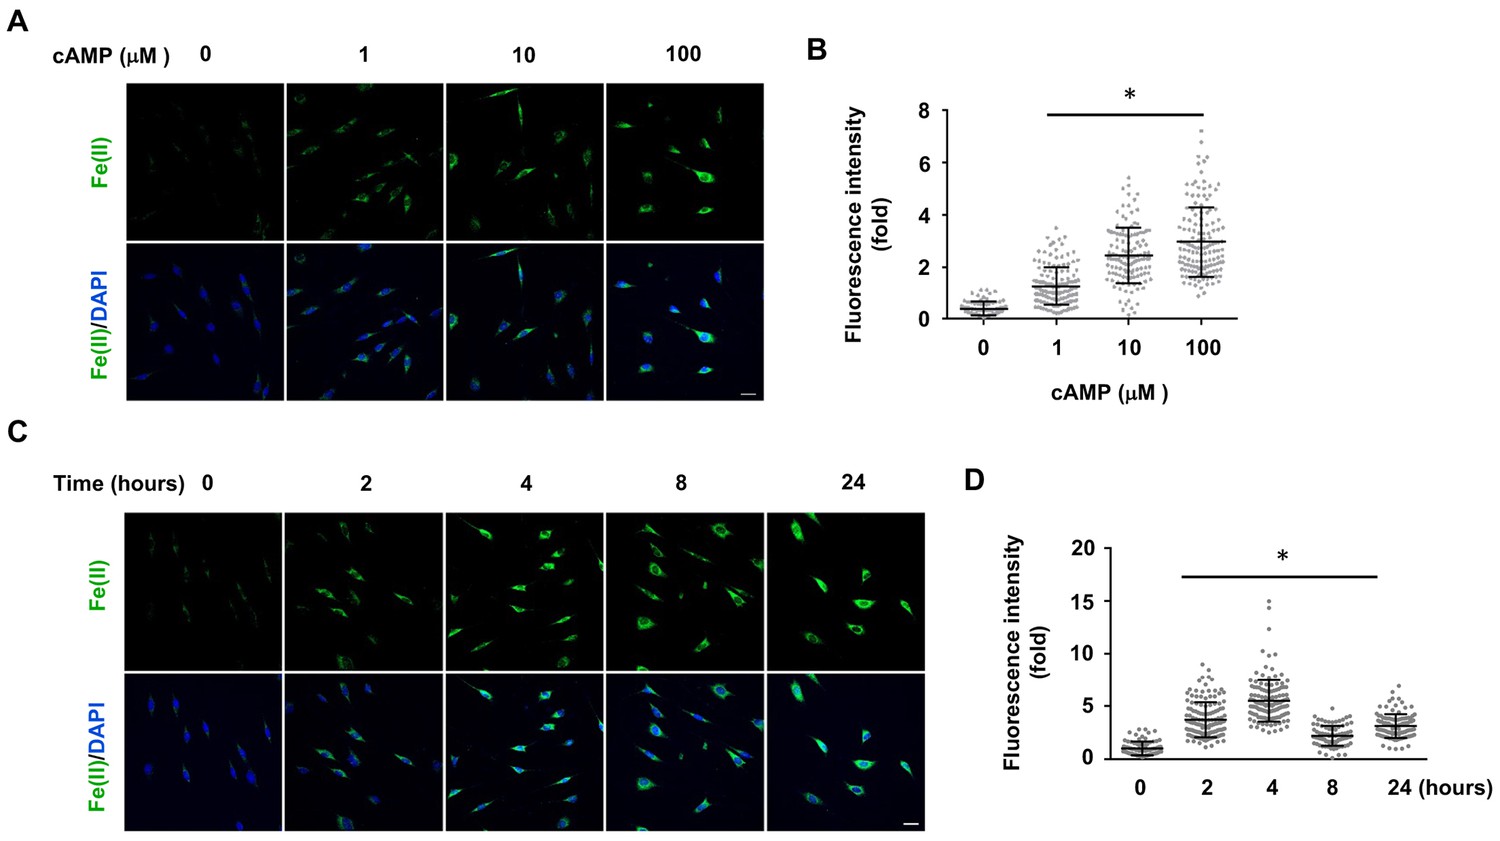
cAMP increases the intracellular labile Fe(II) pool in cells.
(A) cAMP (1–100 μM) treatment for 4 hr increased the intracellular labile Fe(II) pool detected by Trx-Puro ferrous iron probes. (B) IF quantification shows the dose-dependent effect of cAMP on labile Fe(II). (C) cAMP (100 μM) treatment for 2–24 hr increased labile Fe(II). (D) IF quantification shows the peak effect of cAMP on labile Fe(II) after treatment for 4 hr. Scale bar = 20 μm. *p<0.0005 (n = 3 independent experiments with three biological replicates in each group, error bars denote standard deviation).
Figure 2—figure supplement 1
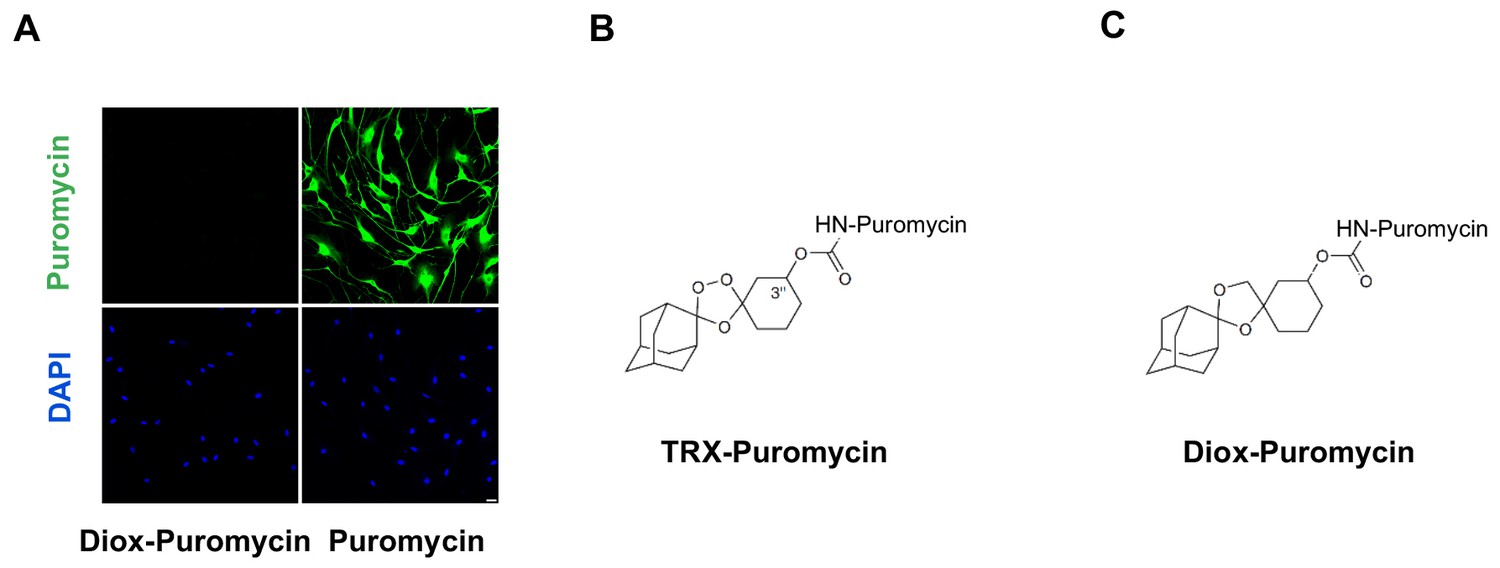
Negative control for puromycin incorporation with labile Fe(II) probe TRX-puro in Schwann cells.
(A) No immunofluorescence (IF) signal was observed after incubation with negative control dioxolane compound, Diox-Puromycin, (1 μM) for 2 hr, indicating no puromycin incorporation. Strong IF signal showed after incubating cells with unconjugated puromycin in rat Schwann cells. Scale bar = 20 μm. (B) The chemical structure of TRX-puromycin labile Fe(II) probe. (C) The chemical structure of nonperoxidic dioxolane compound, Diox-Puromycin. The α-amine of puromycin is carbamoylated in both compounds. Consequently, these two conjugated compounds cannot be incorporated into nascent polypeptides, unlike unconjugated puromycin. Labile Fe(II) can react with the 1,2,4-trioxolane ring of TRX-Puromycin causing release of the puromycin and its incorporation into nascent polypeptides, which can then be detected by anti-puromycin antibody. Labile Fe(II) does not react with the bioisosteric nonperoxidic dioxolane compound, Diox-Puromycin, which was used as negative control for all labile Fe(II) IF experiments (n = 6 independent experiments with three biological replicates).
Figure 2—figure supplement 2
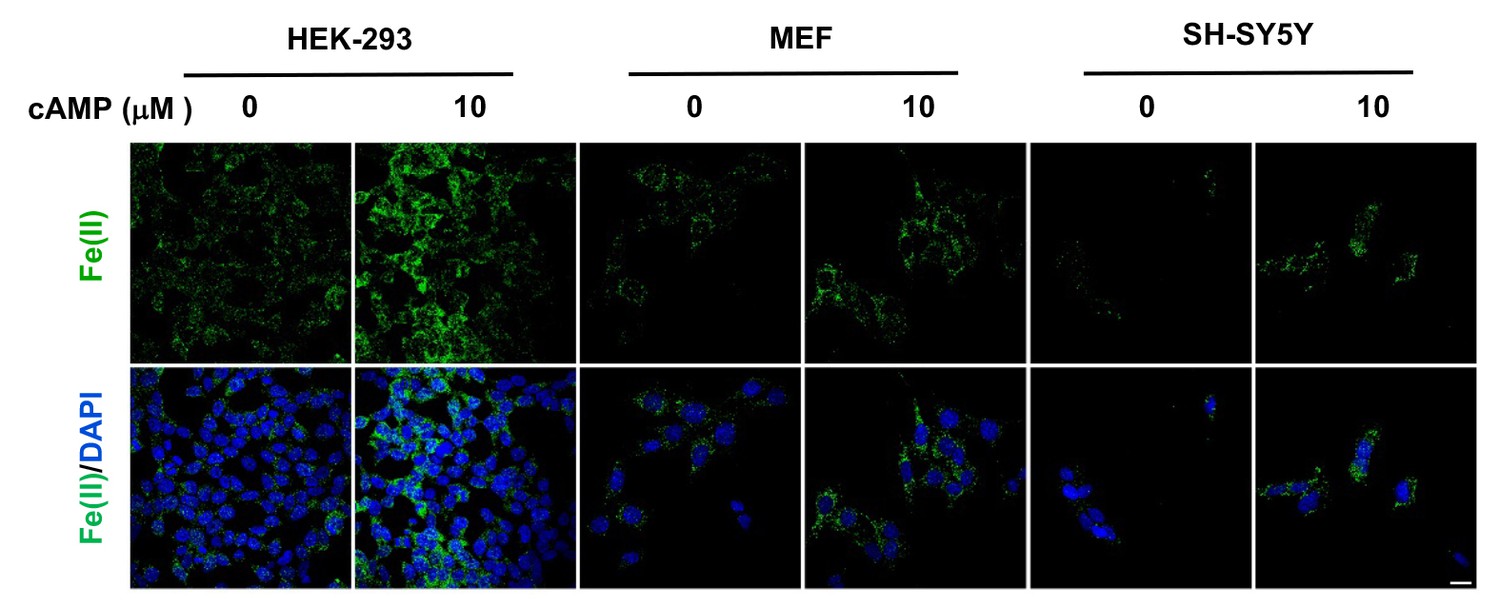
cAMP increases the intracellular labile Fe(II) pool in different cell types.
cAMP (10 μM) also enhanced the intracellular labile Fe(II) pool detected by Trx-Puro probes in HEK-293, MEF, and SH-SY5Y cells after treatment for 4 hr. Scale bar = 20 μm.
Figure 2—figure supplement 3
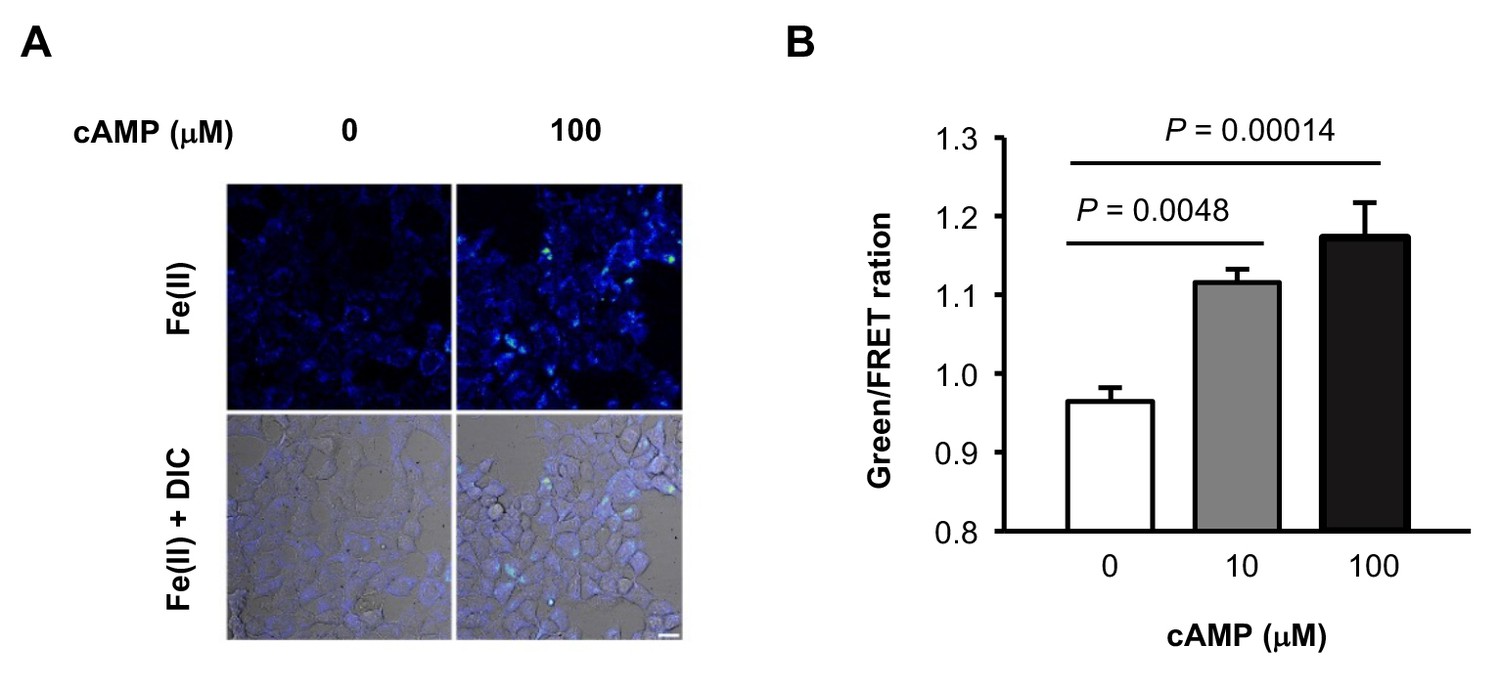
(A) Representative ratiometric confocal microscopy images of live HEK-293 cells loaded with FIP-1.
Scale bar = 20 μm. (B) Quantification of mean Green/FRET ratios, which represent the relative abundance of labile Fe(II) in the cell. Statistical significance was assessed by calculating p-values using one-way ANOVA with the Bonferroni correction.
Figure 3 with 3 supplements
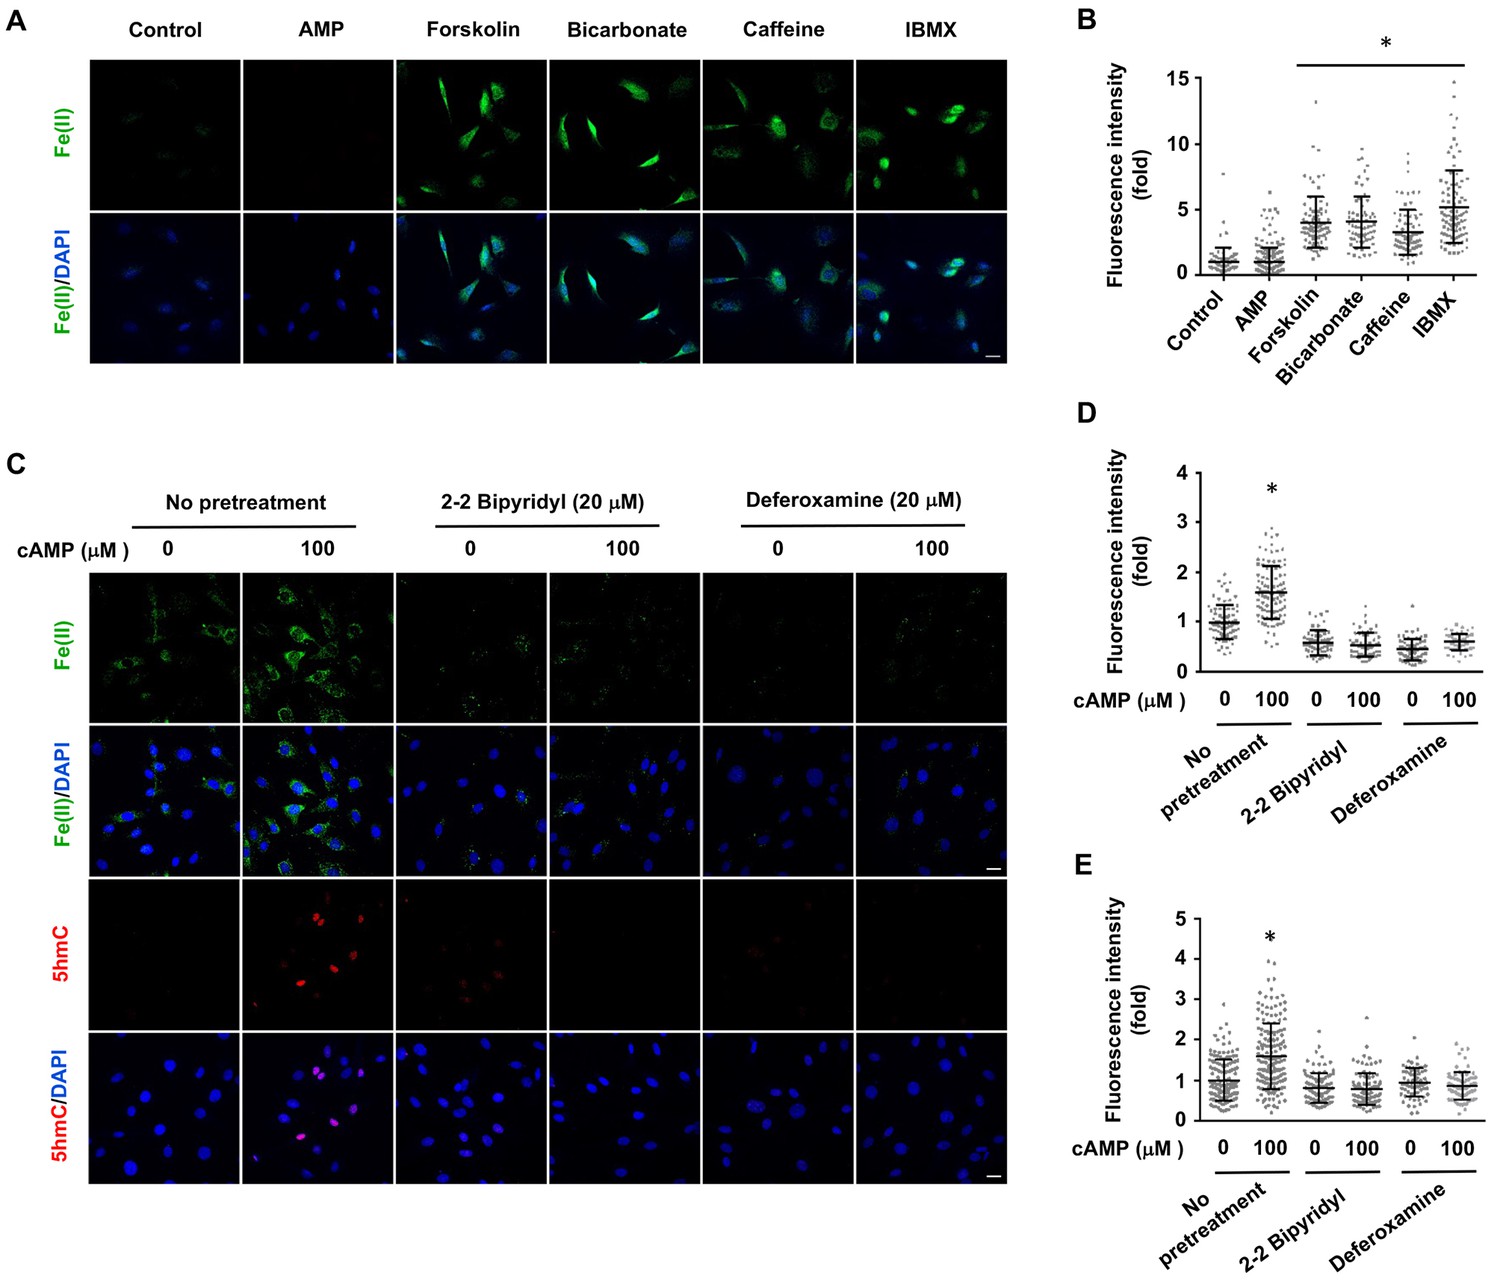
Induction of labile Fe(II) by endogenous cAMP and the dependency of 5hmC generation on labile Fe(II).
(A) AMP (100 μM) treatment for 4 hr did not induce labile Fe(II) while AC activators (forskolin (100 μM), bicarbonate (50 mM)) and PDE inhibitors (caffeine (100 μM), IBMX (100 μM)) increased labile Fe(II) detected by Trx-Puro probes. (B) IF quantification indicates the elevated labile Fe(II) by forskolin, bicarbonate, caffeine, and IBMX. (C) Pretreatment with iron chelators 2,2, bipyridyl (20 μM) and deferoxamine (20 μM) for 20 min blocked the elevation of labile Fe(II) and 5hmC in Schwann cells by cAMP (100 μM) treatment. (D) IF quantification indicates the inhibition of iron chelators on the induction of labile Fe(II) by cAMP. (E) IF quantification indicates the inhibition of iron chelators on the induction of 5hmC by cAMP. Scale bar = 20 μm. *p<0.0005 (n = 3 independent experiments with three biological replicates in each group).
Figure 3—figure supplement 1
Relatively transient increase intracellular labile Fe(II) by short forskolin treatments.
Schwann cells were treated with forskolin (10 μM) for 3 hr followed by washout and Fe(II) detection by Trx-Puro probe. Intracellular labile Fe(II) elevation was observed at time points of 0, 3, and 24 hr after treatment. Elevated labile Fe(II) was observed immediately after the treatment (0 hr) but not at 3 or 24 hr following treatment. Scale bar = 20 μm. (D) IF quantification indicates that forskolin increases Fe(II) only immediately following treatment. *p<0.0005 (n = 2 independent experiments with three biological replicates in each group).
Figure 3—figure supplement 2
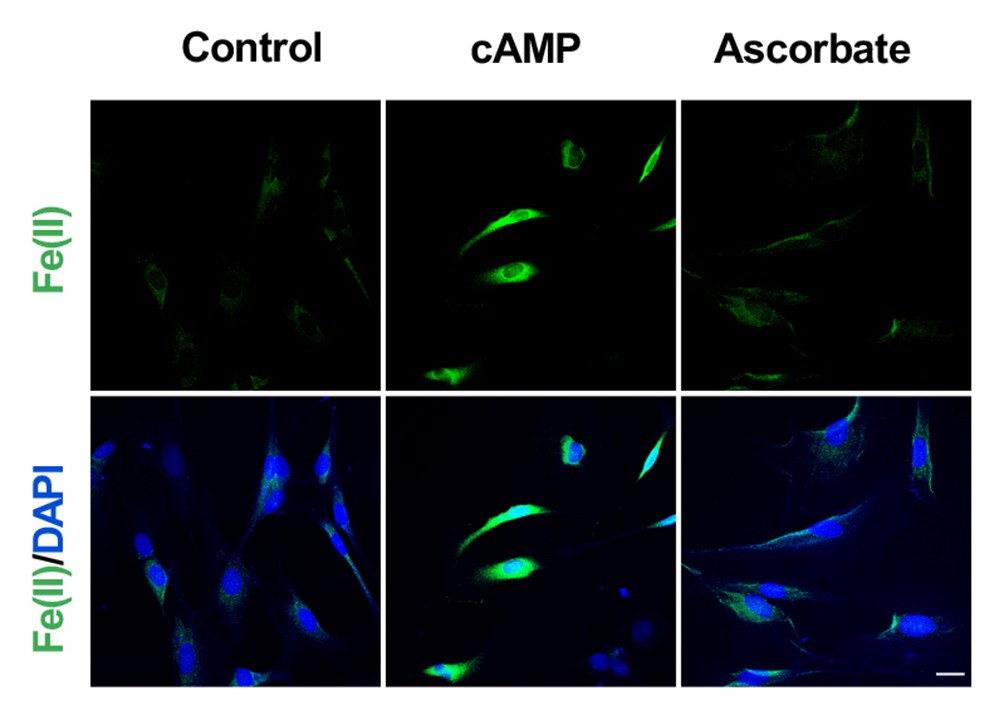
Ascorbate does not increase the intracellular labile Fe(II) pool in Schwann cells detected by Trx-Puro probes.
Treatment of Schwann cells with 50 μM sodium ascorbate for 4 hr caused no obvious change in labile Fe(II). In comparison, immunofluorescence shows an increase of labile Fe(II) in cells after treatment with cAMP (100 μM) for 4 hr. Scale bar = 20 μm (n = 2 independent experiments with three biological replicates each).
Figure 3—figure supplement 3
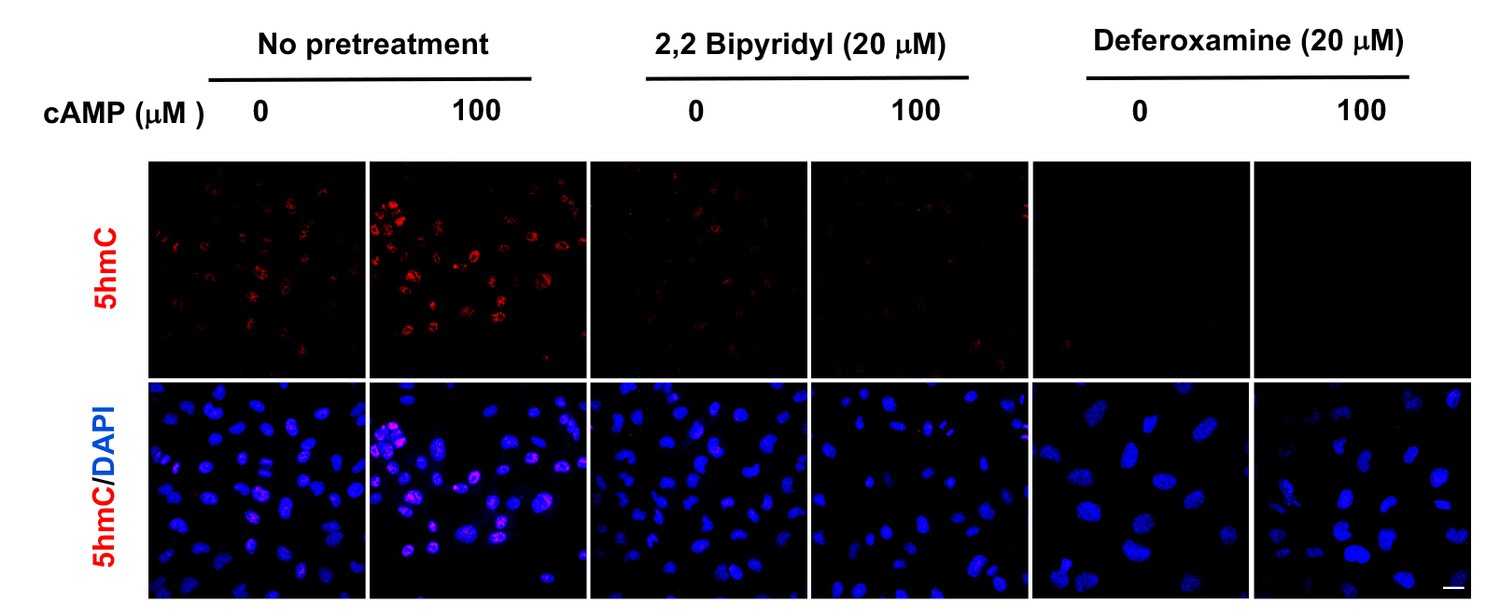
Pretreatment with iron chelators 2,2, bipyridyl (20 μM) and deferoxamine (20 μM) for 20 min blocked the upregulation of 5hmC by cAMP (100 μM) treatment in A2058 cells.
Scale bar = 20 μm (n = 2 independent experiments with three biological replicates each).
Figure 4 with 1 supplement

cAMP increases labile Fe(II) and 5hmC by enhancing the acidification of endosomes.
(A) cAMP (100 μM) treatment decreases the pH in intracellular vesicles. Red fluorescence increases when the pH decreases from 8 to 4. (B) V-ATPase inhibitor Bafilomycin A1 (200 nM) pretreatment for 30 min blocks the effect of cAMP on both labile Fe(II) detected by Trx-Puro probes and 5hmC in Schwann cells. (C) IF quantification indicates the inhibition of Bafilomycin A1 on labile Fe(II) elevation by cAMP. (D) IF quantification indicates the inhibition of Bafilomycin A1 on 5hmC induction by cAMP. Scale bar = 20 μm. p<0.0005 (n = 3 independent experiments with three biological replicates each).
Figure 4—figure supplement 1
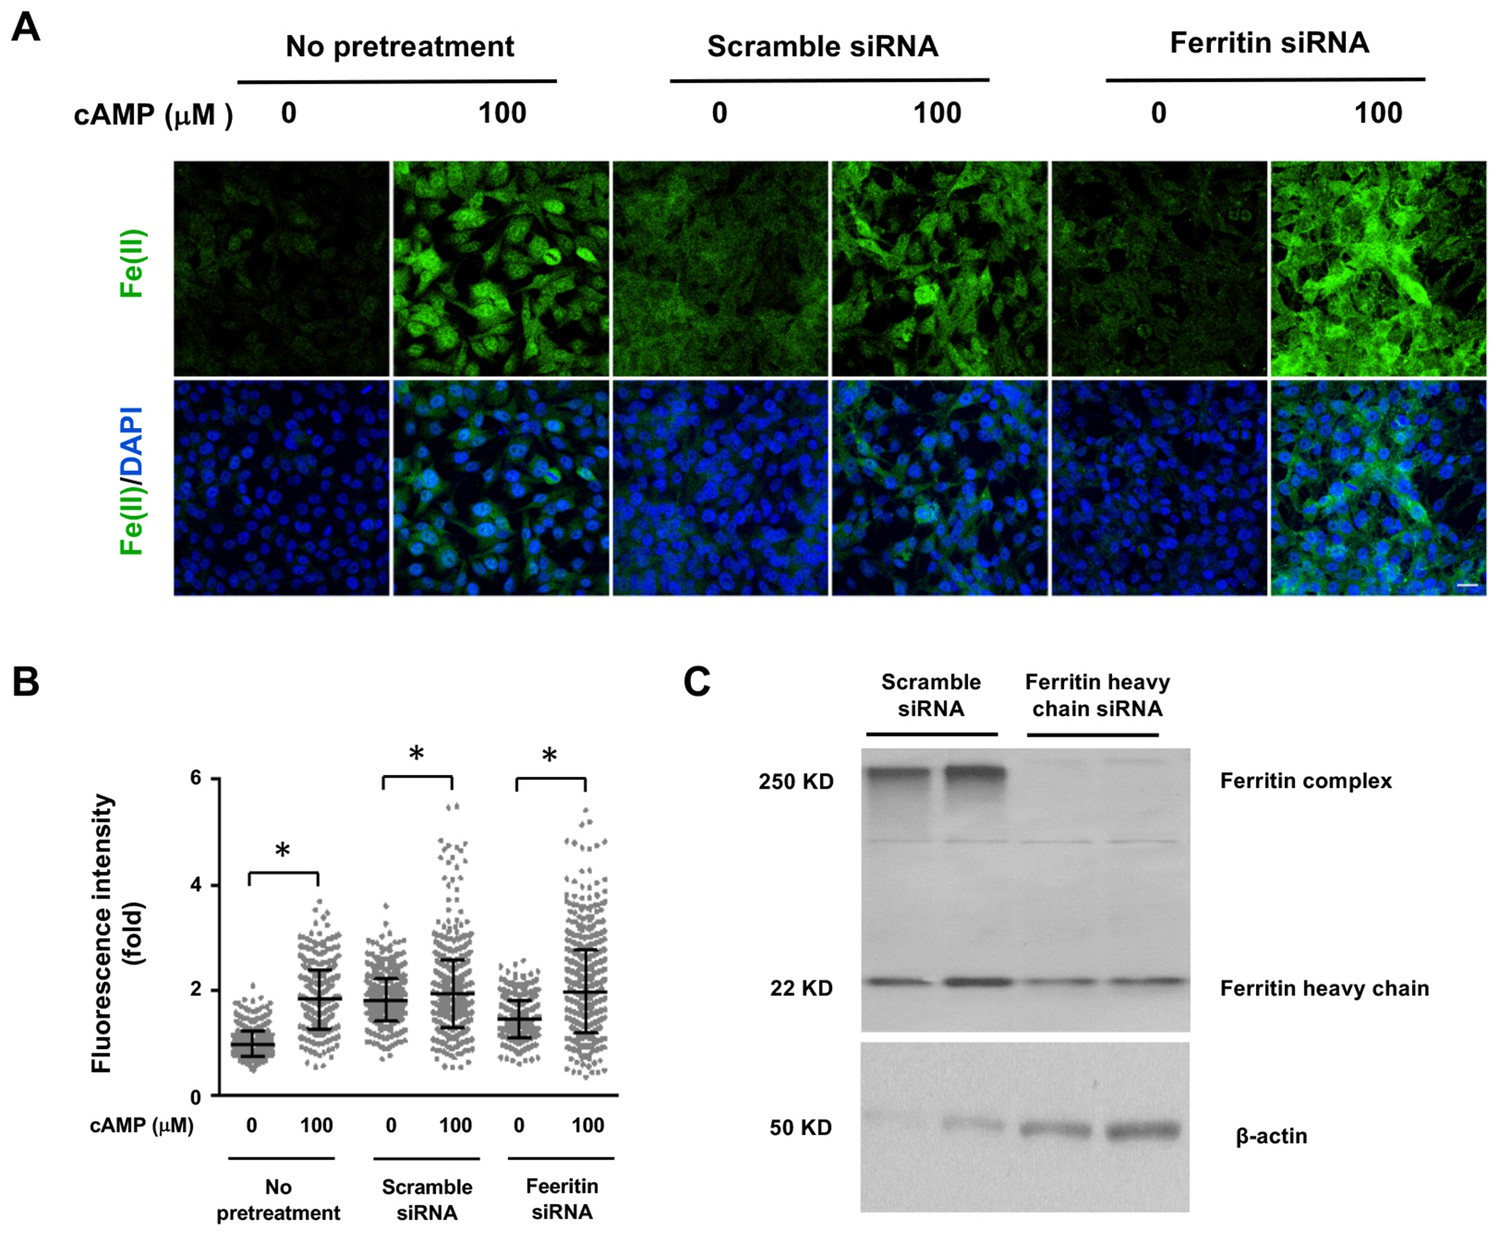
Decreasing the expression of Ferritin does not block the induction of labile Fe(II) by cAMP.
(A) cAMP (100 μM) treatment induces labile Fe(II) detected by Trx-Puro probes at a comparable level in Ferritin heavy chain knockdown cells compared to the cells treated with scramble siRNA or with no pretreatment. Scale bar = 20 μm. (B) IF quantification indicates the knocking down Ferritin does not abolish labile Fe(II) induced by cAMP. (C) Immunoblot of Ferritin shows that the level of Ferritin heavy chain and Ferritin complex are decreased by siRNA compared to cells transfected by scramble siRNA. p<0.0005 (n = 2 independent experiments with three biological replicates for IF and two biological replicates for immunoblot).
Figure 5 with 3 supplements

The regulation of labile Fe(II) by cAMP is likely mediated via RapGEF2.
(A) Pretreatment with PKA inhibitors (KT5720 (2 μM), H89 (20 μM)), Epac inhibitor ESI09 (10 μM) or CNGC blocker LCD (10 μM) for 20 min prior to cAMP addition showed no effect on labile Fe(II) induced by cAMP (100 μM) treatment in Schwann cells detected by Trx-Puro probes. (B) Knocking down the expression of RapGEF2 in HEK-293 cells largely blocked the acidification of vesicles and labile Fe(II) elevation after cAMP (100 μM) treatment compared to the scramble siRNA group. (C) IF quantification indicates that knocking down RapGEF2 inhibits but does not completely abolish vesicle acidification induced by cAMP. (D) IF quantification indicates that knocking down RapGEF2 inhibits but does not completely abolish labile Fe(II) induced by cAMP. Scale bar = 20 μm. p<0.0005 (n = 3 independent experiments with three biological replicates in each group).
-
Figure 5—source data 1
Fragments per kilobase per million (FPKM) of CNG and Rapgef genes in Schwann cells.
- https://doi.org/10.7554/eLife.29750.022
Figure 5—figure supplement 1
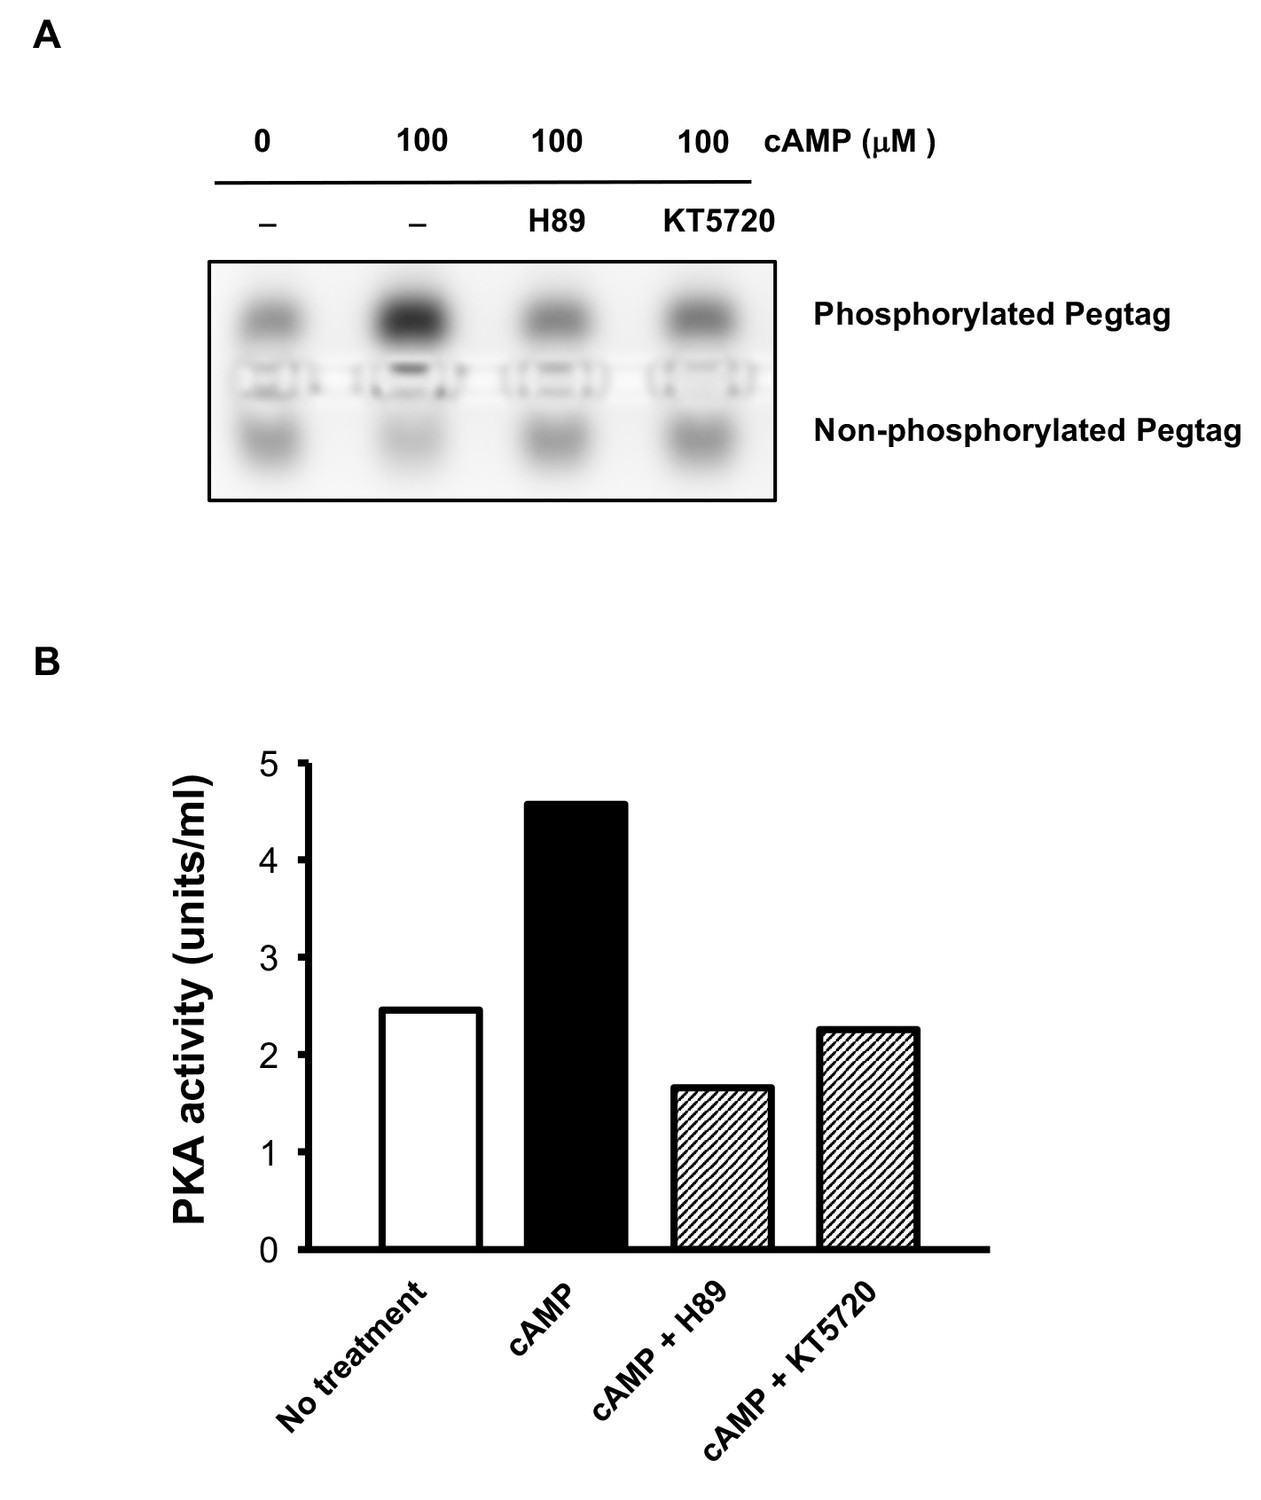
Abolishment of PKA activity by inhibitors H89 and KT5720.
(A) Pretreatment with H-89 (20 μM) and KT5720 (2 μM) decreased the band of phosphorylated Peptag peptide induced by cAMP (100 μM) treatment. (B) Quantification of the assay showing that H89 (20 μM) and KT5720 (2 μM) were sufficient to block the activity of PKA (n = 2 independent experiments with one biological replicates each).
Figure 5—figure supplement 2
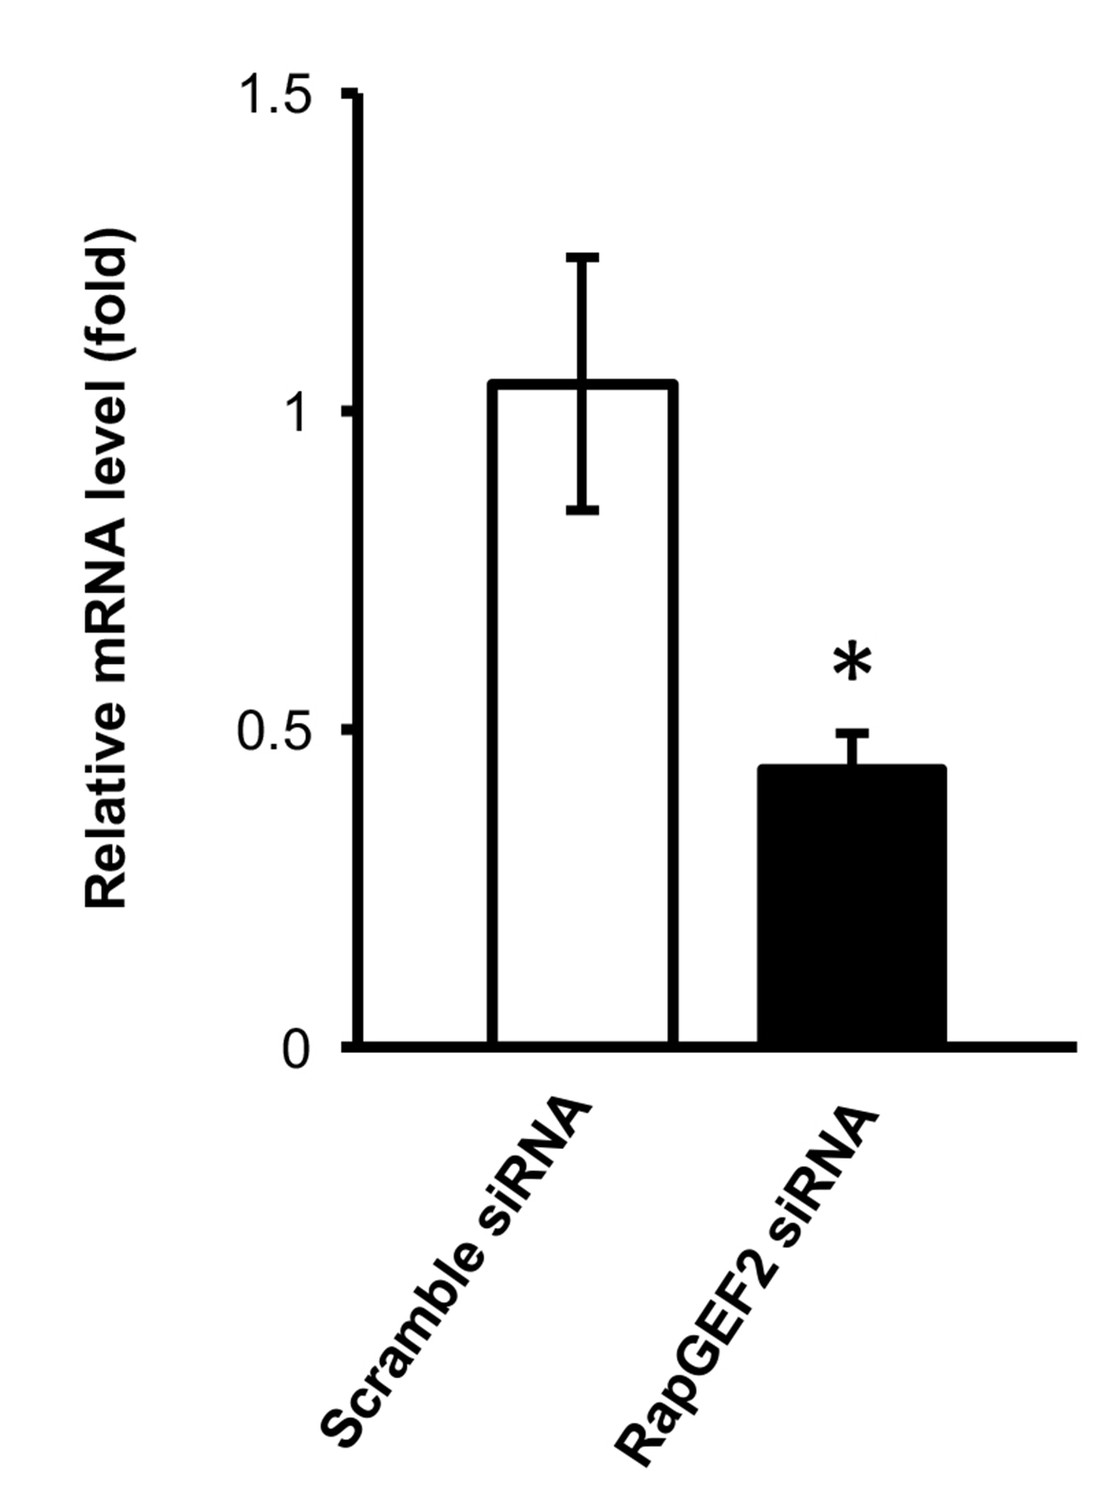
qRT-PCR shows that the mRNA level of RapGEF2 is lower in the siRNA group compared to the scramble siRNA group (p=0.042) (n = 3 independent experiments with three biological replicates each, error bars denote standard error).
https://doi.org/10.7554/eLife.29750.020
Figure 5—figure supplement 3
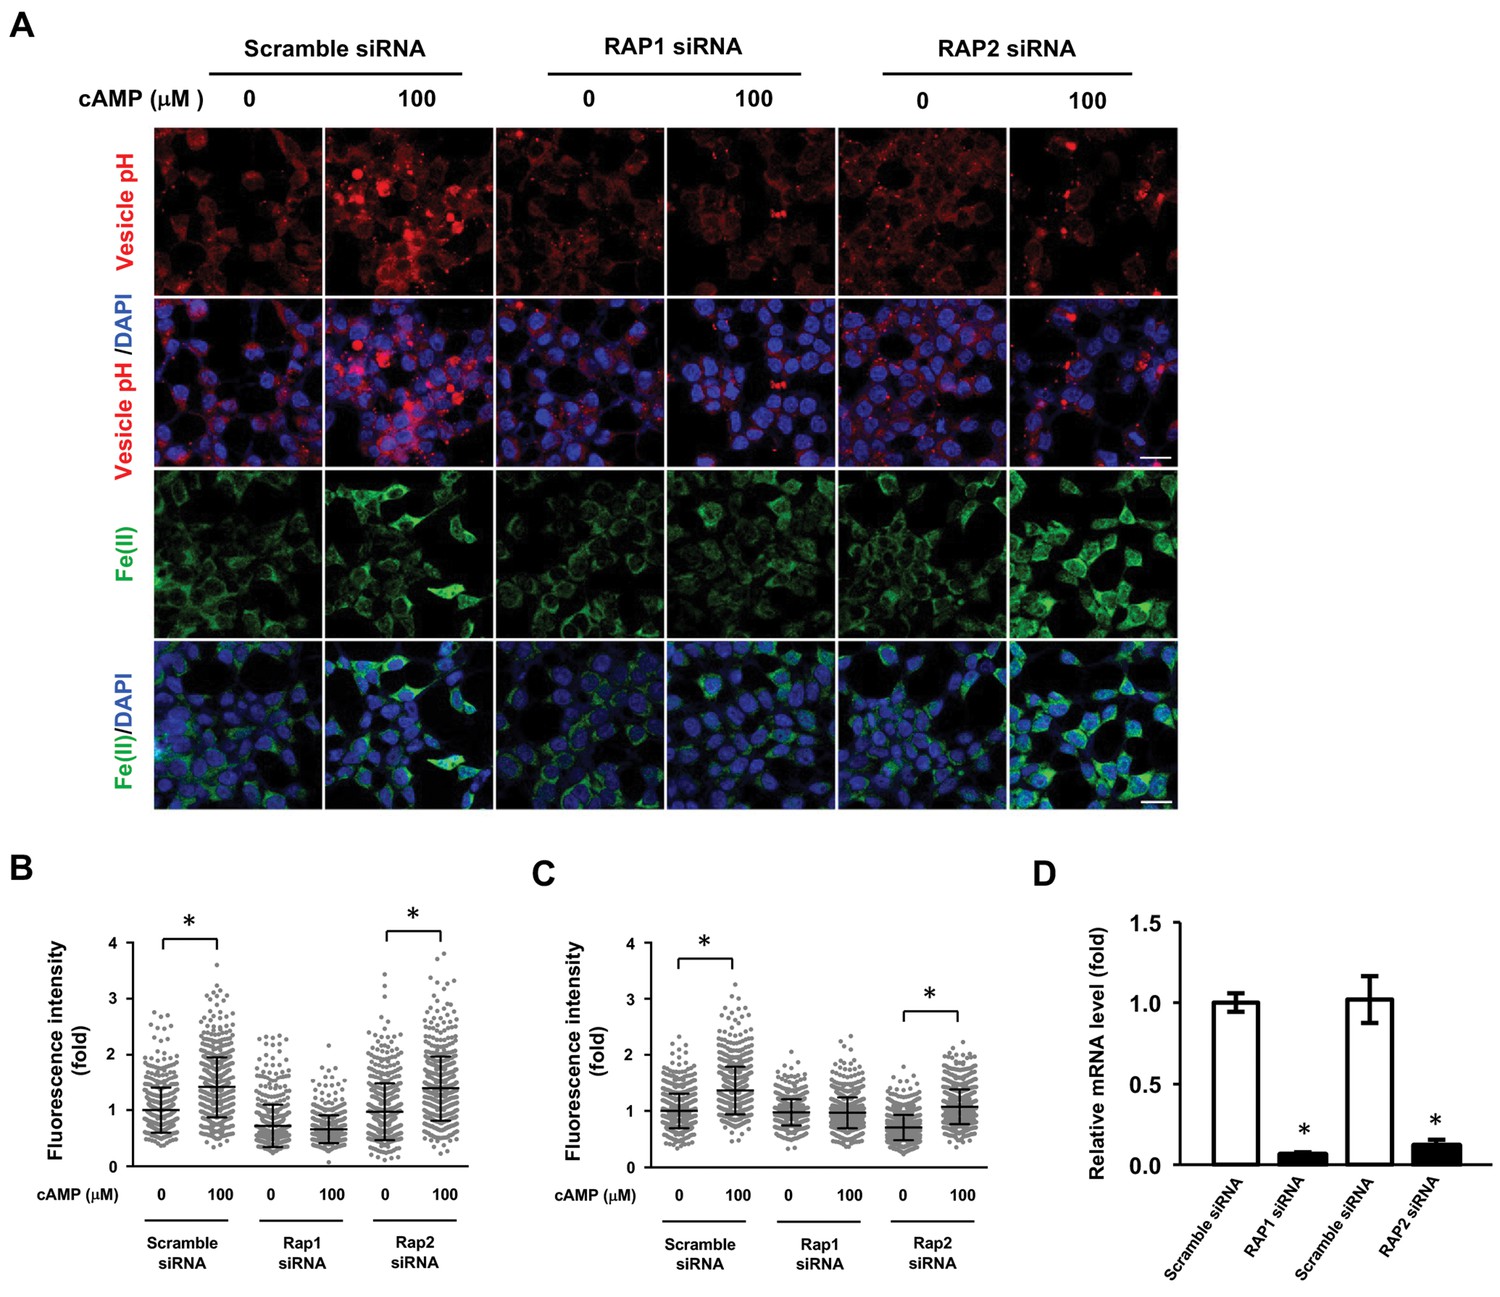
RAP1 and labile Fe(II) induction by cAMP.
(A) Knocking down the expression of Rap1 largely blocked the effect of cAMP (100 μM) on vesicle acidification and labile Fe(II) elevation detected by Trx-Puro probes, while knocking down RAP2 and scramble siRNA had no obvious effect. Scale bar = 20 μm. (B) IF quantification indicates the inhibition of RAP1 siRNA on cAMP-induced vesicle acidification. (C) IF quantification indicates the inhibition of RAP1 siRNA on cAMP-induced labile Fe(II). (E) qRT-PCR shows the mRNA level of Rap isoforms are lower in the siRNA group compared to the scramble siRNA group. *p<0.005 (n = 1 independent experiment with three biological replicates each, error bars denote standard error).
Figure 6
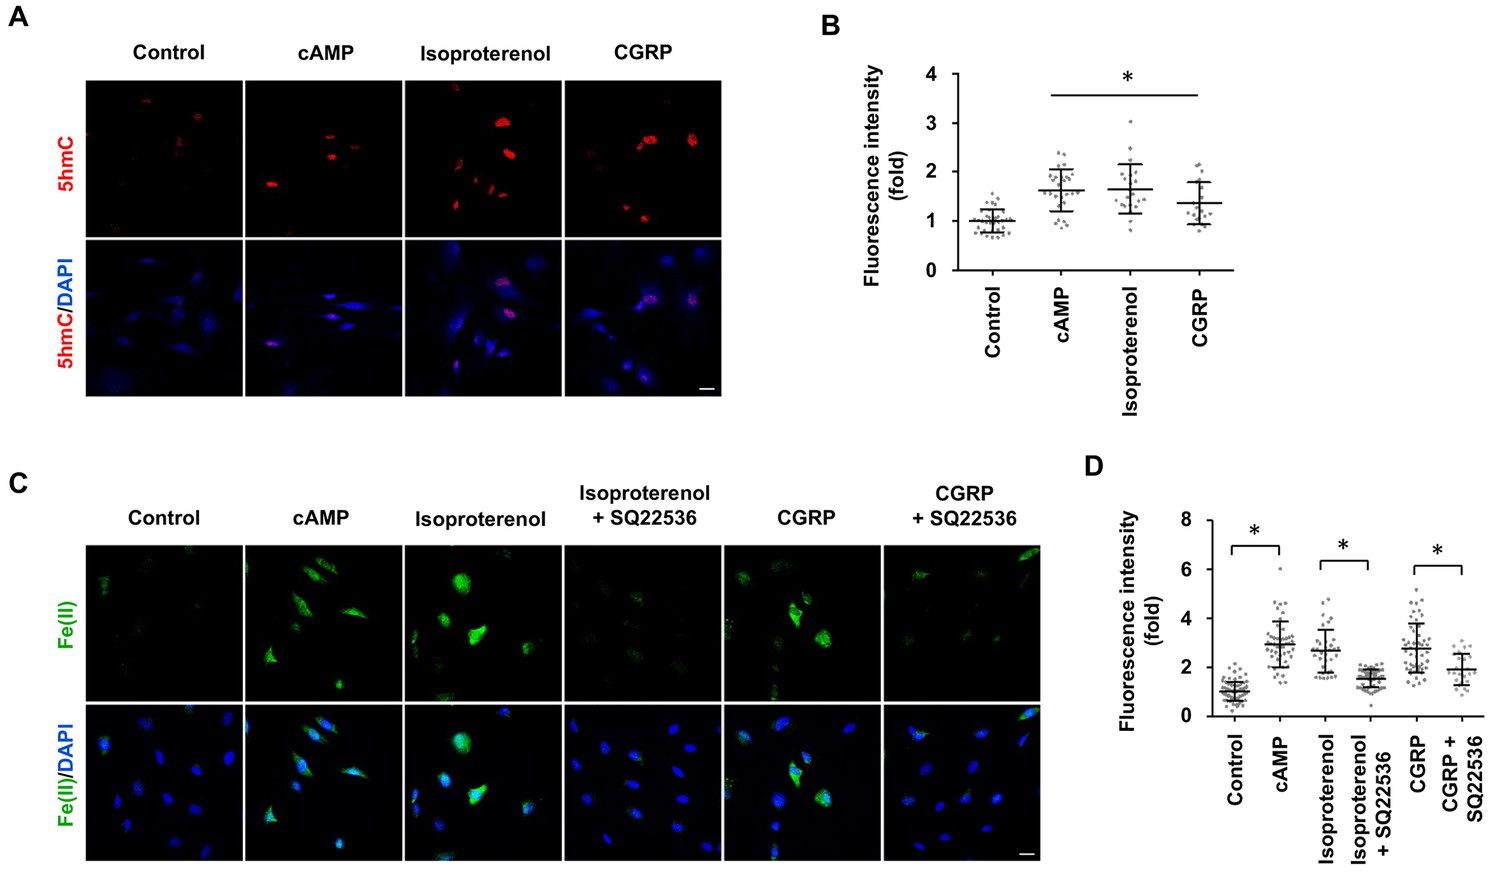
GPCR stimulation induces labile Fe(II) and 5hmC generation in Schwann cells.
(A) Treatment with Gs-coupled receptor ligands isoproterenol (10 μM) and CGRP (100 nM) for 2 days induced 5hmC, an effect comparable to treatment with cAMP (100 μM) as shown by IF. (B) IF quantification indicates that activation of Gs-coupled receptors elevates 5hmC. (C) Treatment with isoproterenol (10 μM) and CGRP (100 nM) for 4 hr enhanced intracellular labile Fe(II) detected by Trx-Puro probes, which is comparable to treatment with cAMP (100 μM). The induction of labile Fe(II) by isoproterenol and CGRP was decreased after pretreatment with SQ22536 (100 μM) for 20 min prior to isoproterenol and CGRP stimulation. Scale bar = 20 μm. (D) IF quantification indicates that SQ22536 inhibits the elevation of labile Fe(II) by Gs-coupled receptor ligands. p<0.0005 (n = 3 independent experiments with three biological replicates in each group).
Figure 7
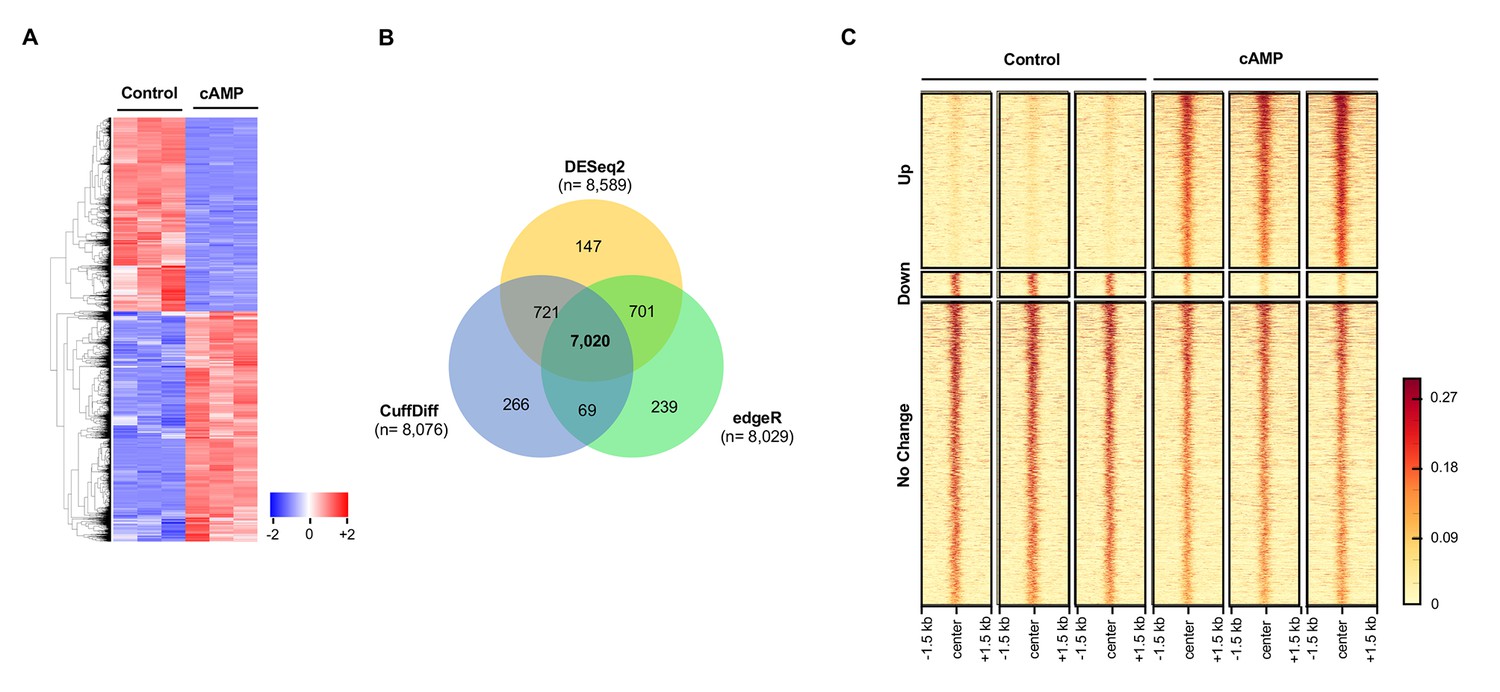
cAMP shifts the transcriptome and hydroxymethylome of Schwann cells.
(A) cAMP (100 μM) treatment for 7 days changes genome-wide transcription as shown by the heatmap of the relative abundance of reads for differential transcripts. (B) Venn Diagram of the RNA-seq results from the comparison of Schwann cells treated with or without cAMP (100 μM) for 7 days. The numbers within the circles represent the number of differential transcripts called by DESeq2 (yellow), edgeR (green), and CuffDiff (Blue) respectively. (C) cAMP (100 μM) treatment upregulated 5hmC peaks genome-wide as detected by hMeDIP-seq (n = 1 experiment with three biological replicates).
Figure 8 with 1 supplement
5hmC profile changes correlate with gene transcription.
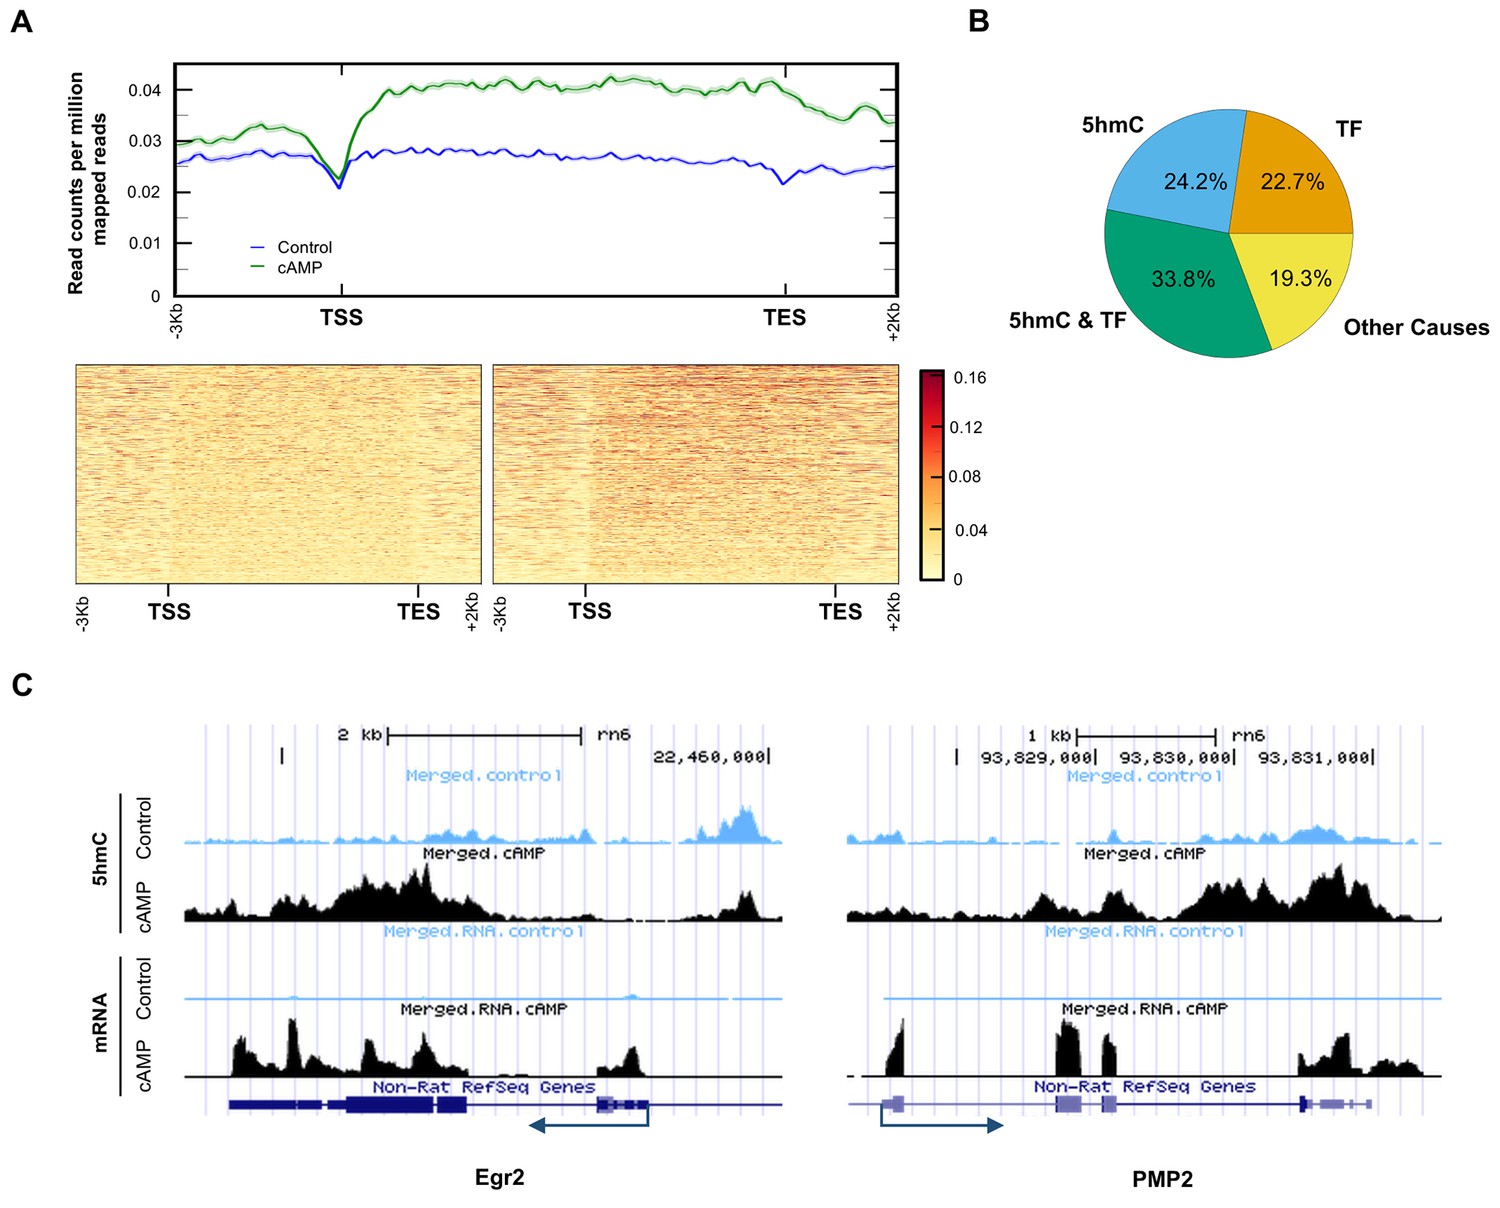
(A) cAMP (100 μM) upregulated 5hmC at promoter and gene body regions of differential transcripts. (B) 33.8% of differential transcripts were associated with both 5hmC peaks and PKA-dependent transcription factors (TF). 24.2% of differential transcripts were associated with 5hmC peaks only and 22.7% of differential transcripts were associated with TF only. The rest of the differential transcripts (19.3%) were not associated with either 5hmC peaks or TF. (C) cAMP (100 μM) increased transcription and 5hmC, mainly in the gene bodies, of Egr2 and Pmp2 shown by UCSC Genome Browser views of hMeDIP-seq and RNA-seq reads (n = 1 experiment with three biological replicates).
-
Figure 8—source data 1
Impact of cAMP treatment on both transcription and 5hmC levels of myelin-related genes in Schwann cells.
- https://doi.org/10.7554/eLife.29750.027
Figure 8—figure supplement 1
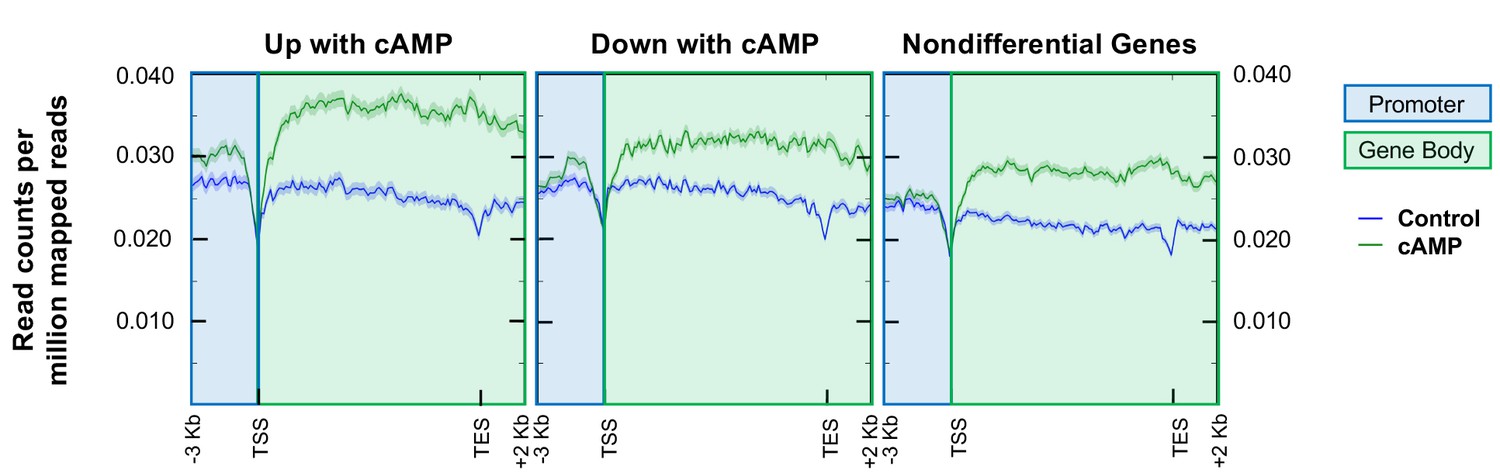
Analysis of hMeDIP-seq enrichment levels in the promoter region (3,000 bp upstream of TSS) and gene body regions (TSS to TES) of genes that change in response to cAMP treatment and nondifferential genes.
Overall average levels of 5hmC enrichment in read counts per million mapped reads (RCPM). Blue shading indicates promoter regions while green shading indicates gene body region.
Author response image 1
Additional files
-
Transparent reporting form
- https://doi.org/10.7554/eLife.29750.028
Download links
A two-part list of links to download the article, or parts of the article, in various formats.
Downloads (link to download the article as PDF)
Open citations (links to open the citations from this article in various online reference manager services)
Cite this article (links to download the citations from this article in formats compatible with various reference manager tools)
cAMP signaling regulates DNA hydroxymethylation by augmenting the intracellular labile ferrous iron pool
eLife 6:e29750.
https://doi.org/10.7554/eLife.29750


