Neuromodulatory connectivity defines the structure of a behavioral neural network
- National Institute of Mental Health, National Institutes of Health, United States
- National Institute of General Medical Sciences, National Institutes of Health, United States
Figures
Figure 1
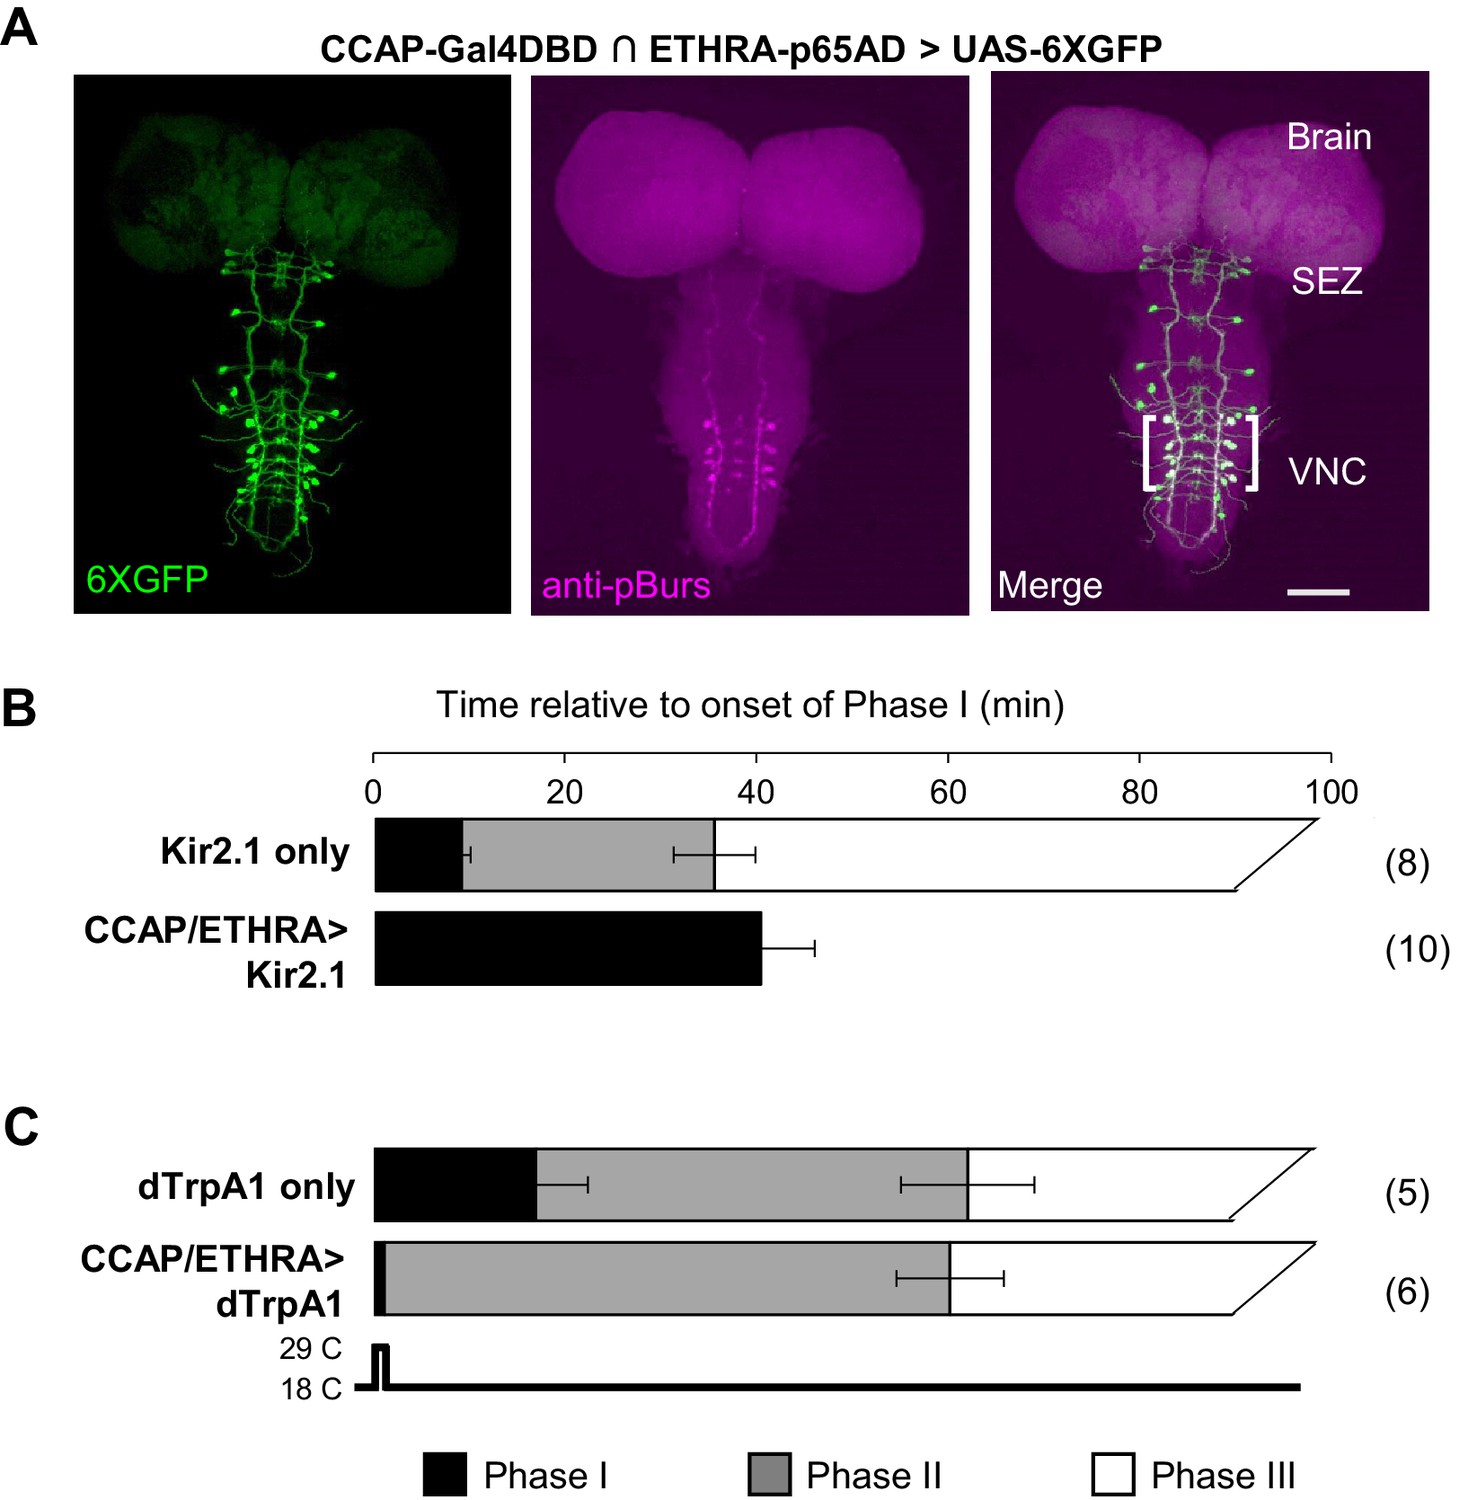
ETHRA/CCAP neuronal activity modulates all phases of pupal ecdysis.
(A) Fluorescence confocal image of a pupal CNS wholemount. Neurons that express ETHRA, CCAP, and Bursicon are revealed by intersectional expression of UAS-6XEGFP (green, left) under the control of the CCAP-Gal4DBD∩ETHRA-p65AD hemidriver pair and anti-pBurs immunolabeling (magenta, middle). Merged image (right). Brackets, double-labeled neurons; SEZ, subesophageal zone; VNC, ventral nerve cord. Scale bar: 50 μm. (B) Suppression of ETHRA/CCAP neurons by two copies of UAS-Kir2.1 (bottom) eliminates both Phases II and III. Upper panel, pupal ecdysis behavior of control animals lacking the driver. Bars show the average durations of Phases I and II (±standard deviations, N in parentheses). The end of Phase III was not calculated. (C) Brief activation of ETHRA/CCAP neurons (1 min) using UAS-dTrpA1 terminates Phase I and initiates Phase II (bottom). Upper panel, behavior of control animals lacking the driver and subjected to the same temperature shift.
Figure 2
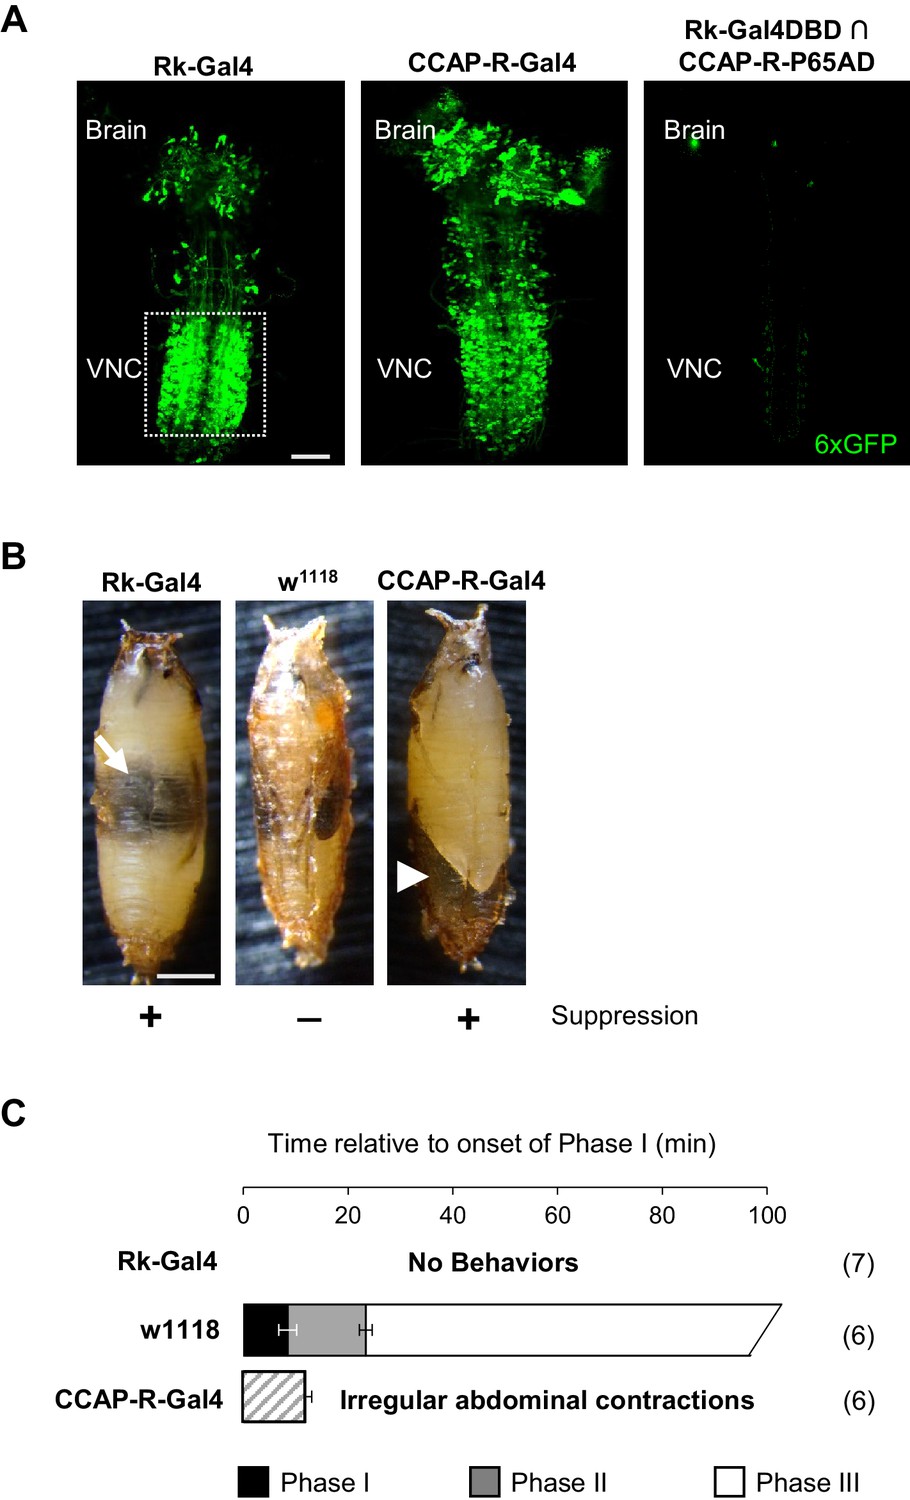
Bursicon and CCAP target distinct groups of neurons essential for pupal ecdysis.
(A) Pupal CNS wholemounts showing neurons targeted by Bursicon (Rk-Gal4, left) and CCAP (CCAP-R-Gal4, middle). Green, UAS-6XGFP. Right panel: Intersectional labeling with Rk-Gal4DBD∩CCAP-R-p65AD hemidrivers shows that few neurons are targeted by both factors. VNC, ventral nerve cord. Scale bar: 50 μm. (B) Pupae in which the activity of Rk-expressing (left) or CCAP-R-expressing (right) neurons were suppressed during the period of pupal ecdysis using two copies of UAS-Kir2.1. Such pupae exhibit severe ecdysis deficits compared with control animals lacking a driver and therefore not subjected to neuronal suppression (middle). Arrow, air bubble abnormally retained in the body of an animal with suppressed Rk-expressing neurons. Arrowhead, large posterior air bubble in pupa with suppressed CCAP-R-expressing neurons. Scale bar: 0.5 mm. (C) Ecdysis behavior of animals subjected to suppression of the Rk-expressing neurons (top) or CCAP-R-expressing neurons (bottom) compared with control animals (middle), which execute Phase I, II, and III behaviors for the average indicated durations (±standard deviations), but animals in which Rk- or CCAP-R-expressing neurons were suppressed displayed no movements, or only disorganized contractions resembling Phase I, respectively. N, number of preparations analyzed.
Figure 3
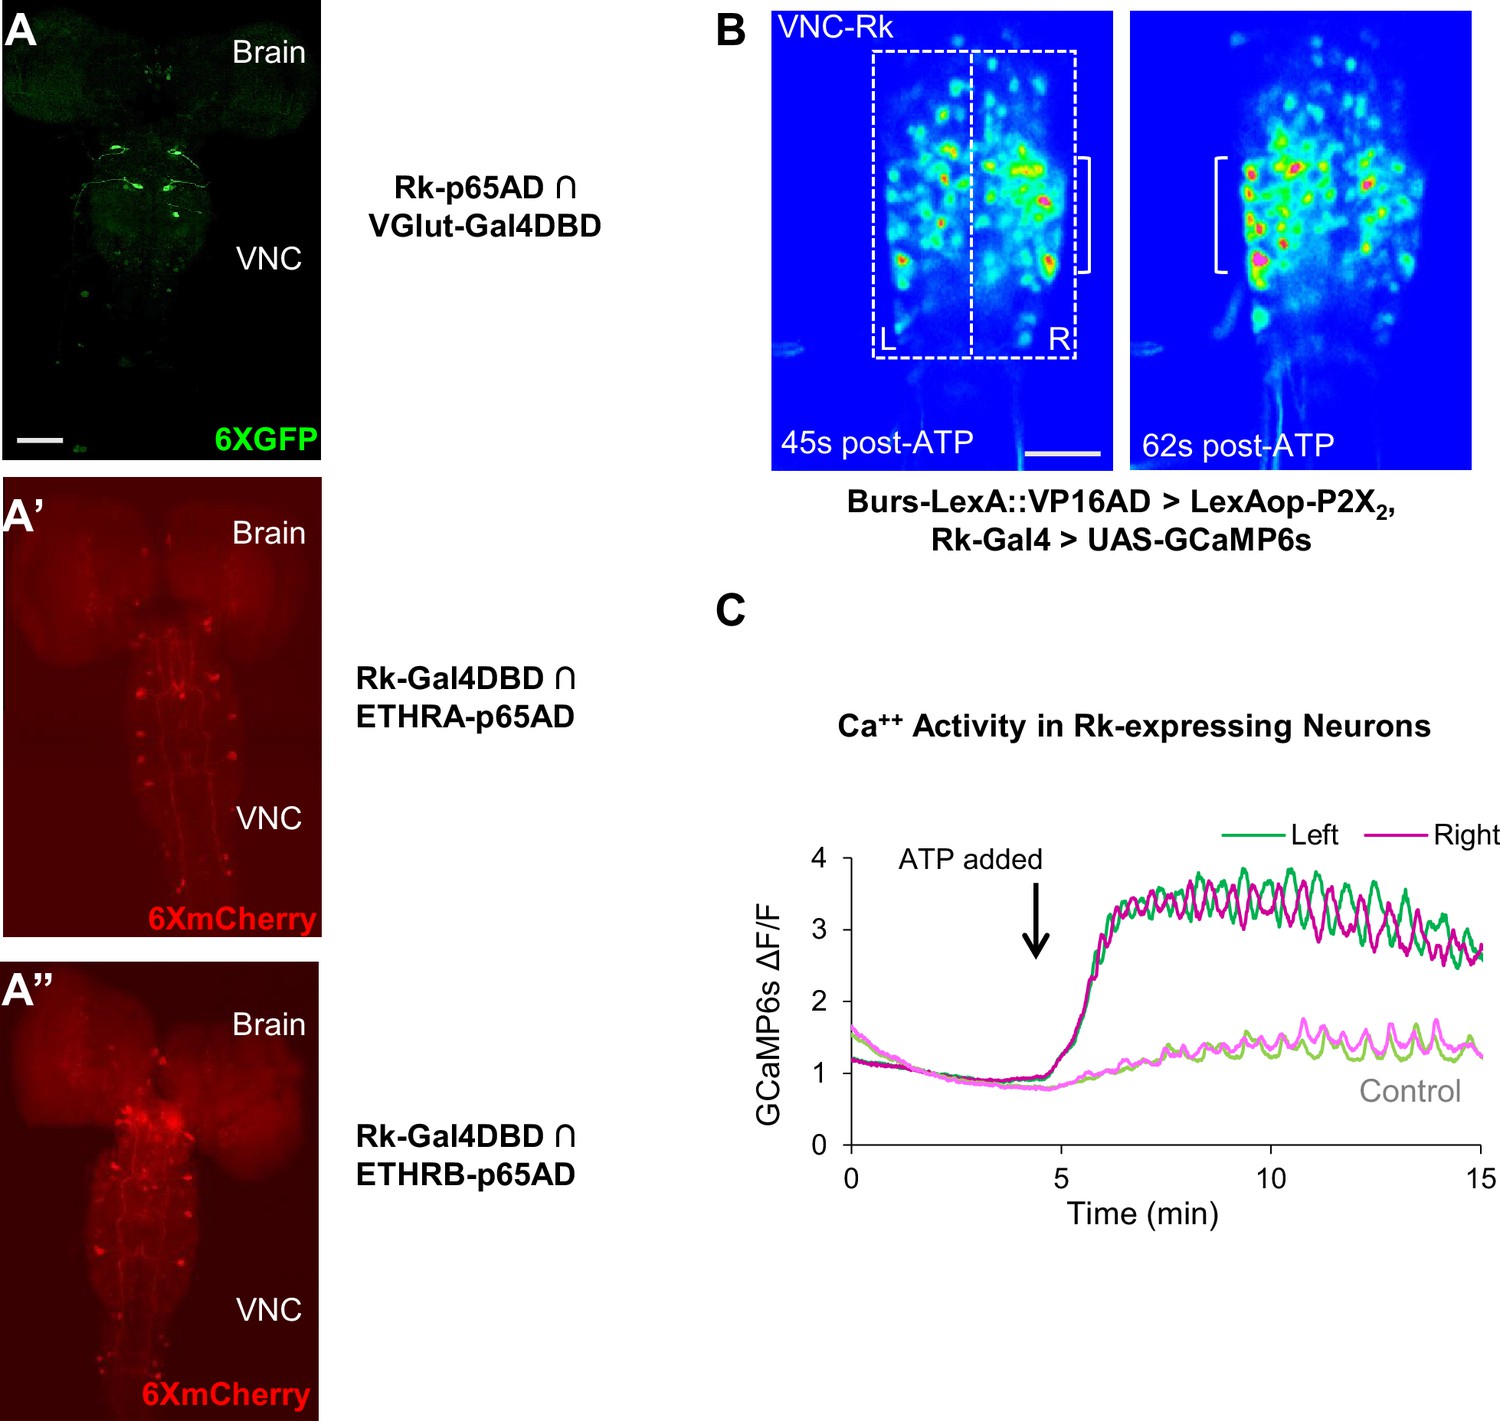
Stimulating Bursicon-expressing neurons induces Phase II-like activity in VNC-Rk neurons.
(A–A”) Pupal CNS wholemounts showing neurons that express Rk and either: (A) the motor neuron marker VGlut, (A’) ETHRA, or (A”) ETHRB, as revealed by Split Gal4 intersectional labeling. Reporters: UAS-6XGFP (green) and UAS-6XmCherry (red). VNC, ventral nerve cord. Scale bar: 50 μm. (B) Calcium activity induced in VNC-Rk neurons by activating Bursicon-expressing neurons using the purinergic P2X2 channel. ATP induces oscillatory activity in the Rk-expressing neurons, with peak Ca++ signal alternating between the right (t = 45 s) and left (t = 62 s) sides of the ventral midline. Scale bar: 50 μm. (C) Timecourse of the GCaMP6s Ca++ signals on the left (green) and right (magenta) side of the VNC midline (boxes in B, left panel) before and after addition of ATP (arrow). In the experimental cross (dark green and magenta), ATP induced right-left alternating peaks in the Ca++ traces, whereas in the control cross (light green and magenta) only small, coincident oscillations characteristic of background activity were observed. Traces shown are representative of n = 6 experimental and n = 7 control preparations.
Figure 4 with 1 supplement
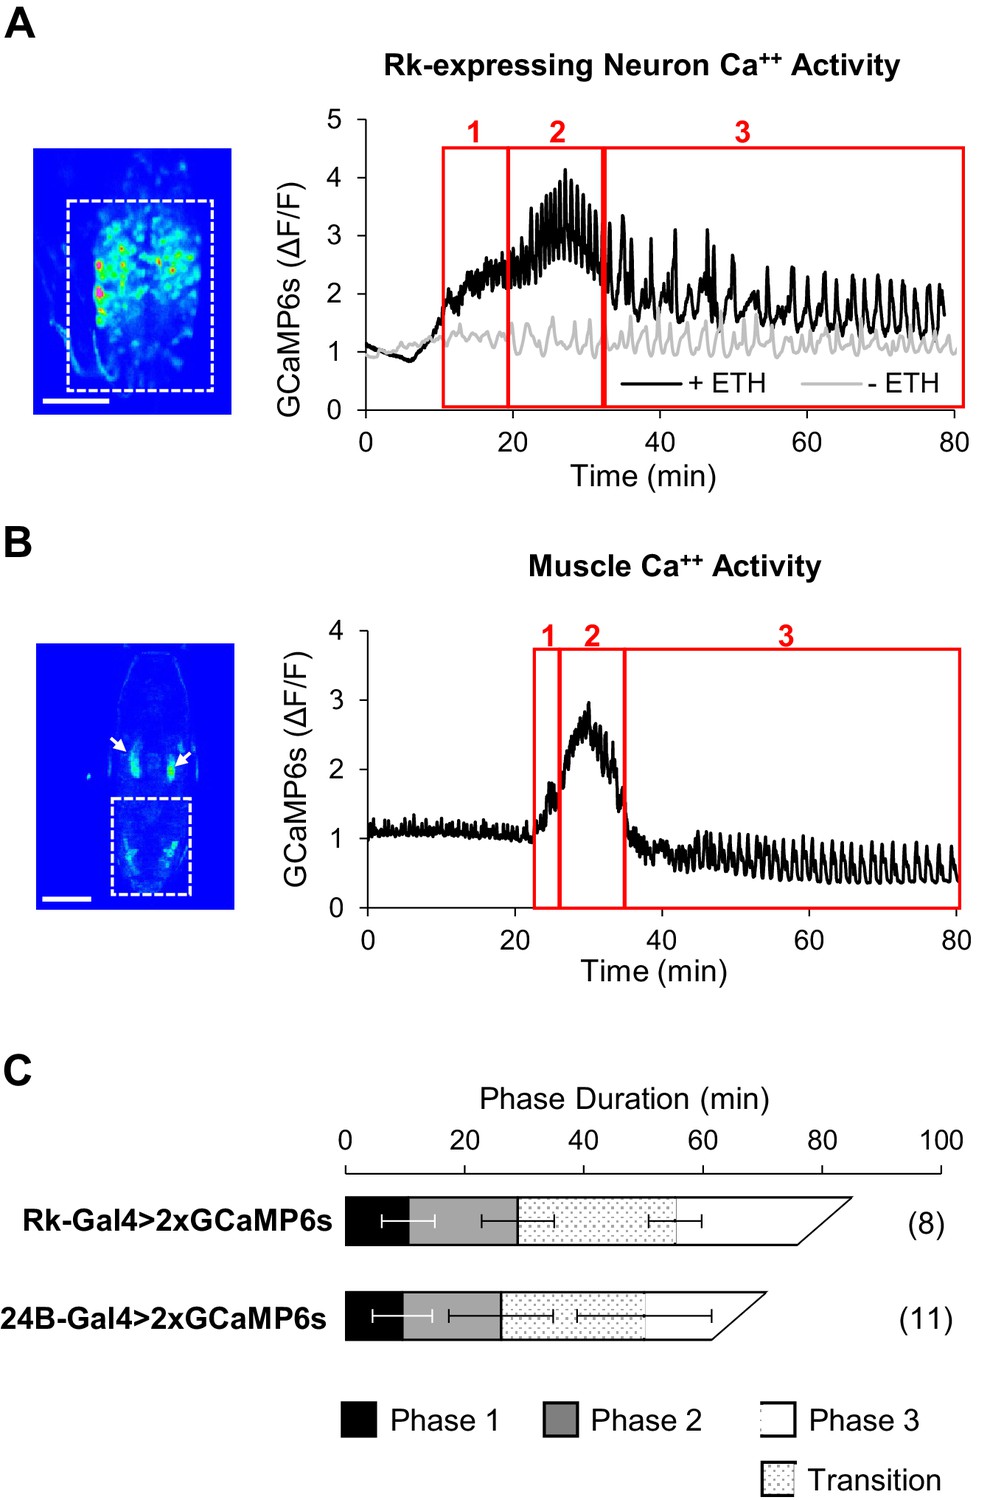
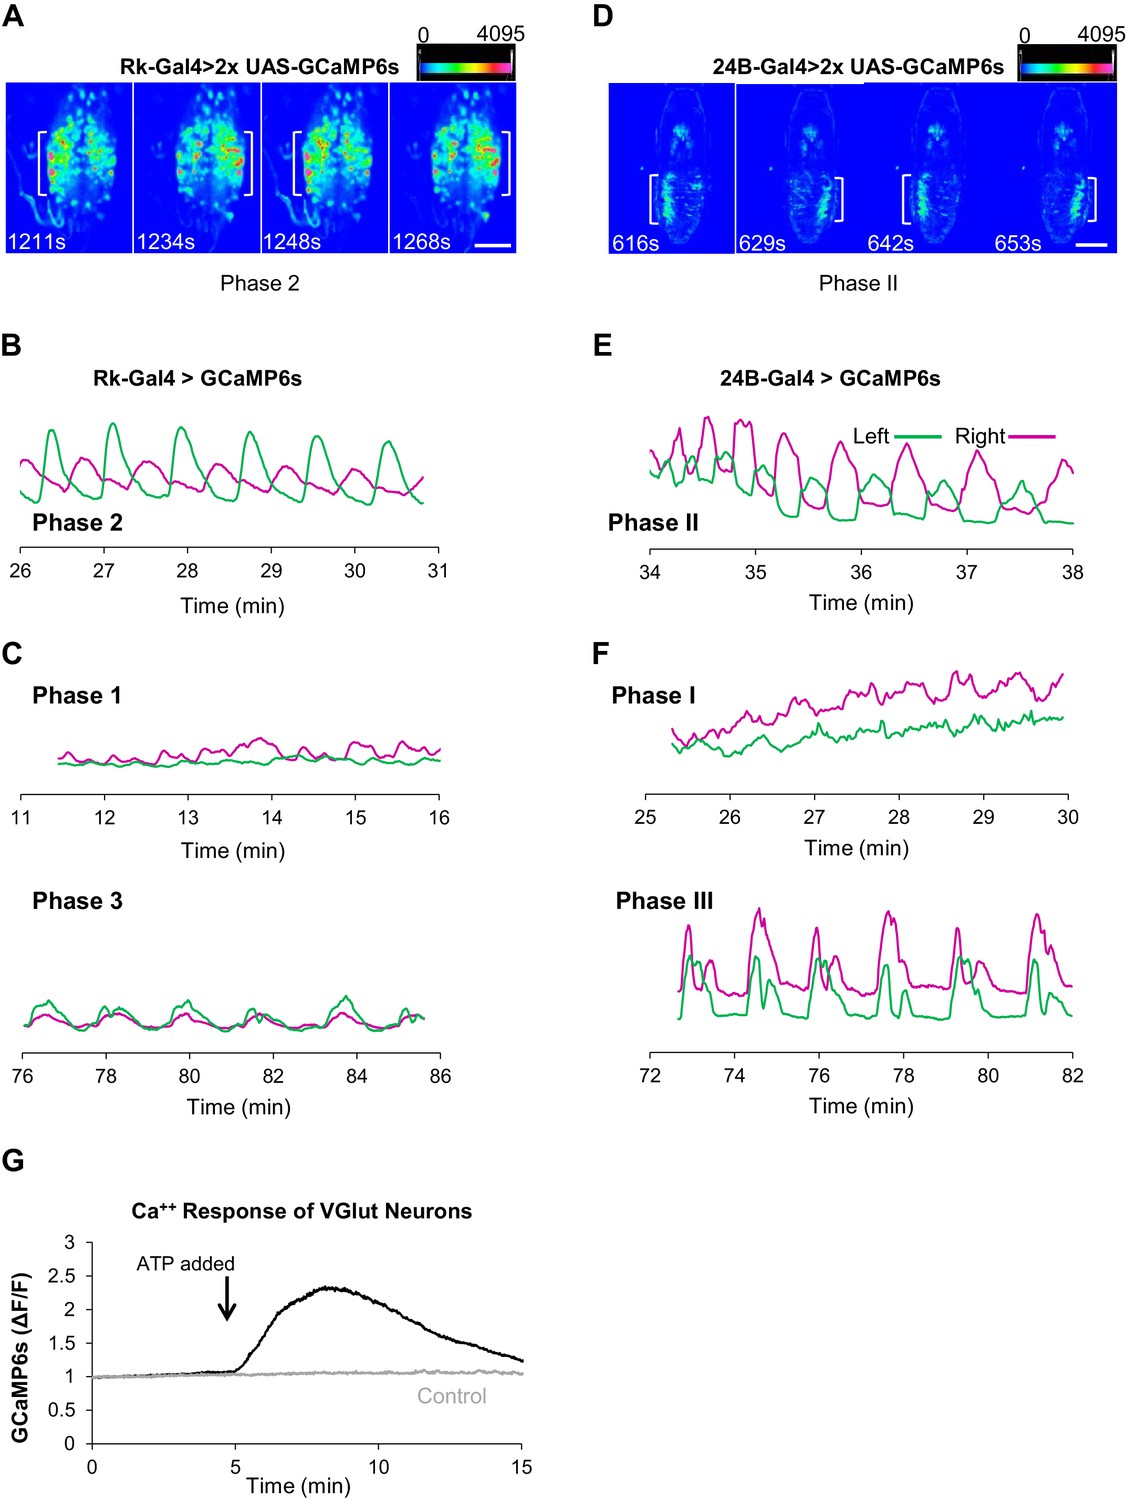
ETH1-induced Ca++ activity in Rk-expressing neurons is triphasic.
(A) Ca++ activity in VNC-Rk neurons (measured within the dashed box, left, in an excised pupal CNS) shows a phasic response to ETH1 (black trace), distinct from the activity of control preparations not treated with ETH1 (gray trace). Three principal phases of activity could be distinguished (boxes 1, 2, and 3 as shown), the third of which displayed a transitional period with mixed activity patterns, followed by a period with more uniform oscillations. Image scale bar: 100 μm. (B) Ca++ activity measured in the abdominal musculature (dashed box,left) by expressing UAS-GCaMP6s under control of the 24B-Gal4 driver exhibited phases similar (boxes 1, 2, and 3) to the Rk-expressing neurons. Arrows: non-muscle salivary gland Ca++ signal. Image scale bar: 500 μm. (C) Ca++ phase durations in VNC-Rk neurons and abdominal muscles, as calculated by the PhaseFinder program (see Materials and methods and Figure 4—figure supplement 1). Both sets of traces exhibited a ‘transition period’ within Phase III (dotted pattern) that could also be quantified using the PhaseFinder program. Average phase durations are shown ±standard deviations; N in parentheses.
Figure 4—figure supplement 1
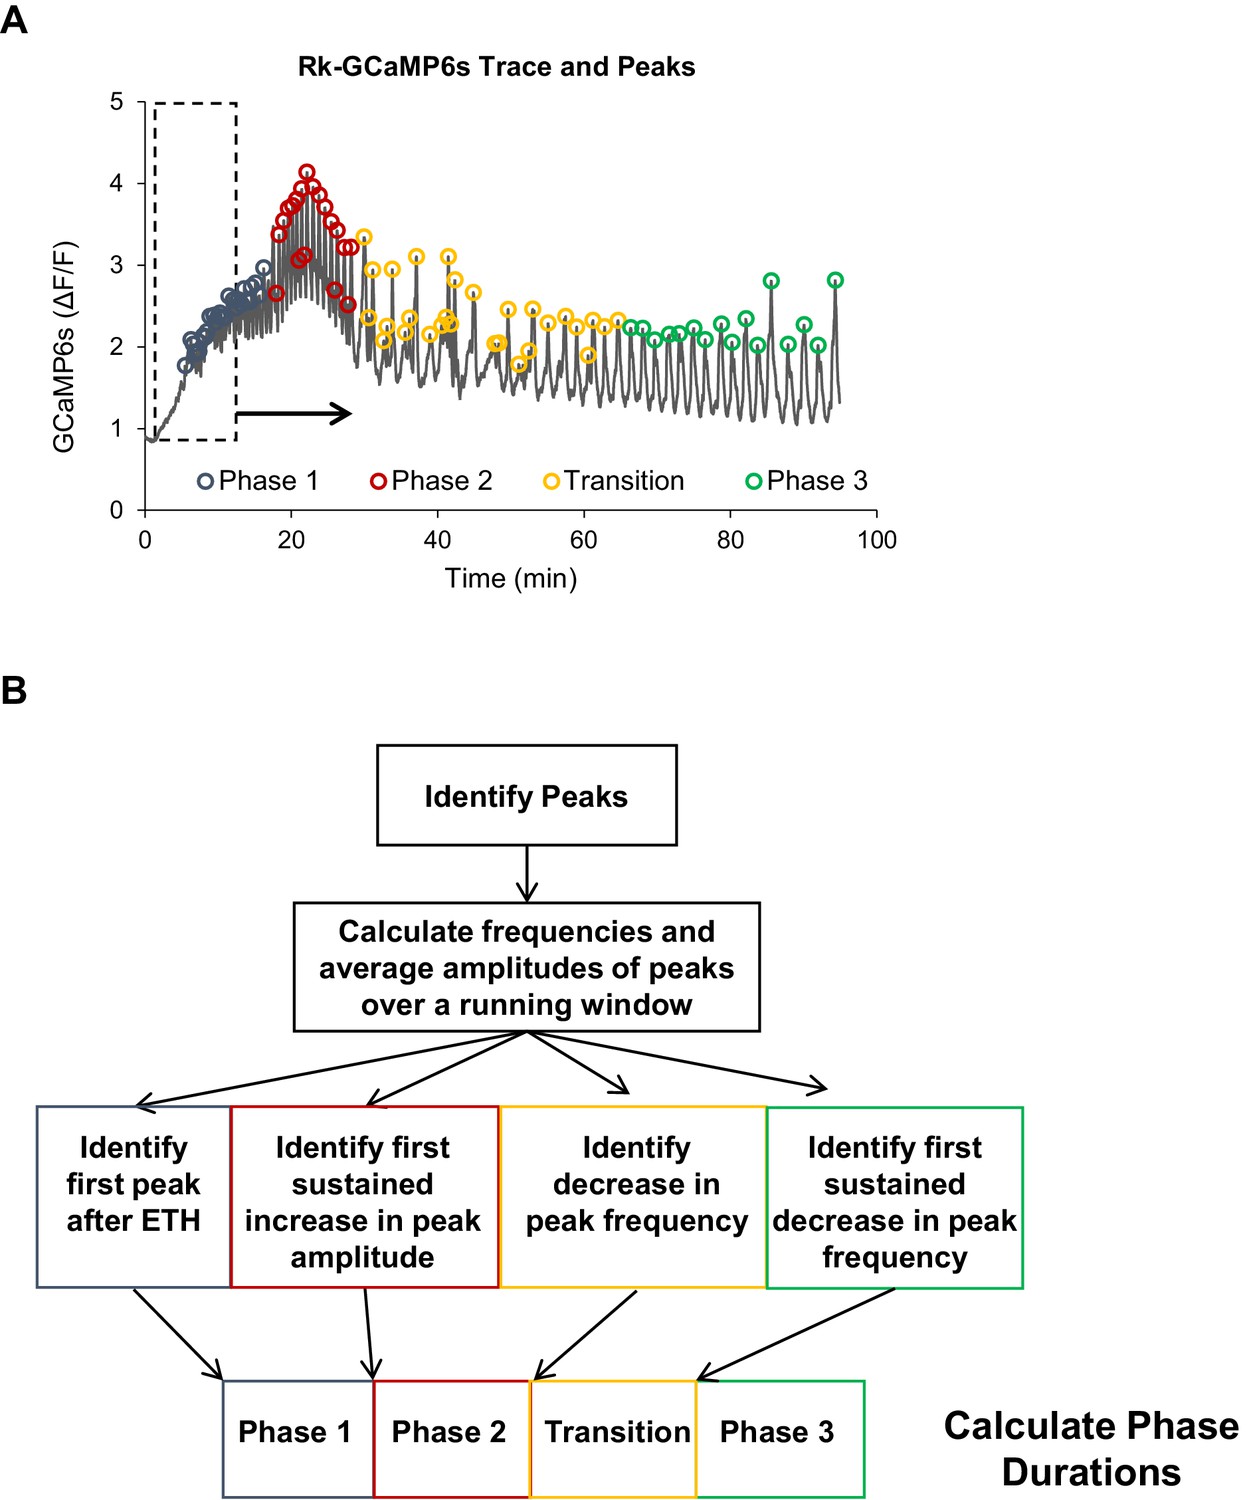
The PhaseFinder program for automated analysis of Ca++ activity.
(A) Example of PhaseFinder’s peak detection algorithm. PhaseFinder first identifies peaks in a Ca++ trace using a built-in MatLab function. Custom code then runs a sliding window over the trace and distinguishes phases by comparing amplitudes and frequencies from one window with the next. Phase 1 is the first peak after addition of ETH, Phase 2 is identified by a specified increase in amplitude, Phase 3 by a specified decrease in frequency, and the end of the ‘transition period’ by a sustained decrease in frequency. (B) Flow diagram for the identification of behavioral phases by PhaseFinder and the subsequent calculation of Phase durations.
Figure 5 with 1 supplement
Rk-expressing neurons act in central pattern generation.
(A–C) Analysis of ETH1-induced Ca++ activity in VNC-Rk neurons. (A) Images from two complete cycles of alternating Ca++ signal in VNC-Rk neurons during Phase 2. Images correspond to the indicated times of peak signal (brackets) on each side of the midline. Scale bar: 100 μm. (B) Phase 2 Ca++ signals from the preparation shown in (A) measured on the right (magenta) and left (green) sides of the midline (as shown in Figure 3B) oscillate in anti-phase. (C) Ca++ signals corresponding to Phase 1 (top) measured on either side of the midline are poorly correlated, whereas those corresponding to Phase 3 (bottom) are in phase. (For more detailed analysis of Ca++ signals from selected small ROIs within the VNC-Rk neurons see Figure 5—figure supplement 1.). (D–F) Analysis of Ca++ activity in abdominal muscles during the pupal ecdysis sequence. (D) Images from two complete cycles of alternating Ca++ signal in the abdominal musculature during Phase 2. Times and brackets indicate peak signal on each side of the midline, as in (B). Scale bar: 500 μm. (E) Phase 2 Ca++ signals measured on the right (magenta) and left (green) sides of the midline. (F) Ca++ signals corresponding to Phase 1 (top) measured on either side of the midline are poorly correlated, whereas those corresponding to Phase 3 (bottom) are in phase. (G) Timecourse of Ca++ activity in VGlut-expressing (motor) neurons of the abdominal ganglia in preparations in which the Rk-expressing neurons were activated (black trace) by ATP (arrow), or not activated because the P2X2 channel was not expressed (gray trace). Traces shown are representative of n = 6 experimental and n = 6 control preparations.
Figure 5—figure supplement 1

VNC-Rk responses to ETH1 differ.
(A) A Snapshot of ETH1-induced GCaMP6s activity (green) in VNC-Rk neurons. Circles indicate the 95 regions of interest (ROIs) selected for analysis of their response to ETH1. These regions were selected because their signals were spatially separated in the X-Y plane during the timecourse and conformed in size to individual cell bodies. Labeled ROIs in magenta are those whose Ca++ traces are shown in B. (B) Timecourse of ETH1-induced Ca++ activity of ROIs indicated in A. The timecourse of the global Ca++ signal (calculated for the entire set of VNC-Rk neurons, as shown in Figure 4A) is shown at the bottom. Dotted red lines indicate the time periods representing the three phases of Ca++ activity derived from the global signal. (C) Heatmaps showing the average oscillation frequencies for each phase for each of the 95 ROIs in A. Average frequencies were calculated for each trace using PhaseFinder to define peaks and phase durations determined from the global VNC-Rk signal (with Phase 3 subdivided into the Transition Phase and a ‘late’ Phase 3, as described in Figure 4C). The average Phase frequencies for the global VNC-Rk signal is shown at the top for reference and arrows indicate ROIs that showed a distribution of Phase frequencies that approximated that of the global signal, including ROI #74 from B.
Figure 6 with 1 supplement
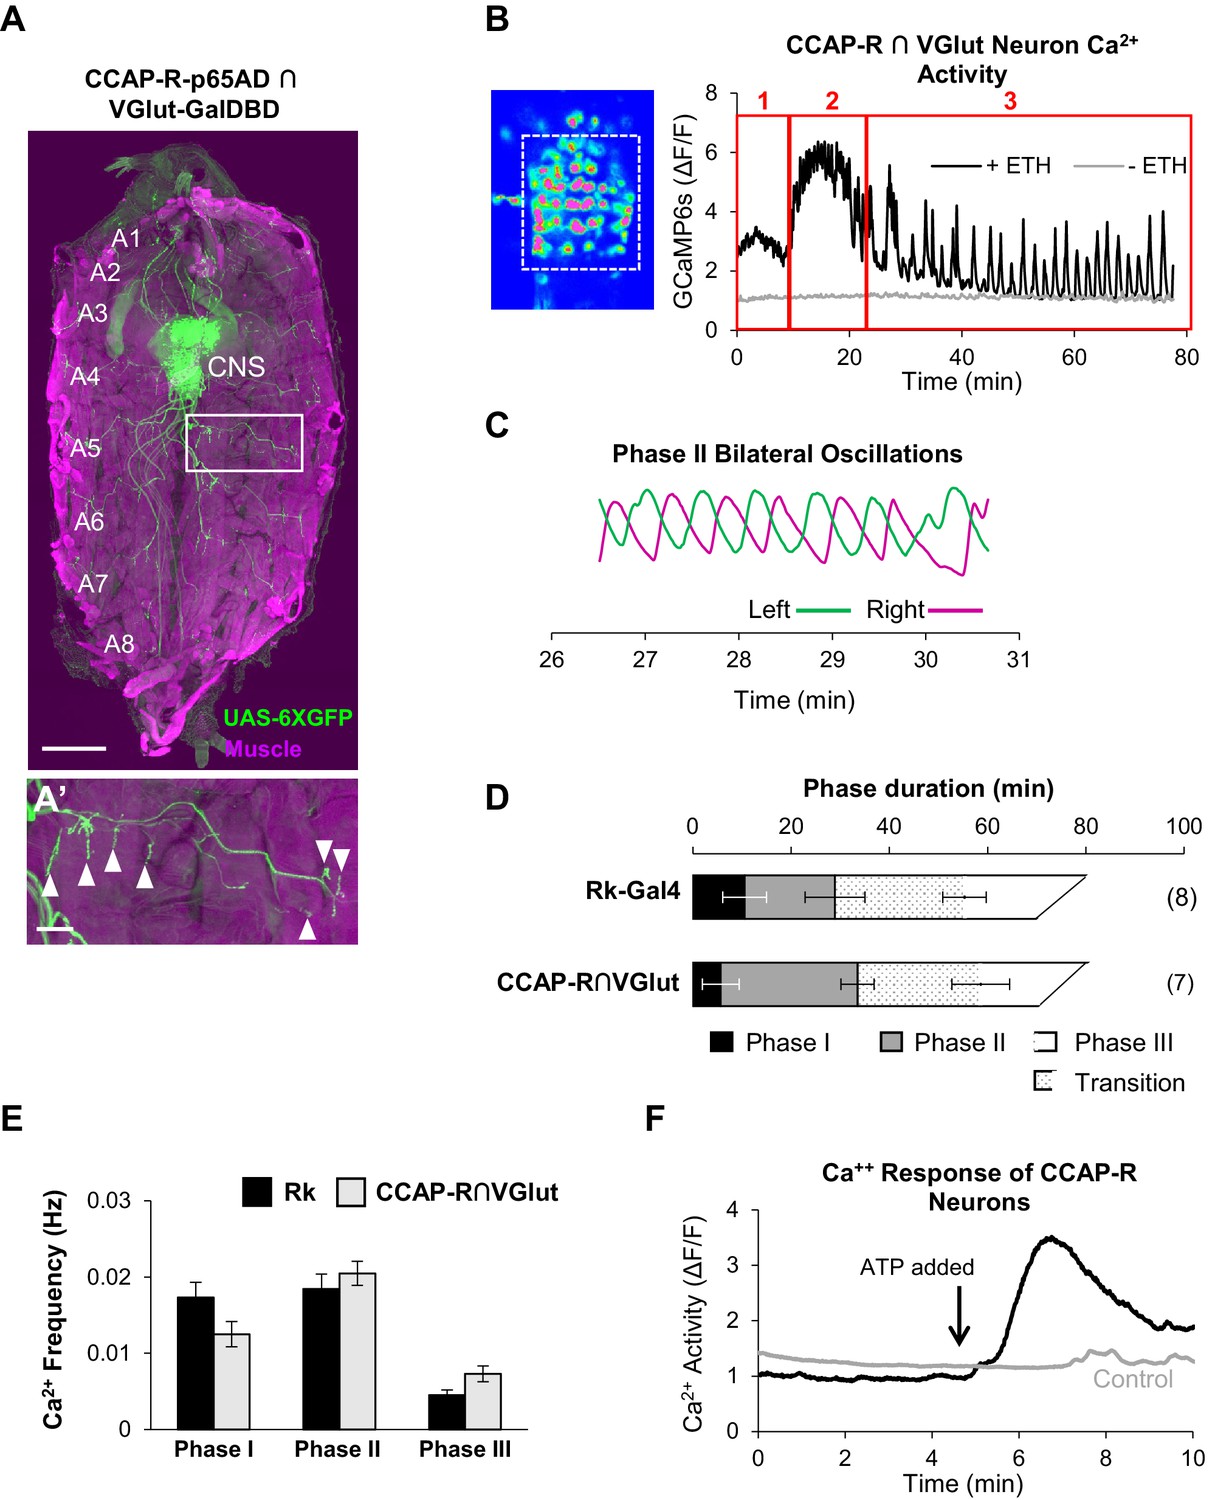
CCAP-R-expressing motor neurons act downstream of Rk-expressing neurons.
(A, A’) A late 3rd instar larval fillet in which body wall muscles are stained with phalloidin (magenta) and a UAS-6XGFP reporter (green) reveals the expression pattern of a CCAP-R-p65AD∩VGlut-GalDBD Split Gal4 driver. Glutamatergic motor neurons within this pattern project their axons to muscles. Scale bar: 0.5 mm. (A’) Axons in one hemisegment (white box in A) can be seen to terminate in neuromuscular synapses (arrowheads). Scale bar: 100 µm. (B) Ca++ activity in CCAP-R/VGlut neurons (measured within the boxed area on left from the VNC of an excised pupal CNS) shows a phasic response to ETH1 (black trace), distinct from the activity of control preparations not treated with ETH1 (gray trace). Three principal phases of activity can be distinguished (red boxes 1, 2, and 3). (C) Ca++ signals from Phase 2 measured on the right (magenta) and left (green) sides of the midline oscillate in anti-phase. (D) Durations of Ca++ activity phases in VNC-Rk neurons and CCAP-R/VGlut neurons, as calculated by the PhaseFinder program. (Error bars show standard deviations; N in parentheses.) Both sets of traces exhibited a ‘transition period’ within Phase III (dotted pattern) that could also be quantified using the PhaseFinder program. (E) Average frequency of Ca++ oscillations observed in VNC-Rk neurons (black) and CCAP-R/VGlut neurons (gray) for the three phases of Ca++ activity. For Phase III, only the frequency of the uniform activity after the end of the transition period was calculated. Error bars show standard deviations. The frequencies of the two sets of neurons did not differ significantly for any Phase, when compared by ANOVA. (As shown in Figure 6—figure supplement 1, the neurons that express CCAP-R and Rk are largely distinct.). (F) Time course of Ca++ activity in CCAP-R neurons of the abdominal ganglia in preparations in which the Rk-expressing neurons were activated (black trace) by ATP (arrow), or not activated by ATP because the RkTGEM-LexA::QFAD driver was omitted (gray trace). Traces shown are representative of n = 6 experimental and n = 7 control preparations.
-
Figure 6—source data 1
Ca++ Oscillation Frequencies for Rk and CCAP-R Motor Neurons.
- https://doi.org/10.7554/eLife.29797.019
Figure 6—figure supplement 1

CCAP-R- and ETHR-expressing neurons are largely distinct.
(A) Few neurons express both CCAP-R and ETHRA as revealed by intersectional labeling with the CCAPR-Gal4DBD∩ETHRA-p65AD hemidriver pair driving expression of UAS-6XGFP (green). The maximum projection fluorescence image shows a pupal CNS wholemount. (B) Few neurons express both CCAP-R and ETHRB as revealed by intersectional labeling with the CCAPR-Gal4DBD∩ETHRB-p65AD. Scale bars: 50 µm.
Figure 7
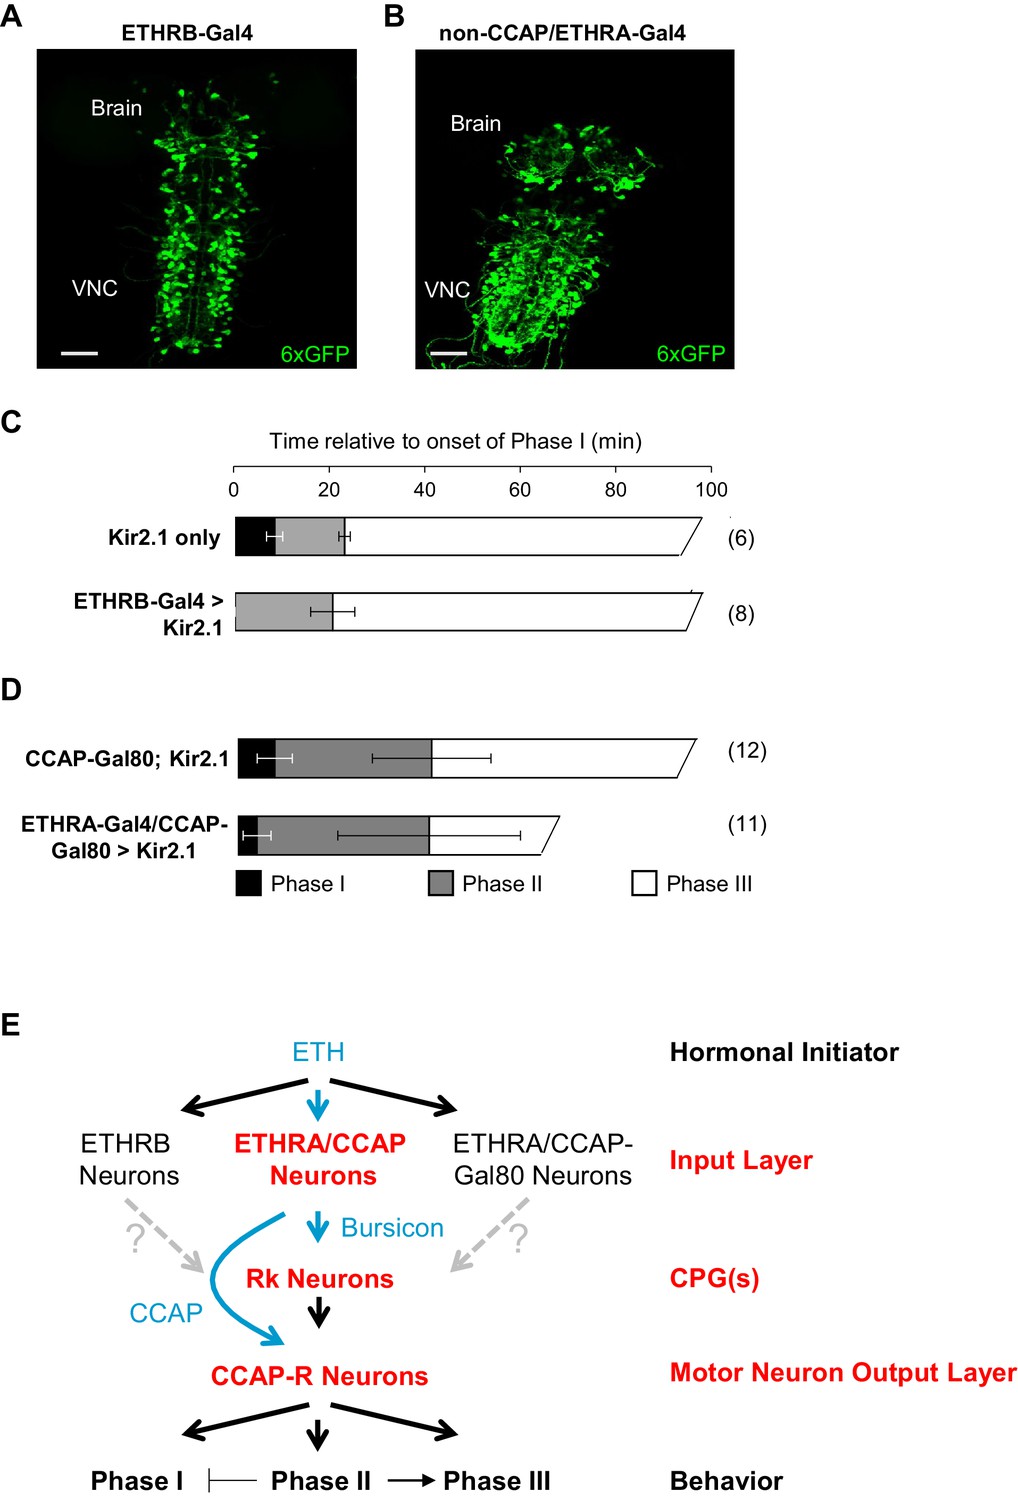
ETHRB-expressing and non-CCAP/ETHRA neurons regulate Phase I.
(A) Pupal CNS wholemount showing the expression pattern of ETHRB-Gal4 (green, UAS-6XGFP). VNC, ventral nerve cord. Scale bar: 50 µm. (B) Similar to (A), but showing the expression pattern of ETHRA-Gal4 excluding the neurons that express CCAP. Gal4 activity in the latter neurons was blocked using CCAP-Gal80. Scale bar: 50 µm. (C–D) Behavioral effects of suppressing either: (C) ETHRB-expressing neurons, or (D) non-CCAP/ETHRA neurons. Unlike unsuppressed control animals (upper graphs), animals in which ETHRB-expressing neurons are suppressed (C, bottom) lack Phase I, and this phase is significantly shortened (p-0.014) by suppression of non-ETHRA/CCAP neurons (D, bottom). Bar graphs show average phase durations ± standard deviations, (N in parentheses). (E) Hierarchical organization of the pupal ecdysis circuit. Each layer in the network hierarchy (red) is the target of one of the ecdysis hormones (blue), as defined by expression of its receptor. The most important component of the input layer, ETHRA/CCAP, participates in regulating all three behavioral phases and is the source of CCAP and Bursicon. Bursicon’s receptor, Rk, defines a central pattern generating layer, which sends output to a population of motor neurons that express the receptor for CCAP and are required for the ecdysis sequence. Solid arrows indicate demonstrated functional connections, while gray, dashed arrows indicate hypothesized connections. Although the detailed mechanisms governing motor program progression remain to be determined, those that promote Phase II negatively regulate Phase I and positively regulate Phase III.
Videos
Video 1
The pupal ecdysis sequence and its constituent motor programs.
Video speed: 20X.
Video 2
Activating ETHRA/CCAP neurons terminates execution of the Phase I motor pattern and induces Phase II.
ETHRA/CCAP neurons were activated using UAS-dTRPA1 by a one minute temperature shift to 29°C, followed by a return to 18°C. Video speed: 20X.
Video 3
Suppressing Rk- or CCAP-R-expressing neurons using UAS-Kir2.1 impairs pupal ecdysis behavior.
Shown are pupae in which: CCAP-R-expressing neurons (left), Rk-expressing neurons (right), or no neurons (middle) are suppressed. Video speed: 20X.
Video 4
Ca++activity in body wall muscles during pupal ecdysis.
GCaMP6s was expressed in muscle using the 24B-Gal4 driver. Solid line indicates boundary of the pupal case below the head. A non-muscle, ETH-induced signal in the salivary glands is also visible. Video record: total time, 45 min collected at 1 Hz; video speed: 20X.
Video 5
ETH-induced activity in VNC-Rk neurons oscillates across the midline during Phase 2.
Video record: collected at 1 Hz; video speed: 50X.
Video 6
ETH-induced activity in VNC-Rk neurons during Phase 3.
Video record: collected at 1 Hz; video speed: 50X.
Video 7
ETH-induced activity in VNC-Rk neurons during Phase 1.
Video record: total time 90 min, collected at 1 Hz; video speed: 50X.
Video 8
Suppressing ETHRB expressing neurons using UAS-Kir2.1 eliminates pre-ecdysis behavior.
Right: pupa in which ETHRB-expressing neurons are suppressed. Left: unsuppressed control animal. Video speed: 30X
Video 9
Suppressing non-CCAP/ETHRA neurons shortens Phase I behavior.
Left: pupa in which non-CCAP/ETHRA neurons are suppressed. Right: unsuppressed control animal. Video speed: 30X.
Tables
Key resources table
| Reagent type (species) or resource | Designation | Source or reference | Identifiers | Additional information |
|---|---|---|---|---|
| Genetic reagent (D. melanogaster) | ETHRB-Gal4 (ETHRBMI00949-Gal4) | Diao et al. (2016) (doi: 10.1534/genetics.115.182121) | N/A | |
| Genetic reagent (D. melanogaster) | ETHRA-Gal4 (ETHRAMI00949-Gal4) | Diao et al. (2016) (doi: 10.1534/genetics.115.182121) | N/A | |
| Genetic reagent (D. melanogaster) | ETHRA-p65AD (ETHRAMI00949-p65AD) | Diao et al. (2016) (doi: 10.1534/genetics.115.182121) | N/A | |
| Genetic reagent (D. melanogaster) | ETHRB-p65AD | This paper | N/A | Split Gal4 hemidriver |
| Genetic reagent (D. melanogaster) | CCAP-R-Gal4 (CCAP-RMI05804-GAL4) | Diao et al. (2015) (doi: 10.1016/j.celrep.2015.01.059) | N/A | |
| Genetic reagent (D. melanogaster) | CCAP-R-Gal4DBD (CCAP-RMI05804-GAL4DBD) | This paper | N/A | Split Gal4 hemidriver |
| Genetic reagent (D. melanogaster) | CCAPR-p65AD (CCAP-RMI05804-p65AD) | This paper | N/A | Split Gal4 hemidriver |
| genetic reagent (D. melanogaster) | CCAP-Gal4DBD | Luan et al. (2006b) (PMID: 17088209) | N/A | |
| Genetic reagent (D. melanogaster) | Burs-LexA::VP16AD | This paper | N/A | LexA driver |
| Genetic reagent (D. melanogaster) | RK-Gal4 (Rkpan-Gal4) | Diao and White (2012) (doi: 10.1534/genetics.111.136291) | N/A | |
| Genetic reagent (D. melanogaster) | RK-Gal4DBD (RkTGEM-Gal4DBD) | This paper | N/A | Split Gal4 hemidriver |
| Genetic reagent (D. melanogaster) | RK-p65AD (RkTGEM-p65AD) | This paper | N/A | Split Gal4 hemidriver |
| Genetic reagent (D. melanogaster) | RK- LexA::QFAD (RkTGEM- LexA::QFAD) | This paper | N/A | Split Gal4 hemidriver |
| Genetic reagent (D. melanogaster) | VGlut-LexA::QFAD (VGlutMI04979-LexA::QFAD) | Diao et al. (2015) (doi: 10.1016/j.celrep.2015.01.059) | N/A | |
| Genetic reagent (D. melanogaster) | VGlut-Gal4DBD (VGlutMI04979-Gal4DBD) | Diao et al. (2015) (doi: 10.1016/j.celrep.2015.01.059) | N/A | |
| Genetic reagent (D. melanogaster) | UAS-GCaMP6S, insertions on Chromosomes II and III | Bloomington Drosophila Stock Center (BDSC) | 42746; 42749 | |
| Genetic reagent (D. melanogaster) | UAS-Kir2.1 insertions on Chromosomes II and III | Bloomington Drosophila Stock Center | 6596 | |
| Genetic reagent (D. melanogaster) | UAS-dTrpA1 | other | BDSC 26263 | Paul Garrity, Brandeis |
| Genetic reagent (D. melanogaster) | tubP-Gal80ts-20 | Bloomington Drosophila Stock Center | 7019 | |
| Genetic reagent (D. melanogaster) | UAS-P2X2 | other | N/A | Orie Shafer, Univ. of Michigan |
| Genetic reagent (D. melanogaster) | MiMIC CCAP-R[MI05804] | Bloomington Drosophila Stock Center | BDSC 40788 | |
| Genetic reagent (D. melanogaster) | UAS-6XEGFP on II and III | Bloomington Drosophila Stock Center | 52261; 52262 | |
| Genetic reagent (D. melanogaster) | UAS-6XmCherry on III | Bloomington Drosophila Stock Center | 52268 | |
| Genetic reagent (D. melanogaster) | 24B (How)-Gal4 | Bloomington Drosophila Stock Center | 1767 | |
| Genetic reagent (D. melanogaster) | {nosCas9} attP2 line | Ren et al. (2013) (doi: 10.1073/pnas.1318481110) | ||
| Genetic reagent (D. melanogaster) | W1118 | other | White lab stock | |
| Antibody | Rabbit polyclonal anti-pBurs | other | N/A | Aaron Hsueh/Willi Honegger, Used at 1:1000 |
| Antibody | Alexafluor555-conjugated guinea pig anti-mouse | Invitrogen | 1789887 | |
| Recombinant DNA reagent | U6b-sgRNA-short plasmid | Ren et al. (2013) (doi: 10.1073/pnas.1318481110) | ||
| Recombinant DNA reagent | pT-GEM(1) plasmid | Diao et al. (2015) (doi: 10.1016/j.celrep.2015.01.059) | ||
| Recombinant DNA reagent | pCAST-BursGal4DBD | Luan et al. (2012) (doi: 10.1523/JNEUROSCI.3707–11.2012) | ||
| Recombinant DNA reagent | pBS-KS-attB-SA-SD-0- T2A-P65AD vector | Diao et al. (2015) (doi: 10.1016/j.celrep.2015.01.059) | ||
| Recombinant DNA reagent | pBS-KS-ETHRMI00949- T2A-p65AD in 4B | This paper | See Supplementary file 1 | |
| Sequence-based reagent | guide RNA oligos for Rk gene: ttcgTAAGTGAACCTTCAATGTCT; aaacAGACATTGAAGGTTCACTTA | Integrated DNA Technologies, Inc. | N/A | |
| Sequence-based reagent | PCR primers for Rk left homology arm: acccaccggaccggtgcatgCAAC CTCGACCCTTCAGTTCC; GACCTGGGGCGGCCGCG ctagacattgaaggttcacttac; | Integrated DNA Technologies, Inc. | N/A | |
| Sequence-based reagent | PCR primers for Rk right homology arm: cctgggggcgcgccggtacGGTA ATATTACATTAATTATTCTAAC; GAACCTCCCCACTAGTG gagaaagggattgcagcaac; | Integrated DNA Technologies, Inc. | N/A | |
| Sequence-based reagent | Drosophilized LexA::VP16AD construct | Epoch Life Science, Inc. | N/A | |
| Sequence-based reagent | PCR primers for T2A-P65AD forward: cgcgccagcaagatcgaggg ccgcggcagcctg PCR primers for T2A-P65AD reverse: atgggattcagatcttta cttgccgccgcccag | Integrated DNA Technologies, Inc. | N/A | |
| Peptide, recombinant protein | Ecdysis Triggering Hormone 1 (ETH1) | GenScript | P11731308 | |
| Commercial assay or kit | ||||
| Chemical compound, drug | Alexa Fluor 594 Phalloidin | ThermoFisher, Scientific | A12381 | |
| Chemical compound, drug | ATP | Sigma | A9187 | |
| Software, algorithm | PhaseFinder | This paper | https://github.com/BenjaminHWhite/PhaseFinder | Detects pupal ecdysis Phases in Ca++ activity records |
Additional files
-
Supplementary file 1
Fly genotypes used listed by figure.
- https://doi.org/10.7554/eLife.29797.023
-
Supplementary file 2
Sequences of DNA constructs used to make ETHRB-p65AD and Burs-LexA::VP16AD lines.
- https://doi.org/10.7554/eLife.29797.024
-
Transparent reporting form
- https://doi.org/10.7554/eLife.29797.025
Download links
A two-part list of links to download the article, or parts of the article, in various formats.
Downloads (link to download the article as PDF)
Open citations (links to open the citations from this article in various online reference manager services)
Cite this article (links to download the citations from this article in formats compatible with various reference manager tools)
Neuromodulatory connectivity defines the structure of a behavioral neural network
eLife 6:e29797.
https://doi.org/10.7554/eLife.29797


