Hsp70-associated chaperones have a critical role in buffering protein production costs
- Biological Research Centre of the Hungarian Academy of Sciences, Hungary
- Bay Zoltán Nonprofit Ltd, Hungary
Figures
Figure 1 with 1 supplement
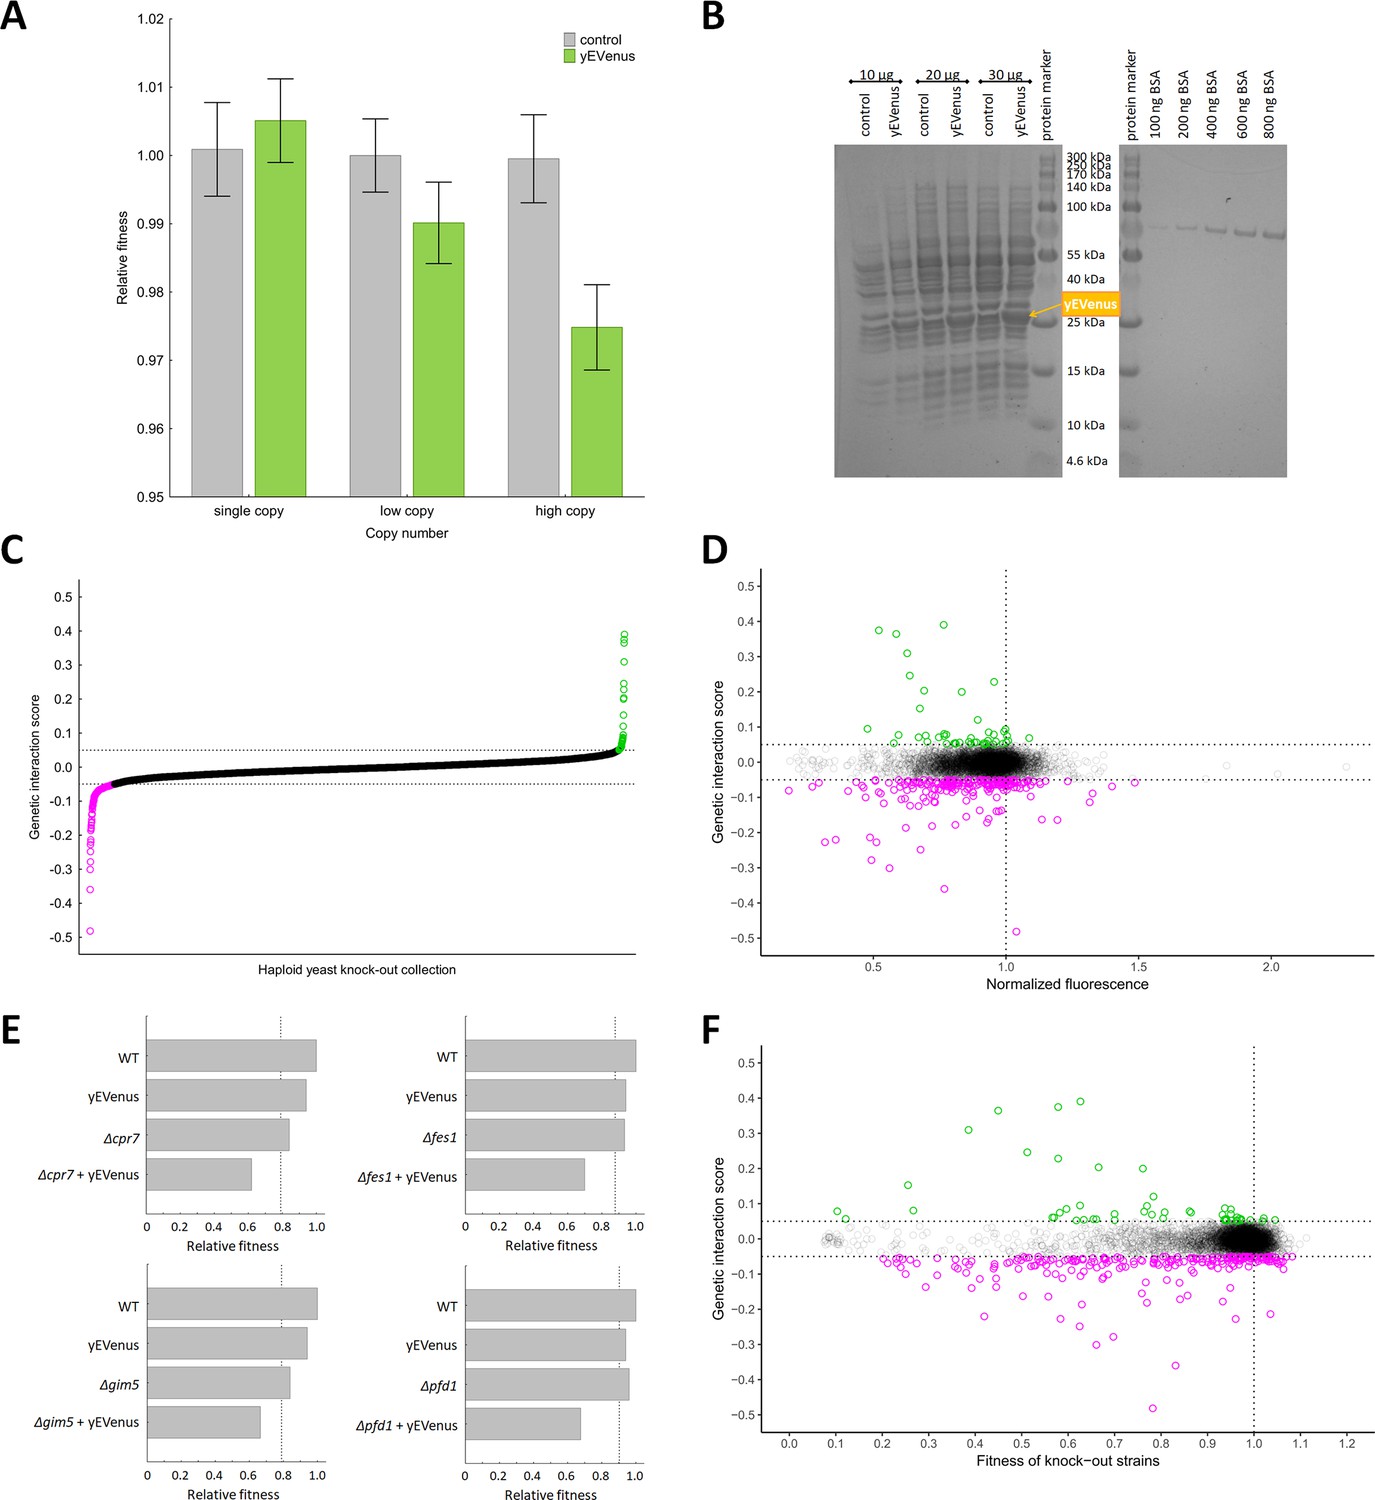
Genetic perturbation analyses.
(A) Protein burden changes with copy number. The bar plot shows the relative fitness of yEVenus overexpressing and control genotypes as a function of plasmid copy number, a proxy of gene expression level. From a single copy plasmid, yEVenus has no detectable fitness cost (t-test, p=not significant), while it confers around 2.5% fitness disadvantage from a high-copy plasmid (t-test, p<0.001). Absolute fitness was estimated by measuring colony size after 48 hr of growth on solid medium. Relative fitness was calculated by normalizing to the absolute fitness of the genotypes with the corresponding empty vectors, respectively. The bars indicate mean ±95% confidence interval, based on at least 12 technical and 10 biological replicates each. Source file is available as Supplementary file 5. (B) PAGE analysis of whole cell protein extracts. The figure shows the PAGE (polyacrylamide gel electrophoresis) separation of whole cell protein extracts (10 µg, 20 µg, and 30 µg) from both the control and the yEVenus overexpressing strains in denaturing conditions (4–20% gradient Tris-Glycine SDS-PAGE). To create a standard curve, a bovine serum albumin (BSA) dilution series (100–800 ng) was loaded onto the same gel. On the basis of a densitometry analysis using the standard curve, the yEVenus (band at 27 kDa) constitutes 3.7% of the total cellular proteome when expressed from a high-copy plasmid (for further details, see Materials and methods). (C) Distribution of genetic interaction scores (ε) across the haploid yeast knock-out collection. The ε value for the vast majority of the knock-out strains is approximately zero, indicating no specific genetic interaction of the corresponding gene with yEVenus overexpression. The dashed lines on the y axis represent cutoff values for ε (0.05 and −0.05, respectively). Negative/positive interactions are color-coded as magenta/green. For the calculation of genetic interaction score, see Materials and methods. Source file is available as Supplementary file 1. (D) Scatterplot of the genetic interaction scores and biomass-normalized fluorescence levels of the deletion strains from the haploid yeast knock-out collection. On the x axis, one represents the wild type fluorescence level (dashed line). The dashed lines on the y axis represent the previously defined interaction value cutoffs (0.05 and −0.05, respectively). The fluorescence level of the genotypes shows only very weak correlation with the strength of the interaction (Pearson’s correlation test, r = 0.05, p<0.001). Negative/positive interactions are color-coded as magenta/green. For the calculation of genetic interaction score and for the evaluation of fluorescence level, see Materials and methods. Source file is available as Supplementary file 1. Additional analysis of genetic interaction scores and fluorescence levels are shown in Figure 1—figure supplement 1A and B. (E) Examples on negative genetic interactions between single gene deletions and yEVenus overexpression. The bar plots show the relative fitness values (normalized to wild type) of single mutants (yEVenus overexpression or single gene deletions), and double mutants (deletion +yEVenus overexpression), based on six replicates. Negative deviation of the observed double mutant fitness from the expected value (designated as dashed line, calculated by the multiplicative model using the two single mutant fitness values) is referred to as negative interaction. Absolute fitness was estimated by measuring colony size after 48 hr of growth on solid medium. The deleted genes (Δcrp7, Δfes1, Δgim5, Δpfd1) are selected members of the chaperone system. Source file is available as Supplementary file 1. An example of positive genetic interaction is shown in Figure 1—figure supplement 1C. (F) Scatterplot of the genetic interaction scores and the fitness of the deletion strains from the haploid yeast knock-out collection. On the x axis, one represents the wild type fitness (dashed line). The dashed lines on the y axis represent the previously defined interaction value cutoffs (0.05 and −0.05, respectively). Negative/positive interactions are color-coded as magenta/green. The fitness of the deletion strains shows only a weak positive correlation with the strength of interaction (Pearson’s correlation test, r = 0.12, p<0.001). For the calculation of fitness and genetic interaction score, see Materials and methods. Source file is available as Supplementary file 1.
Figure 1—figure supplement 1
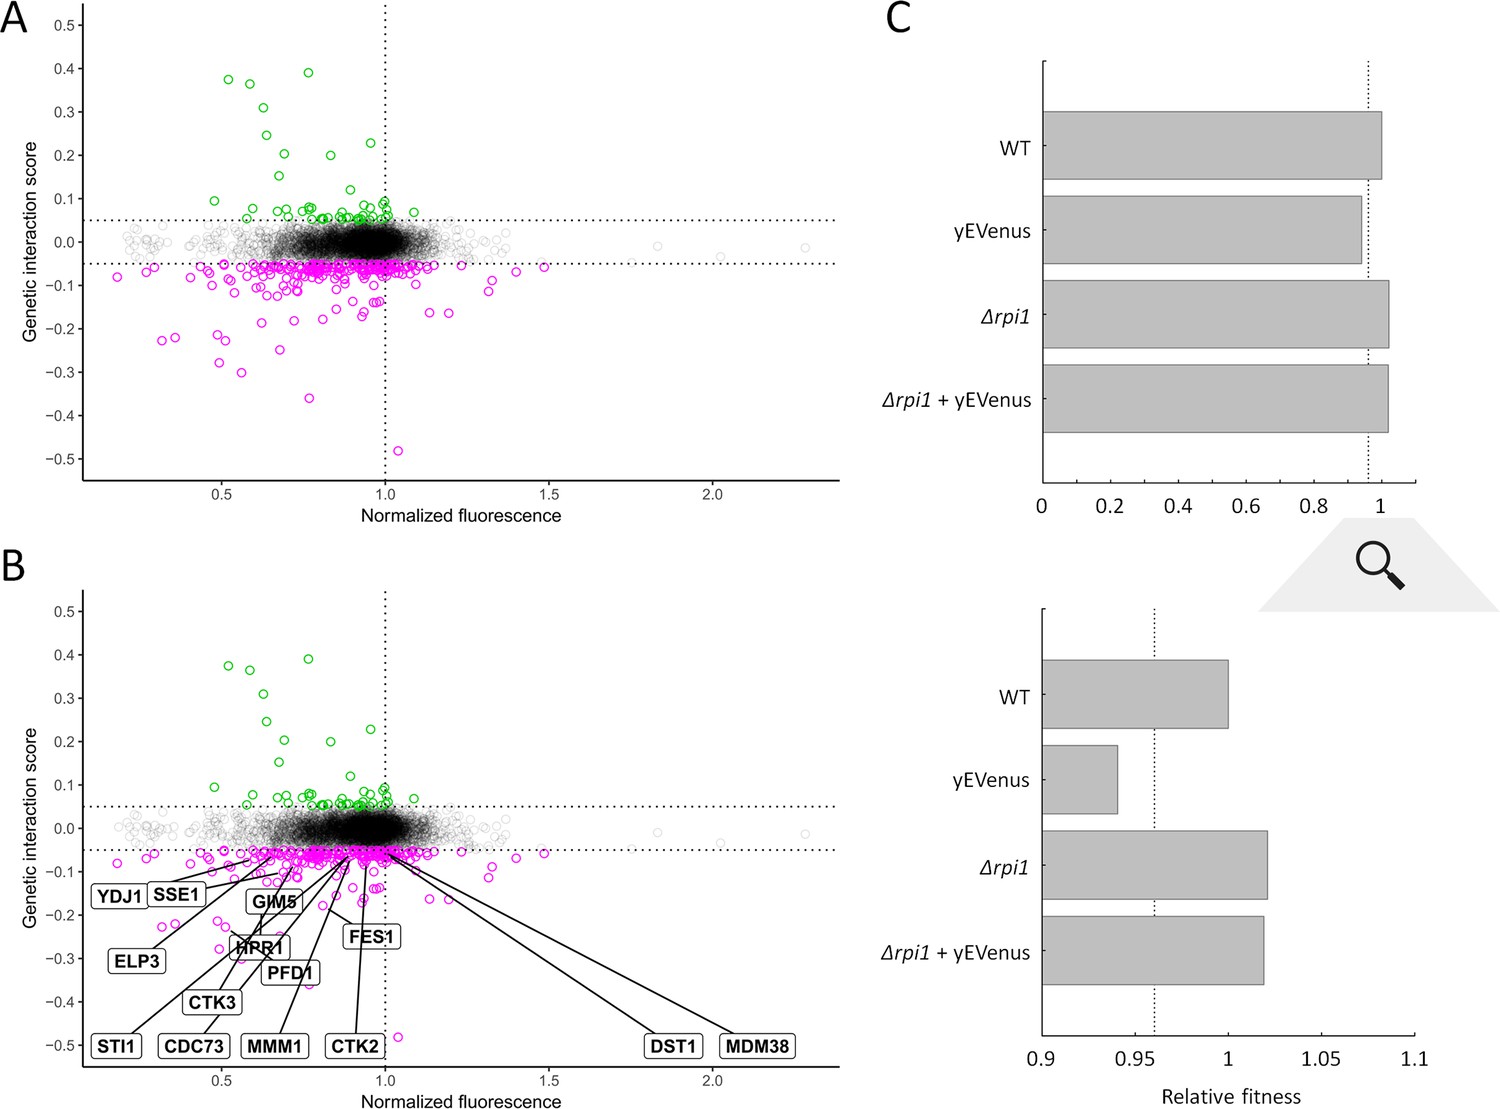
Additional analyses of the genetic interaction screen.
(A) Scatterplot of the genetic interaction scores and biomass-normalized fluorescence levels using knock-out strains with wild type cell size only. A prior systematic study (Jorgensen et al., 2002) classified the yeast knock-out collection into three mains classes: genotypes with large, small and normal (i.e. wild type) cell sizes, respectively. Using data from Figure 1D, we focused on genotypes with normal cell size only. Reassuringly, the correlation between genetic interaction score and biomass normalized fluorescence remains very weak and non-significant (Pearson’s correlation test: r = 0.035, p=0.02, blue line represents linear regression line). As a final test, we used another systematic data set that treats knock-out cell size as a continuous variable (Ohya et al., 2005). Partial correlation analysis revealed no significant correlation between genetic interaction score and biomass normalized fluorescence (adjusted R2 = 0.0031) after control for cell size. Negative/positive interactions are color-coded as magenta/green. For the calculation of genetic interaction score and for the evaluation of fluorescence level, see Materials and methods. Source file is available as Supplementary file 1. (B) Scatterplot of the genetic interaction scores and biomass-normalized fluorescence levels of the deletion strains from the haploid yeast knock-out collection. Genotypes with impairment in protein folding (FES1, SSE1, STI1, YDJ1, PFD1, GIM5), transcriptional processes (HPR1, DST1, CDC73, ELP3), translational fidelity (CTK2, CTK3), and mitochondrial processes (MMM1, MDM38) are marked. On the x axis, 1 represents the wild type fluorescence level (dashed line). The dashed lines on the y axis represent the previously defined interaction value cutoffs (0.05 and −0.05, respectively). Negative/positive interactions are color-coded as magenta/green. For the calculation of genetic interaction score and for the evaluation of fluorescence level, see Materials and methods. Source file is available as Supplementary file 1. (C) An example on positive genetic interaction between single gene deletion and yEVenus overexpression. The bar plots show the relative fitness values (normalized to wild type) of single mutants (yEVenus overexpression or Δrpi1), and double mutants (Δrpi1 + yEVenus overexpression), based on 6 replicates. The deleted gene (RPI1) is Ras-cAMP pathway inhibitor. Positive deviation of the observed double mutant fitness from the expected value (designated as dashed line, calculated by the multiplicative model using the two single mutant fitness values) is referred to as positive interaction. The bottom panel shows the same data after zooming into the 0.9–1.1 relative fitness range. Absolute fitness was estimated by measuring colony size after 48 hr of growth on solid medium. Source file is available as Supplementary file 1.
Figure 2
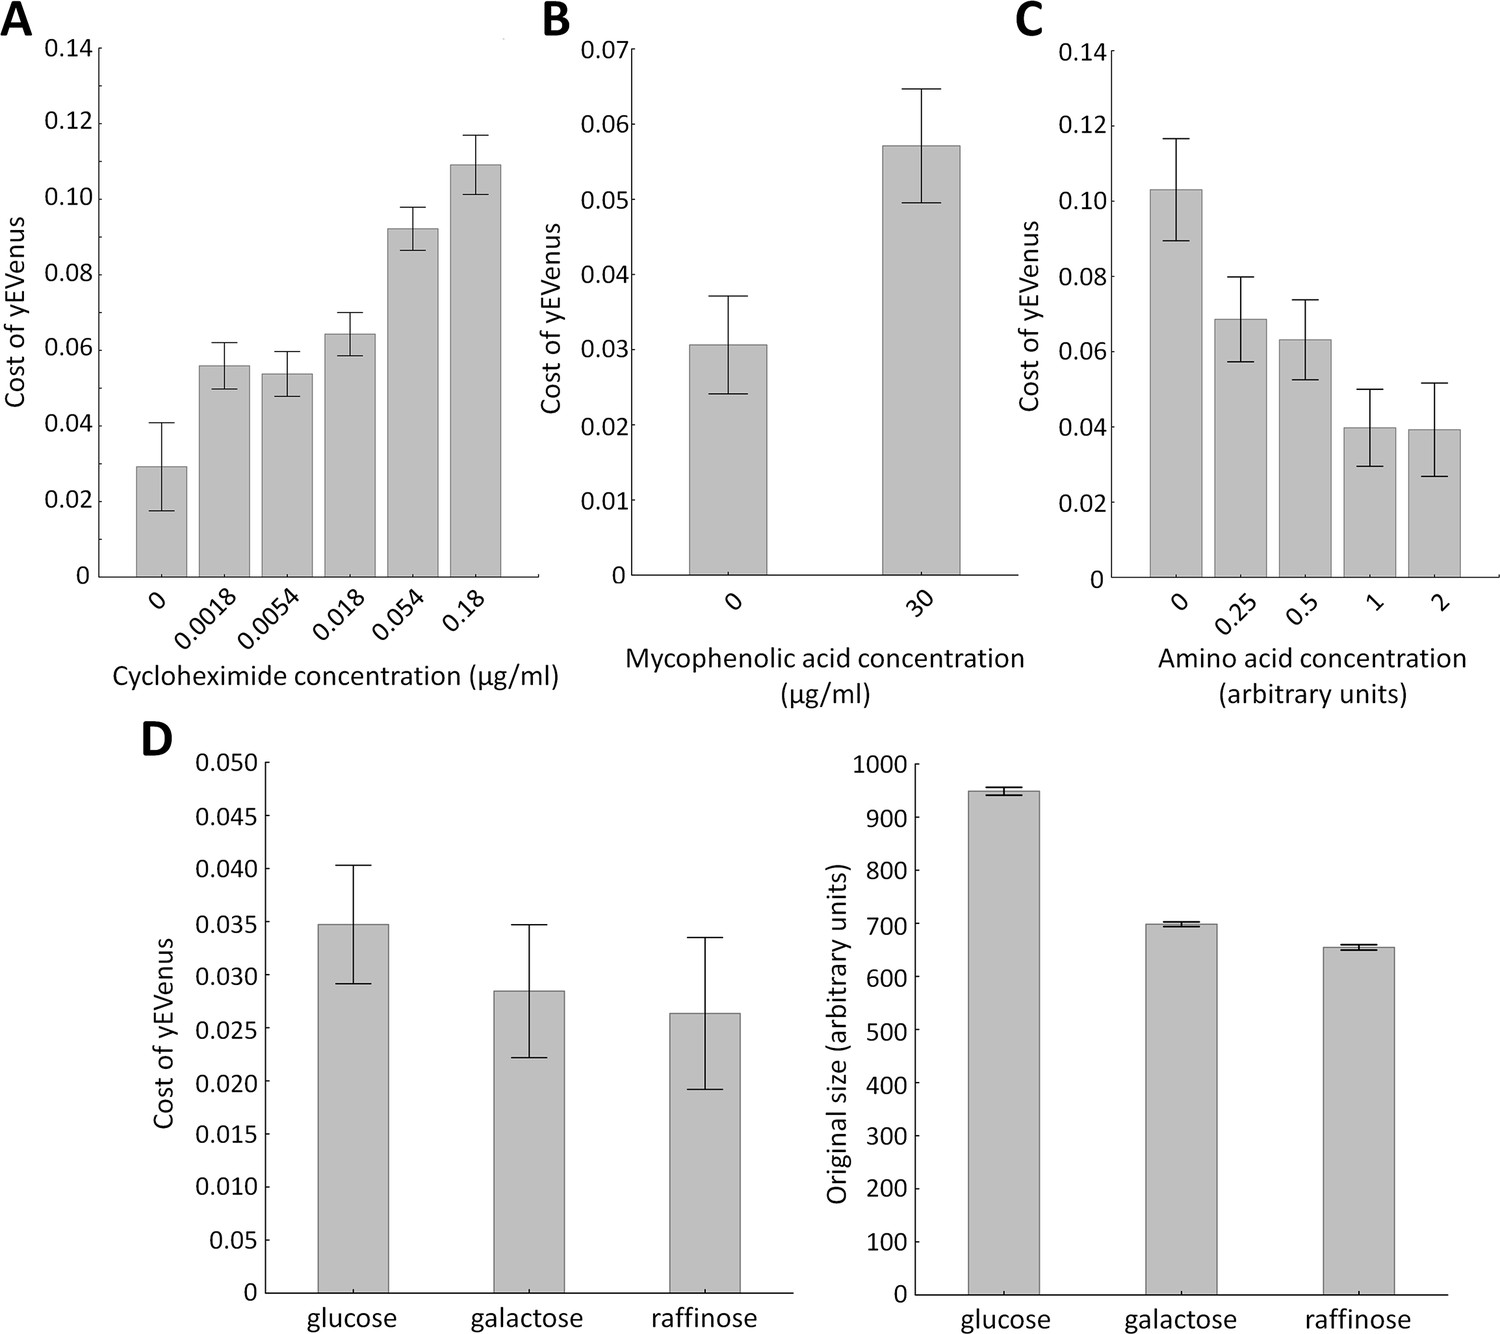
Environmental screens under protein burden.
(A) Impact of translation inhibition on protein burden in wild type yeast. The bar plot shows the cost of yEVenus in wild type strain as a function of increasing cycloheximide concentration. Cycloheximide is a widely used chemical agent to inhibit translation. Treatment of cells with sub-inhibitory concentration (0.18 µg/ml) of this chemical agent leads to a 3.7-fold increase in protein burden (t-test, p<0.001). For the calculation of fitness cost of yEVenus, see Materials and methods. The bars indicate mean ±95% confidence interval, based on four technical measurements of 17 biological replicates for each concentration. Source file is available as Supplementary file 5. (B) Impact of transcription inhibition on protein burden in wild type yeast. The bar plot shows the cost of yEVenus in wild type strain in response to mycophenolic acid (MPA) stress. MPA is a well-known transcription elongation inhibitor. Treatment of cells with sub-inhibitory concentration (30 µg/ml) of this chemical agent leads to a two-fold increase in protein burden (Mann Whitney U-test, p<0.001). For the calculation of fitness cost of yEVenus, see Materials and methods. The bars indicate mean ±95% confidence interval, based on at least 12 technical measurements of 15 biological replicates for each concentration. Source file is available as Supplementary file 5. (C) Impact of amino acid availability on protein burden. The bar plot shows the cost of yEVenus in wild type strain as a function of amino acid concentration. Auxotrophic amino acids were supplied at normal concentration to the medium, while non-auxotrophic amino acids were serially diluted from the regular one. Arbitrary units are relative concentrations normalized to the regular amino acid level. Total depletion of non-essential amino acids (0 arbitrary unit) from the growth medium resulted in a 2.5-fold increase in protein burden, compared to the regular one (t-test, p<0.001). For the calculation of fitness cost of yEVenus, see Materials and methods. The bars indicate mean ±95% confidence interval, based on at least five technical measurements of 12 biological replicates for each condition. Source file is available as Supplementary file 5. (D) The impact of protein burden across different carbon sources. The left panel shows the cost of yEVenus in wild type strain on different carbon sources. The right panel shows the absolute fitness (arbitrary units estimated by measuring colony size on solid agar media) of the yEVenus overexpressing wild type strain on different carbon sources. Growth media with alternative carbon sources (respirato-fermentative galactose, respirative raffinose) led to a reduction of absolute fitness by 27–32% (right panel, t-test, p<0.001), compared to that on the standard carbon source (fermentative glucose). However, the relative fitness cost of yEVenus overexpression (left panel) was not affected by the change of carbon source. Specifically, the cost of yEVenus on glucose is comparable to that on galactose (t-test, p=0.14) or raffinose (t-test, p=0.07). For the calculation of absolute fitness and fitness cost of yEVenus, see Materials and methods. The bars indicate mean ±95% confidence interval, based on at least 12 technical measurements of 15 biological replicates for each of the genotype. Source file is available as Supplementary file 5.
Figure 3 with 1 supplement
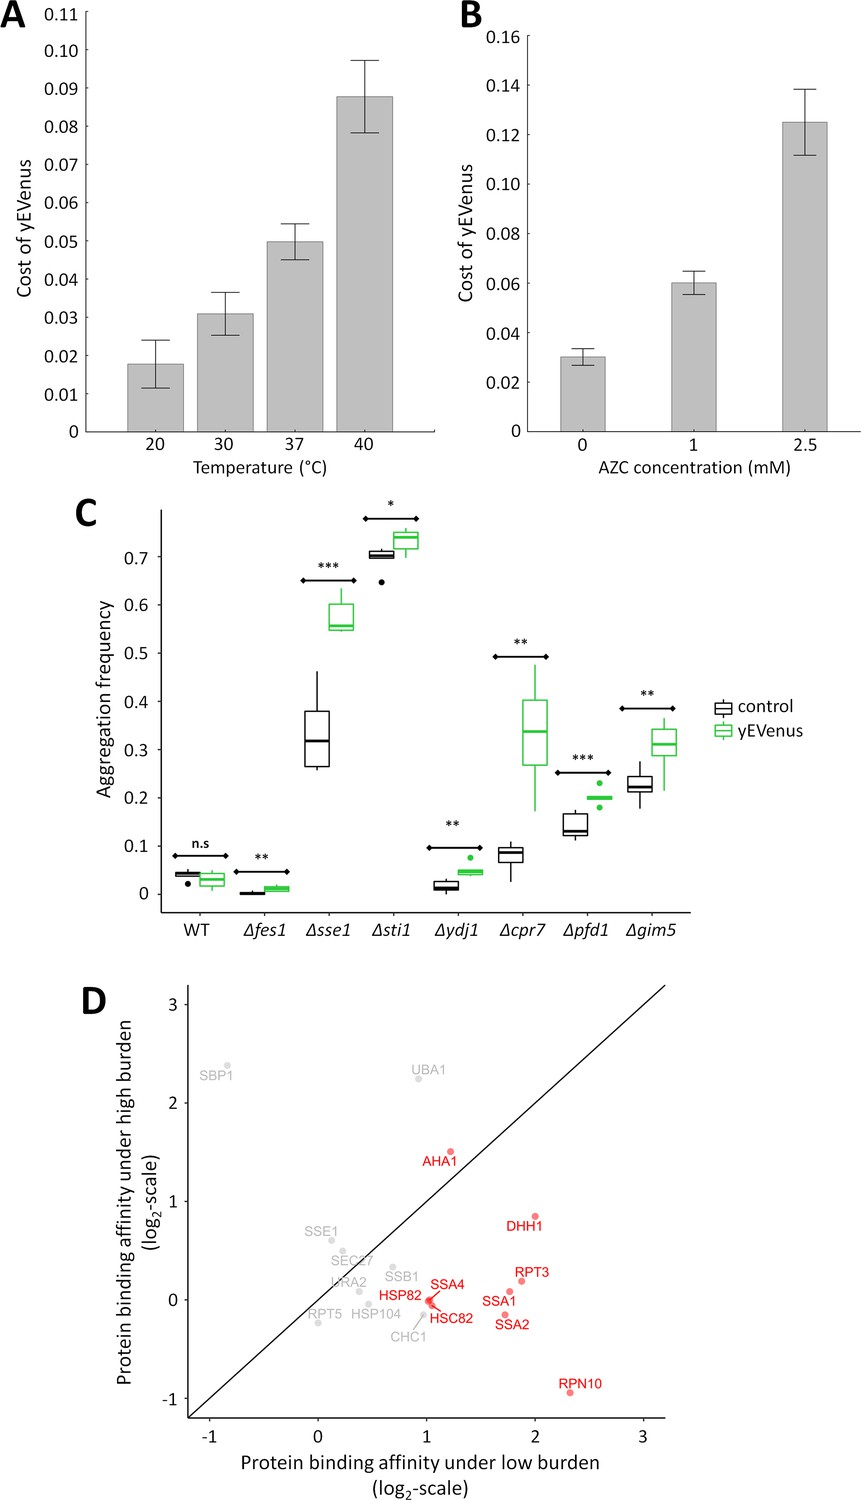
Link between protein burden and proteotoxic stress.
(A) Impact of heat stress on protein burden. The bar plot shows the fitness cost of yEVenus in wild type strain as a function of increasing temperature. Protein burden significantly increased with rising temperature, resulting in a 2.8-fold difference when colonies were subjected to 40°C, in comparison to the optimal incubation temperature (30°C; t-test, p<0.001) The bars indicate mean ±95% confidence interval, based on at least 12 technical measurements of 15 biological replicates for each condition. Source file is available as Supplementary file 5. Additional analysis of protein burden across five different yEVenus plasmids are shown in Figure 3—figure supplement 1A–C (B) Impact of proteotoxic stress on protein burden. The bar plot shows the fitness cost of yEVenus in wild type strain as a function of azetidine-2-carboxylic acid (AZC) concentration. AZC is a toxic analog of proline, incorporation of this compound into newly synthesized proteins leads to misfolding in consequence of reduced protein stability. Incubation with sub-lethal dosage of AZC (2.5 mM) leads to a more than 4-fold increase in protein burden (t-test, p<0.001). For the calculation of fitness cost of yEVenus, see Materials and methods. The bars indicate mean ±95% confidence interval, based on at least 12 technical measurements of 15 biological replicates for each concentration. Source file is available as Supplementary file 5. (C) Protein aggregation propensity in yEVenus overexpressing genotypes. The bar plot shows the aggregation frequency in the wild type and in four deletion mutant strains, with (yEVenus) or without (control) protein burden. The deleted genes are selected members of the chaperone system. Protein burden by yEVenus promotes protein aggregation further in the chaperone deficient backgrounds. Aggregation frequency is 5–670% larger in the chaperone deletion mutants under protein burden, in comparison with the corresponding isogenic control strain with empty vector, respectively. The aggregation propensity in the wild type is at the same level either with or without protein burden. The frequency of cells with aggregated foci corresponds to the level of protein aggregation. Aggregation frequency was calculated as follows: the number of cells containing fluorescent foci was divided by the number of fluorescent cells in total, monitoring at least 2000 cells. For further details, see Materials and methods. The bars indicate mean ±95% confidence interval, based on at least five technical measurements for each of the genotype. Student t-test was used to assess difference in aggregation frequency between control and yEVenus overexpressing genotypes. */**/*** indicates p<0.05/0.01/0.001; n.s indicates p=not significant. Source file is available as Supplementary file 5. Representative images of VHL-mCherry localization in yeast cells are shown in Figure 3—figure supplement 1D. (D) Changes of Sti1p interaction partners in response to protein burden. The figure shows the scatterplot of the log(2) protein-binding affinity of 18 putative interaction partners (Cherry et al., 2012) of Sti1p under low- and high protein burden, respectively. Protein-binding affinity to Sti1p was estimated by calculating the peptide count fold change of Sti1p IP samples relative to the negative control IP samples both under low and high protein burden (see Materials and methods). The red points mark proteins that specifically associate with Sti1p under low protein burden. The continuous line represent x = y. Source file is available as Supplementary file 4.
Figure 3—figure supplement 3
Additional investigation of protein burden across different yEVenus plasmids and different chaperone-deficient mutants.
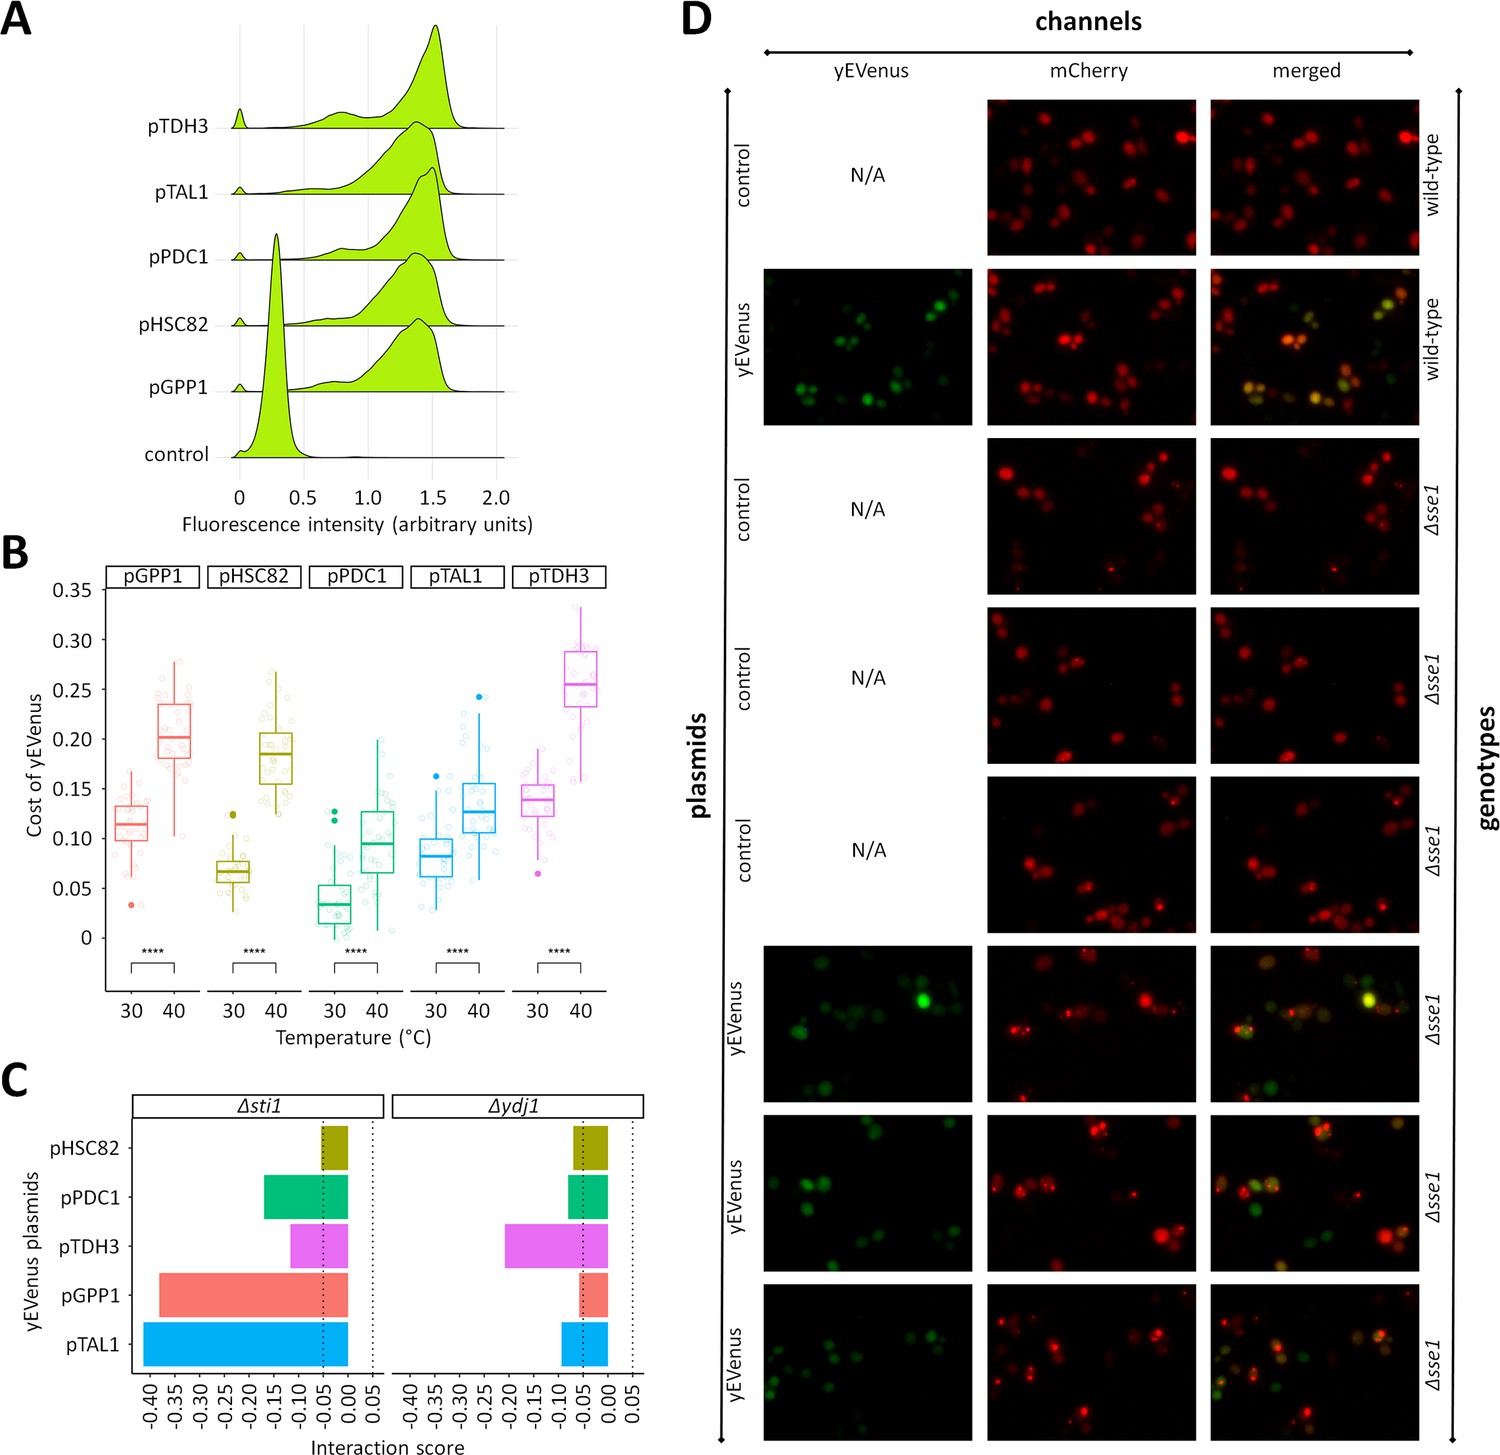
(A) Monitoring yEVenus fluorescence intensity in wild type cells across five different yEVenus plasmids. The figure shows fluorescence histograms of wild type cells with different plasmids. The plasmids differ only in the exact promoter used for the control of yEVenus expression The control plasmid did not contain the yEVenus coding sequence. Flow cytometry was used to establish the fluorescence level of wild type yeast overexpressing yEVenus under the control of different promoters. Single yeast colonies were picked from agar plates and incubated in liquid leucine-dropout SC-MSG medium. After reaching stationary phase, 1% of the population was serially transferred into fresh synthetic drop-out medium. Cell cultures from the exponential phase were diluted to approximately 5 × 10² cells/ml, and fluorescence intensity values (logarithmic scale) were estimated by a Guava flow cytometer. Gating was applied based on forward scatter data (logarithmic scale), to exclude extrinsic noise. During each run, a minimum of 5000 events were recorded. Fluorescence was calculated by normalizing the measured fluorescent intensity to the forward scatter values (both log10-scaled). The fluorescence histograms are based on eight biological replicates for each plasmid. Source file is available as Supplementary file 5. (B) Protein burden as a function of temperature across five different yEVenus plasmids. The plasmids differ only in the exact promoter used for the control of yEVenus expression. Regardless of the plasmids employed, protein burden increased significantly with rising temperature. Center lines indicate the median of yEVenus cost based on four technical measurements of 10 biological replicates for each plasmid. Student’s t-test was used to assess cost difference between 30°C and 40°C. **** indicate p<0.0001. Source file is available as Supplementary file 5. (C) Genetic interactions between single gene deletions and yEVenus overexpression. The bar plot shows the interaction score of central regulators (STI1 and YDJ1) of the Hsp70 complex across five different yEVenus plasmids. The plasmids differ only in the exact promoter (pTDH3, pPDC1, pHSC82, pGPP1, pTAL1) used for the control of yEVenus expression. The dashed lines on the x axis represent the previously defined interaction value cutoffs (0.05 and −0.05, respectively). Although there are some variations in the quantitative values of the interaction score, the overall negative sign remains. Source file is available as Supplementary file 2. (D) Representative images of VHL-mCherry localization in yeast cells (wild type and Δsse1) with (yEVenus plasmid) and without (control plasmid) protein burden. Cell fluorescence was detected by high content microscopy (Operetta, Perkin Elmer), using 60x high numerical aperture objective and the following filter sets: mCherry channel (excitation: 560–580 nm, emission: 590–640 nm) and yEVenus channel (excitation: 490–510 nm, emission: 520–560 nm). N/A indicates not available microscopic image from the given channel.
Figure 4

Overview of the proteostasis network.
Malfunction of the protein quality control system impairs the proteome balance by driving cellular proteins into toxic metastable (partially folded or misfolded) conformations from their correctly folded native state (Balchin et al., 2016). Accumulation of these folding intermediates could further overload this surveillance system and could lead to the collapse of the proteostasis network. Hypothetically, overexpression of a gratuitous protein (such as the yEVenus) might not be tolerated in a misfolding sensitized background, as it could add an extra-layer of threat to the cell. Our genome-wide genetic interaction screen (SGA) revealed the importance of a central regulatory complex to buffer overexpression costs. This complex maintains the normal activity of the Ssa chaperones (members of the Hsp70 family) that act on misfolded proteins. In addition, one member of this complex also acts on the ribosome-associated complex (RAC). Inactivation of the constituent members (Hsp70-90 scaffold Sti1p, Hsp40-Ydj1p, NEF-Sse1p, and NEF-Fes1p, color-coded as red) of this complex exacerbated the cost of yEVenus overexpression. In such genetic backgrounds, the clearance of misfolded proteins by protein refolding or proteasomal degradation is affected. In agreement with the genetic perturbation screen, conditional induction of proteotoxic stress in the yEVenus overexpressing wild type strain also exaggerated the cost of the overexpression. Remarkably, based on physical interaction assays, we found evidences that protein burden perturbs the interaction network of Sti1p, putatively leading to a dysfunctional Hsp70-Hsp90 chaperone complex. As a consequence, downregulation of the proteostasis network is expected, which would have serious fitness consequences in times of proteotoxic stress.
Tables
Table 1
Functional enrichment analysis of genes showing synergistic interactions with yEVenus overexpression.
At an ε = - 0.05 cutoff value (and using a p<0.05 cutoff based on bootstrapping), 184 genes showed negative interactions with yEVenus. This gene set was tested for GO Slim category enrichment. A GO category was termed as enriched significantly, if the genes annotated to a particular GO term were significantly overrepresented (Fisher's exact test, odds ratio >1, p<0.05, FDR-corrected p<0.1) in the given gene set using the complete list of screened genes as background. N indicates the number of negative interacting genes belonging to the corresponding GO Slim category. Source file is available as Supplementary file 1.
| Go.id | Term | N | Odds ratio | P value | FDR corrected P value |
|---|---|---|---|---|---|
| GO:0002181 | cytoplasmic translation | 11 | 2.27 | 1.52E-02 | 1.69E-01 |
| GO:0006325 | chromatin organization | 15 | 1.70 | 4.65E-02 | 2.93E-01 |
| GO:0006353 | DNA-templated transcription, termination | 3 | 4.17 | 4.60E-02 | 2.93E-01 |
| GO:0006354 | DNA-templated transcription, elongation | 16 | 8.43 | 2.73E-09 | 2.73E-07 |
| GO:0006360 | transcription from RNA polymerase I promoter | 6 | 5.86 | 1.24E-03 | 3.10E-02 |
| GO:0006366 | transcription from RNA polymerase II promoter | 29 | 2.29 | 2.01E-04 | 6.71E-03 |
| GO:0006397 | mRNA processing | 9 | 2.84 | 7.77E-03 | 1.11E-01 |
| GO:0006414 | translational elongation | 5 | 3.31 | 2.45E-02 | 2.34E-01 |
| GO:0006457 | protein folding | 10 | 3.06 | 3.26E-03 | 5.43E-02 |
| GO:0007005 | mitochondrion organization | 28 | 2.59 | 4.13E-05 | 2.07E-03 |
| GO:0009408 | response to heat | 7 | 3.17 | 1.05E-02 | 1.31E-01 |
| GO:0009451 | RNA modification | 7 | 2.53 | 2.91E-02 | 2.34E-01 |
| GO:0016570 | histone modification | 8 | 2.33 | 3.05E-02 | 2.34E-01 |
| GO:0032543 | mitochondrial translation | 12 | 2.96 | 1.78E-03 | 3.55E-02 |
| GO:0048308 | organelle inheritance | 5 | 3.23 | 2.68E-02 | 2.34E-01 |
Key resources table
| Reagent type (species) or resource | Designation | Source or reference | Identifiers | Additional information |
|---|---|---|---|---|
| Strain (Saccharomyces cerevisiae) | Y7092 | PMID: 16118434 | SGA query strain, mat alpha | |
| Other | non-essential gene deletion collection (BY4741, MATa) | PMID:12140549 | YSC1053 | Open BioSystem (Dharmacon) |
| Other | synthetic genetic array (SGA) technique | PMID: 16118434 | ||
| Software, algorithm | ImageJ software | PMID: 22930834 | RRID:SCR_003070 | |
| Software, algorithm | Gene Onthology term enrichment with topGO (version 2.28) | PMID: 16606683 | ||
| Software, algorithm | org.Sc.sgd.db (version 3.3.0) packages in R | Core Team, 2017 | http://www.R-project.org | |
| Software, algorithm | Machine learning-based phenotypic analysis | PMID: 21807964 | ||
| Software, algorithm | Advanced Cell Classifier | PMID: 28647475 | http://www.cellclassifier.org/ | |
| Software, algorithm | Proteome Discoverer (v 1.4) | Thermo Fisher Scientific (Germany) | ||
| Recombinant DNAreagent | pKT0090 plasmid | PMID: 15197731 | Addgene:Plasmid #8714 | contains yEVenus |
| Recombinant DNAreagent | YEplac181 plasmid | PMID: 3073106 | Addgene:Plasmid #8628 | high copy plasmid |
| Recombinant DNAreagent | YCplac111 plasmid | PMID: 3073106 | Addgene:Plasmid #53249 | single copy plasmid |
| Recombinant DNAreagent | pRS315 plasmid | PMID: 2659436 | ATCC 77144 | low copy plasmid |
| Recombinant DNAreagent | pFA6a-TEV-6xGly-3xFlag-HphMX plasmid | Tim Formosa | Addgene:Plasmid #44083 | |
| Recombinant DNAreagent | pGAL-VHL-mCherry | PMID: 18756251 | galactose inducible VHL-mCherry | |
| Commercial assayor kit | µMACS GFP Isolation Kit | Miltenyi Biotec (Germany) | 130-091-125 | |
| Commercial assayor kit | μMACS DYKDDDDK Isolation Kit | Miltenyi Biotec (Germany) | 130-101-591 | *DYKDDDDK is also known as FLAG tag |
Additional files
-
Supplementary file 1
Results of the Synthetic Genetic Array with yEVenus.
This file contains information of the Synthetic Genetic Array with yEVenus in single gene deletion backgrounds and was used to create the following figures/tables: Figure 1C, D, E and F, Figure 1—figure supplement 1 A–C, and Table 1.
- https://doi.org/10.7554/eLife.29845.010
-
Supplementary file 2
Genetic interaction screen using alternative promoters.
The table contains fitness and genetic interaction data of chaperone-deficient mutants overexpressing yEVenus driven by alternative promoters. This file contains the dataset used to create Figure 3—figure supplement 1C.
- https://doi.org/10.7554/eLife.29845.011
-
Supplementary file 3
Results of the GFP co-immunoprecipitation assay with yEVenus.
This file contains information of the GFP co-IP assay performed on the yEVenus overexpressing strain.
- https://doi.org/10.7554/eLife.29845.012
-
Supplementary file 4
Results of the Sti1p co-immunoprecipitation assay.
This file contains information of the Sti1p co-IP assay performed on wild type and Sti1-3xFLAG strains under high and low protein burden, that is with high and low copy yEVenus plasmid, respectively. This file contains the dataset used to create Figure 3D.
- https://doi.org/10.7554/eLife.29845.013
-
Supplementary file 5
All data used to create figures in the manuscript.
The file contains the datasets used to create specific manuscript figures: it contains the data for Figures 1A, 2A, B, C, D, 3A, B and C, Figure 3—figure supplement 1A,B.
- https://doi.org/10.7554/eLife.29845.014
-
Transparent reporting form
- https://doi.org/10.7554/eLife.29845.015
Download links
A two-part list of links to download the article, or parts of the article, in various formats.
Downloads (link to download the article as PDF)
Open citations (links to open the citations from this article in various online reference manager services)
Cite this article (links to download the citations from this article in formats compatible with various reference manager tools)
Hsp70-associated chaperones have a critical role in buffering protein production costs
eLife 7:e29845.
https://doi.org/10.7554/eLife.29845


