Deciphering caveolar functions by syndapin III KO-mediated impairment of caveolar invagination
- Jena University Hospital – Friedrich Schiller University Jena, Germany
Figures
Figure 1 with 2 supplements
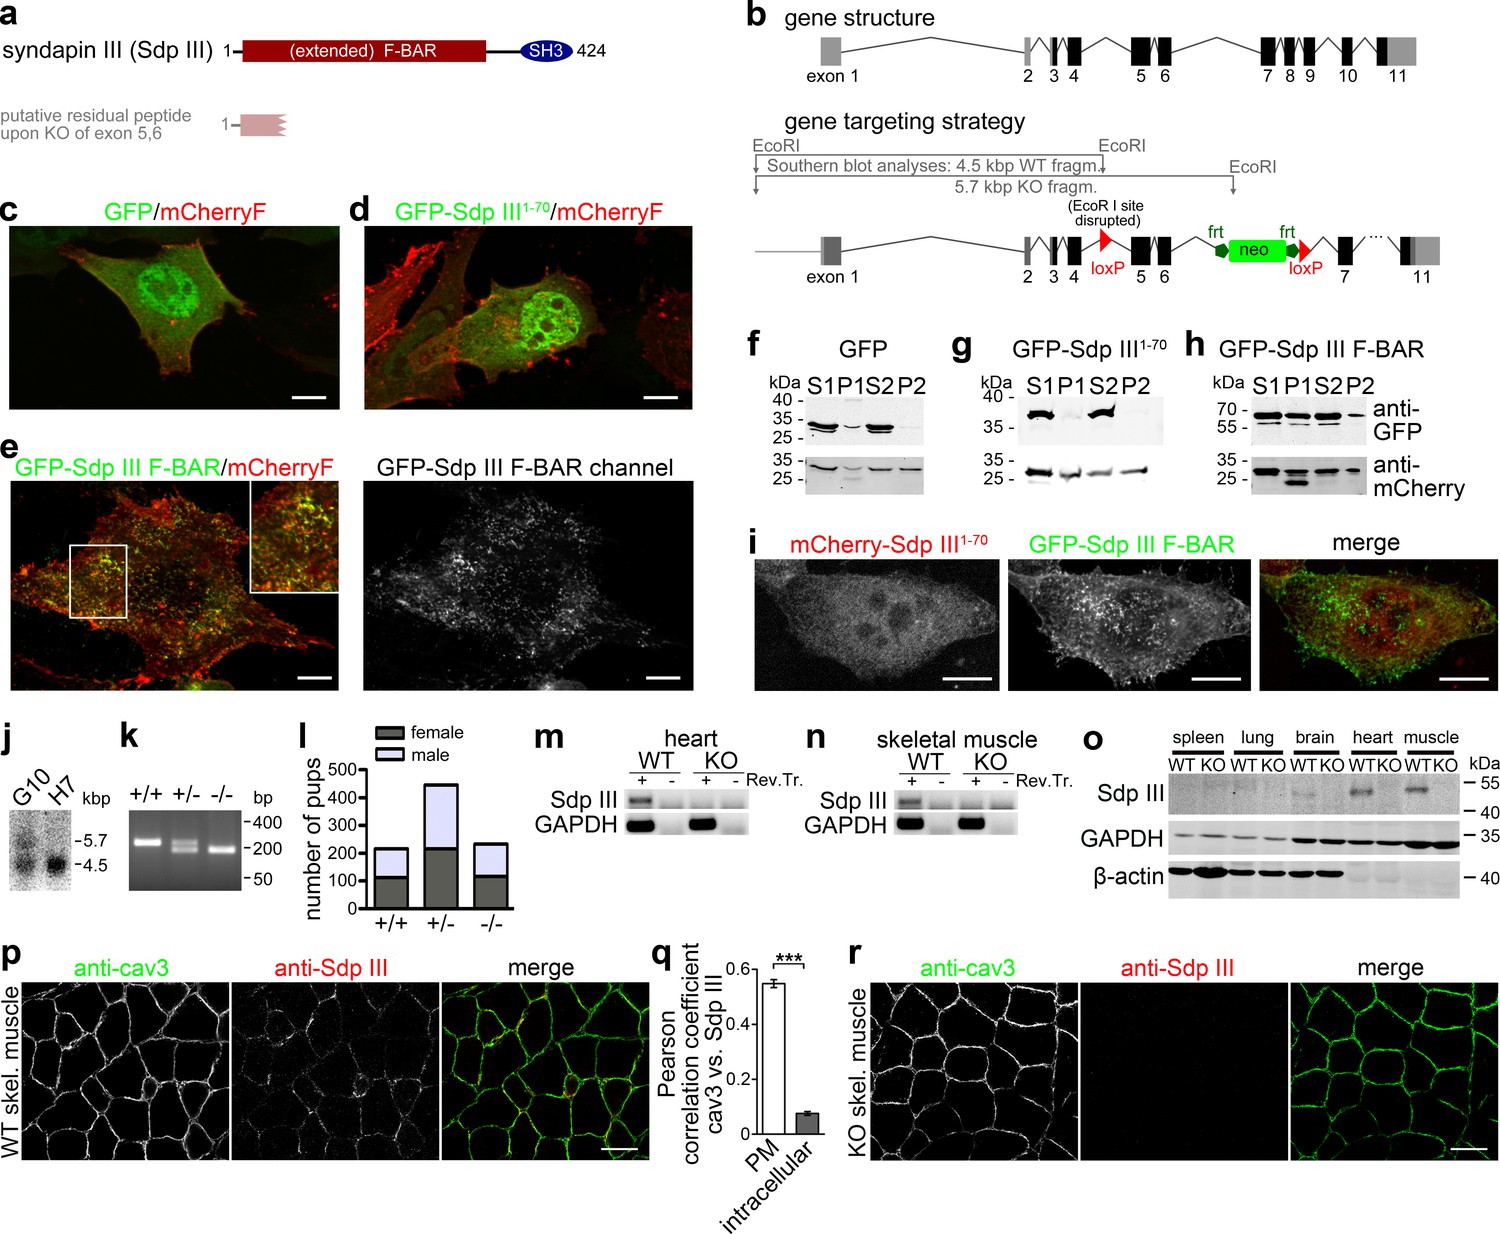
Generation of syndapin III KO mice.
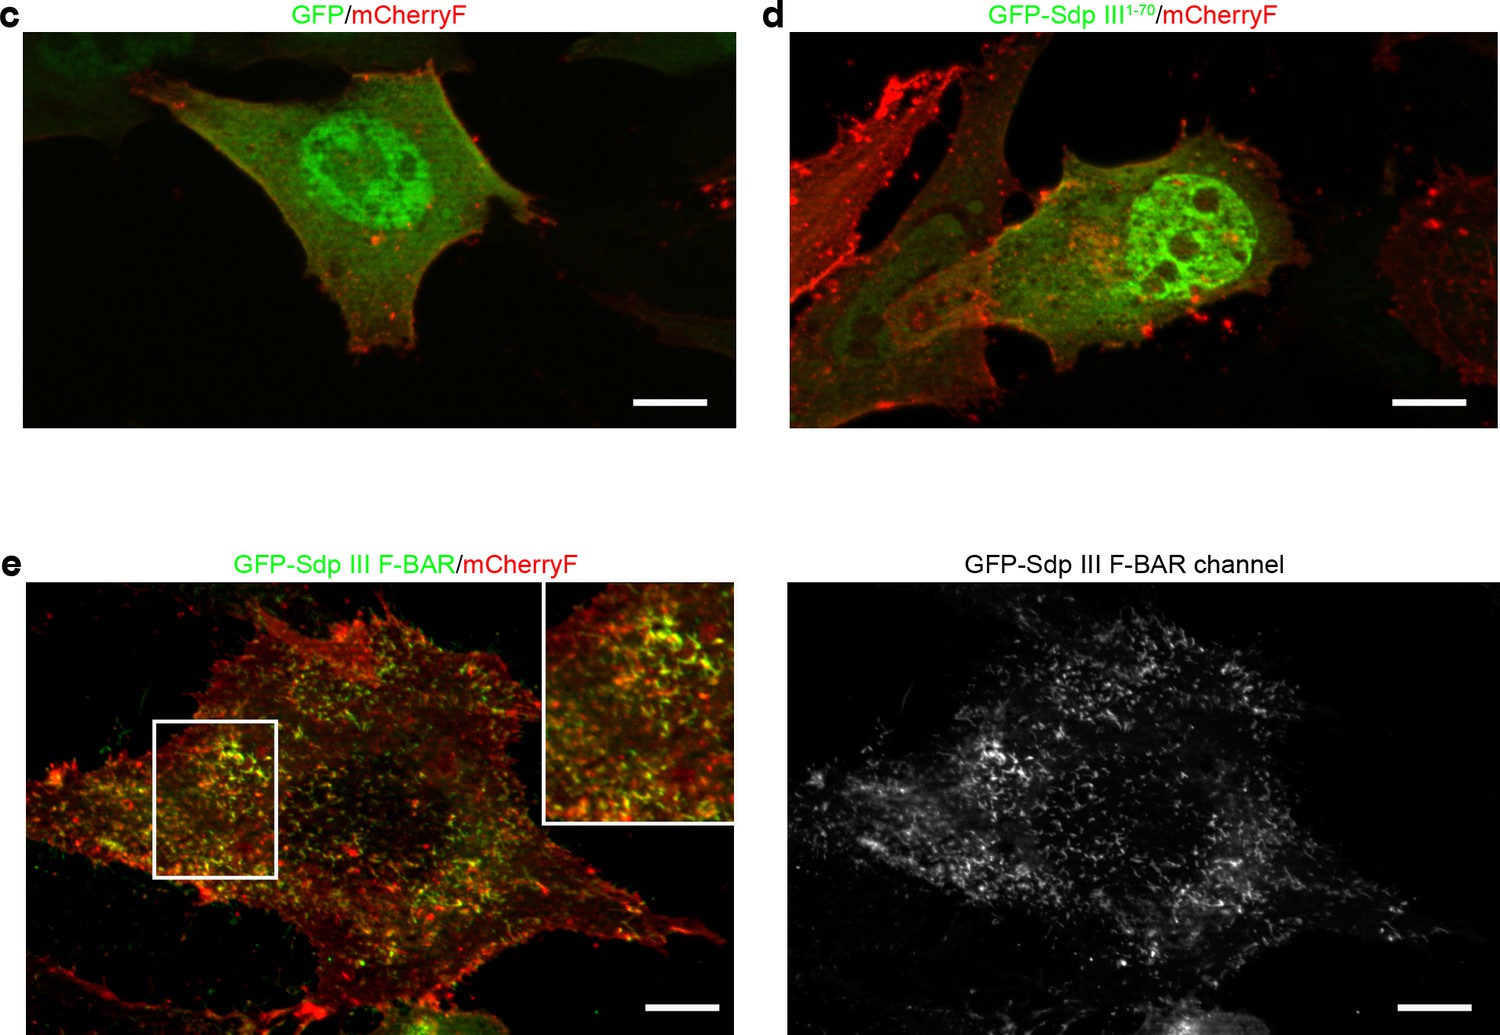
(a) Murine syndapin III domain structure and putative remaining peptide upon syndapin III exon 5 and 6 deletion. (b) Generation of syndapin III KO mice. Scheme of the syndapin III gene comprising 11 exons (coding exon parts in black) and of targeting vector and strategy of Southern blot analyses. Homologous recombination (homologous regions in dark grey and black) resulted in floxed exons 5 and 6. (c–e) Merges of MIPs of NIH3T3 cells transfected with GFP (c), GFP-syndapin III1-70 peptide (putatively remaining upon KO; composed of aa1-70 of syndapin III and five unrelated aa resulting from the frameshift caused by exon 5,6 deletion) (d) and GFP-syndapin III F-BAR (e), respectively. Cotransfected plasma membrane-targeted mCherry (mCherryF) served as internal control for a membrane-bound protein. In (e), the GFP channel of a GFP-syndapin III F-BAR-transfected cell is shown in addition to the merge to visualize the tubular structures induced by syndapin III F-BAR. The inset in (e) shows an enlargement of the boxed area. Bars, 10 µm. For enlarged images see Figure 1—figure supplement 1. (f–h) Immunoblotting analyses of fractionations of transfected HEK293 cells showing that whereas plasma membrane-targeted mCherry (f–h, lower panel) and GFP-syndapin III F-BAR (h, upper panel) are readily detectable in the crude membrane fraction P2, both GFP and GFP-syndapin III1-70 are not (f,g, upper panels). (i) MIPs of NIH3T3 cells transfected with GFP-syndapin III F-BAR coexpressing mCherry-syndapin III1-70 showing undisturbed membrane localization, self-assembly and membrane tubulation abilities of GFP-syndapin III F-BAR. Bars, 10 µm. For enlarged images see Figure 1—figure supplement 2. (j) Southern blot analysis of exemplary ES cell clones (G10, transgenic; H7, WT). (k) Genotyping of the offspring of heterozygous mating identifies all possible genotypes. (l) Normal frequency of genotypes and genders of syndapin III KO mice. (m,n) RT-PCRs on heart (m) and skeletal muscle cDNA (n). (o) Immunoblottings of tissue homogenates (50 µg each) show the lack of syndapin III in KO tissues. GAPDH and β-actin, controls. (p–r) Immunofluorescence analyses of syndapin III and cav3 in transversal skeletal muscle sections from WT (p) and syndapin III KO mice (r) and quantitative colocalization analyses (q) in ROIs placed at plasma membrane (n = 240 ROIs from eight images) and intracellular areas (n = 160 ROIs from eight images) in confocal stacks of images of transversal sections of WT skeletal muscles. Data, mean ± SEM. Statistical significance, Mann-Whitney U test. Bars, 100 µm.
-
Figure 1—source data 1
This spreadsheet contains the data for all quantitative evaluations shown in the different panels of Figure 1 (i.e. of Figure 1l and q).
- https://doi.org/10.7554/eLife.29854.005
Figure 1—figure supplement 1
The syndapin III F-BAR domain localizes to the plasma membrane and decorates distinct membrane domains (enlarged images Figure 1c–d).
(c–e) Merges of MIPs of NIH3T3 cells transfected with GFP, GFP-syndapin III1-70 (putatively remaining upon KO; composed of aa1-70 peptide of syndapin III and five unrelated aa resulting from the frameshift caused by exon 5,6 deletion) (c) and GFP-syndapin III F-BAR (d), respectively. Cotransfected plasma membrane-targeted mCherry (mCherryF) served as internal control for a membrane-bound protein. The GFP channel of a GFP-syndapin III F-BAR-transfected cell is shown in addition to the merges (left panel in e) to visualize the tubular structures induced by syndapin III F-BAR. The inset in e shown an enlargement of the boxed area. Bars, 10 µm. The duplications of Figure 1c–d shown in this figure supplement were requested to allow for detailed evaluation of the differences in the localization of GFP-syndapin III F-BAR versus GFP-syndapin III1-70 or GFP.
Figure 1—figure supplement 2
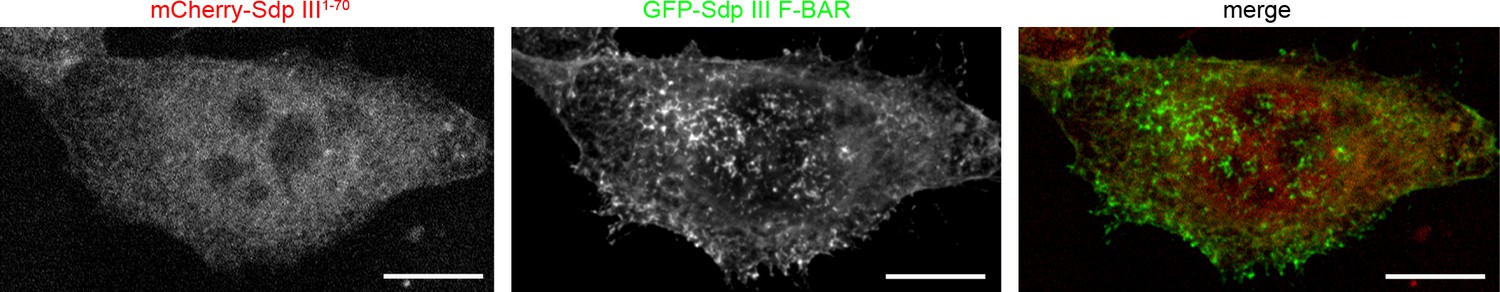
A putative syndapin III1-70 peptide does not interfere with syndapin III F-BAR domain functions (enlargement of images shown in Figure 1i).
MIPs of NIH3T3 cells transfected with GFP-syndapin III F-BAR coexpressing mCherry-syndapin III1-70 showing undisturbed membrane localization and membrane tubulation abilities of GFP-syndapin III F-BAR. Bars, 10 µm. The duplications of Figure 1i shown in this figure supplement were requested to allow for detailed evaluation of lack of colocalization of GFP-syndapin III F-BAR with mCherry-syndapin III1-70.
Figure 2
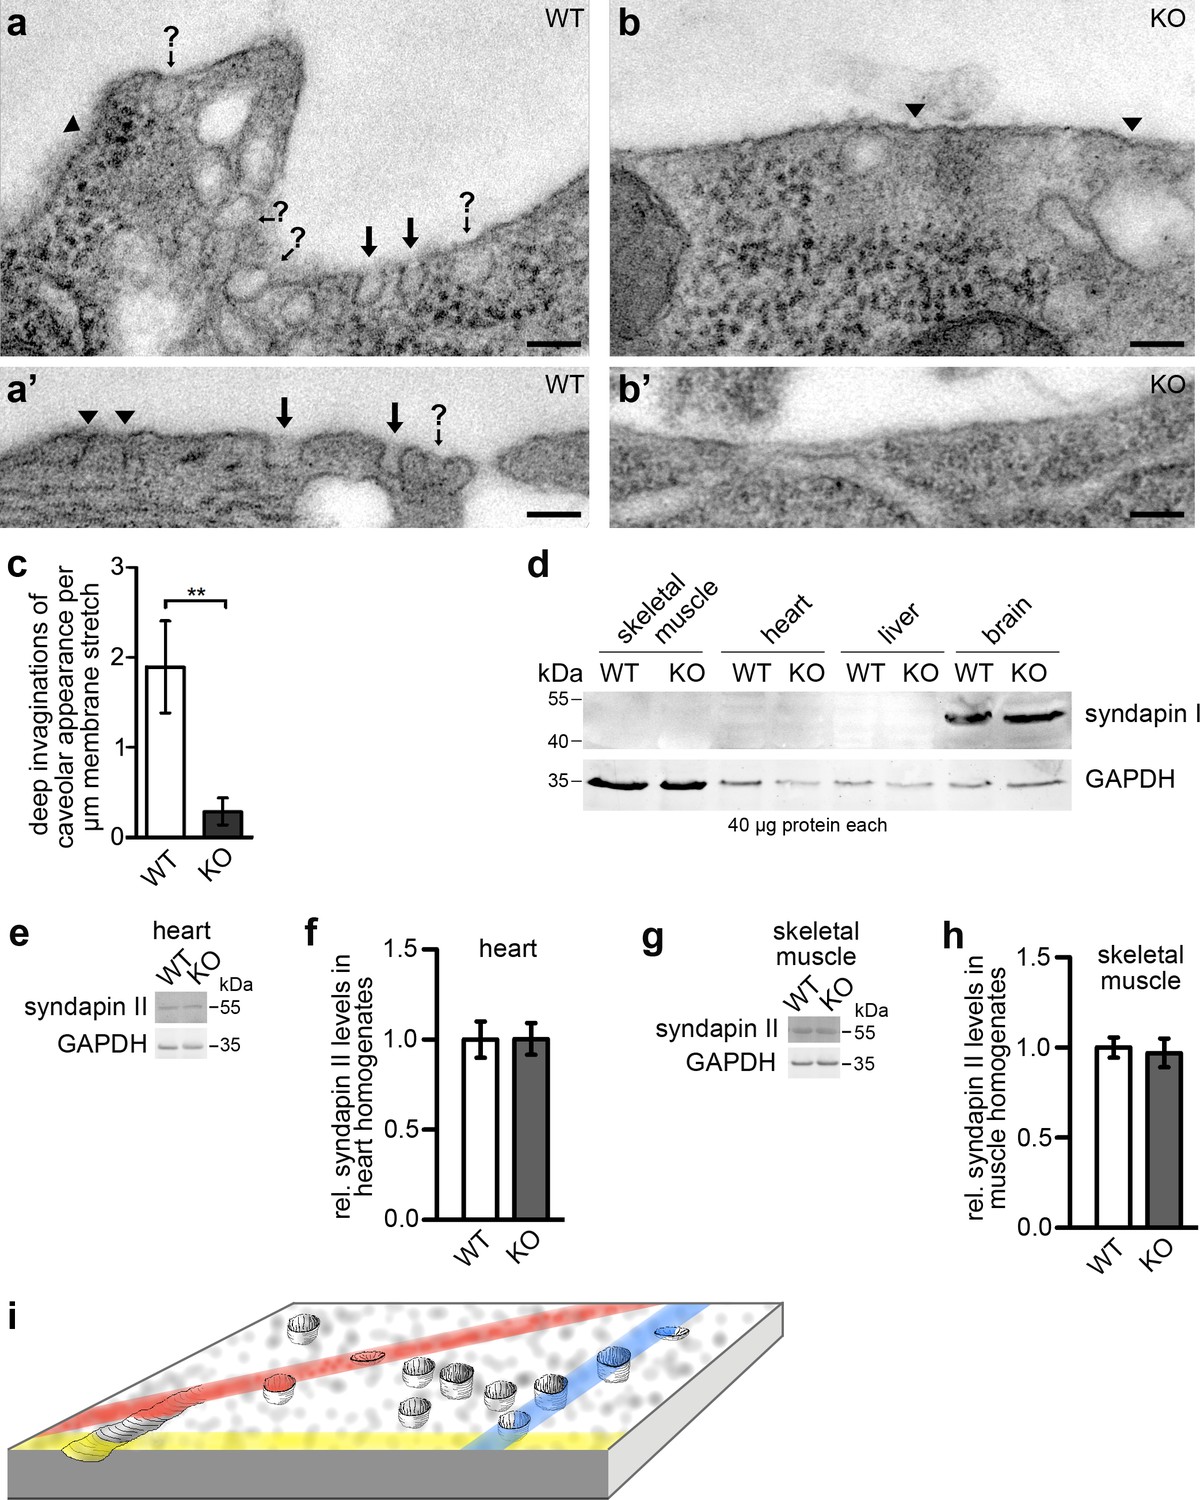
Syndapin III KO leads to a loss of plasma membrane invaginations with caveolar morphology.
(a–b’) TEM of 50 nm sections of chemically fixed primary cardiomyocytes isolated from WT (a,a’) and syndapin III KO mice (b,b’), respectively. Marked are deep membrane invaginations hit by the orientation of the section in a way that they can be recognized as caveolar profiles (black arrows), deep invaginations with (often due to non-perpendicular sectioning) unclear opening (arrows with question marks) and more shallow membrane indentations of unclear nature (arrowheads). Note that syndapin III KO membrane stretches (b,b’) have fewer invaginations. Bars, 100 nm. (c) Quantitative analyses of plasma membrane stretches for the presence and frequency of deeply invaginated profiles with caveolar appearance corresponding to structures in images marked with arrows. Data, mean ± SEM. Statistical significance, two-tailed Student’s t test. WT, eight membrane stretches; KO, 13 membrane stretches from different cells. (d) Immunoblotting analyses of tissue homogenates from WT and syndapin III KO mice with anti-syndapin I antibodies show expression of syndapin I only in the brain but no ectopic expression in heart or skeletal muscles of syndapin III KO mice. 40 µg protein each was loaded per lane. Anti-GAPDH signals served as controls. (e–h) Quantitative western blot analyses of homogenates of hearts (e,f) and skeletal muscles (g,h) from WT and syndapin III KO mice addressing putative changes of syndapin II expression levels. Data, mean ± SEM. n = 12 each. (i) Schematic 3D-view onto a membrane field with caveolae, shallow circular indentations, a longitudinal indentation and orientations of putative random sections (colored) leading to non-representative and often unclear image data calling for views onto wide fields of membrane and 3D-information to ensure more reliable quantitative analyses.
-
Figure 2—source data 1
This spreadsheet contains the data for all quantitative evaluations shown in the different panels of Figure 2 (i.e. of Figure 2c,f and h).
- https://doi.org/10.7554/eLife.29854.007
Figure 3 with 3 supplements
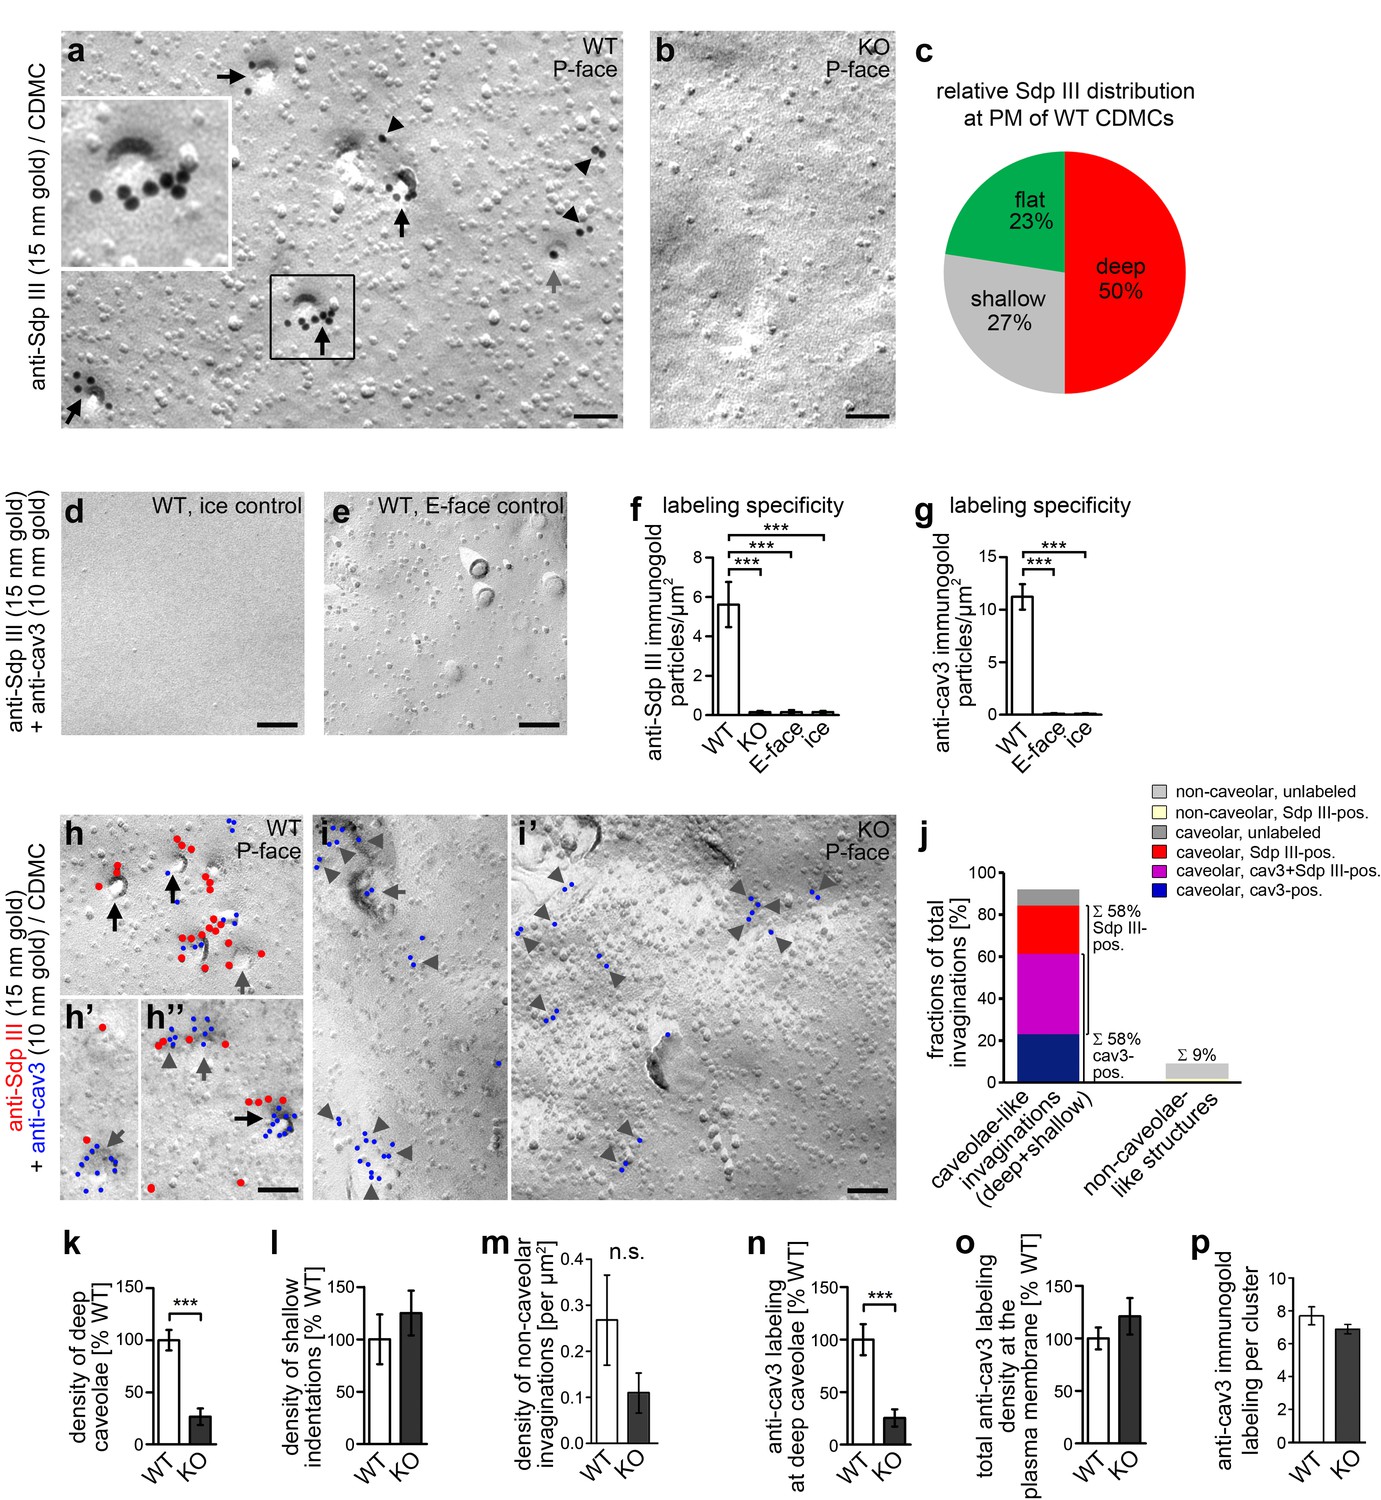
Syndapin III KO leads to impairments in the formation of cav3-coated caveolae.
(a,b) Details of wide-field TEM images of anti-syndapin III immunogold-labeled P-faces of freeze-fractured plasma membranes of cardiomyocytes (CDMC) from WT (a) and syndapin III KO mice (b). (c) Blinded, quantitative evaluations of the anti-syndapin III labeling distribution on full areas of freeze-fractured membranes. (a–c) WT, 15.8 µm2 from 20 images; KO, 27 µm2 from 20 images (two independent cardiomyocyte preparations each pooled from two animals/genotype). (d-i’) Electron micrographs of coimmunolabeled control surfaces (d,e) and P-faces of WT (h,h’,h’’; for the picture, from which the details in h’ and h’’ were taken, see Figure 3—figure supplement 1) and syndapin III KO cells (i,i’) as well as blinded quantitative evaluations of labeling densities (f,g; n = 20 images each condition) demonstrating the specificity of the labelings at the P-face of WT cardiomyocytes. Syndapin III (15 nm gold, red labels) is present at caveolae highlighted by anti-cav3 labeling (10 nm gold, blue labels). Labelings at caveolae are marked by black arrows, at shallow indentations by grey arrows and at flat membrane areas by grey arrowheads. Bars, 100 nm. For non-color-marked EM micrographs see Figure 3—figure supplement 2. (j) Analyses of the fractions of caveolae-like profiles (deep and shallow) and of non-caveolar invaginations that were either unlabeled or labeled for cav3, syndapin III and both, respectively (n = 92 WT invaginations). (k,l) Blinded quantitative analyses of the relative densities of caveolae (deep, 70 nm in diameter invaginations formally confirmed as caveolae by anti-cav3 labeling) (k), and of shallow indentations (l), which also were anti-cav3-positive. n = 20 images each; in total, 132 cav3-positive structures were scored. (m) Densities of the (rare) non-caveolar invaginations in WT and syndapin III KO cardiomyocytes (due to the low abundance of such structures (n = 8), n.s.). (n–p) Quantitative analyses of anti-cav3 immunogold labels at deep caveolar invaginations (n; highly significantly decreasing in accordance with the reduced density of (cav3-marked) caveolae), in total (o; n.s) and within cav3 cluster ROIs (150 nm in diameter) (p; n.s.) at the plasma membrane of WT and syndapin III KO cardiomyocytes. (j-o) WT, 29.2 µm2 membrane from 20 images; KO, 35.6 µm2 from 20 images (two independent preparations of two animals each). In (p), 107 (KO) and 50 (WT) cav3 cluster ROIs (150 nm diameter,≥4 anti-cav3 immunogold labels) were analyzed. Data, mean ± SEM. Statistical significance, one-way Anova with Tukey’s post-test (f,g) and two-tailed Student’s t test (k–p), respectively. For further characterization of the primary cardiomyocyte cultures in respect of syndapin III, cav1, cav3 localizations and colocalizations and for phenotypical analyses of cav3 vs. cav1-positive cells see Figure 3—figure supplement 3.
-
Figure 3—source data 1
This spreadsheet contains the data for all quantitative evaluations shown in the different panels of Figure 3 (i.e. of Figure 3f,g,j–p).
- https://doi.org/10.7554/eLife.29854.012
Figure 3—figure supplement 1

Syndapin III is present at cav3-labeled caveolae, shallow membrane indentations and flat membrane areas (picture from which Figure 3h' and h'' were taken).
Syndapin III (15 nm gold) is present at caveolae highlighted by anti-cav3 labeling (10 nm gold) in primary mouse cardiomyocytes. Labelings at caveolae are marked by black arrows, at shallow indentations by grey arrows and at flat membrane areas by grey arrowheads. Boxed areas represent the details shown in Figure 3h’ and h’’. Bar, 200 nm.
Figure 3—figure supplement 2
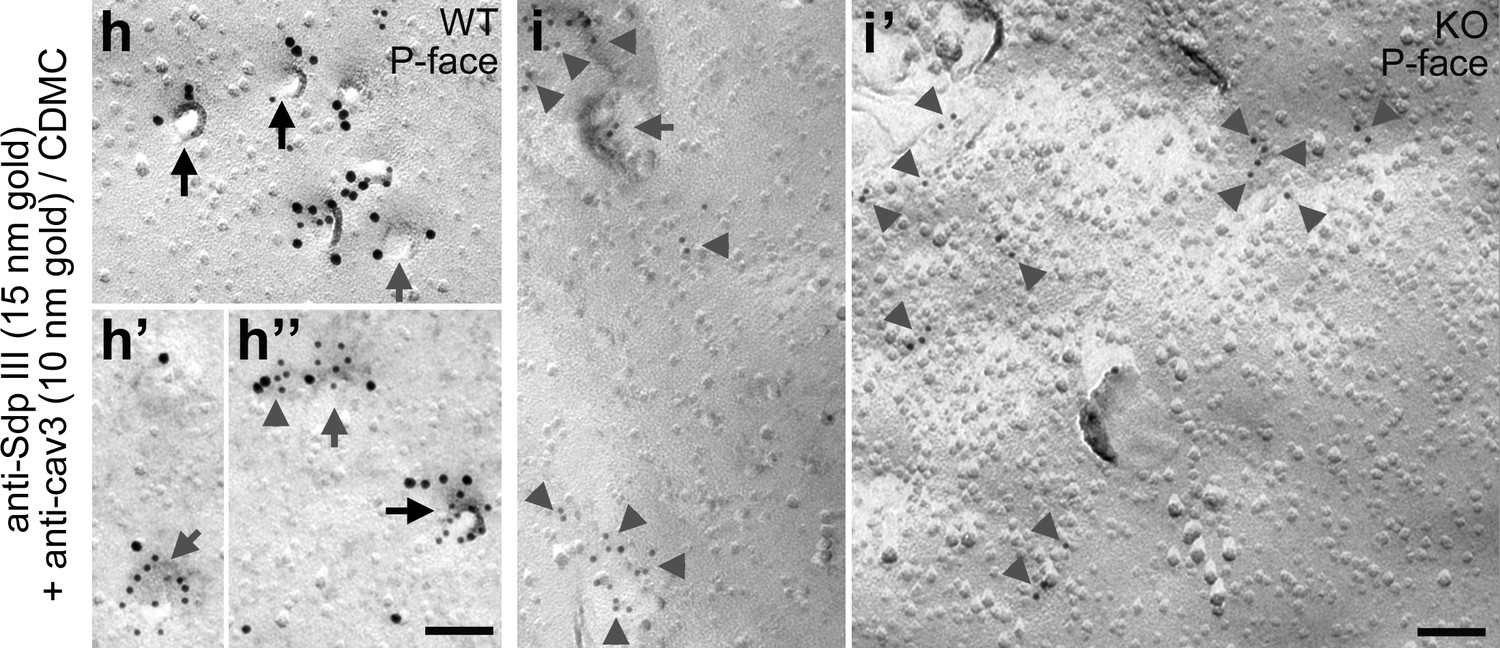
Syndapin III is present at cav3-labeled caveolae, shallow membrane indentations and flat membrane areas and syndapin III KO impairs the formation of caveolae (non-colored data corresponding to images shown in Figure 3h–h’’ and and i,i’).
Non-color-marked electron micrographs shown in Figure 3h–h’’ and in Figure 3i,i’ showing that syndapin III (15 nm gold) is present at caveolae highlighted by anti-cav3 labeling (10 nm gold) in primary mouse cardiomyocytes. Labelings at caveolae are marked by black arrows, at shallow indentations by grey arrows and at flat membrane areas by grey arrowheads. Bars, 100 nm.
Figure 3—figure supplement 3
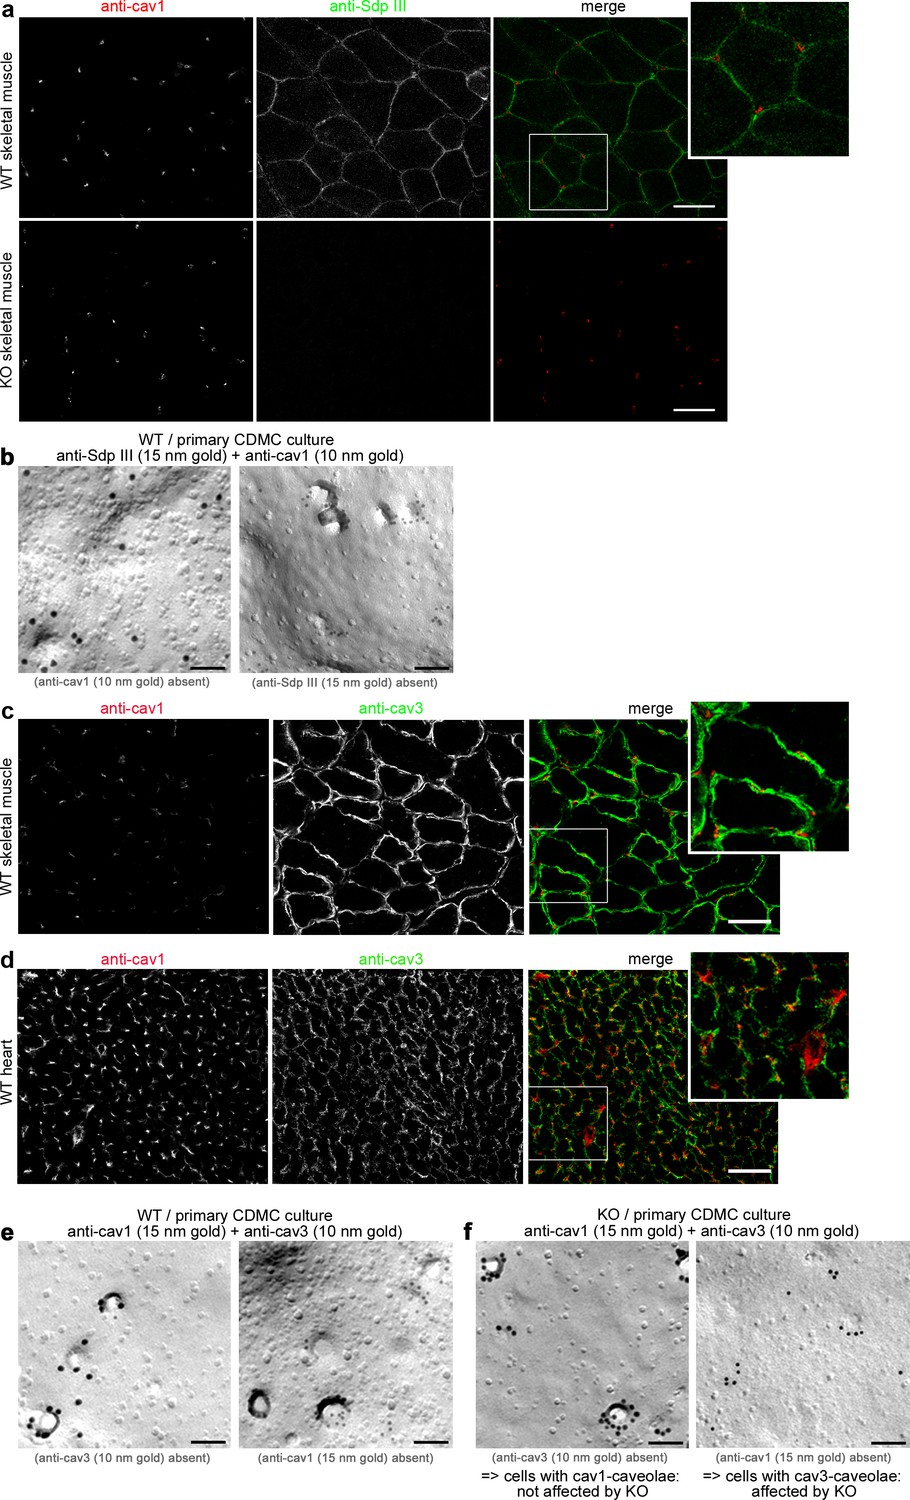
Cav1 and cav3/syndapin III show distinct patterns of localization in primary cardiomyocytes, hearts and skeletal muscles with cav3 and syndapin III being restricted to myocytes.
(a) Sections of skeletal muscles of WT mice and of syndapin III KO mice (specificity control for anti-syndapin III staining) subjected to immunofluorescence analyses showed no spatial overlap of anti-cav1 and anti-syndapin III immunosignals suggesting that both proteins are expressed in different cell types. The specificity of the anti-syndapin III immunolabeling is proven by absence of the signal in syndapin III KO mice (lower panels). Bars, 100 µm. (b) Electron microscopical examinations of freeze-fractured and double-immunogold-labeled membranes of cells in cardiomyocyte preparations from WT hearts exhibiting either anti-cav1-labeled (10 nm) caveolae or anti-syndapin III-labeled (15 nm) caveolae. Thus, syndapin III specifically associates with cav3-coated caveolae and is not found at cav1-coated caveolae from non-muscle cells. Bars, 100 nm. (c,d) Sections of skeletal muscles (c) and heart (d) of WT mice subjected to immunofluorescence analyses showed no spatial overlap of anti-cav1 and anti-cav3 immunosignals suggesting that both caveolin isoforms are present in muscle tissues but are expressed in different cell types. Bar, 100 µm. (e,f) Electron microscopical examinations of freeze-fractured and double-immunogold-labeled membranes of cells in cardiomyocyte preparations from WT (e) and syndapin III KO hearts (f) exhibiting either anti-cav3-labeled (10 nm) caveolae or anti-cav1-labeled (15 nm) caveolae. Note that cav1-positive caveolae are unaffected (left in e and f), that is invaginated despite syndapin III KO, whereas specifically cav3-positive membranes of myocytes (right in e and f) appear flattened upon syndapin III KO. Bars, 100 nm. Thus, cav1 and cav3 do not occur together and syndapin III is crucial for the invagination of specifically cav3-coated caveolae of the muscle cells present in the primary cell preparation from hearts.
Figure 4 with 1 supplement
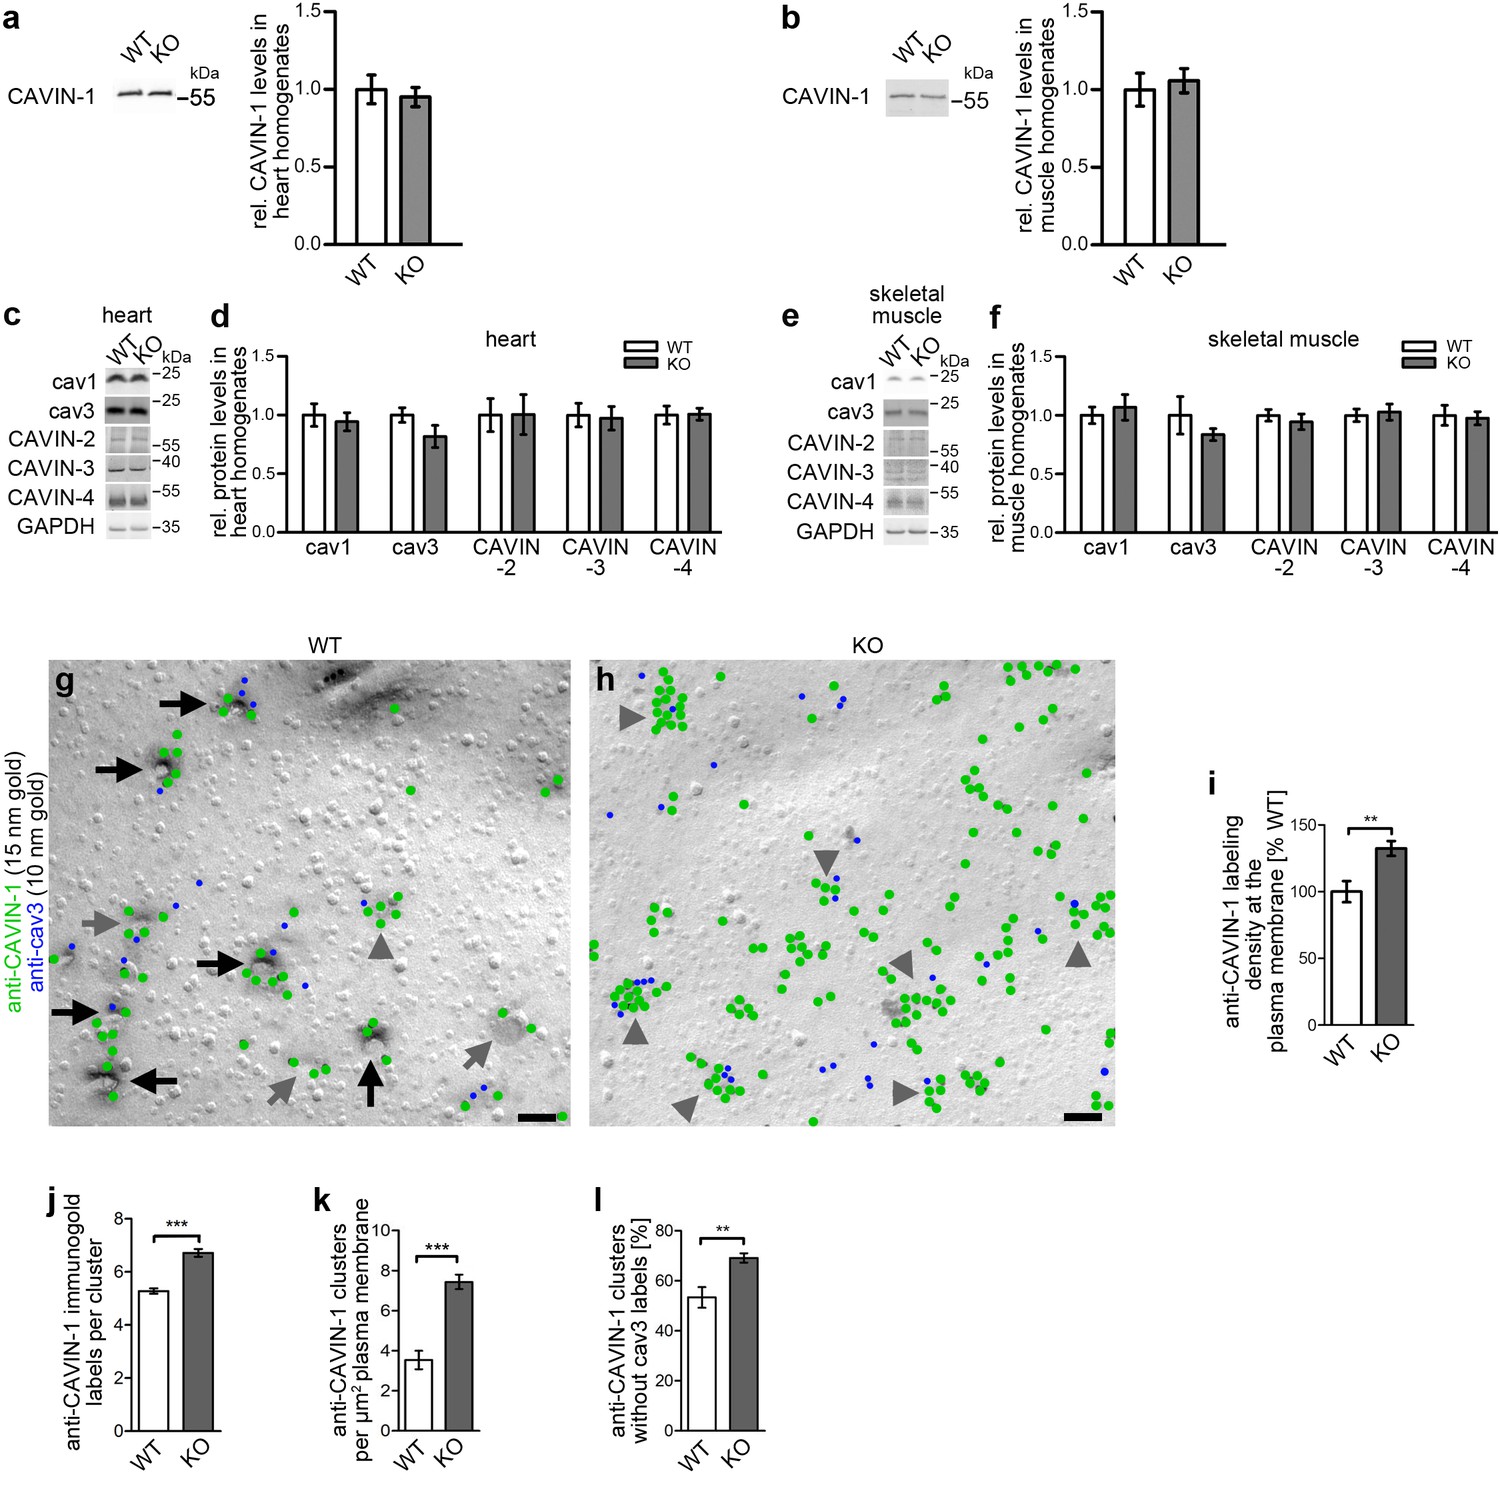
Impairment of caveolar invagination by syndapin III KO does not lead to dissociation of CAVIN-1 from the plasma membrane.
(a,b) Quantitative western blot analyses of homogenates of hearts and skeletal muscles from WT and syndapin III KO mice showing that the levels of the important cav3 coat component CAVIN-1 are unaffected. (c-f) Quantitative western blot analyses of homogenates of hearts (c,d) and skeletal muscles (e,f) from WT and syndapin III KO mice addressing components suggested to play roles in caveolae formation that may be redundant or related to the critical role of syndapin III in caveolar invagination (normalized to GAPDH). Data, mean ± SEM. N = 12 each genotype. (g,h) Electron micrographs of anti-CAVIN-1 immunogold labeling (green labels) of freeze-fractured cardiomyocytes isolated from WT (g) and syndapin III KO mice (h) (in combination with a low concentration immunolabeling of cav3 (blue labels) to prove that indeed a membrane of a (cav3-positive) cardiomyocyte is examined). Note that CAVIN-1’s membrane association and its ability to form clusters is not impaired in syndapin III KO cells. Examples of clustered labeling of CAVIN-1 at (cav3-positive) deeply invaginated caveolae are marked by black arrows, at shallow indentations by grey arrows and at flat membrane areas by grey arrowheads. For non-color-marked EM micrographs see Figure 4—figure supplement 1. Bars, 100 nm. (i,j) Quantitative analyses of the labeling densities in WT and syndapin III KO samples at the plasma membrane in general (i) and specifically within CAVIN-1 clusters (j). (k,l) Analyses of the density of CAVIN-1 clusters at the plasma membrane (k) and of the percent of clusters without cav3 signal in WT and syndapin III KO cardiomyocytes (l). Data, mean ± SEM. Twenty images each (i–l). Statistical analysis, unpaired Student’s t test.
-
Figure 4—source data 1
This spreadsheet contains the data for all quantitative evaluations shown in the different panels of Figure 4 (i.e. of Figure 4a,b,d,f,i,j,k and l).
- https://doi.org/10.7554/eLife.29854.015
Figure 4—figure supplement 1

Impairment of caveolar invagination by syndapin III KO does not lead to dissociation of CAVIN-1 from the plasma membrane (non-colored images corresponding to Figure 4g and h and further example images).
Upper panels, non-color marked electron micrographs of anti-CAVIN-1 immunogold labeling of freeze-fractured cardiomyocytes isolated from WT (left) and syndapin III KO mice (right) (in combination with a low concentration immunolabeling of cav3 (blue) to prove that that indeed a membrane of a (cav3-positive) cardiomyocyte is examined) corresponding to Figure 4g,h. Note that CAVIN-1 membrane association and its ability to form clusters is not impaired in syndapin III KO cells. Lower panels, further example images for WT (left) and syndapin III KO cardiomyocyte preparations immunolabeled for CAVIN-1 and cav3. Examples of clustered labeling of CAVIN-1 at (cav3-positive) deeply invaginated caveolae are marked by black arrows, at shallow indentations by grey arrows and at flat membrane areas by grey arrowheads. Bars, 100 nm.
Figure 5
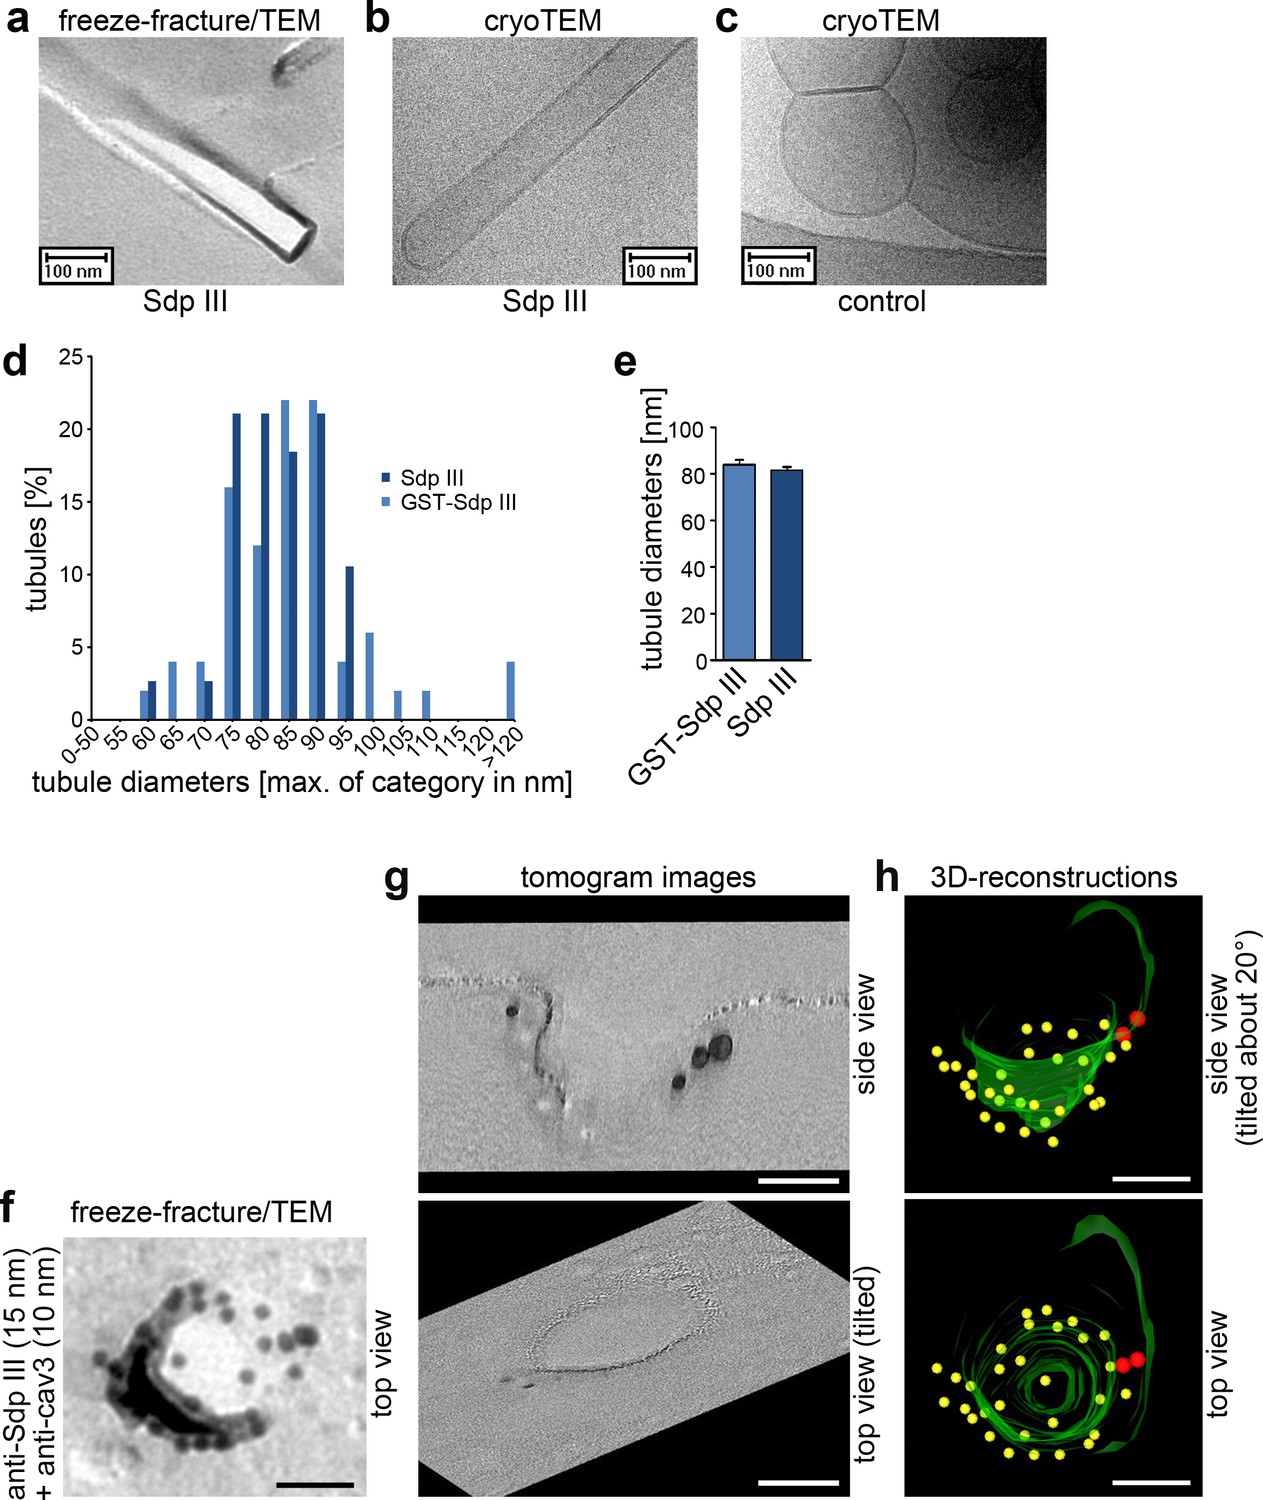
Syndapin III shapes liposomes into tubules with caveolar diameters and localizes to the rim of cav3 coats.
(a–c) Analyses of tubules induced by incubating liposomes with syndapin III (a,b) and GST (c), respectively, by freeze-fracturing/TEM (a) as well as by cryo-TEM (b,c). (d,e) Quantitative analyses of tubule diameter distributions (d) and averages of diameters (e) induced by syndapin III and GST-syndapin III, respectively. Data in (e), mean +SEM. (d,e) n= 50 (GST-syndapin III) and n = 38 (syndapin III) freeze-fractured tubuli. (f) High resolution, 80 kV top view of a deeply invaginated caveolar structure of a WT cardiomyocyte immunolabeled for syndapin III (15 nm gold) and cav3 (10 nm gold). Bar, 50 nm. (g,h) Corresponding 120 kV tomogram images (g) and views from a 3D-reconstruction (h) show that syndapin III is at the edge of the cav3 coat (34 caveolae analyzed; two full 3D-segmentations; invaginated membrane, green; immunogold labels cav3, yellow; syndapin III, red). Bars in f–h), 50 nm.
-
Figure 5—source data 1
This spreadsheet contains the data for all quantitative evaluations shown in the different panels of Figure 5 (i.e. of Figure 5d and e).
- https://doi.org/10.7554/eLife.29854.017
Figure 6 with 1 supplement
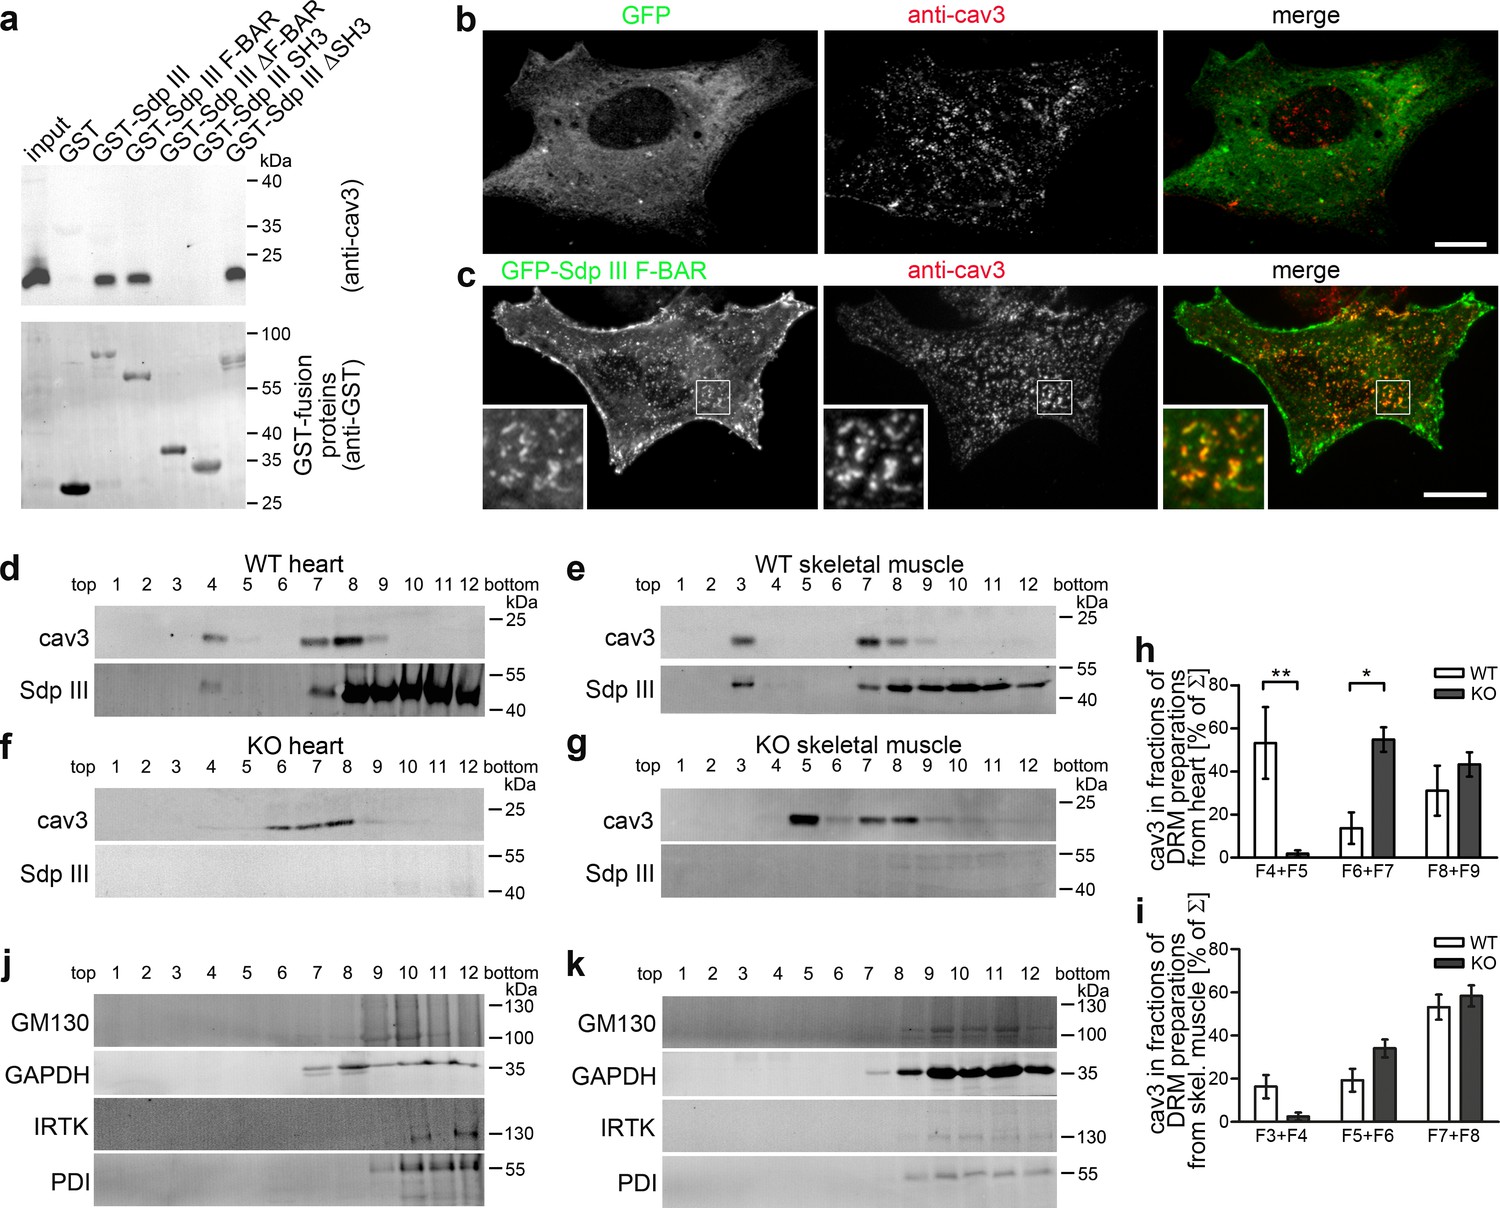
Syndapin III is involved in the organization of cav3-containing membrane domains.
(a) Coprecipitation of endogenous cav3 from heart lysates with the indicated immobilized GST-fusion proteins of syndapin III. (b,c) GFP-syndapin III F-BAR domain but not GFP clusters with cav3 at the membrane of primary cardiomyocytes. Boxed areas, higher magnification insets. Bars, 10 µm. (d–k) Syndapin III KO changes the biophysical properties of cav3-containing DRMs. Immunoblottings of cav3 and syndapin III (d–g) and proteins representing Golgi (GM130), cytosol (GAPDH), plasma membrane (IRTK) and ER (PDI) (j,k) in TritonX-100-resistant membrane preparations from heart and skeletal muscles from WT (d,e) and syndapin III KO mice (f,g,j,k). Quantitative analyses (h,i) demonstrate the shift of cav3-containing TritonX-100-resistant membranes from fractions F4 +F5 to F6 +F7 in heart (d,f,h) and from F3 +F4 to F5 +F6 in skeletal muscle (e,g,i) upon syndapin III KO. Hearts, n = 3 each genotype; skeletal muscles, n = 9 each genotype. Data, mean ± SEM. Statistical significances, two-way ANOVA and Bonferroni post-test. For individual comparisons of WT and KO fractions see Figure 6—figure supplement 1.
-
Figure 6—source data 1
This spreadsheet contains the data for all quantitative evaluations shown in the different panels of Figure 6 and of the corresponding Figure 6—figure supplement 1 (i.e. of Figure 6h and i and Figure 6—figure supplement 1a–d).
- https://doi.org/10.7554/eLife.29854.022
Figure 6—figure supplement 1
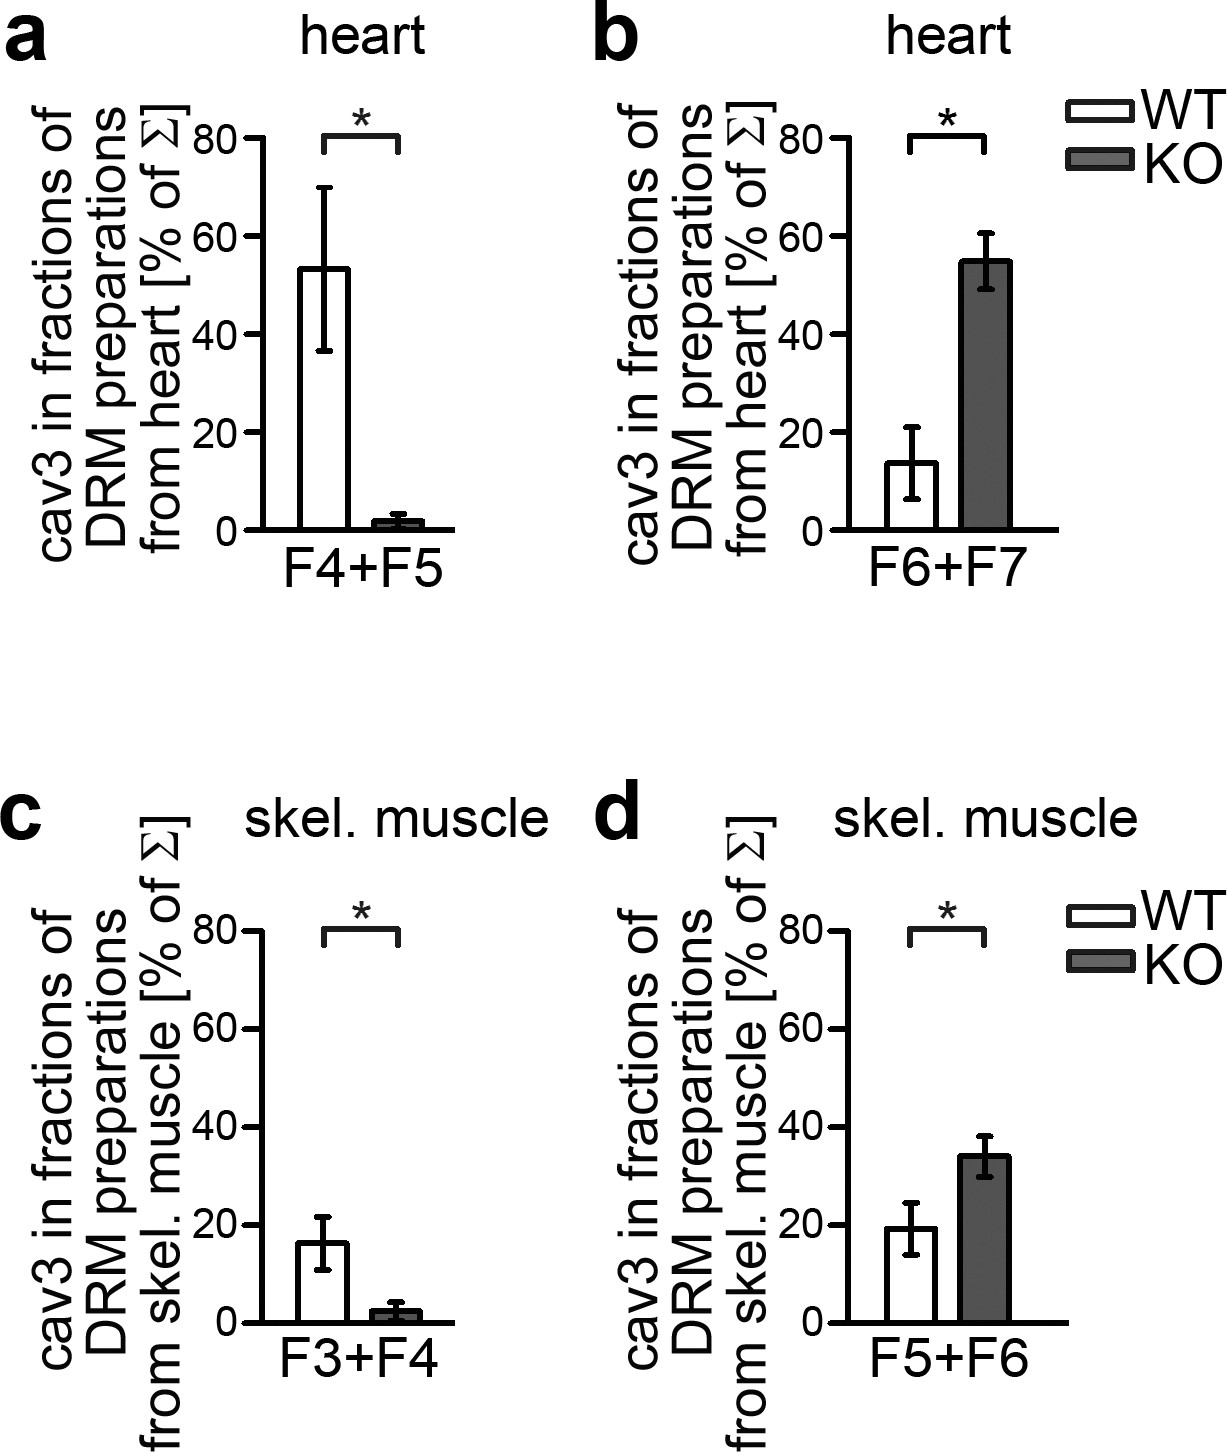
Syndapin III plays an important role in organizing cav3-containing membrane domains.
(a–d) Quantitative comparisons of density gradient fractions of DRMs showing an altered cav3 distribution in syndapin III KO hearts (a,b) and skeletal muscles (c,d) compared to WT. Upon syndapin III KO, cav3 is shifted to fractions of higher density in both heart (b) and skeletal muscle (d). Hearts, n = 3 each genotype; skeletal muscles, n = 9 each genotype. Data represent mean ± SEM. Statistical significance was evaluated using two-tailed Student’s t-test.
Figure 7
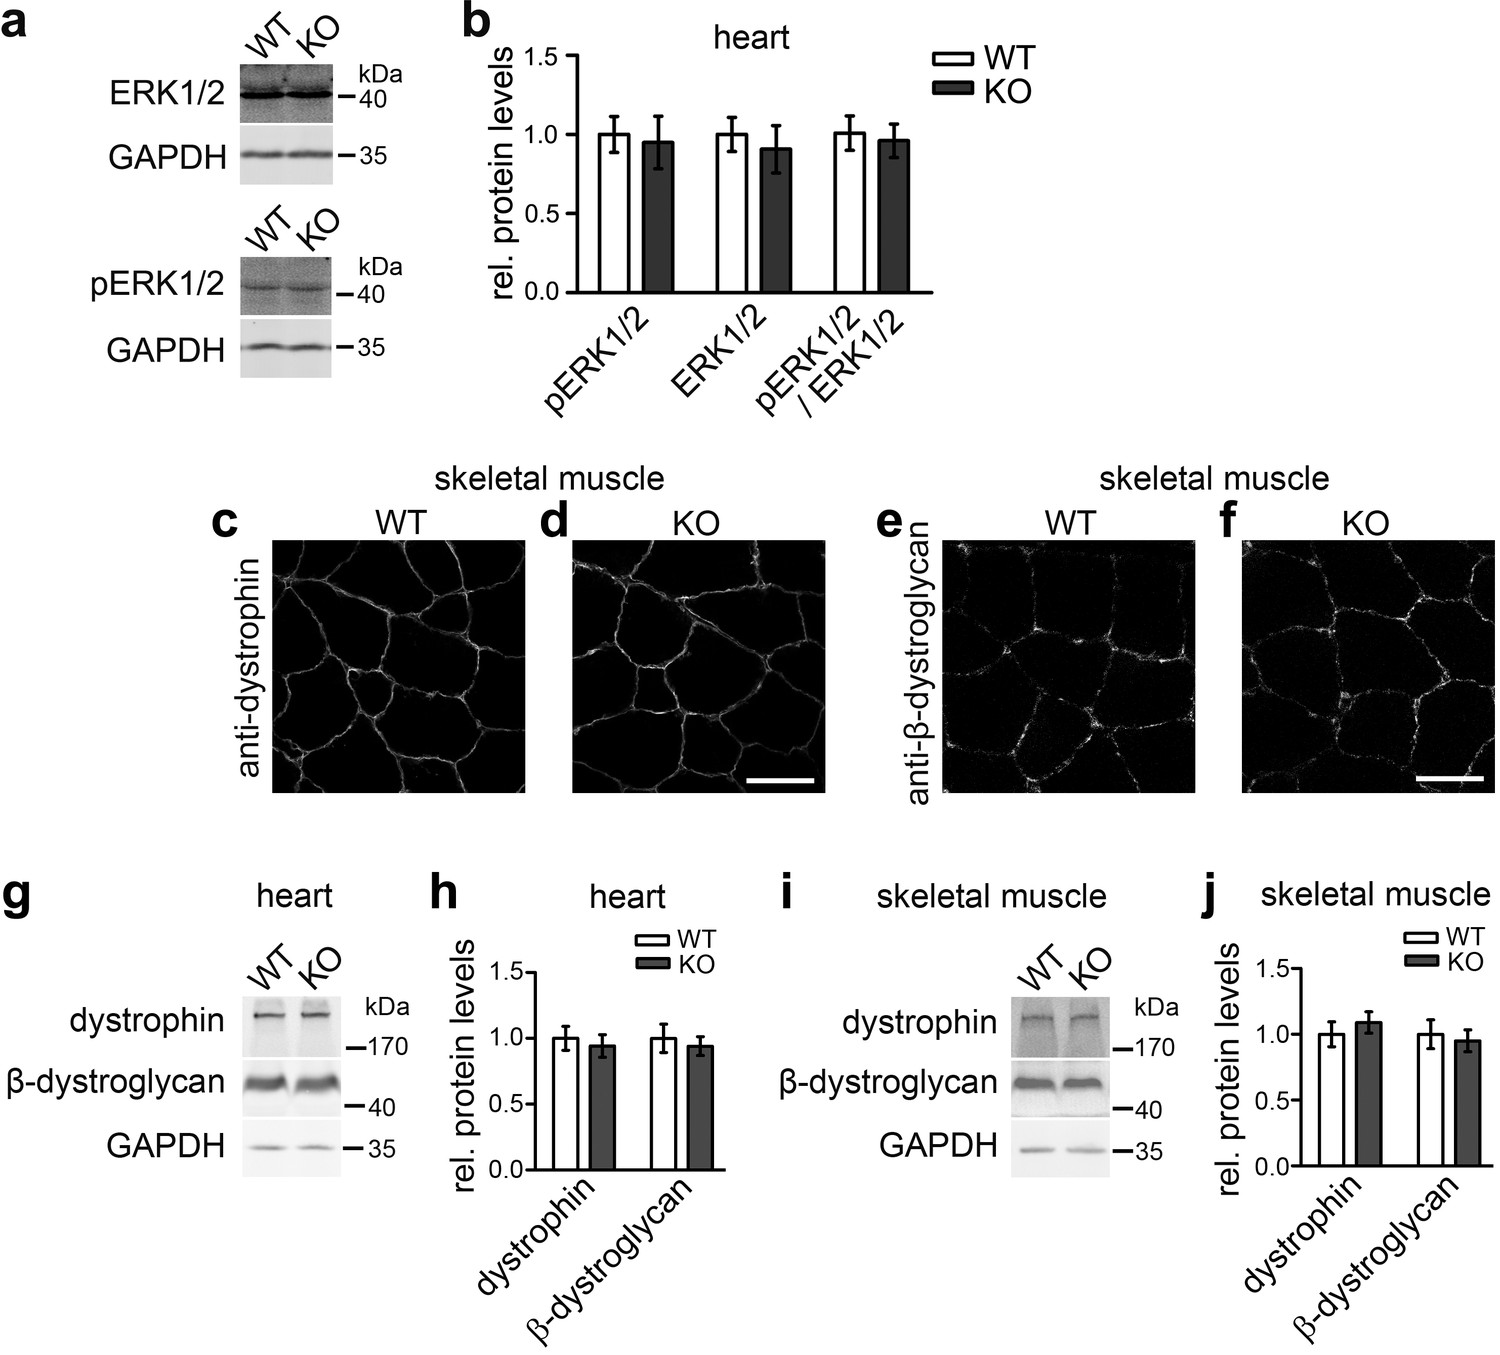
Not all described cav3 loss-of-function phenotypes are found upon syndapin III KO and may thus not reflect impairments of caveolar invagination.
(a,b) Quantitative immunoblot analyses of ERK1/2 and phosphoERK1/2 in heart homogenates of WT and syndapin III KO mice (normalized to WT) show no alteration of MAPK signaling (pERK1/2/ERK1/2 signals). Data represent mean ± SEM; n = 12 each. (c–f) Unchanged subcellular localization of both dystrophin and β-dystroglycan in sections of skeletal muscles from syndapin III KO mice. Bars, 50 µm. (g–j) Levels of dystrophin and β-dystroglycan are unchanged in heart and skeletal muscle homogenates upon syndapin III KO (normalized to WT). Data represent mean ± SEM; n = 12 each.
-
Figure 7—source data 1
This spreadsheet contains the data for all quantitative evaluations shown in the different panels of Figure 7 (i.e. of Figure 7b,h and j).
- https://doi.org/10.7554/eLife.29854.024
Figure 8 with 1 supplement
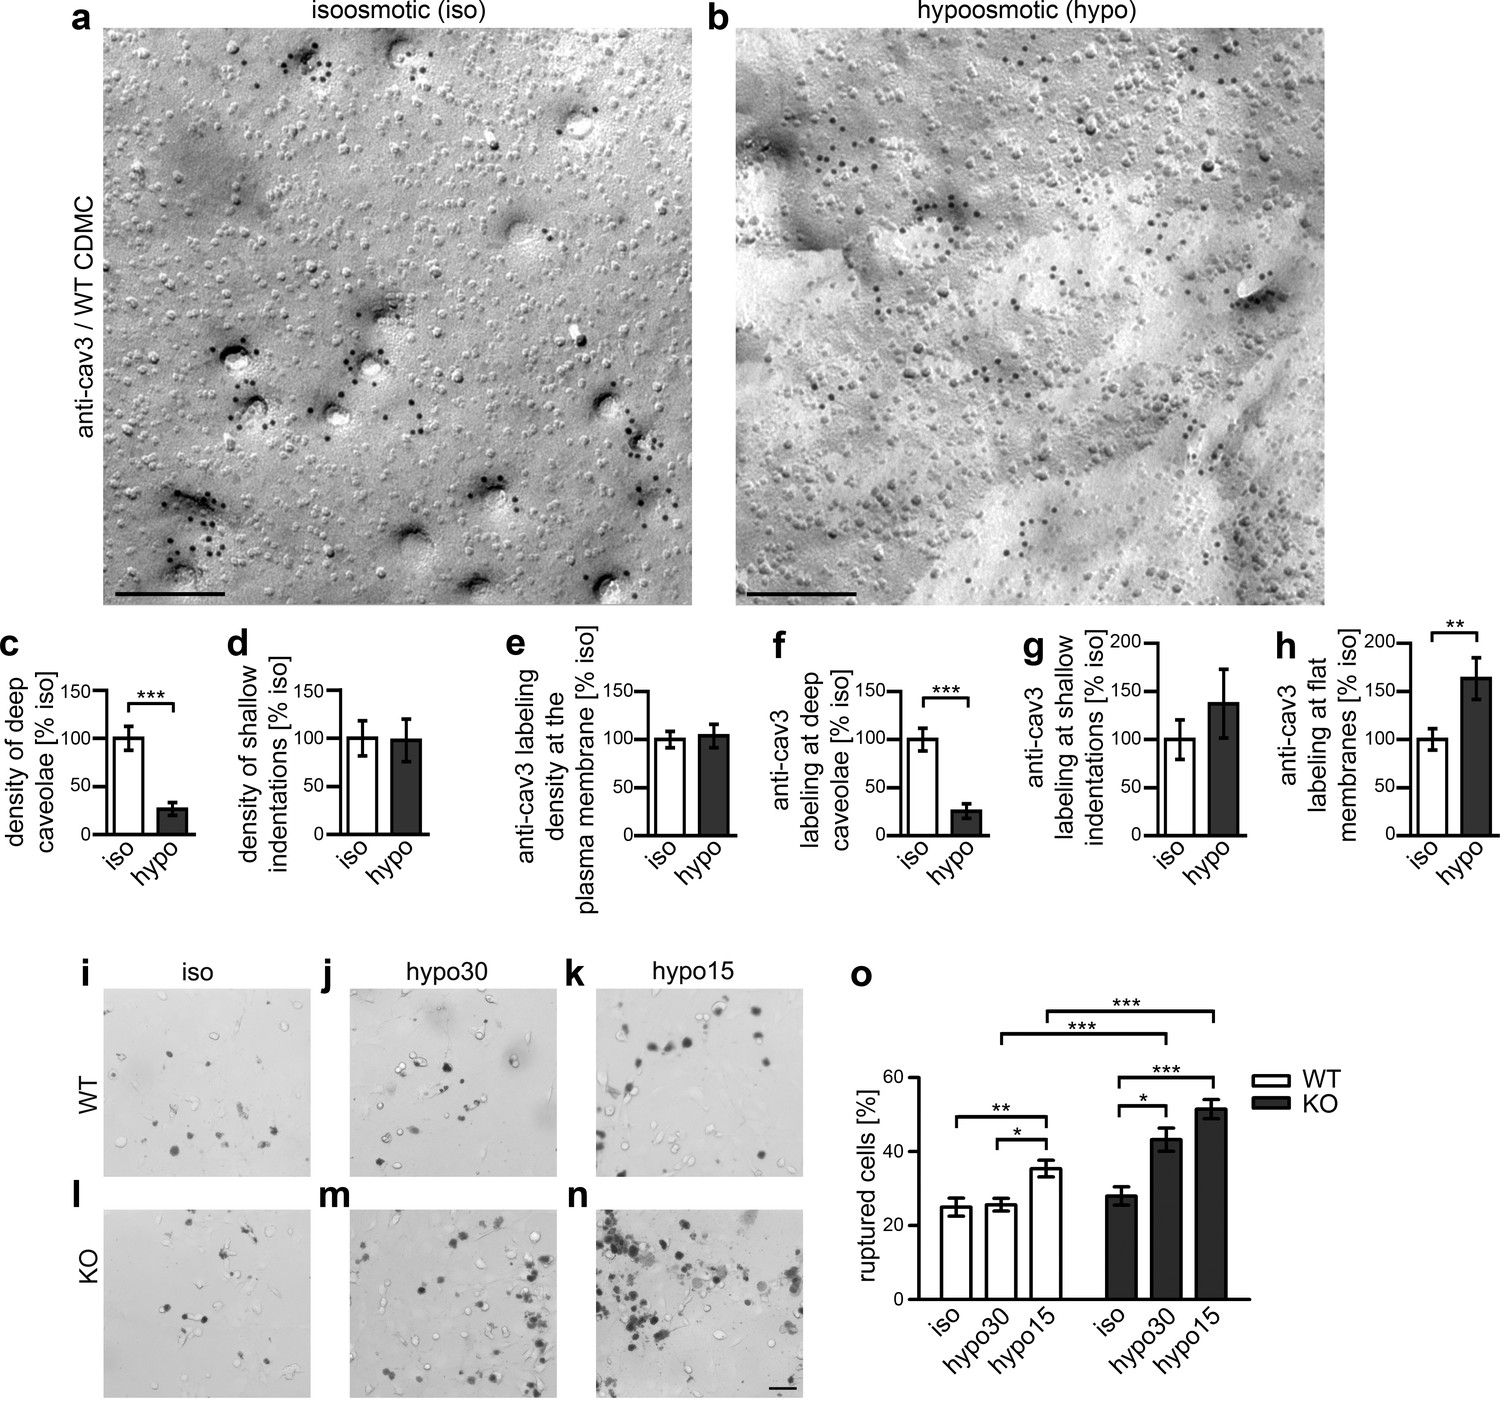
Syndapin III-mediated caveolar invagination counterpoises membrane tensions and thereby ensures cell integrity.
(a,b) Anti-cav3-labeled P-faces of freeze-fractured plasma membranes of cardiomyocytes from WT mice incubated for 5 min in isoosmotic (iso) (a) and hypoosmotic conditions (hypo; hypo15 buffer) (b). Bars, 200 nm. (c,d) A dramatic reduction of deeply invaginated caveolar structures was observed upon the induced, cell swelling-mediated rise in membrane tension caused by hypo conditions. (e–h) Quantitation of the anti-cav3 labeling distribution in total and in relations to deeply invaginated, shallow and flat membrane topologies (relative to isoosmotic condition). Data (c–h), mean ± SEM. iso, 148.8 µm2 membrane area from 43 images, 251 caveolar invaginations; hypo, 124.6 µm2 membrane area from 36 images, 66 caveolar invaginations, two independent cardiomyocyte preparations and assays. Statistical significance, two-tailed Student’s t test. For related examinations of caveolar flattening upon induction of membrane tensions in NIH3T3 cells please see Figure 8—figure supplement 1. (i–o) Trypan Blue assays with WT (i–k) and syndapin III KO cardiomyocytes (l–n) subjected to membrane tensions mimicked by mild hypoosmotic stress (5 min hypo30; j,m) and stronger hypoosmotic stress (5 min hypo15; k,n) unveiling a higher vulnerability of syndapin III KO cells under conditions increasing membrane tensions. Note the increased abundancy of Trypan Blue-positive, ruptured cardiomyocytes upon hypoosmotic stress. Bar in n (for i–n), 50 µm. (o) Quantitative data, mean ± SEM of 18 blinded experiments (about 100 cells each assay) from six independent preparations of cardiomyocytes/genotype. One-way Anova with Tukey’s post-test.
-
Figure 8—source data 1
This spreadsheet contains the data for all quantitative evaluations shown in the different panels of Figure 8 and of the corresponding Figure 8—figure supplement 1 (i.e. of Figure 8c–h and of the Figure 8—figure supplement 1c–h).
- https://doi.org/10.7554/eLife.29854.027
Figure 8—figure supplement 1
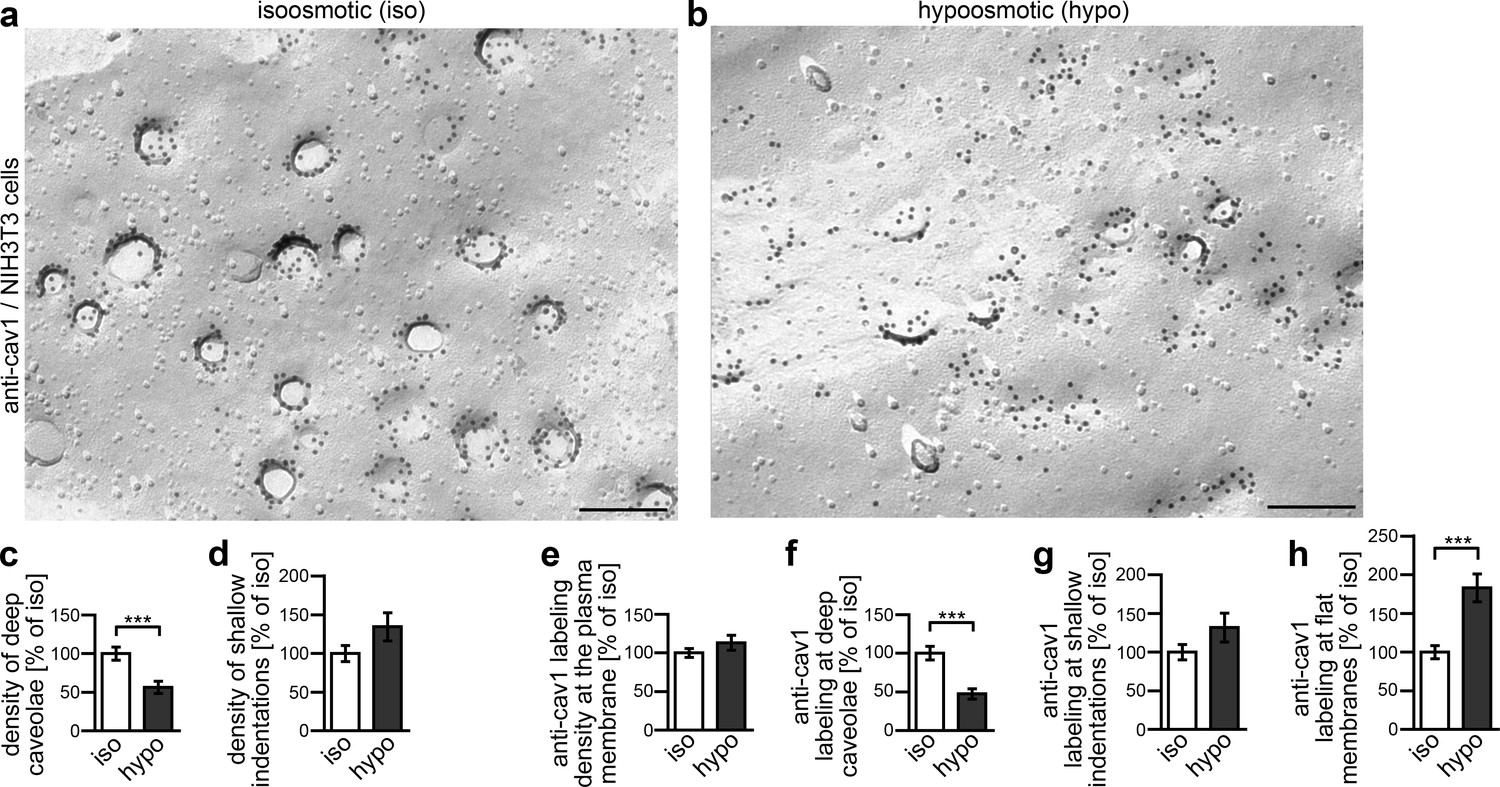
Caveolar flattening upon induction of membrane tensions in NIH3T3 cells.
(a,b) Electron micrographs of P-faces of freeze-fractured plasma membranes of NIH3T3 cells incubated for 5 min in isoosmotic (iso) (a) and hypoosmotic (hypo) conditions (b) and labeled with anti-cav1 antibodies. Bars, 200 nm. (c–d) Quantitative determinations of caveolae and shallow indentations identified by anti-cav1 immunolabeling. Note that caveolae are reduced upon hypoosmotic stress (c, 56.4% of iso). (e–h) Quantitative assessment of the density of anti-cav1 labeling at the plasma membrane in total (e) and of its distribution in relations to deeply invaginated caveolae (cav1-positive), shallow indentations (cav1-positive) and flat membrane topologies (f–h) relative to isoosmotic conditions. Note that while the total anti-cav1 labeling density at the plasma membrane is equal under both conditions (e), the distribution of cav1 is massively shifted to flat membrane topologies upon hypoosmotic swelling and membrane tension (f–h). Iso, 152.2 µm2 membrane from 44 images; hypo, 145.32 µm2 membrane from 42 images from two independent assays. In total, 1767 cav1-positive invaginations were scored (blinded analyses by an independent experimentator). Data represent mean ± SEM. Statistical significance was evaluated using 2-tailed Student’s t test.
Figure 9
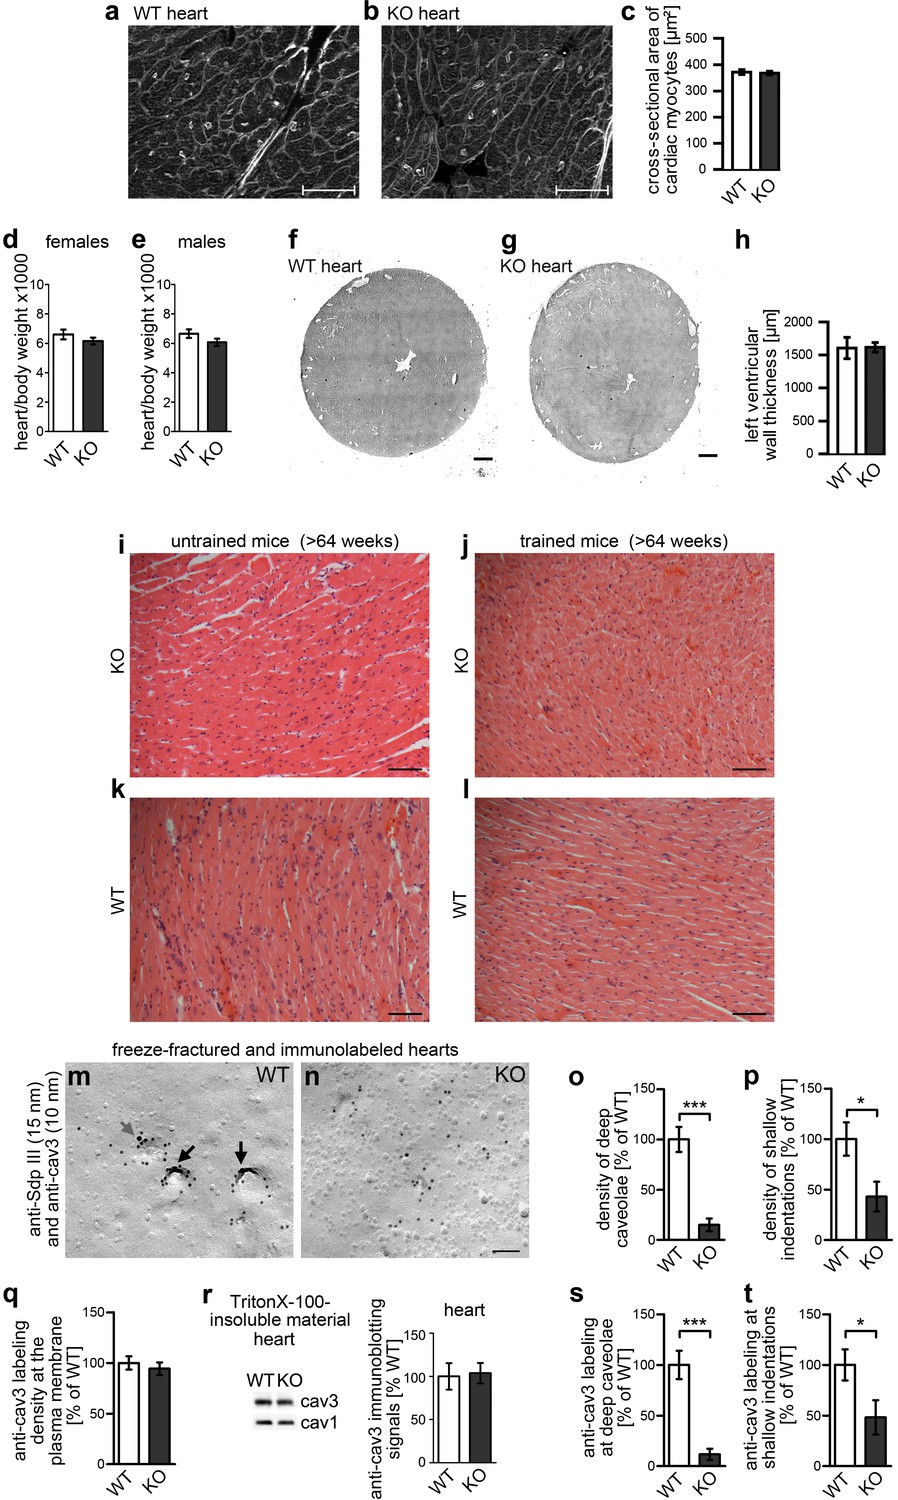
Impairment of caveolar invagination upon syndapin III KO in heart tissue has no consequences on cardiac integrity.
(a–c) Wheat germ agglutinin stainings of 8 µm cryosections of hearts of 20 weeks old syndapin III KO mice (b) show no signs of cellular damage or alteration of cross-sectional areas of cardiac myocytes when compared to WT (a). Bars, 50 µm. Quantitative data (c) represent mean ± SEM. WT, 273 cells, 6 animals; KO, 378 cells, 7 animals. Statistical significance was tested using two-tailed Student’s t test. p=0.7462 (n.s.). (d,e) Ratios (x1000) of heart and body weights of about 4-month-old female (d) and male (e) mice. WT, eight female and male mice each; KO, seven female and nine male mice. Statistical significance, two-tailed Student’s t test. Female mice, p=0.3132 (n.s.); male mice, p=0.1377 (n.s.). (f–h) H&E stainings of WT and syndapin III KO heart cryosections show no left ventricular wall thickening upon syndapin III KO. Bars, 500 µm. Quantitative data represent mean ± SEM. WT, seven animals; KO, nine animals. Statistical significance, two-tailed Student’s t test. p=0.9451 (n.s.). (i–l) H&E stainings of paraffin sections of aged WT and syndapin III KO myocard (three animals each) display no signs of cellular damage or of necrosis irrespective of whether mice were trained or not. Bar, 50 µm. (m,n) Details of wide-field views of P-faces of freeze-fractured heart tissues double-immunogold labeled for cav3 and syndapin III. Note that, also in heart tissue, the formation of caveolae is impaired upon syndapin III KO. In WT, syndapin III and cav3-immunopositive caveolae are marked (long black arrows; shallow, cav3-positive indentation, short grey arrow). Bar, 100 nm. (o,p) Quantitative determinations of caveolae (o) and of shallow, cav3-positive membrane indentations (p) in WT and syndapin III KO hearts. (q) Quantitative assessment of the anti-cav3 labeling densities at membranes of freeze-fractured syndapin III KO hearts relative to WT (n.s.). (r) Quantitative western blotting of TritonX-100-resistant membrane fractions from WT and syndapin III KO hearts showing unchanged cav3 levels. 25 µg protein loaded each. n = 6 each genotype. (s,t) Quantitative assessment of the cav3 immunolabeling at caveolae (s) and shallow indentations (t). Note that the observed decreases are in accordance with the reduced abundance of these structures (compare s,t) vs. (o,p). (o–q, s,t) WT, 72.7 µm2 membrane from 21 images; KO, 72.7 µm2 membrane from 21 images from two independent cardiomyocyte preparations (from two hearts) each genotype. In total, 107 cav3-positive structures scored. Data, mean ± SEM. Statistical significance, two-tailed Student’s t test.
-
Figure 9—source data 1
This spreadsheet contains the data for all quantitative evaluations shown in the different panels of Figure 9 (i.e. of Figure 9c–e,h and o–t).
- https://doi.org/10.7554/eLife.29854.029
Figure 10
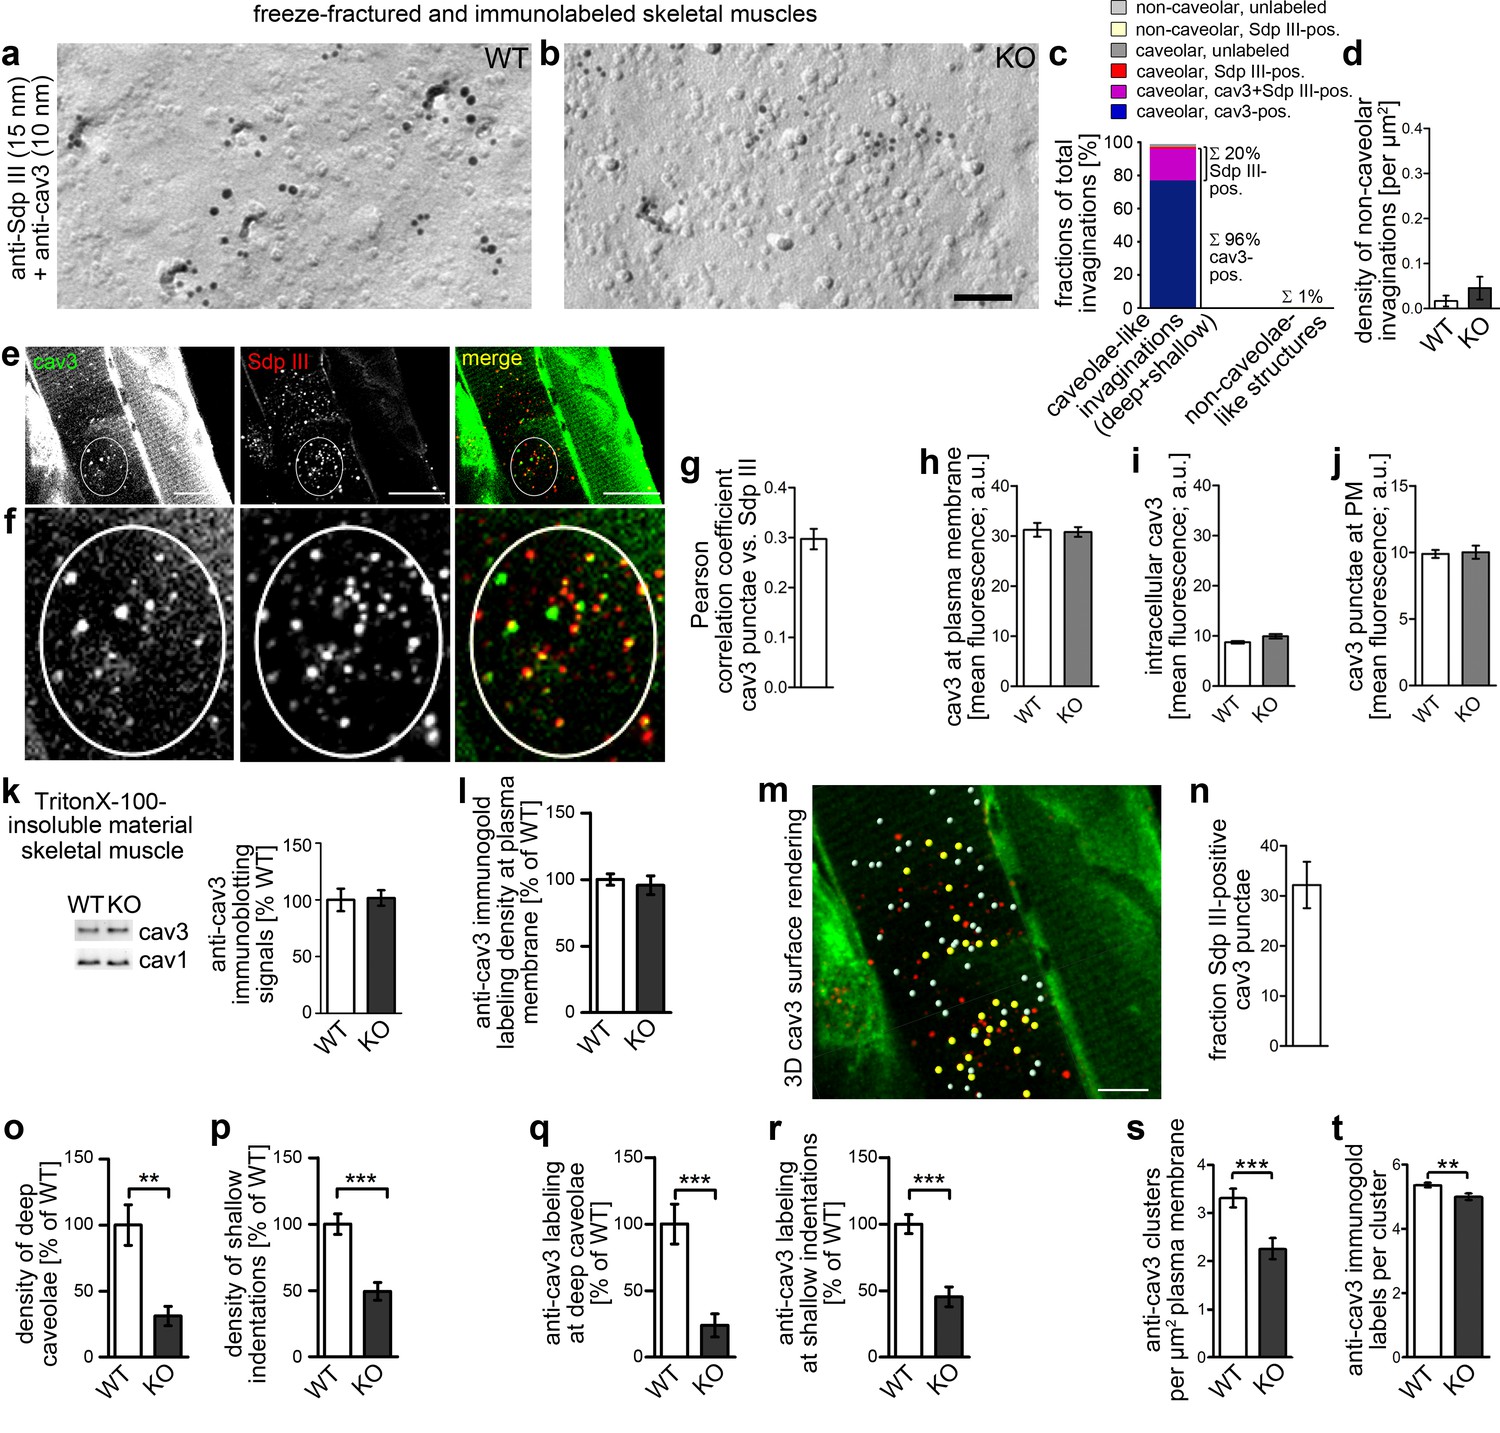
Syndapin III KO causes impairments in caveolar invagination in skeletal muscle.
(a,b) Double-immunogold labeled, freeze-fractured skeletal muscles of WT and syndapin III KO mice (syndapin III, 15 nm gold; cav3, 10 nm gold) show that caveolar invagination is impaired in tissues of syndapin III KO mice. Bar, 200 nm. (c) Analyses of the fractions of caveolar-like profiles (deep and shallow) and non-caveolar invaginations labeled for cav3, syndapin III and both in freeze-fractured muscles. In total, 291 invaginations from WT skeletal muscles were evaluated. (d) Densities of the (extremely rare) non-caveolar invaginations in WT and syndapin III KO cardiomyocytes (low abundance of such structures, in total only n = 2 (WT) and n = 3 (KO) found; n.s.). (e–j) Colocalization analyses based on confocal images of longitudinal sections of skeletal muscles immunostained for cav3 and syndapin III. (e,f) Example images. Encircled is a ROI for colocalization analyses at puncta (e); (f) shows magnification and (g) shows the corresponding Pearson correlation coefficient (n = 60 ROIs). (h–j) Quantitative analyses of anti-cav3 immunofluorescence signals at the plasma membrane ((h); n = 230 ROIs each genotype in transversal sections), in intracellular volumes ((i); n = 160 ROIs each genotype in transversal sections) and in cav3 puncta ((j); n = 60 each genotype in longitudinal sections). (k) Quantitative immunoblotting of TritonX-100-insoluble material showed no differences in cav3 and cav1 levels upon syndapin III KO. 25 µg protein loaded each. WT, 12 animals; KO, 12 animals. (l) Quantitative analyses of immunogold-labeled, freeze-fractured skeletal muscle fibers showing no difference in anti-cav3 labeling density between WT and syndapin III KO muscles at the plasma membrane. (m,n) Example of 3D surface rendering (using IMARIS) of confocal image stacks of the anti-cav3 immunolabeling shown in overview (e) for determination of the frequency of syndapin III-positive cav3 puncta. Yellow spheres, syndapin III-positive; white spheres, syndapin III-negative cav3 3D surface rendered puncta. (n) Quantitative analyses of the frequencies of spatial overlap of syndapin III with cav3 at the level of light microscopy (14 ROIs). (o,p) Quantitation of the densities of deep caveolae and shallow indentations in electron micrographs of freeze-fractured skeletal muscles show severe impairments of caveolar invagination in vivo. (q,r) The relative density (WT = 100%) of the anti-cav3 labeling associated with invaginated, caveolar membrane topologies of syndapin III KO muscle membranes changes in accordance with the reduced densities of invaginated caveolar structures. WT, 128 µm2 membrane from 37 images; KO, 69.2 µm2 membrane from 20 images from two muscle preparations. In total, 400 cav3-positive structures scored. (s,t) Analyses of the density of cav3 clusters at the plasma membrane of freeze-fractured skeletal muscle fibers (s) and of the anti-cav3 immunogold labeling density in cluster ROIs (t). Analyses in (s) were done by image and expressed as clusters/µm2 (Nassoy and Lamaze, 2012). n = 20 images each genotype. (t) n = 377 ROIs (WT) and 148 ROIs (KO). Data, mean ± SEM. Statistical significance, two-tailed Student’s t-test.
-
Figure 10—source data 1
This spreadsheet contains the data for all quantitative evaluations shown in the different panels of Figure 10 (i.e. of Figure 10c,d,g-l and n-t).
- https://doi.org/10.7554/eLife.29854.031
Figure 11

Syndapin III KO leads to skeletal muscle phenotypes reminiscent of clinical symptoms found in patients with myopathies associated with CAV3 mutation.
(a–f) Histological examinations of cryosections of musculus gastrocnemius from >64 weeks old WT and syndapin III KO mice (three animals each). Whereas no clear signs of cellular damage or disintegration were observed by H&E staining under untrained conditions (a,b), syndapin III KO mice displayed a higher frequency of detached nuclei upon training (c), arrows). (e,f) Acidic phosphatase stainings clearly demonstrate necrotic events (asterisks in c) and e). Bars, 50 µm. (g,h) Quantitative evaluations of the frequency of detached nuclei. (i,j) Percental distribution of fiber cross sectional areas (in 50 µm2 intervals) in WT and syndapin III KO muscles. Arrows highlight areas of the caliber spectra with striking differences (black, more frequent in syndapin III KO; grey, more frequent in WT). (k,l) Quantitation of the mean cross sectional areas of muscle fibers in trained and untrained mice of both genotypes. N-numbers (g–l), untrained WT, 849; untrained KO, 952; trained WT, 949; trained KO, 1244 fibers. Data, mean (i,j); error bars omitted for clarity) and mean ± SEM (g,h,k,l), respectively. Statistical significance, 2-tailed Student’s t-test.
Videos
Video 1
Electron tomogram data set of the caveolar invagination shown in Figure 5f,g.
Cav3 and syndapin III are indicated by the electron-dense gold particles (anti-syndapin III, 15 nm; anti-cav3, 10 nm). Reconstruction and tomographic sectioning carried out with IMOD software. Bar, 50 nm.
Video 2
Rotation of the 3D segmentation of a syndapin III and cav3-coated caveolar invagination shown in Figure 5h.
Syndapin III is indicated by the red spheres and cav3 is indicated by the yellow spheres. The Pt/C layer of freeze-fractured cardiomyocyte plasma membrane is indicated (green). Segmentation carried out with IMOD software. Bar, 50 nm.
Tables
Key resources table
| Reagent type (species) or resource | Designation | Source or reference | Identifiers | Additional information |
|---|---|---|---|---|
| Gene (mouse and rat) | PACSIN3/syndapin III | this paper | ||
| Strain, strain background (Mus musculus) | C57BL/6J | Jackson Labs (Bar Harbor, Maine) | IMSR_JAX:000664 | |
| Genetic reagent (Mus musculus) | 129/SvJ mouse genomic λ library | Stratagene (San Diego, California) | ||
| Cell line (Mus musculus) | NIH3T3 | Cell Lines Services GmbH (Eppelheim, Germany) | CVCL_0594 | |
| Cell line (human) | HEK293 | Cell Lines Services GmbH | CVCL0045 | |
| Transfected construct (rat) | GFP-syndapin III F-BAR (aa 1–336; extended F-BAR) | this paper | ||
| Transfected construct (mouse) | Syndapin III aa1-70 peptide (plus five unrelated aa encoded by exon5/6 deletion-induced frame shift and multiple stop codons) | this paper | ||
| antibody | guinea pig anti-syndapin I, rabbit anti-syndapin II, rabbit anti-syndapin III, anti-GST | Koch et al. (2011), EMBO J 30:4955–4969., Qualmann et al. (1999), Mol Biol Cell 10:501–513. Koch et al. (2012), Histochem Cell Biol 138: 215-230., Qualmann and Kelly (2000), J Cell Biol 148:1047–1062 | anti-syndapin I, II, III 1:1000 (western blot); 1:50 (FRIL) | |
| Antibody | goat anti-GAPDH (polyclonal) | Santa Cruz (Dallas, Texas) | sc48167 AB_1563046 | 1:1000 |
| Antibody | mouse anti-cav3 (monoclonal ) | Santa Cruz | sc-5310, AB_626814 | 1:500 (western blot), 1:50 (IHC), 1:50 (FRIL) |
| Antibody | goat anti-cav3 (polyclonal) | Santa Cruz | sc-7665 AB_637945 | 1:500 (western blot), 1:50 (IHC) |
| Antibody | mouse anti-cav1 (monoclonal) | Santa Cruz | sc-53564, AB_628859 | 1:500 (western blot), 1:50 (IHC), 1:50 (FRIL) |
| Antibody | rabbit anti-cav1 (polyclonal) | Santa Cruz | sc-894 AB_2072042 | 1:1000 (western blot), 1:200 (IHC), 1:50 (FRIL) |
| Antibody | rabbit anti-IRTK (polyclonal) | Santa Cruz | sc-710, AB_631106 | 1:1000 (western blot) |
| Antibody | mouse anti-CAVIN-1 (monoclonal) | BD Bioscience (Franklin Lakes, New Jersey) | 611258, AB_398788 | 1:50 (FRIL) |
| Antibody | mouse anti-PDI (monoclonal) | Stressgene (Farmingdale, New York) | ADI-SPA-891, AB_10615355 | 1:1000 (western blot) |
| Antibody | mouse anti-β-actin (monoclonal) | Sigma | A5441, AB_476744 | 1:5000 (western blot) |
| Antibody | mouse anti-β-tubulin (monoclonal) | Sigma | T4026, AB_477577 | 1:1500 (western blot) |
| Antibody | rabbit anti-CAVIN-1 (polyclonal) | Proteintech (Rosemont, Illinois) | 18892–1-AP,AB_10596795 | 1:1000 (western blot), 1:100 (IHC), 1:50 (FRIL) |
| Antibody | rabbit anti-CAVIN-3 (polyclonal) | Proteintech | 16250–1-AP AB_2171894 | 1:1000 (western blot) |
| Antibody | goat anti-CAVIN-2 (polyclonal) | R & D Systems (Minneapolis, Minnesota) | AF5759AB_2269901 | 1:200 (western blot) |
| Antibody | rabbit anti-CAVIN-4 (polyclonal) | Sigma | HPA020987AB_1853080 | 1:400 (western blot) |
| Antibody | mouse anti-β-dystroglycan (monoclonal) | Leica Biosystems (Wetzlar, Germany) | NCL-b-DG,AB_442043 | 1:1000 (western blot); 1:200 (IHC) |
| Antibody | mouse anti-dystrophin (monoclonal) | Leica Biosystems | NCL-DYS1,AB_442080 | 1:200 (western blot); 1:50 (IHC) |
| Antibody | mouse anti-GM130 (monoclonal) | BD Biosciences | 610822AB_398141 | 1:1000 (western blot) |
| Antibody | mouse anti-β-catenin (monoclonal) | BD Biosciences | 610153, AB_397554 | 1:1000 (western blot) |
| Antibody | mouse anti-ERK1/2 (monoclonal) | Cell Signalling (Danvers, Massachusetts) | #9107AB_2235073 | 1:5000 (western blot) |
| Antibody | mouse anti-pERK1/2 (monoclonal) | Cell Signalling | #9106, AB_331768 | 1:1000 (western blot) |
| Antibody | mouse anti-GFP (monoclonal) | Clontech (Mountain View, California) | 632380,AB_10013427 | 1:8000 (western blot) |
| Antibody | rabbit anti-Cherry(polyclonal) | Abcam (Cambridge, UK) | ab167453AB_2571870 | 1:1000 (western blot) |
| Antibody | Alexa Fluor555-labeled wheat germ agglutinin (WGA) | Molecular Probes (Eugene, Oregon) | W32464 | 1:2000 (IF) |
| Antibody | Alexa Fluor488-labeled wheat germ agglutinin (WGA) | Molecular Probes | W11261 | 1:2000 (IF) |
| Antibody | Alexa Fluor488-labeled goat anti-guinea pig | Molecular Probes | AB_142018 | 1:1000 (IF) |
| Antibody | Alexa Fluor568-labeled goat anti-guinea pig | Molecular Probes | AB_141954 | 1:1000 (IF) |
| Antibody | Alexa Fluor488-labeled donkey anti-mouse | Molecular Probes | AB_141607 | 1:1000 (IF) |
| Antibody | Alexa Fluor568-labeled donkey anti-mouse | Molecular Probes | AB_2534013 | 1:1000 (IF) |
| Antibody | Alexa Fluor647-labeled goat anti-mouse | Molecular Probes | AB_141725 | 1:1000 (IF) |
| Antibody | Alexa Fluor488-labeled donkey anti-rabbit | Molecular Probes | AB_141708 | 1:1000 (IF) |
| Antibody | Alexa Fluor568-labeled goat anti-rabbit antibodies | Molecular Probes | AB_143011 | 1:1000 (IF) |
| Antibody | Alexa Fluor647-labeled goat anti-rabbit antibodies | Molecular Probes | AB_141775 | 1:1000 (IF) |
| Antibody | Alexa Fluor680-labeled donkey-anti-goat | Molecular Probes | AB_141494 | 1:10000 (western blot) |
| Antibody | Alexa Fluor680-labeled goat-anti-rabbit | Molecular Probes | AB_2535758 | 1:10000 (western blot) |
| Antibody | Alexa Fluor680-labeled goat-anti-mouse | Molecular Probes | AB_1965956 | 1:10000 (western blot) |
| Antibody | goat anti-rabbit-peroxidase | Dianova (Hamburg, Germany) | AB_2337945 | 1:10000 (western blot) |
| Antibody | goat anti-guinea pig-peroxidase | Dianova | AB_2337405 | 1:10000 (western blot) |
| Antibody | goat anti-mouse-peroxidase | Dianova | AB_2338523 | 1:10000 (western blot) |
| Antibody | DyLight800-conjugated goat anti-rabbit | Pierce/Thermo (Waltham, Massachusetts) | AB_2556775 | 1:10000 (western blot) |
| Antibody | DyLight800-conjugated goat anti-mouse | Pierce | AB_2556774 | 1:10000 (western blot) |
| Antibody | IRDy 800CW-conjugated donkey anti-goat | BioTrend (Köln, Germany) | AB_220102 | 1:10000 (western blot) |
| Antibody | anti-guinea pig antibodies coupled to IRDye680 | LI-COR Bioscience (Lincoln, Nebraska) | AB_10956079 | 1:10000 (western blot) |
| Antibody | anti-guinea pig antibodies coupled to IRDye800 | LI-COR Bioscience | AB_1850024 | 1:10000 (western blot) |
| Antibody | gold-labeled goat anti-rabbit (10 nm) | British Biocell International (Cardiff, UK) | AB_1769130 | 1:50 (FRIL) |
| Antibody | gold-labeled goat anti-rabbit (15 nm) | British Biocell International | AB_1769134 | 1:50 (FRIL) |
| Antibody | gold-labeled goat anti-mouse (10 nm) | British Biocell International | AB_1769156 | 1:50 (FRIL) |
| Antibody | gold-labeled goat anti-mouse (15 nm) | British Biocell International | AB_2715551 | 1:50 (FRIL) |
| Recombinant DNA reagent | rat syndapin III full length (aa 1–424) in pGEX-5X1 (plasmid) | Braun et al. (2005) Mol Biol Cell, 16:3642–3658. | ||
| Recombinant DNA reagent | rat syndapin III F-BAR (aa 1–336; extended F-BAR) in pGEX-5X1 (plasmid) | this paper | ||
| Recombinant DNA reagent | rat syndapin III ∆F-BAR (aa 336–424) in pGEX-5X1 (plasmid) | this paper | ||
| Recombinant DNA reagent | rat syndpin III SH3 (aa 366–424) in pGEX-5X1 (plasmid) | this paper | ||
| Recombinant DNA reagent | rat syndapin III ∆SH3 (aa 1–365) in pGEX-5X1 (plasmid) | this paper | ||
| Recombinant DNA reagent | GFP-rat syndapin III F-BAR (aa 1–336; extended F-BAR) in pEGFP-C2 (plasmid) | this paper | ||
| Recombinant DNA reagent | mouse syndapin III aa1-70 peptide (plus five unrelated aa encoded by exon5/6 deletion-induced frame shift and multiple stop codons) plasmids including pGEM-T, mCherry-pCMV-Tag2b, pEGFP-C2 and pGEX-5X-1 | this paper | ||
| Peptide, recombinant protein | rat GST-syndapin III full length (aa 1–424) and rat syndapin III full-length (untagged) | Braun et al. (2005) Mol Biol Cell 16:3642–3658 (for plasmid and (uncut) GST-fusion protein) | Untagged syndapin III was obtained from GST-syndapin III upon cleavage of the GST tag with 6 U precission protease/mg protein and overnight dialysis against 20 mM HEPES, 150 mM NaCl, 2 mM EDTA und 2.5 mM DTT pH 7.4 at 4°C. | |
| Peptide, recombinant protein | rat GST-syndapin III F-BAR (GST+Sdp III aa 1–336; extended F-BAR) | this paper | ||
| Peptide, recombinant protein | rat GST-syndapin III ∆F-BAR (GST+Sdp III aa 336–424) | this paper | ||
| Peptide, recombinant protein | rat GST-syndapin III SH3 (GST+SdpIII aa 366–424) | this paper | ||
| Peptide, recombinant protein | rat GST-syndapin III ∆SH3 (GST+Sdp III aa 1–365) | this paper | ||
| Commercial assay or kit | NucleoSpin Plasmid | Macherey-Nagel (Düren, Germany) | 740.588.250 | |
| Commercial assay or kit | NucleoBond Xtra Midi | Macherey-Nagel | 740.410.100 | |
| Commercial assay or kit | Rediprime II Random Prime Labelling System | GE Healthcare (Chicago, Illinois) | #RPN1633 | |
| Chemical compound, drug | α P32 dCTP | GE Healthcare (Chicago, Illinois) | ||
| Software, algorithm | AxioVision 4.8.2 | Zeiss (Oberkochen, Germany) | SCR_002677 | |
| Software, algorithm | ZEN 2012 | Zeiss | SCR_013672 | |
| Software, algorithm | Prism6 | GraphPad (La Jolla, California) | SCR_002798 | |
| Software, algorithm | imageJ | other | SCR_003070 | open source software |
| Software, algorithm | IMOD package | Kremer et al. (1996) Journal of Structural Biology, 116, 71–76 | SCR_003297 | open source software |
| Software, algorithm | IMARIS 8.4 | Bitplane (Zürich, Switzerland) | SCR_007370 | |
| Other | DAPI stain | Molecular Probes | (1:10000) |
Additional files
-
Transparent reporting form
- https://doi.org/10.7554/eLife.29854.033
Download links
A two-part list of links to download the article, or parts of the article, in various formats.
Downloads (link to download the article as PDF)
Open citations (links to open the citations from this article in various online reference manager services)
Cite this article (links to download the citations from this article in formats compatible with various reference manager tools)
Deciphering caveolar functions by syndapin III KO-mediated impairment of caveolar invagination
eLife 6:e29854.
https://doi.org/10.7554/eLife.29854


