Small molecule inhibition of apicomplexan FtsH1 disrupts plastid biogenesis in human pathogens
- Stanford Medical School, United States
- Massachusetts Institute of Technology, United States
- The J. Craig Venter Institute, United States
Figures
Figure 1 with 3 supplements

Actinonin inhibits apicoplast biogenesis in P. falciparum.
(a) Structure of actinonin. (b) Time course of parasite growth during actinonin treatment with or without IPP, normalized to control cultures with or without IPP as appropriate. Error bars represent the SEM of two biological replicates. (c) Time course of the apicoplast:nuclear genome ratio measured by quantitative PCR (qPCR) using primers for the apicoplast and nuclear genomes during treatment with actinonin and IPP. Genome ratios were normalized to control parasites grown with IPP only. Error bars as in b. (d) Representative images of the apicoplast of IPP-rescued control and actinonin treated parasites 24 hr after treatment during the schizont stage. The apicoplast is visualized using the P. falciparum reporter strain D10 ACP-GFP in which GFP is targeted to the apicoplast and the nucleus is stained with Hoescht 33342. During Plasmodium replication, the apicoplast starts as a single small spherical organelle (ring stage) which branches and divides into multiple apicoplasts (schizont stage). A punctate apicoplast that does not branch indicates a defect in apicoplast biogenesis.
-
Figure 1—source data 1
Antimalarial activity of inhibitors screened in this study.
- https://doi.org/10.7554/eLife.29865.006
-
Figure 1—source data 2
Numerical data for Figure 1 and Figure 1—figure supplement 1 .
- https://doi.org/10.7554/eLife.29865.007
Figure 1—figure supplement 1
Actinonin specifically inhibits the apicoplast of P. falciparum leading to parasite death after a single replication cycle.
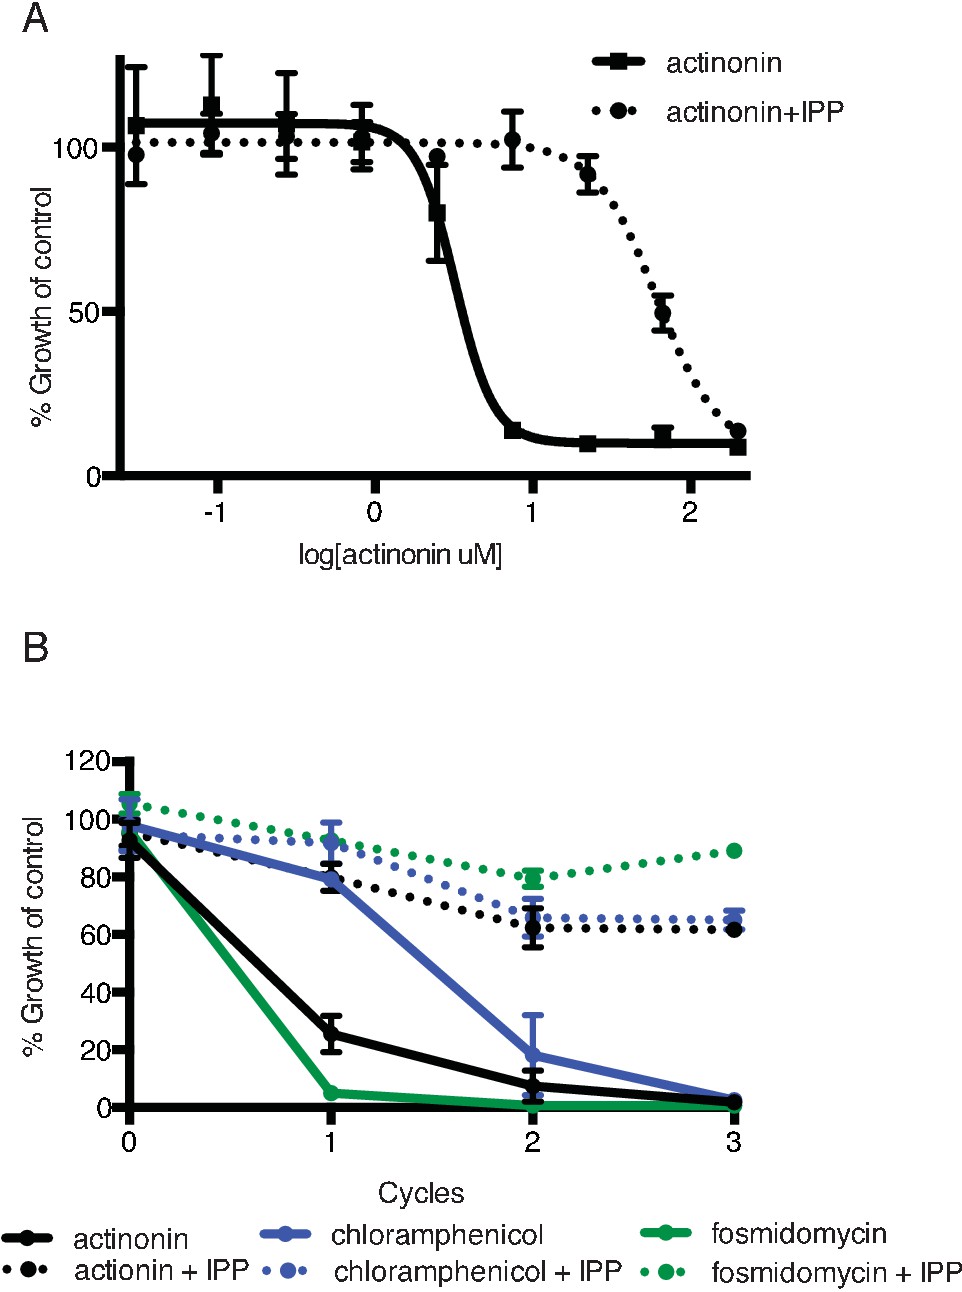
(a) Dose-dependent parasite growth inhibition by actinonin in the absence or presence of IPP. Error bars represent the standard error of the mean (SEM) of two biological replicates. (b) Time course of parasite growth during treatment with actinonin, chloramphenicol, or fosmidomycin in the absence or presence of IPP. Growth is normalized to untreated or IPP-rescued controls as appropriate. Error bars as in a. In contrast to other antimalarials, which cause growth inhibition in a single replication cycle, ‘delayed death’ in P. falciparum is associated with inhibitors of apicoplast gene expression and has previously been described in detail (Dahl and Rosenthal, 2007a). It is characterized by a normal apicoplast and cell division during drug treatment for one replication cycle, followed by halted apicoplast and cell division in daughter parasites of drug-treated parasites.
Figure 1—figure supplement 2
Actinonin has a distinct inhibition phenotype compared to inhibitors of apicoplast metabolism and translation.
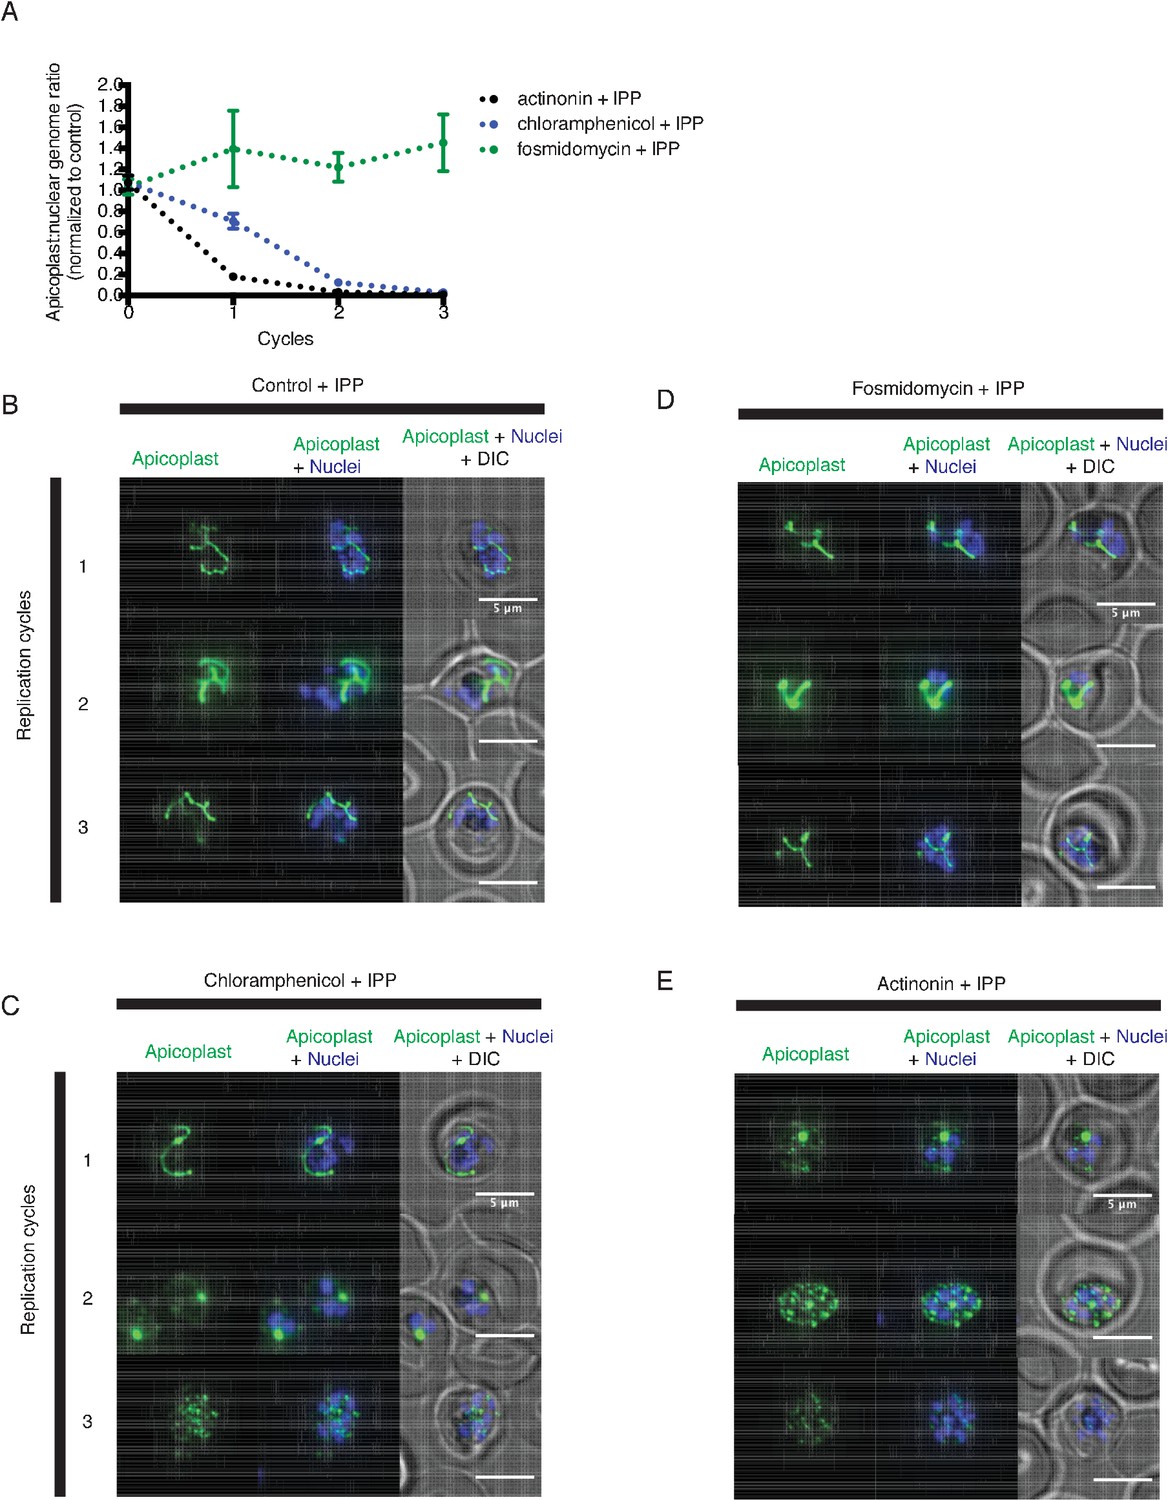
(a) Time course of the apicoplast:nuclear genome ratio measured by quantitative PCR (qPCR) for targets in the apicoplast and nuclear genome during treatment with actinonin (black), chloramphenicol (blue), or fosmidomycin (green). While actinonin treatment blocks apicoplast genome replication in a single replication cycle, this effect is not observed until the second replication cycle of chloramphenicol treatment and not at all during fosmidomycin treatment. This is consistent with actinonin blocking apicoplast biogenesis, chloramphenicol blocking apicoplast translation leading to a delayed apicoplast biogenesis defect, and fosmidomycin blocking apicoplast metabolic function but not biogenesis. All samples were grown in IPP and genome ratios were normalized to the untreated control cultures also containing IPP. Error bars represent the SEM of at least 2 biological replicates. (b–e) Representative images of the apicoplast during schizont stage of three successive replication cycles in untreated (b), chloramphenicol (c), fosmidomycin (d) and actinonin (e) treated cultures all grown with IPP. The apicoplast is visualized using the P. falciparum reporter strain D10 ACP-GFP in which GFP is targeted to the apicoplast and the nucleus is stained with Hoescht 33342. In this case, a branched apicoplast indicates successful apicoplast development while punctate apicoplasts (observed in replication cycle 1 for actinonin treatment (e) and replication cycle 2 for chloramphenicol treatment (c)) represents an apicoplast that has failed to develop. The apicoplast is no longer present after replication cycle 2 of actinonin treatment and upon replication cycle 3 of chloramphenicol treatment, which leads to complete mislocalization of the GFP.
Figure 1—figure supplement 3
Actinonin is unlikely to inhibit the peptide deformylase of P. falciparum.
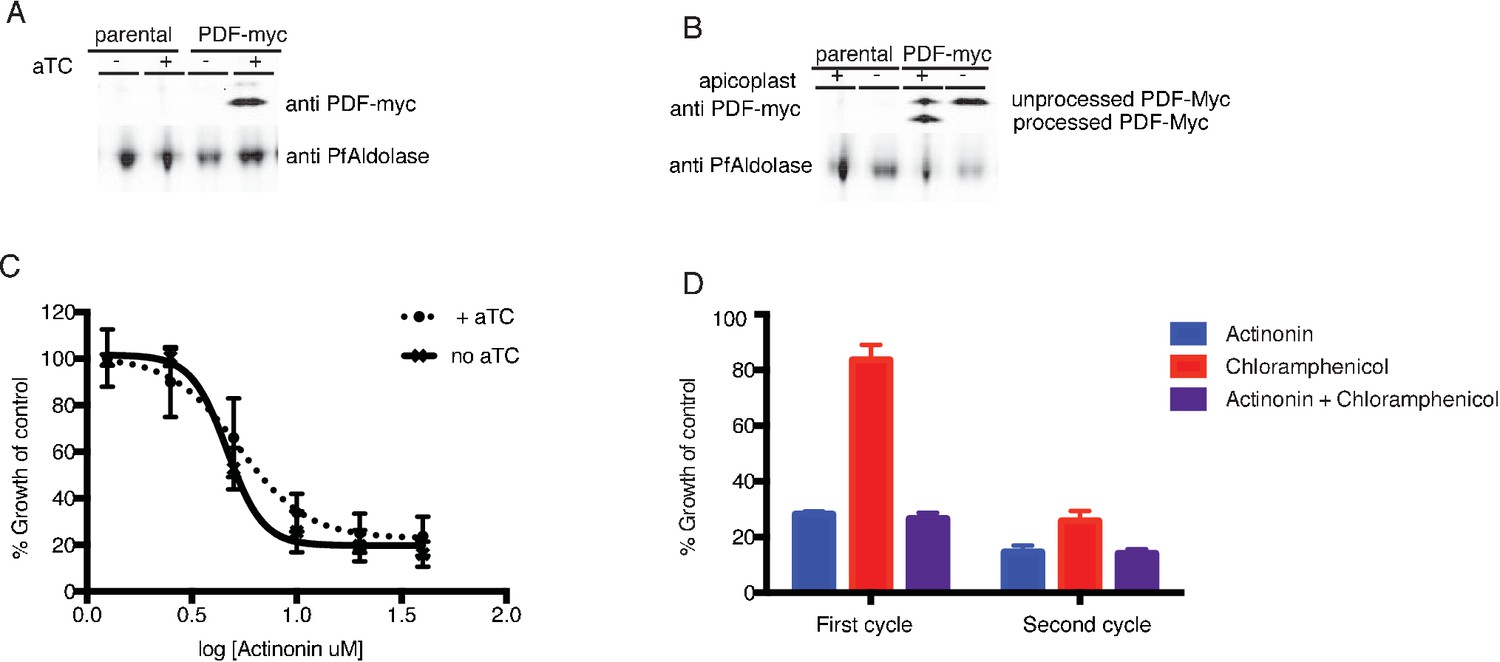
(A) Western blot of the parental line (NF54attB-pCRISPR) and the PDF-myc parasites grown with our without aTC for 24 hr. Induction of the second copy of PfPDF (PDF-myc) with 4 uM aTC results in two bands, the top lighter band representing unprocessed PDF-myc, and the bottom darker band representing processed PDF-myc. PfAldolase is used as a loading control. Induction with 0.125–4 uM aTC results in similar amount of PDF-myc induction (data not shown). (B) Western blot for PDF-myc of parasites with or without their apicoplast. An accumulation of unprocessed PDF-myc is observed when the apicoplast is missing, due to loss of the transit peptide cleavage that usually occurs upon import to the apicoplast. This has been shown previously for apicoplast-resident proteins and is consistent apicoplast localization (Yeh and DeRisi, 2011). (C) Dose dependent parasites growth inhibition by actinonin in the presence of 4 uM aTC does not change the actinonin EC50. This experiment was also performed under IPP rescue conditions, to confirm apicoplast specificity of actinonin and with a range of aTC concentrations (0.125–4 uM) to insure max expression of PDF-myc (data not shown). Error bars represent the SEM of 3 biological replicates. (D) Parasite growth after one or two replication cycles after treatment with actinonin, chloramphenicol, or both actinonin and chloramphenicol normalized to growth of an untreated control. Treatment with actinonin alone inhibited growth after the first replication cycle, whereas treatment with chloramphenicol alone inhibited growth after the second replication cycle. Co-treatment with chloramphenicol, which targets apicoplast translation, did not suppress effects of actinonin treatment, which was inconsistent with actinonin targeting the peptide deformylase (PDF) of the apicoplast. This experiment was tried using a range of concentrations of actinonin and chloramphenicol to insure the data was not the result of partial inhibition. All concentrations that lead to apicoplast-specific death gave this phenotype (data not shown).
Figure 2 with 1 supplement
A mutation in the protease domain of ftsH1 is sufficient to confer resistance to actinonin in T. gondii.
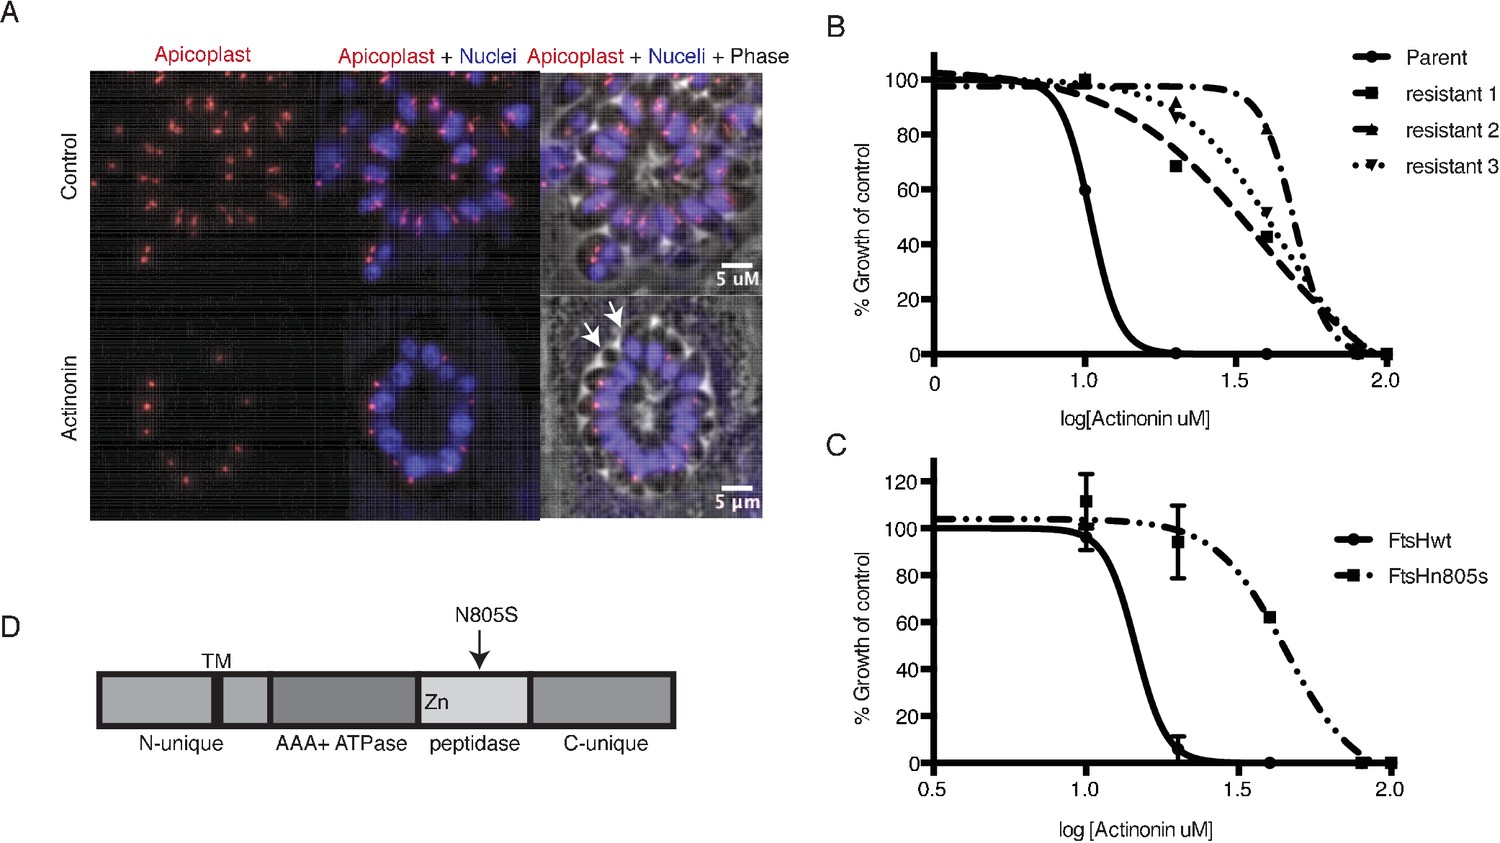
(a) Representative images of the apicoplast of control and actinonin treated parasites 36 hr after infection. The apicoplast is visualized using the T. gondii reporter strain RH FNR-RFP in which RFP is targeted to the apicoplast and the nucleus is stained with Hoescht 33342. Each parasite contains one apicoplast, except during cell division when there may be two. White arrows point at examples of T. gondii parasites missing an apicoplast. (b) Dose-dependent parasite growth inhibition upon treatment with actinonin for the actinonin-sensitive parent strain (RH) compared with 3 independent clones following selection for actinonin resistance (resistant 1, resistant 2, resistant 3). These three resistant clones are representative of the eight clones submitted for whole genome sequencing. Growth was measured via summed areas of the plaques formed during plaque assays and normalized to untreated controls. Error bars represent the SEM of two biological replicates. (c) Dose-dependent parasite growth inhibition upon treatment with actinonin for ftsH1WT compared with ftsH1(N805S) parasites in RH Δku80 strain. Data was measured and analyzed as in 2b. (d) Schematic of TgFtsH1. This protein contains a N-unique region containing a putative transmembrane domain, an AAA ATPase domain used for unfolding proteins, a peptidase domain with a zinc co-factor in the catalytic site, and a C-unique region. The resistance-conferring variant FtsH(N805S) is found in the peptidase domain near the catalytic site.
-
Figure 2—source data 1
Mutations discovered from whole-genome sequencing of actinonin-resistant T. gondii.
- https://doi.org/10.7554/eLife.29865.010
-
Figure 2—source data 2
Numerical data for Figure 2 and Figure 2—figure supplement 2 .
- https://doi.org/10.7554/eLife.29865.011
Figure 2—figure supplement 1
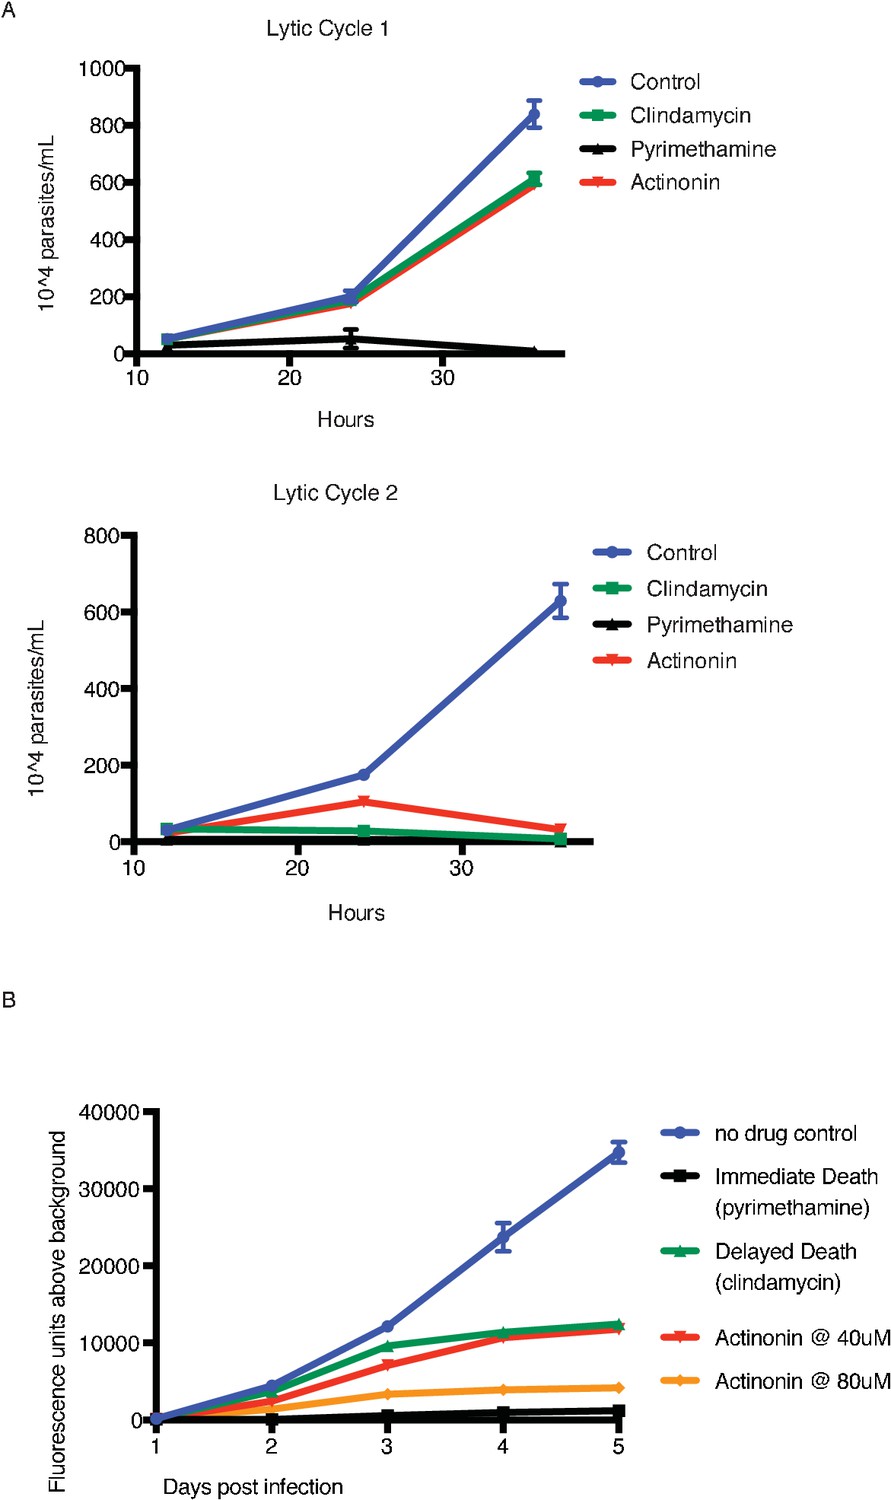
Actinonin treatment causes ‘delayed death’ in T. gondii associated with apicoplast loss.
(A) Time course of parasite growth of untreated (blue), clindamycin (green), pyrimethamine (black), or actinonin (red) treated parasites over the course of two lytic cycles. Unlike P. falciparum, T. gondii undergoes multiple replication cycles in the host cell before lysis, thus each T. gondii lytic cycle represents multiple parasite replication cycles. Pyrimethamine inhibits parasite dihydrofolate reductase and was used as a control for a non-apicoplast targeting drug that inhibits growth in a single lytic cycle. As previously reported (Camps et al., 2002), clindamycin, an apicoplast translation inhibitor, gave a ‘delayed death’ phenotype in T. gondii characterized by completed cell divisions and host re-invasion during drug treatment in the first lytic cycle, followed by halted cell division in the second lytic cycle. Actinonin also led to growth inhibition in the second lytic cycle, suggesting that it also targets the apicoplast. Error bars represent the SEM of two biological replicates. It is important to distinguish between apicoplast-associated ‘delayed death’ in P. falciparum and that in T. gondii. In T. gondii, apicoplast loss occurs in the first lytic cycle and is temporally separate from defects in parasite cell division and growth inhibition observed in the second lytic cycle; whereas in P. falciparum defects in apicoplast biogenesis, parasite cell division, and growth inhibition all occur in the second replication cycle. ‘Delayed death’ in T. gondii therefore appears more broadly associated with disruption of apicoplast biogenesis, where ‘delayed death”in P. falciparum appears more specific to disruption of apicoplast gene expression that leads to delayed biogenesis defects. (B) To determine dose-dependent drug target specificity, we used a previously described fluorescent growth assay to quantify the kinetics of death in T. gondii (Gubbels et al., 2003). Briefly, T. gondii expressing tandem-tomato are treated with drug and fluorescence is quantified daily as a proxy of parasite replication. While 40 uM actinonin leads to delayed-death kinetics similar to clindamycin, 80 uM actinonin results in immediate death kinetics similar to pyrimethamine, indicating that at this concentration, actinonin hits a second, non-apicoplast target.
Figure 3 with 2 supplements

Knockdown of ftsH1 in P. falciparum leads to apicoplast loss and hypersensitivity to actinonin.
(a) Schematic of the endogenous knockdown strategy. When aTC is present in the media, the tet-repressor binds aTC and does not bind the 10x-aptamer sequence, which relieves translational repression, allowing PfFtsH1 to be expressed. When aTC is washed out of the media, the tet-repressor binds the 10x-aptamer and prevents expression of PfFtsH1. (b) Time course of parasite growth without aTC and in the presence or absence of IPP in the media, normalized to the untreated or IPP-rescued parental strain as appropriate. Error bars represent the SEM of two biological replicates. (c) Time course of the apicoplast:nuclear genome ratio measured by quantitative PCR (qPCR) using primers for the apicoplast and nuclear genomes during treatment with or without aTC. All samples contained IPP to rescue parasite growth. Genome ratios were normalized to respective parental cultures also grown with IPP. Error bars as in c. (d) Dose-dependent parasite growth inhibition by actinonin in the absence or presence of aTC. Error bars as in c.
-
Figure 3—source data 1
Oligonucleotide primers and plasmids used in this study.
- https://doi.org/10.7554/eLife.29865.015
-
Figure 3—source data 2
Numerical data for Figure 3 and Figure 3—figure supplement 3 .
- https://doi.org/10.7554/eLife.29865.016
Figure 3—figure supplement 1
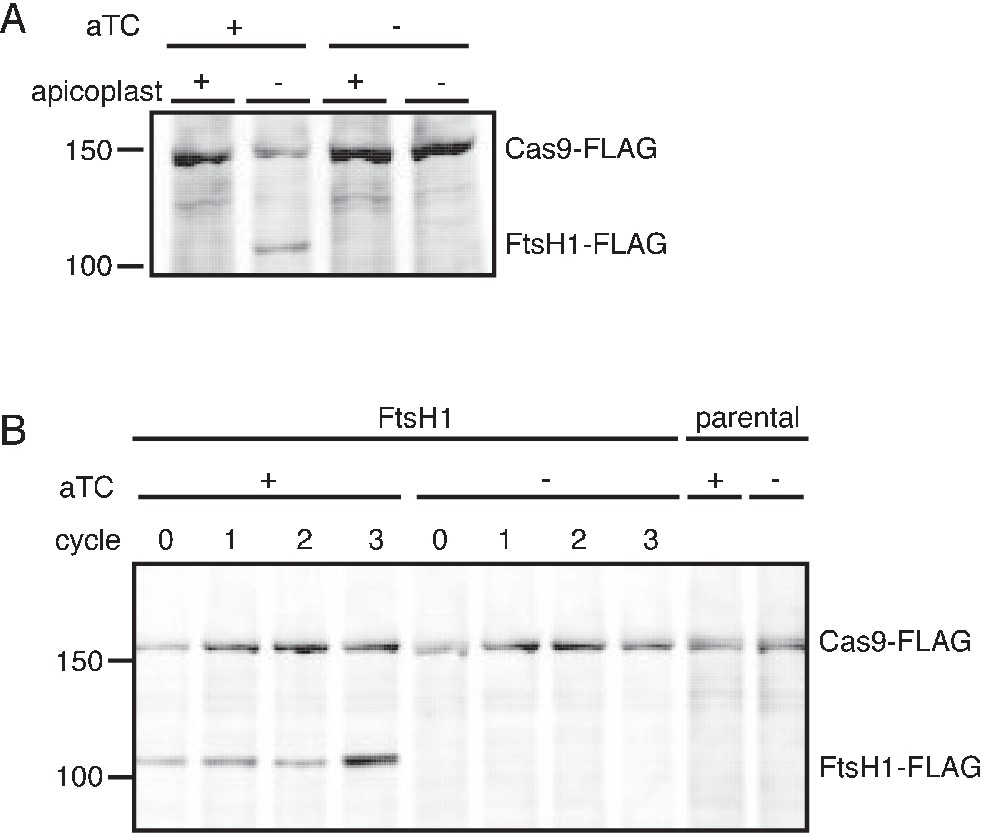
C-terminal cleavage of PfFtsH1 is dependent on the presence of the apicoplast and efficiency of PfFtsH1 knockdown can be assessed in parasites missing their apicoplast.
(A) Western blot of PfFtsH-FLAG levels in parasites with and without an apicoplast and with and without aTC induction. Consistent with the previous report of PfFtsH1 C-terminal processing, we were unable to detect full-length PfFtsH1-FLAG using anti-FLAG in parasites with intact apicoplasts (lane 1) (Tanveer et al., 2013; Karnataki et al., 2009). However, in parasites missing apicoplasts, full-length PfFtsH1-FLAG was detectable, suggesting that PfFtsH1 processing requires the apicoplast (lanes 2). PfFtsH1-FLAG is not observed in parasites with or without apicoplasts if there is no aTC induction, indicating that the band representing FtsH-FLAG is specific and not an artifact of missing apicoplasts (lanes 3–4 respectively). All samples contain IPP to rescue growth and Cas9-FLAG is used as a loading control. Each sample was taken at the trophozoite stage. (B) To assess the knockdown efficiency of PfFtsH1, we used a western blot comparing PfFtsH1-FLAG levels in the presence (lanes 1–4) or absence of aTC (lanes 5–8) in IPP-rescued parasites missing their apicoplast. Each sample was taken at the trophozoite stage and cycle 0 indicates 24 hr after the removal of aTC. Lanes 9 and 10 are samples from the parental strain that do not contain the FLAG-tag or the aptamer sequence in the 3’ UTR of PfFtsH1. In each case, Cas9-FLAG was used as a loading control. PfFtsH1-FLAG levels were reduced to undetectable levels at 24 hr after aTC removal, validating our knockdown strategy.
Figure 3—figure supplement 2
Knockdown of PfFtsH1 specifically disrupts the apicoplast and leads to specific hypersensitivity to actinonin.
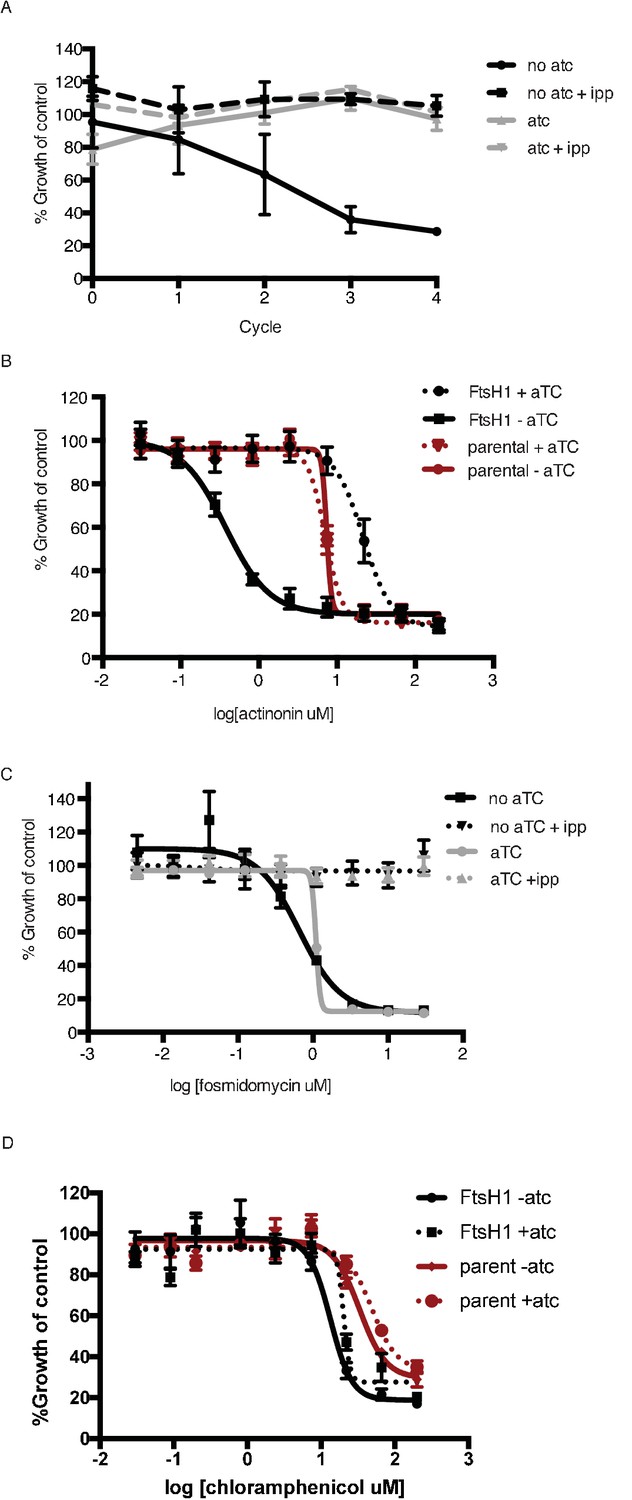
(a) Time course of parasite growth with or without aTC and with or without IPP in the media. IPP rescues the growth defect observed in upon PfFtsH1 downregulation, indicating that PfFtsH1 is essential for an apicoplast-specific function. Growth is shown normalized to the untreated or IPP-rescued parental strain as appropriate. Error bars represent the SEM of two biological replicates. (b) Dose-dependent parasite growth inhibition by actinonin with or without aTC for the parental (red) and PfFtsH (black) strain. The EC50 of the parental strain is unchanged by the removal of aTC. Error bars as in a. (c) Dose-dependent parasite growth inhibition by fosmidomycin with or without aTC and with or without IPP. The fosmidomycin EC50 is unchanged by regulating levels of PfFtsH1, indicating that the observed hypersensitivity to actinonin upon knockdown of PfFtsH1 is specific to actinonin and does not occur for all apicoplast drug. Error bars represent the SEM of three technical replicates. (d) Dose-dependent parasites growth inhibition by chloramphenicol during the second lytic cycle (120 hr) with or without aTC. Error bars represent the SEM of three technical replicates. The chloramphenicol EC50 is unchanged by regulating levels of PfFtsH1, indicating that the observed hypersensitivity to actinonin upon knockdown of PfFtsH1 is specific to actinonin and does not occur for all apicoplast drugs.
Figure 4 with 1 supplement
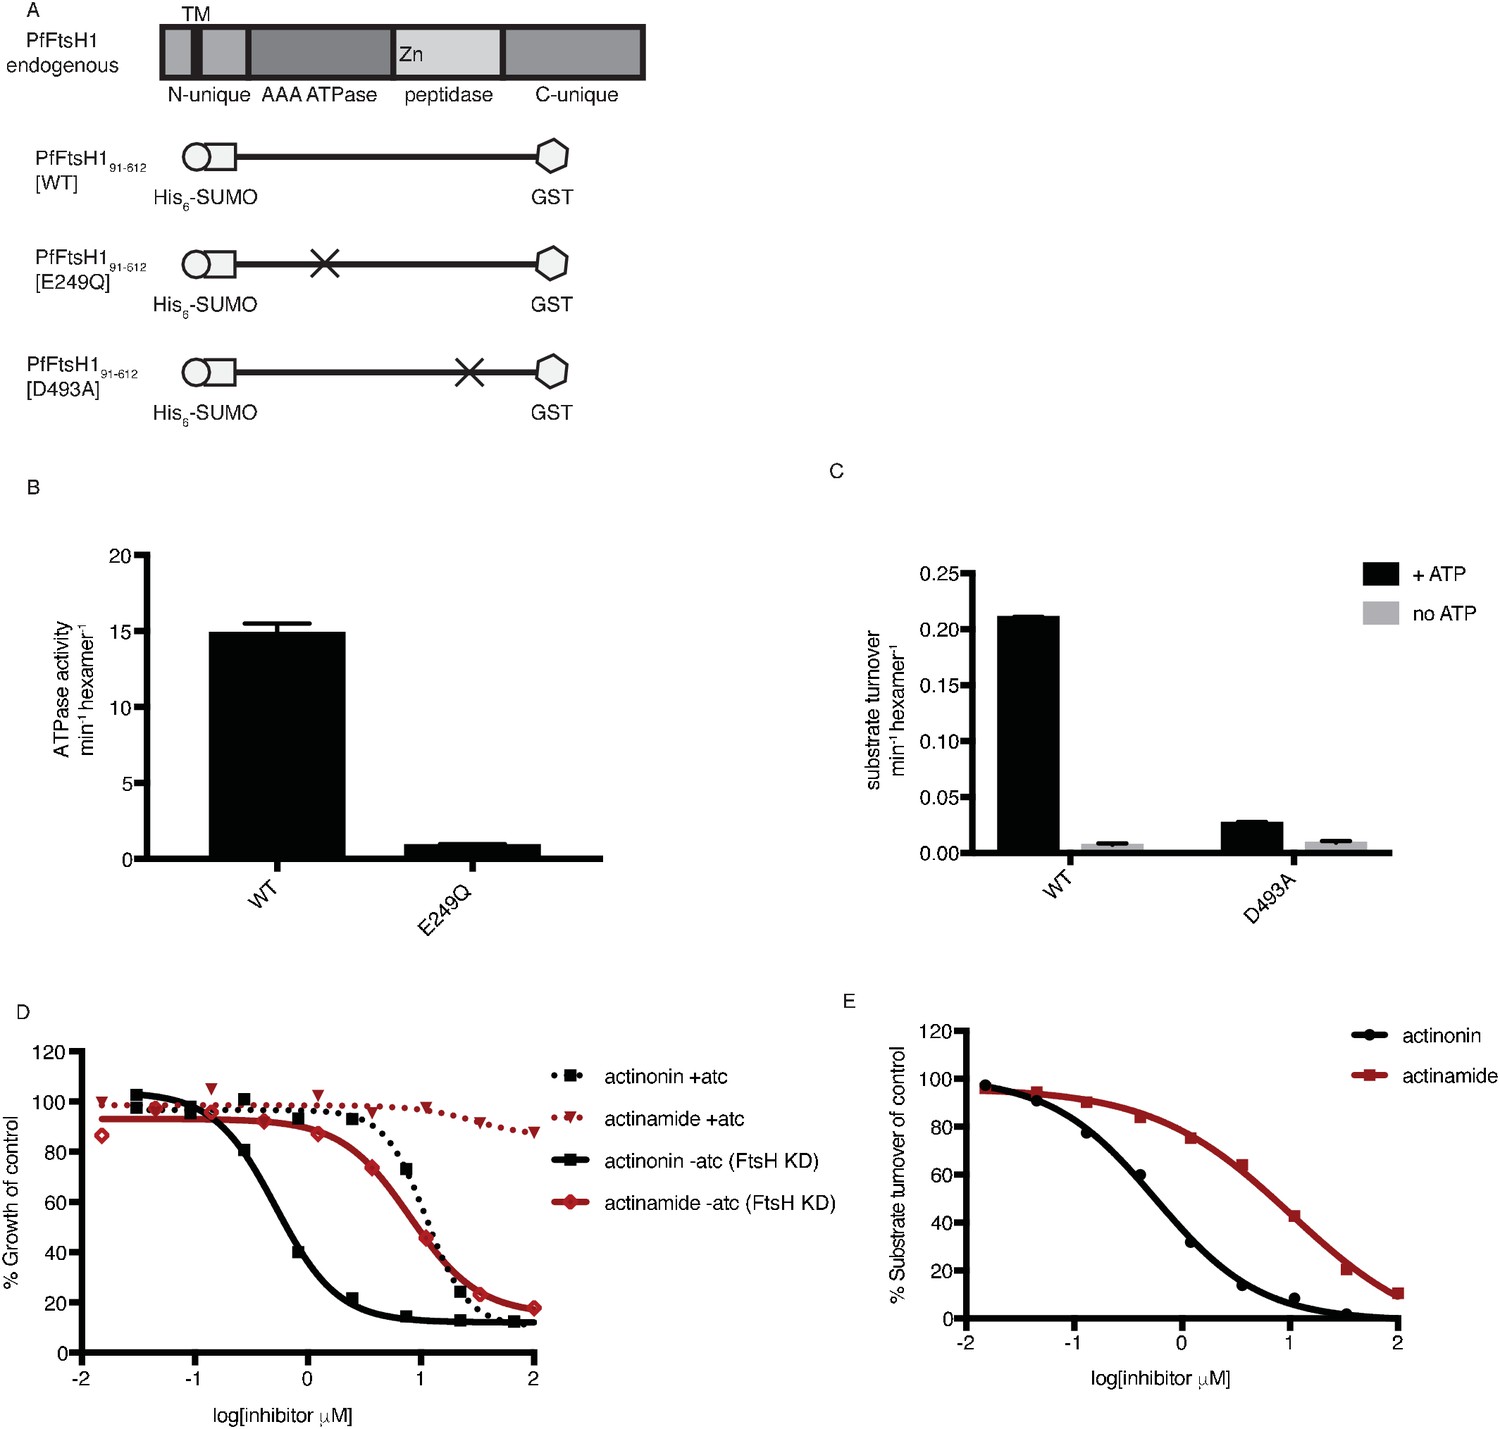
Actinonin inhibits PfFtsH1 in vitro.
(a) Schematic of PfFtsH1 constructs used for biochemical assays. Amino acids 91–612 of the endogenous protein (PfFtsH1 endogenous), which include the AAA +ATPase and peptidase domains, were placed between His6-SUMO and GST domains to aid in purification and solubility. WT is the parent construct, E249Q is an inactivating mutation in the AAA +ATPase domain, and D493A is an inactivating mutation in the peptidase domain. (b) ATP hydrolysis by PfFtsH1 WT and E249Q measured using a coupled spectrophotometric assay (NorbyNørby, 1988). (c) ATP-dependent proteolysis of FITC-labeled casein by PfFtsH1 WT and D493A. (d) Dose-dependent parasite growth inhibition by actinonin (black) or actinamide (red) with and without knockdown of PfFtsH1. Error bars represent the SEM of two biological replicates. (e) Dose-dependent proteolytic inhibition of FITC-labeled casein by PfFtsH1 WT. Error bars represent the SEM of 3 replicates.
-
Figure 4—source data 1
Numerical data for Figure 4 and Figure 4—figure supplement 4 .
- https://doi.org/10.7554/eLife.29865.019
Figure 4—figure supplement 1
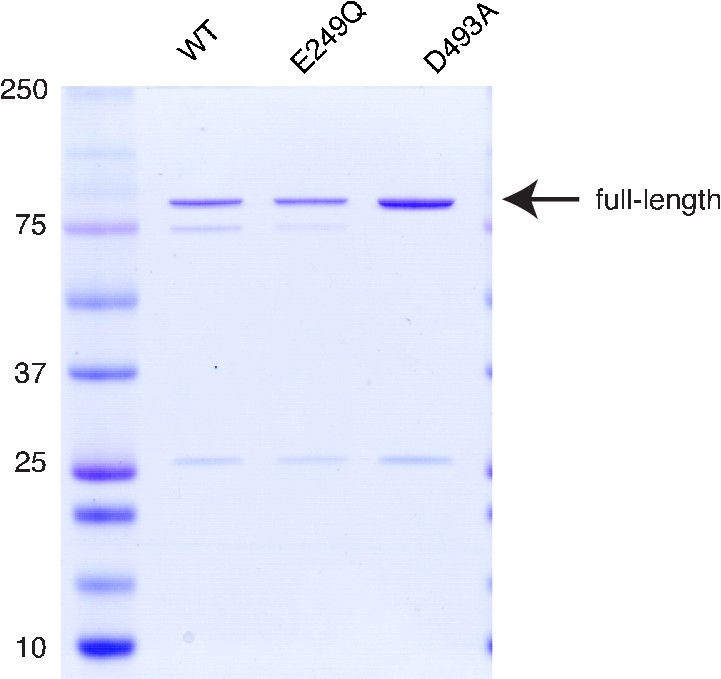
Purification of PfFtsH1.
Purified samples were separated by SDS-PAGE and stained with Coomassie. Full-length product is 97 kDa.
Additional files
-
Transparent reporting form
- https://doi.org/10.7554/eLife.29865.020
Download links
A two-part list of links to download the article, or parts of the article, in various formats.
Downloads (link to download the article as PDF)
Open citations (links to open the citations from this article in various online reference manager services)
Cite this article (links to download the citations from this article in formats compatible with various reference manager tools)
Small molecule inhibition of apicomplexan FtsH1 disrupts plastid biogenesis in human pathogens
eLife 6:e29865.
https://doi.org/10.7554/eLife.29865


