A corticostriatal deficit promotes temporal distortion of automatic action in ageing
- The University of Queensland, Australia
- University of New South Wales, Australia
- Columbia University, United States
Figures
Figure 1 with 2 supplements
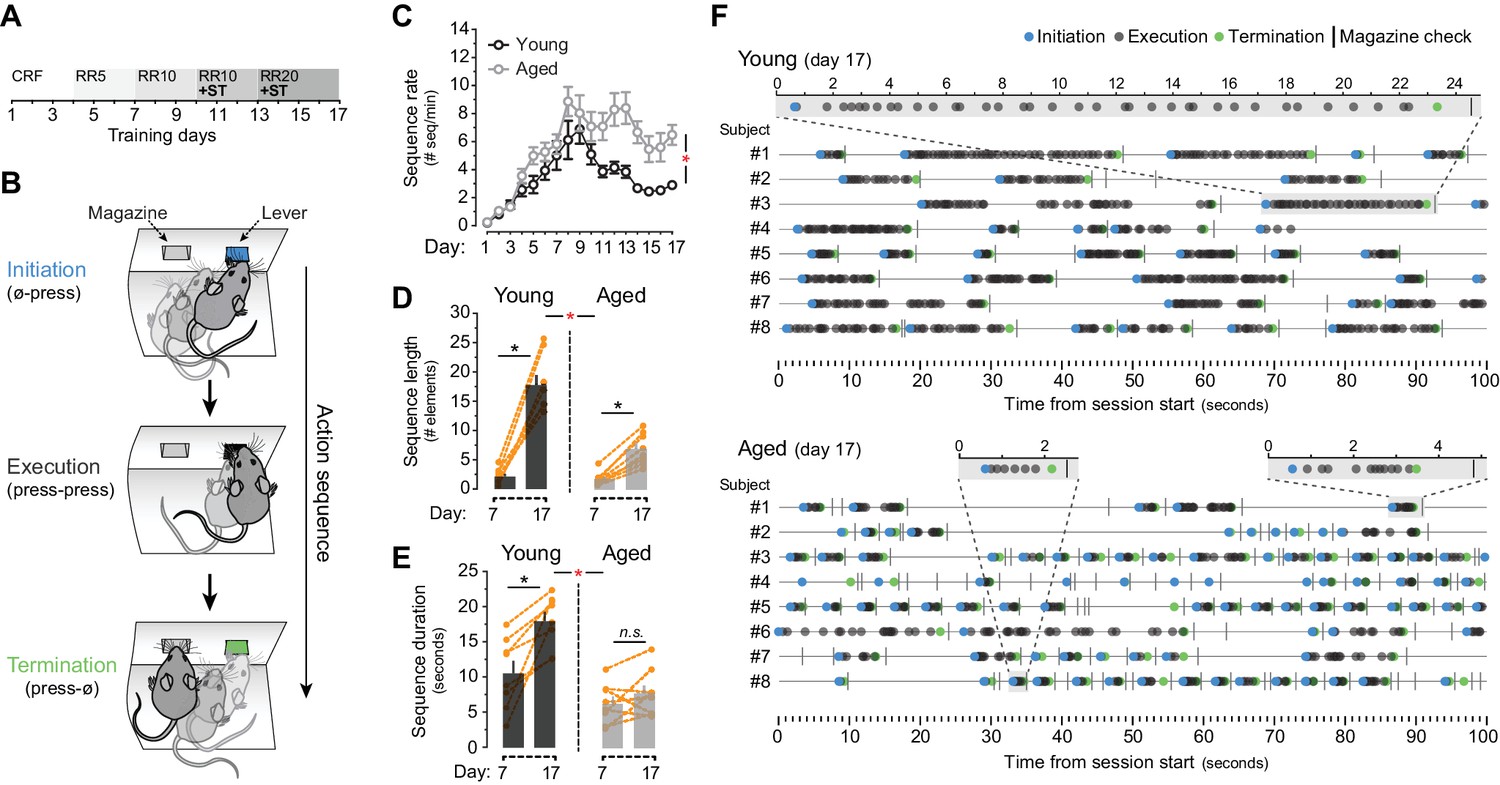
Evidence of sequence learning in aged mice.
[Figure 1—source data 1] (A) Experimental design of instrumental conditioning under an increasing random ratio (RR) schedule of reinforcement, from constant reinforcement (CRF) to RR20. Sequence triggering (ST) programs were introduced on day 10. (B) Initiation, execution and termination elements were identified in each sequence according to lever press (LP) and magazine entry interspersing. (C) Number of action sequences per minute (sequence rate) displayed throughout instrumental learning [StatsReport1]. (D, E) Average length (D) and duration (E) of LP sequences produced by each young and aged mouse on days 7 and 17 of training. Orange traces represent individual mice. Asterisks denote significant day x age interaction (red) and simple effects (black, see text). N.S., not significant [StatsReport2] [StatsReport3]. (F) Event-time diagrams showing linearly organised LP sequences produced by all young and aged mice on training day 17. Shaded segments (gray) are amplified LP sequences (seconds). See Figure 1—figure supplement 1D for pre-sequence diagrams.
-
Figure 1—source data 1
- https://doi.org/10.7554/eLife.29908.005
-
Figure 1—source data 2
Source data for Figure 1.
- https://doi.org/10.7554/eLife.29908.006
-
Figure 1—source data 3
Source data for Figure 1.
- https://doi.org/10.7554/eLife.29908.007
Figure 1—figure supplement 1
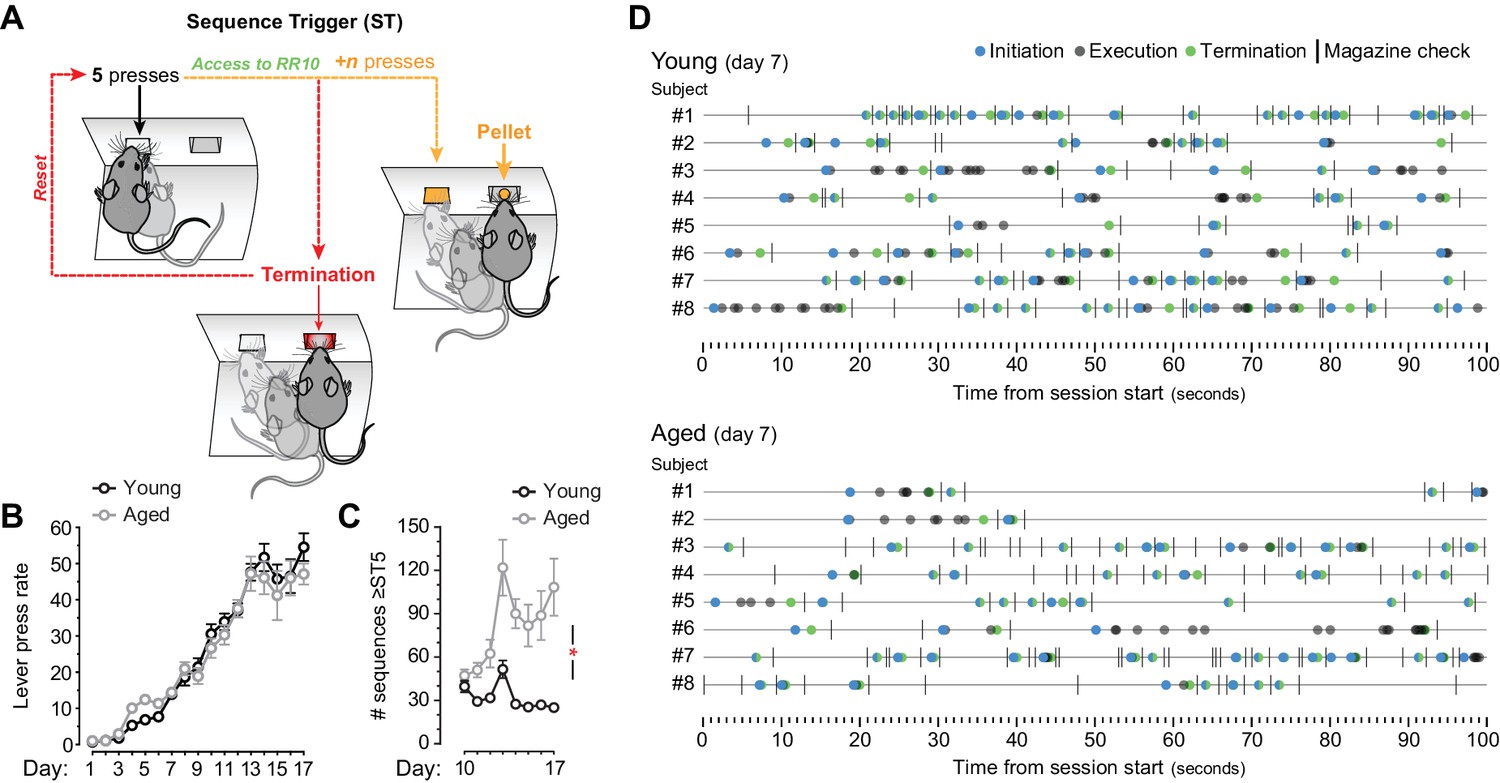
Application of a sequence trigger (ST) to promote sequence learning.
[Figure 1—source data 1] (A) ST (applied from day 10 onwards) limited the access to RR reinforcement to action sequences that were initiated with at least 5 (from day 10) or 7 (from day 13) consecutive lever presses. Sequences that were truncated with a termination element (lever press → magazine entry) before reaching the fifth or seventh consecutive press blocked access to the RR program. Unlocked sequences (≥5 initial presses) that were truncated with a termination element before earning reward (+n presses) also reset the RR trial. (B) Overall LP rate during acquisition of instrumental behaviour (presses/min) [StatsReport25]. (C) Number of sequences that went through ST5. Only days where ST was applied are plotted (days 10–17). Asterisk denotes significant training x age interaction [StatsReport26]. (D) Event-time diagrams showing linearly organised LP sequences produced by all young and aged mice on training day 7 (pre-sequence). See Figure 1F for post-sequence diagrams.
Figure 1—figure supplement 2
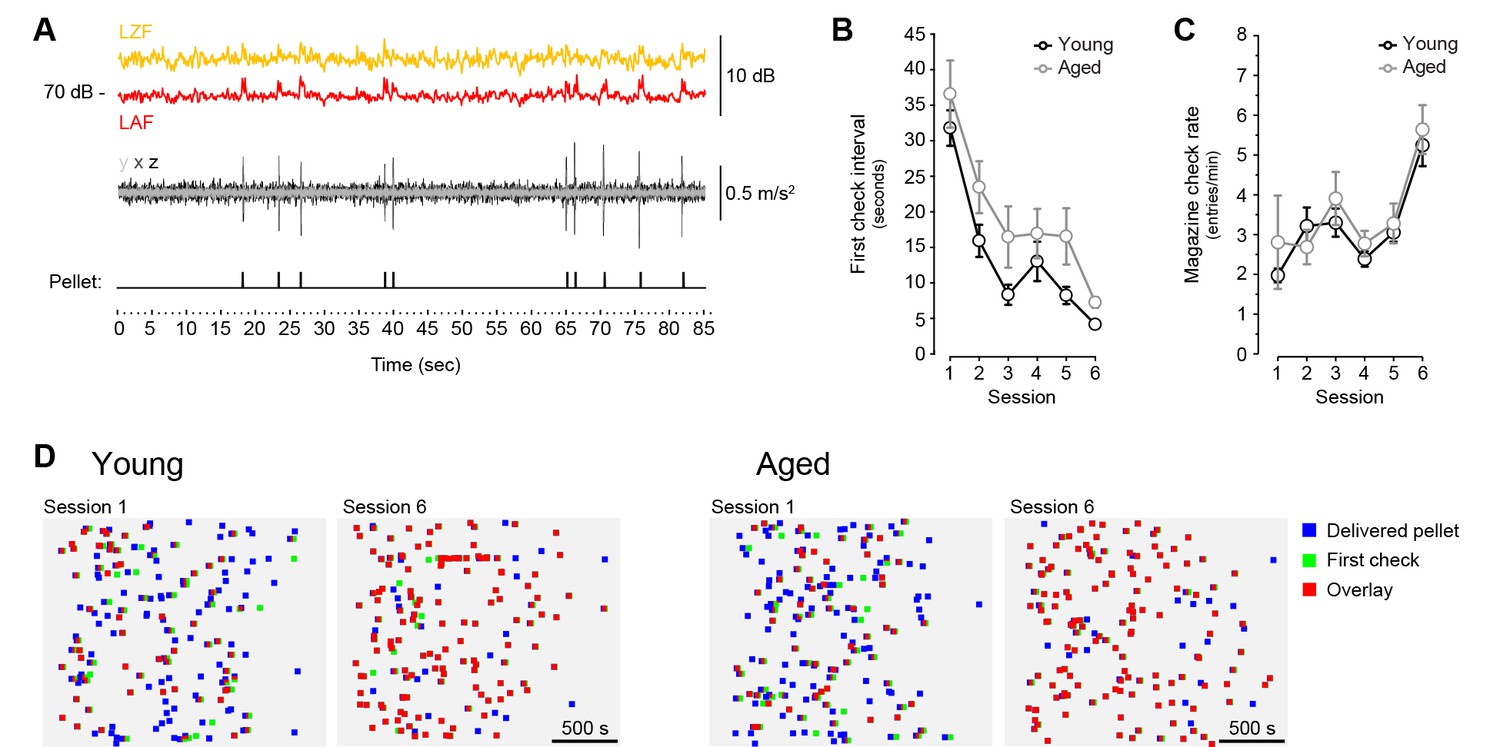
Pellet drop detection in operant conditioning chambers.
[Figure 1—source data 2] [Figure 1—source data 3] (A) Simultaneous recording of sound level (top traces), vibration (middle trace) and pellet dispenser rotor activation (bottom trace) during random delivery of 10 pellets across 1.5 min. Sound level (L) is shown at two different frequency weightings (yellow trace: Z [zero]-filter, 10 Hz to 20 kHz; red trace: A-filter, −20 Hz to 20 kHz) with fast time weighting (F: 125 ms). Vibration was based on high-pass filtered accelerometer data (99.3 Hz) on three different movement axes (x, y, z). Pellets were randomly delivered through activation of an electric rotor (1/12th of a turn) on a dispenser located outside of the chamber. (B, C) [StatsReport23] [StatsReport24] Average first-check intervals (B) and magazine check rate (C) across 6 sessions of magazine training. Twenty pellets where delivered randomly over an average 30 min period. (D) Representation of each individual pellet delivery → magazine check intervals displayed by all young and all aged mice on the first and the last day of magazine training. Emergence of red squares (overlay) denotes close pellet delivery and magazine check times. Pellet delivery → magazine check pairs are distributed randomly in the y axis.
Figure 2 with 1 supplement
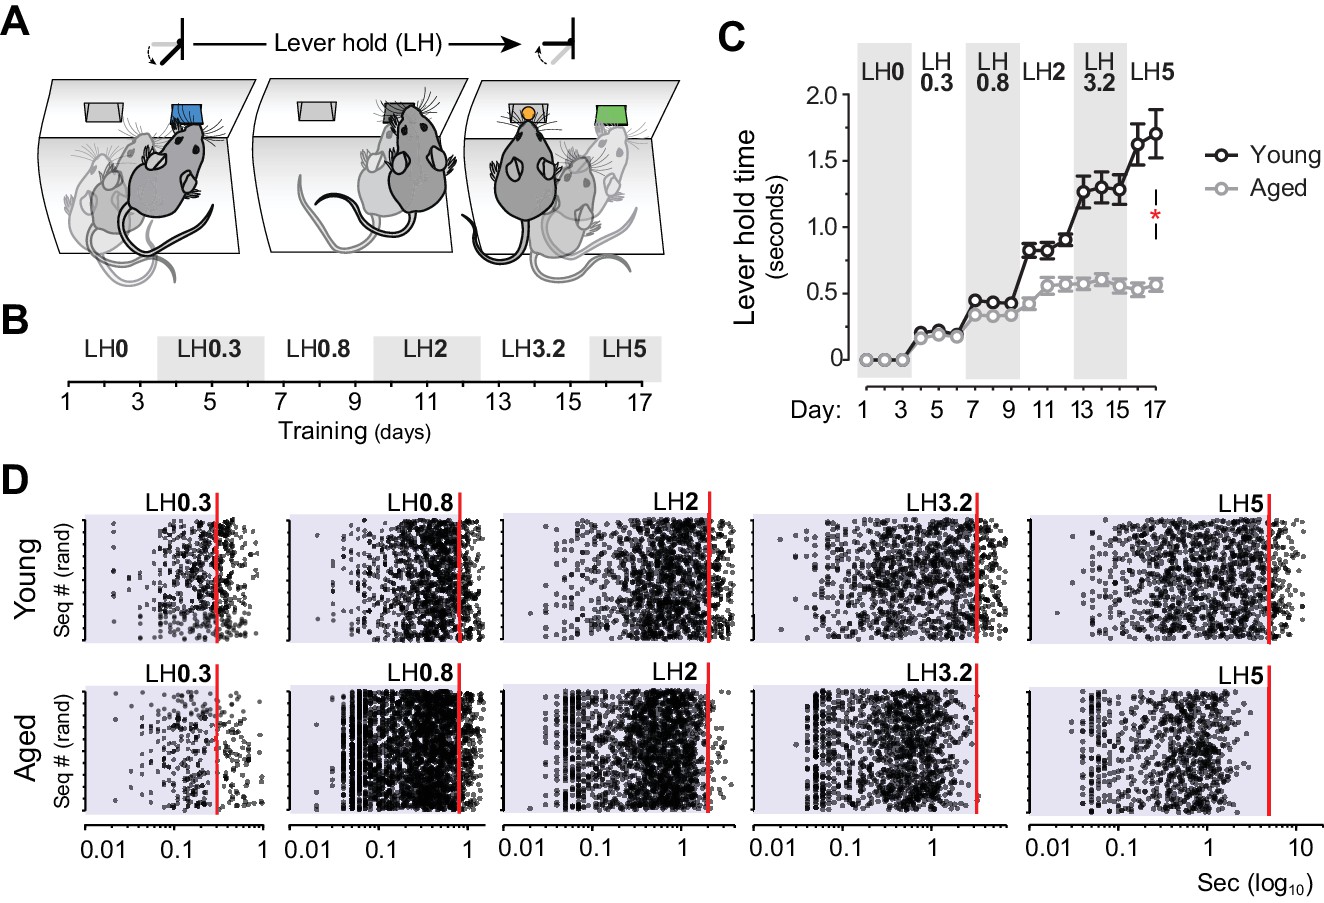
Aged mice are unable to temporally sustain their actions.
[Figure 2—source data 1] [StatsReport4] (A) Mice were trained to press and hold the lever down for increasing periods to obtain rewards. (B) Experimental design of instrumental conditioning under an increasing pseudorandom lever hold (LH) schedule of reinforcement. Average LH times are indicated in seconds. (C) Acquisition of LH instrumental behaviour across training. Data are mean ±SEM (7 and 8 mice per group). Asterisk denotes significant training x age interaction. (D) Representation of each individual LH performed by all young and all aged mice on the last day of LH0.3, LH0.8, LH2, LH3.2 and LH5 training. LH times are presented in a Log10 scale (x axis), and sequences are distributed randomly in the y axis.
-
Figure 2—source data 1
Source data for Figure 2.
- https://doi.org/10.7554/eLife.29908.010
Figure 2—figure supplement 1
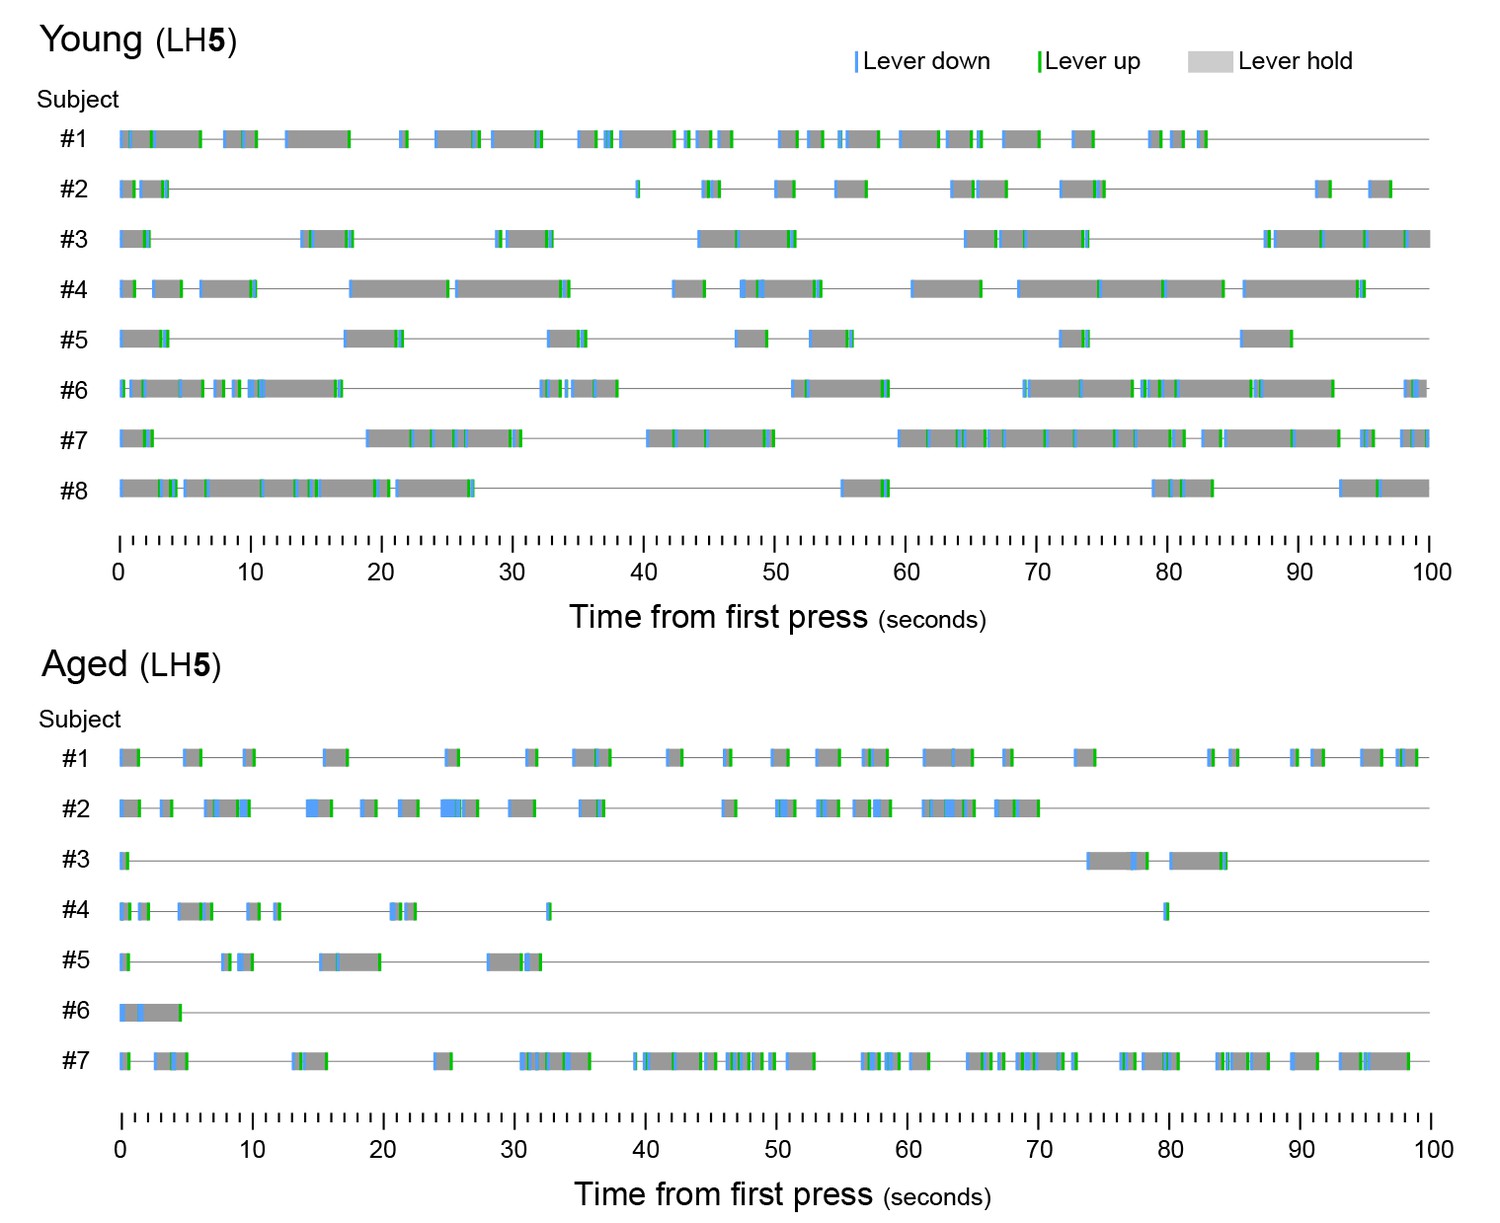
Aged mice produce shorter lever holds.
[Figure 2—source data 1] Timestamp diagrams showing linearly organised LH sequences produced by each young and aged mouse (Subjects #1 to #8 and #1 to #7) during the first 100 s of the last day of LH5 training (day 17). LH time (grey shade) is flanked by lever down (blue segment, initiation) and lever up (green segment, termination) timestamps.
Figure 3 with 2 supplements
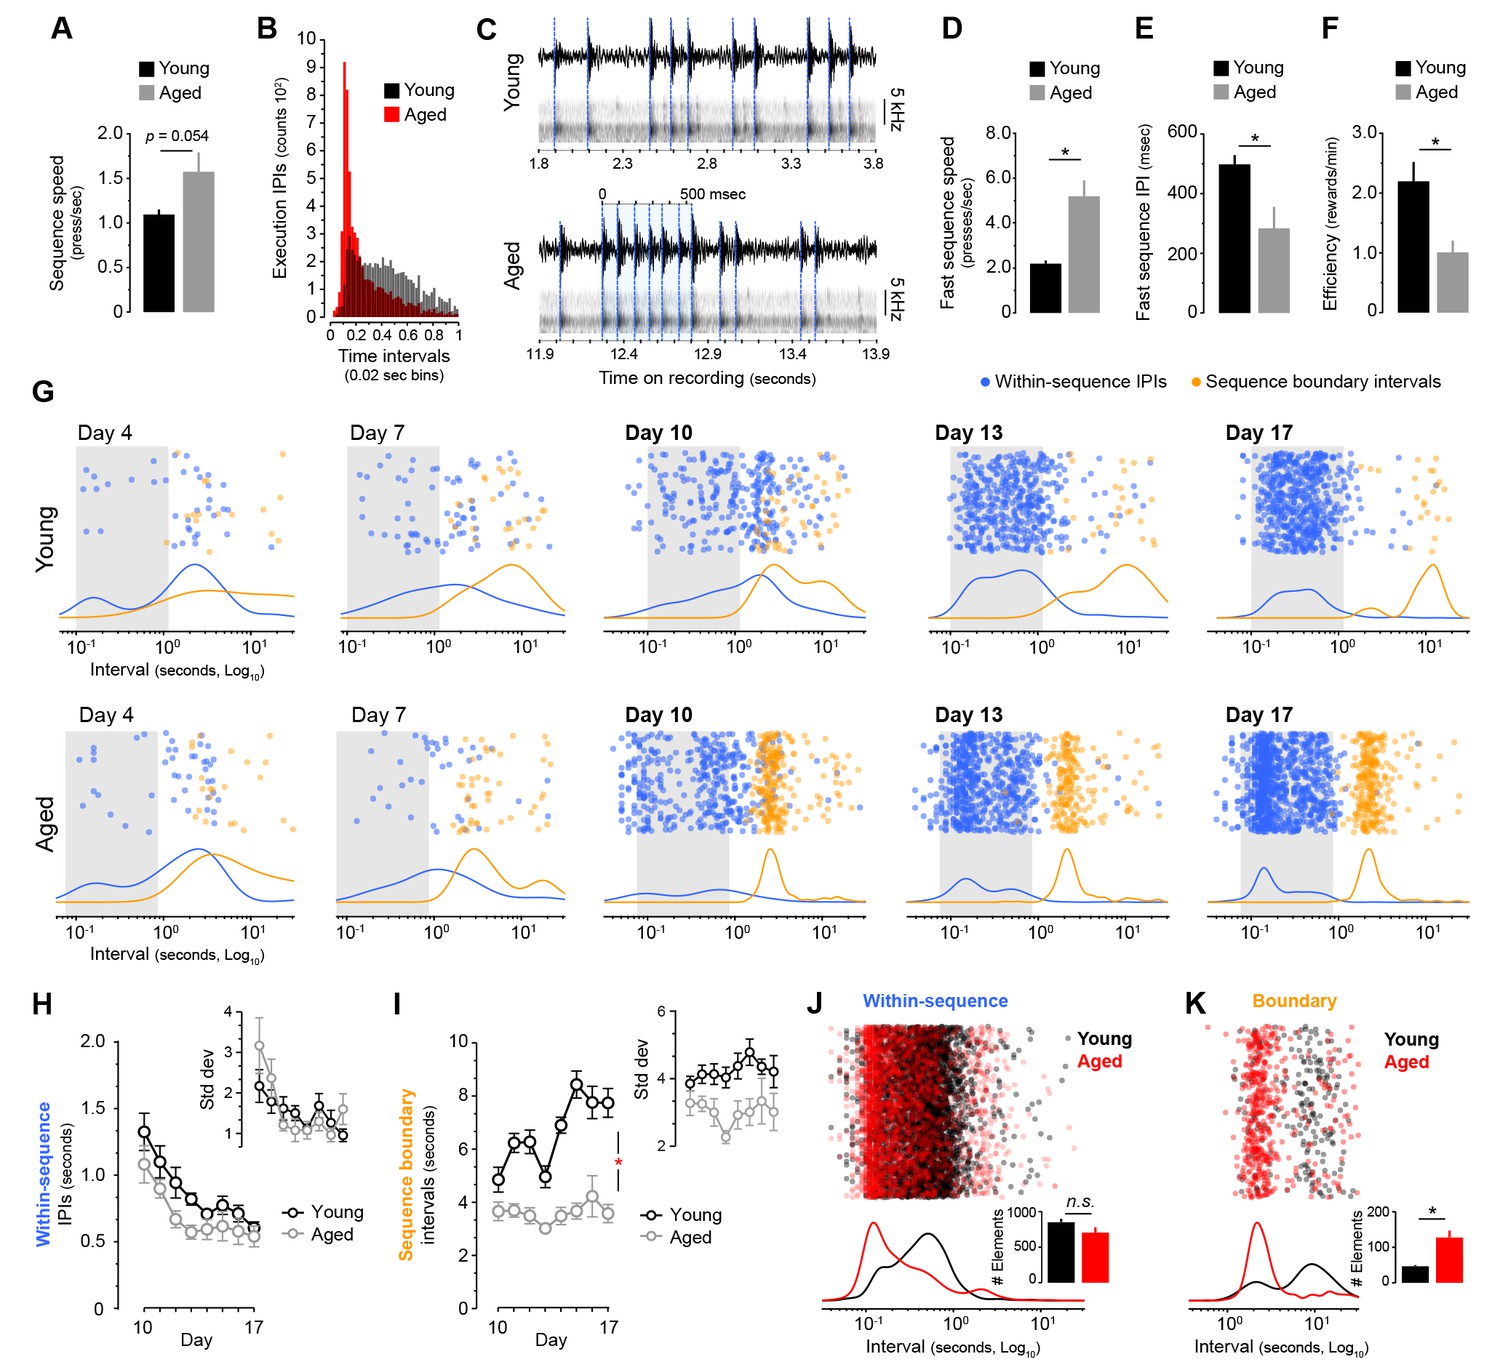
Aged mice produce ultrafast sequences and aberrant chunking.
[Figure 1—source data 1] [Figure 3—source data 3] (A) Average sequence speed calculated from timestamp data after 20 min of continuous instrumental performance on training day 18 [StatsReport33]. (B) Frequency distribution of the number of inter-press-intervals (IPIs) recorded in all young and aged mice at increasing intervals on training day 18. (C) Real IPIs from the fastest sequence recorded in a young and an aged mouse on day 18 (Fast sequence one in Video 1 and Video 2). Real lever press times were identified by aligning the sound waveform (top) and acoustic spectrogram (bottom) generated by lever press activity during the session. Identified presses are marked with a blue dashed line. (D, E) Average speed (B) and IPIs (C) of the five fastest LP sequences displayed by young and aged mice during the 20 min session on day 18 extracted from acoustic data [StatsReport5] [StatsReport6]. (F) Efficiency of LP instrumental behaviour (rewards earned per minute) in young and aged mice on day 18 [StatsReport7]. Asterisks (B–D) denote significant effects (see text). (G) Scatter plots of each within-sequence inter-press-interval (IPIs, blue) and sequence boundary interval (orange) produced by one young and one aged mouse (Young #7 and Aged #5) at different stages of training. Kernel density curves of each interval type are plotted at the bottom. Grey shades delimitate the within-sequence chunking space. (H, I) Average within-sequence IPIs (G) and sequence boundary (H) intervals. Insets are corresponding standard deviations. Data are mean ±SEM. Asterisk denotes significant training x age interaction [StatsReport27] [StatsReport28] [StatsReport31] [StatsReport32]. (J, K) Proportional scatter plots and kernel density curves showing intervals of the within-sequence (I) and sequence boundary (J) elements produced by all young and all aged mice during the first 600 s of training day 18. Insets are the total element counts for this period [StatsReport29] [StatsReport30]. Data in A, D-F, J and K are mean +SEM. p, p-value; asterisk, significant effect; N.S., not significant.
-
Figure 3—source data 1
Source data for Figure 3.
- https://doi.org/10.7554/eLife.29908.014
Figure 3—figure supplement 1
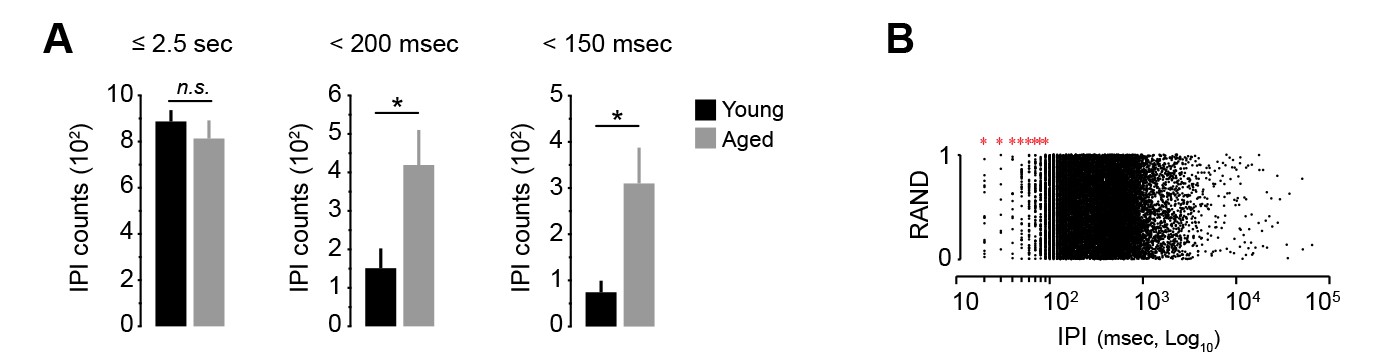
Ultra-fast IPIs in aged mice.
[Figure 1—source data 1] [StatsReport8] (A) Quantification of the number of IPIs under 2.5 s, 200 msec and 150 msec in young and aged mice on day 18. Data are mean +SEM. N.S, not significant (≤2.5 s: t(14) = 0.799, p=0.438). Asterisks denote significant difference (<200 msec: t(14) = −2.564, p<0.05;<150 msec: t(8.492) = −2.898, p<0.05). (B) Representation of all IPIs produced by all young and aged mice on training day 18 (RAND, random). Note that the 10 msec-based timestamp generated placement artefacts in IPIs under 100 msec. Intervals of 20 to 90 msec are biologically improbable (red asterisks). Real-time IPIs were therefore studied through acoustics analysis (see Figure 3C–E).
Figure 3—figure supplement 2
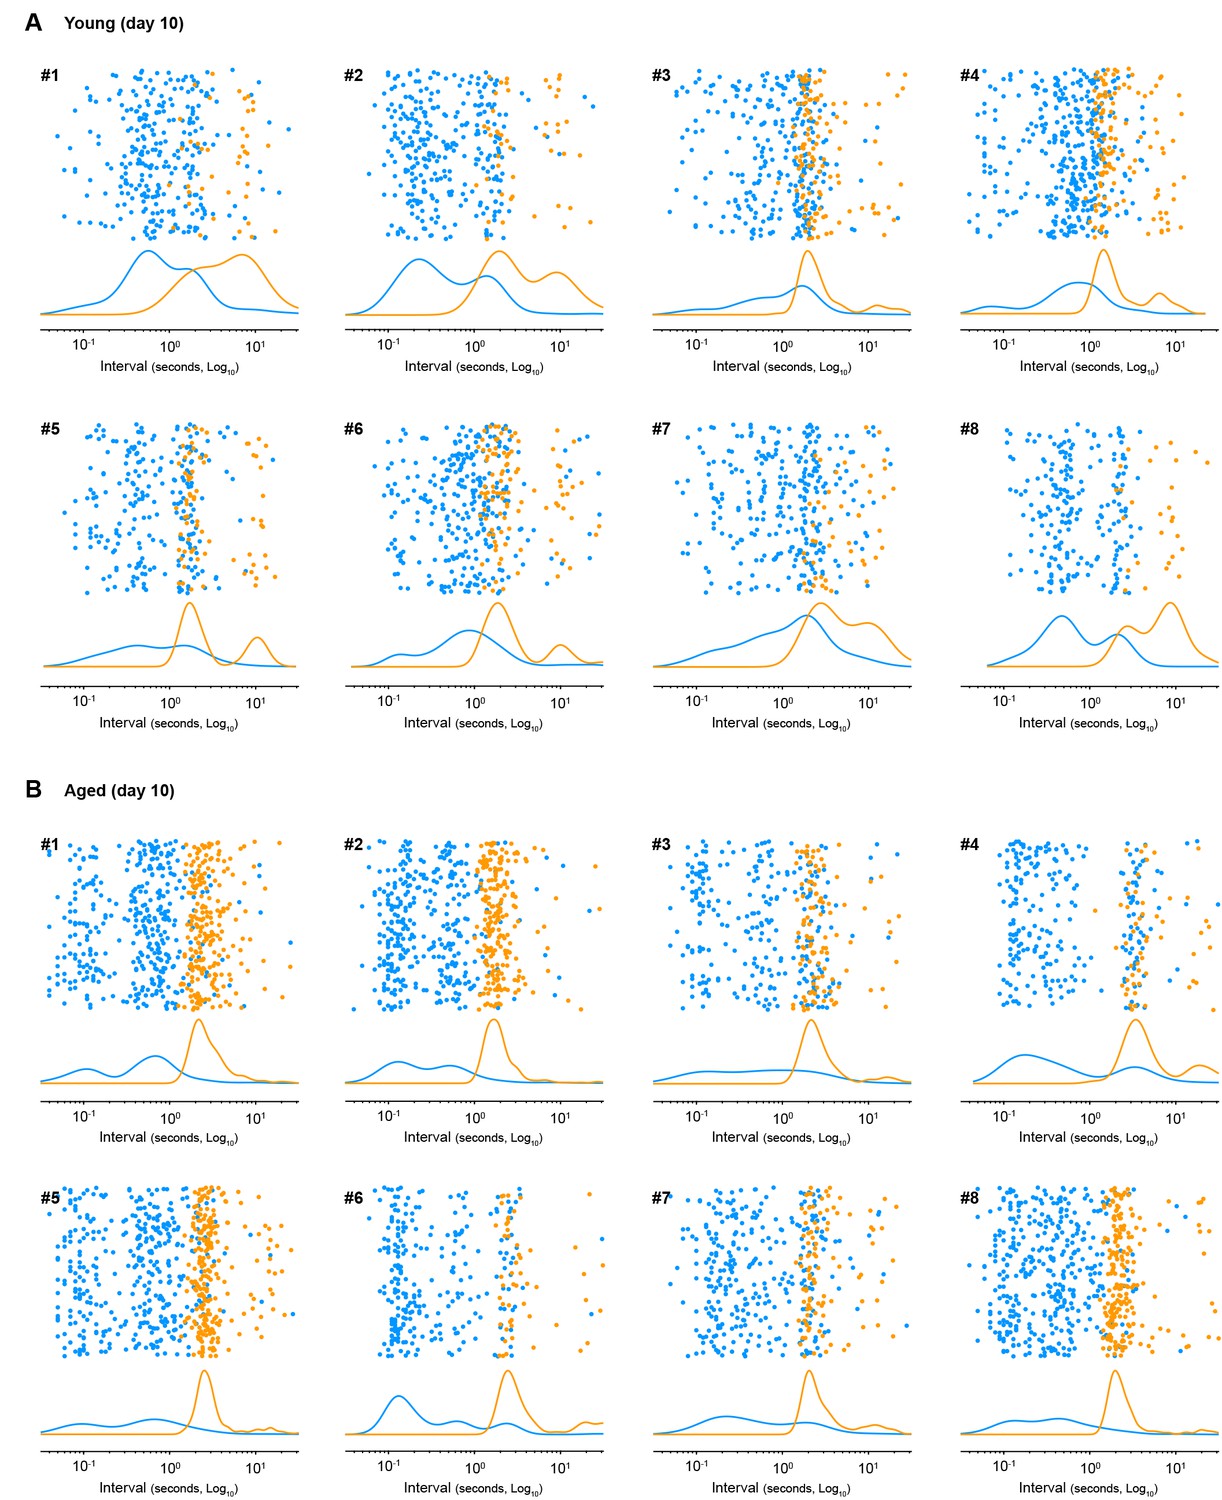
Sequence boundary intervals in aged mice are regularised early in training.
Scatter plots of within-sequence inter-press-intervals (IPIs, blue) and sequence boundary intervals (orange) produced by each young (A) and each aged (B) mouse on training day 10. Kernel density curves of each interval type are plotted at the bottom. Graphs Young#7 and Aged#5 are shown in Figure 3G.
Figure 4
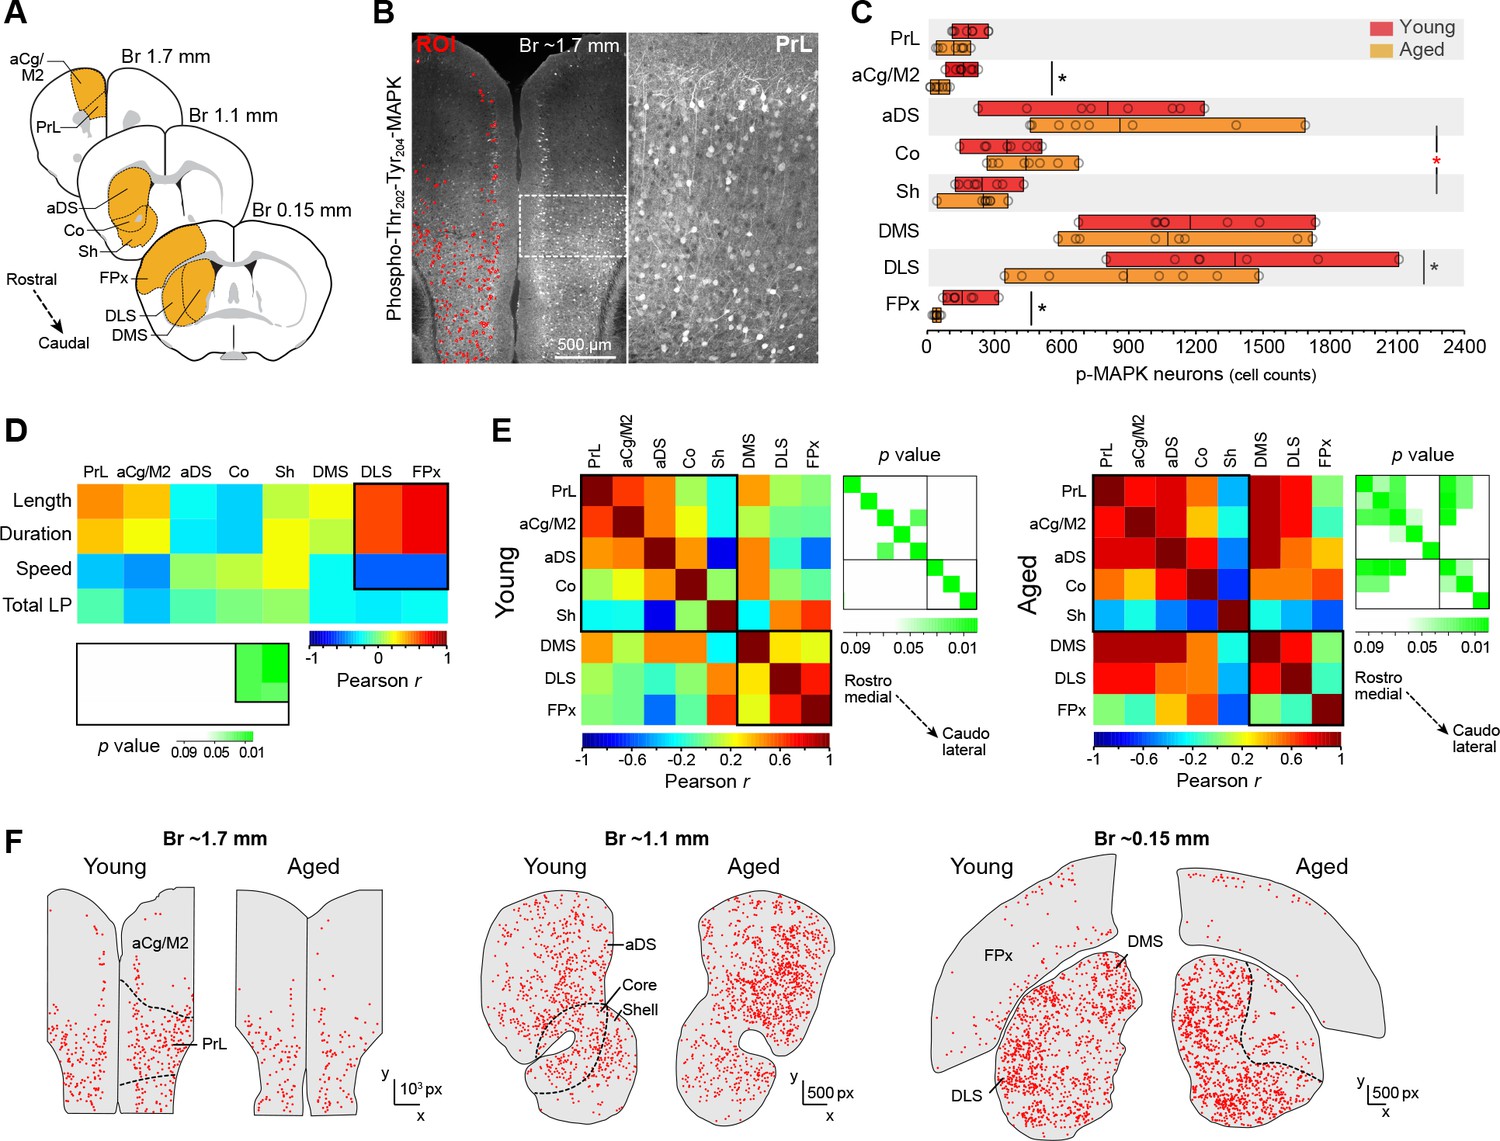
Action sequence features correlate with defective activation of caudolateral corticostriatal networks in aged mice.
[Figure 4—source data 1] (A) Extensive analysis of neuronal activation in different rostrocaudal cortical (prelimbic [PrL], anterior cingulate/motor area 2 [aCg/M2], frontoparietal [FPx]) and striatal (anterodorsal [aDS], core, shell, dorsomedial [DMS], dorsolateral [DLS]) areas after 20 min of uninterrupted instrumental performance (day 18). (B) Position and intensity of each activated neuron (p-Thr202-Tyr204-MAPK-immunoreactive [p-MAPK]) were detected through semi-automated quantitative fluorescence (~60,000 neurons analysed). (C) Horizontal floating bar chart displaying the quantification of p-MAPK counts in different cortical and striatal areas of young and aged mice. Minimum, maximum and mean of the data are represented (vertical lines). Circles indicate individual counts for each animal (eight mice per group). Asterisks denote significant age x region interaction (red) and simple effects (black, see text) [StatsReport9]. (D) Activity – performance correlation study comparing the counts of p-MAPK detected in the different cortical and striatal areas (arranged from rostro-medial to caudolateral) and the action sequence features (length, duration and speed) as well as overall instrumental performance (total number of lever presses) displayed by each young and aged mouse during the last day of training. The corresponding p value matrix (bottom inset) indicates the significance of each correlation. Pearson r (multicolor scale) and p (green scale) value diagrams are shown for each correlation [StatsReport10]. (E) Cross-correlation analysis of the p-MAPK activity recorded in the different areas (arranged from rostromedial to caudolateral) in all young (left) and aged (right) mice. Multi-colored diagrams show the extent of correlation between each pair of regions (Pearson r values), and green diagrams (right) indicate their significance at each position (p values) [StatsReport11]. Correlations in D and E involve within-subjects measures. (F) Digitised reconstructions of the distribution of activated neurons in corticostriatal regions at rostral (left), medial (middle) and caudal (right) levels in one young and one aged mouse. Each dot represents the position of one neuron expressing p-MAPK.
-
Figure 4—source data 1
Source data for Figure 4.
- https://doi.org/10.7554/eLife.29908.018
Figure 5 with 2 supplements
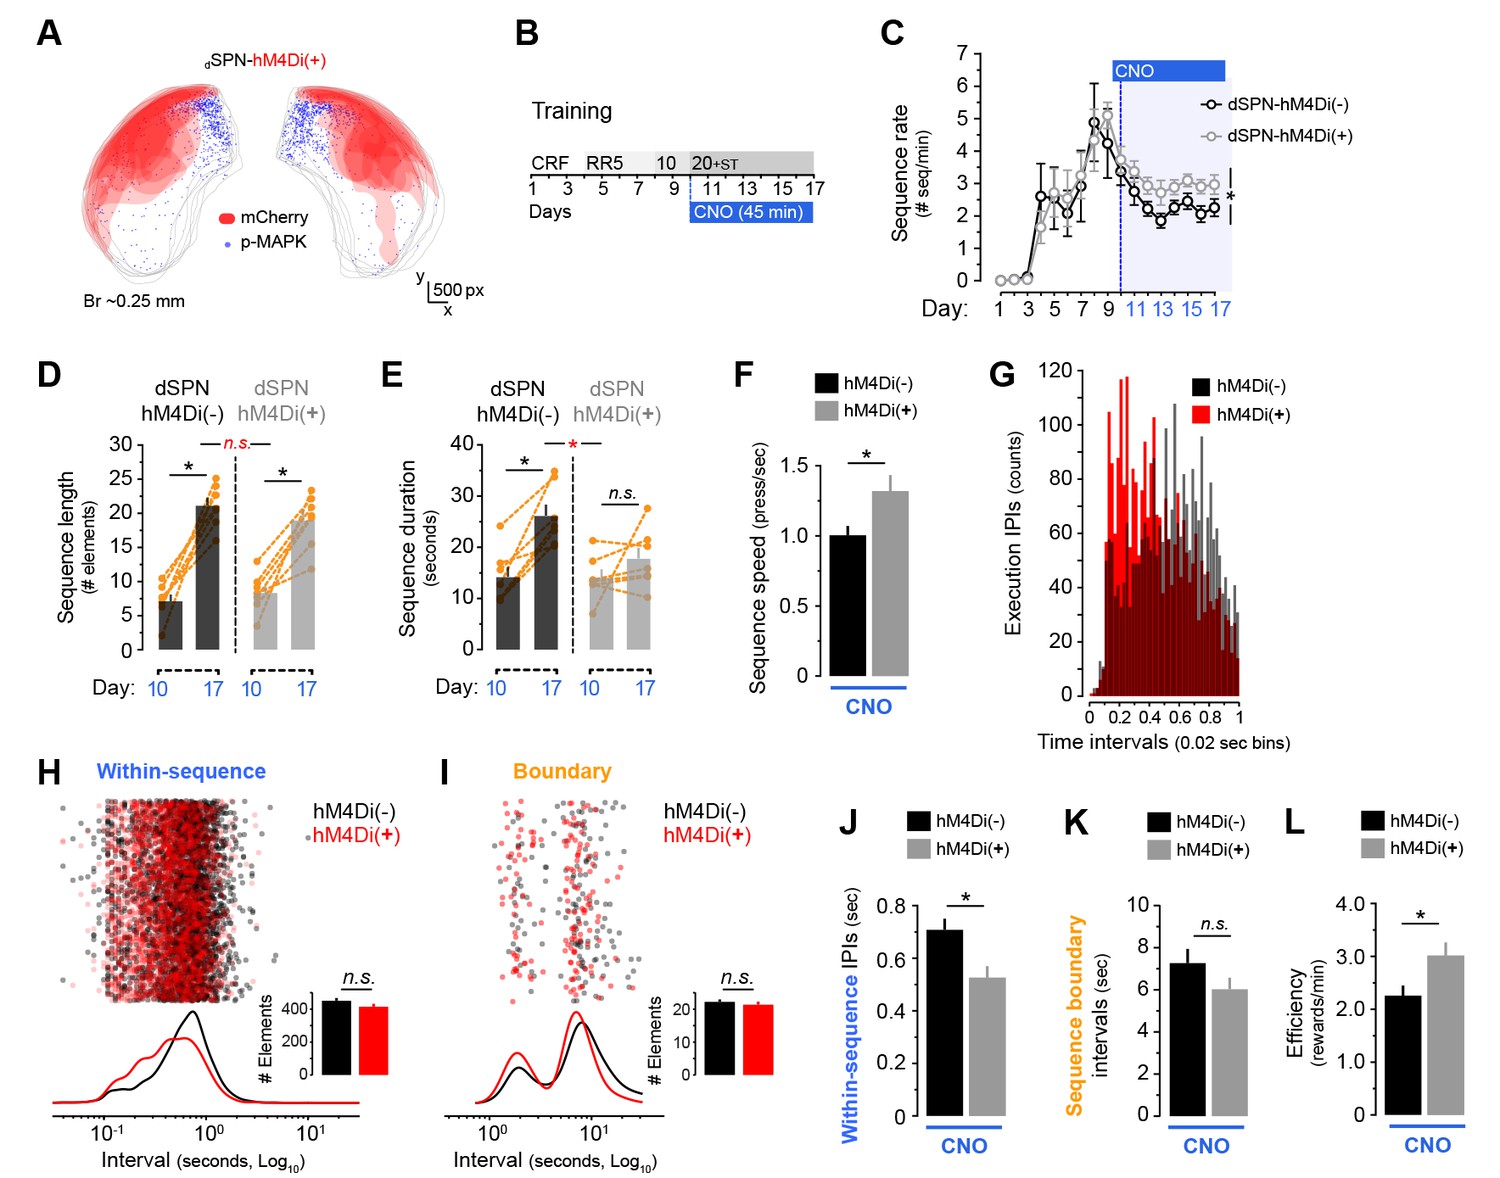
Chemogenetic inhibition of dorsolateral direct pathway neurons increases within-sequence speed.
[Figure 5—source data 1] A cohort of 7 Drd1a-Cre(−):Drd2-eGFP and 7 Drd1a-Cre(+):Drd2-eGFP young mice (dSPN-hM4Di(−) and dSPN-hM4Di(+)) were bilaterally injected with AAV2-hSyn-DIO-hM4Di-mCherry in the DLS. (A) Diagram shows the overlapping spread of viral infection in all dSPN-hM4Di(+) mice throughout the DLS as visualised by mCherry-expressing territories. Blue dots represent mapped p-MAPK-positive neurons in the same sections. (B) Upon recovery, all mice were submitted to LP sequence training with daily CNO injections from day 10 (3 mg/kg, 45 min before each session). (C) Number of action sequences per minute (sequence rate) displayed throughout instrumental learning. Data are mean ±SEM. Asterisk denotes significant between subjects effect across CNO period (see text) [StatsReport37]. (D, E) Average length (D) and duration (E) of LP sequences produced by each mouse on days 10 and 17 of training. Orange traces represent individual mice. Asterisks denote significant day x group interaction (red) and simple effects (black, see text) [StatsReport13] [StatsReport14]. (F) Average speed of the LP sequences displayed by dSPN-hM4Di(−) and dSPN-hM4Di(+) on day 18 (timestamp data) [StatsReport15]. (G) Frequency distribution of the number of inter-press-intervals (IPIs) recorded in all dSPN-hM4Di(−) and dSPN-hM4Di(+) mice at increasing intervals on training day 18. (H, I) Scatter plots and kernel density curves showing intervals of the within-sequence (H) and sequence boundary (I) elements produced by all dSPN-hM4Di(−) and dSPN-hM4Di(+) on training day 18. Insets are the total element counts for this period [StatsReport35]. (I, J) Average within-sequence IPIs (I) and sequence boundary (J) intervals on day 18. Data are mean +SEM [StatsReport16] [StatsReport36]. (K) Efficiency of LP instrumental behaviour (rewards earned per minute) in by dSPN-hM4Di(−) and dSPN-hM4Di(+) mice on day 18 [StatsReport17]. Asterisks denote significant effects (see text). N.S., not significant.
-
Figure 5—source data 1
Source data for Figure 5.
- https://doi.org/10.7554/eLife.29908.022
-
Figure 5—source data 2
Source data for Figure 5.
- https://doi.org/10.7554/eLife.29908.023
Figure 5—figure supplement 1
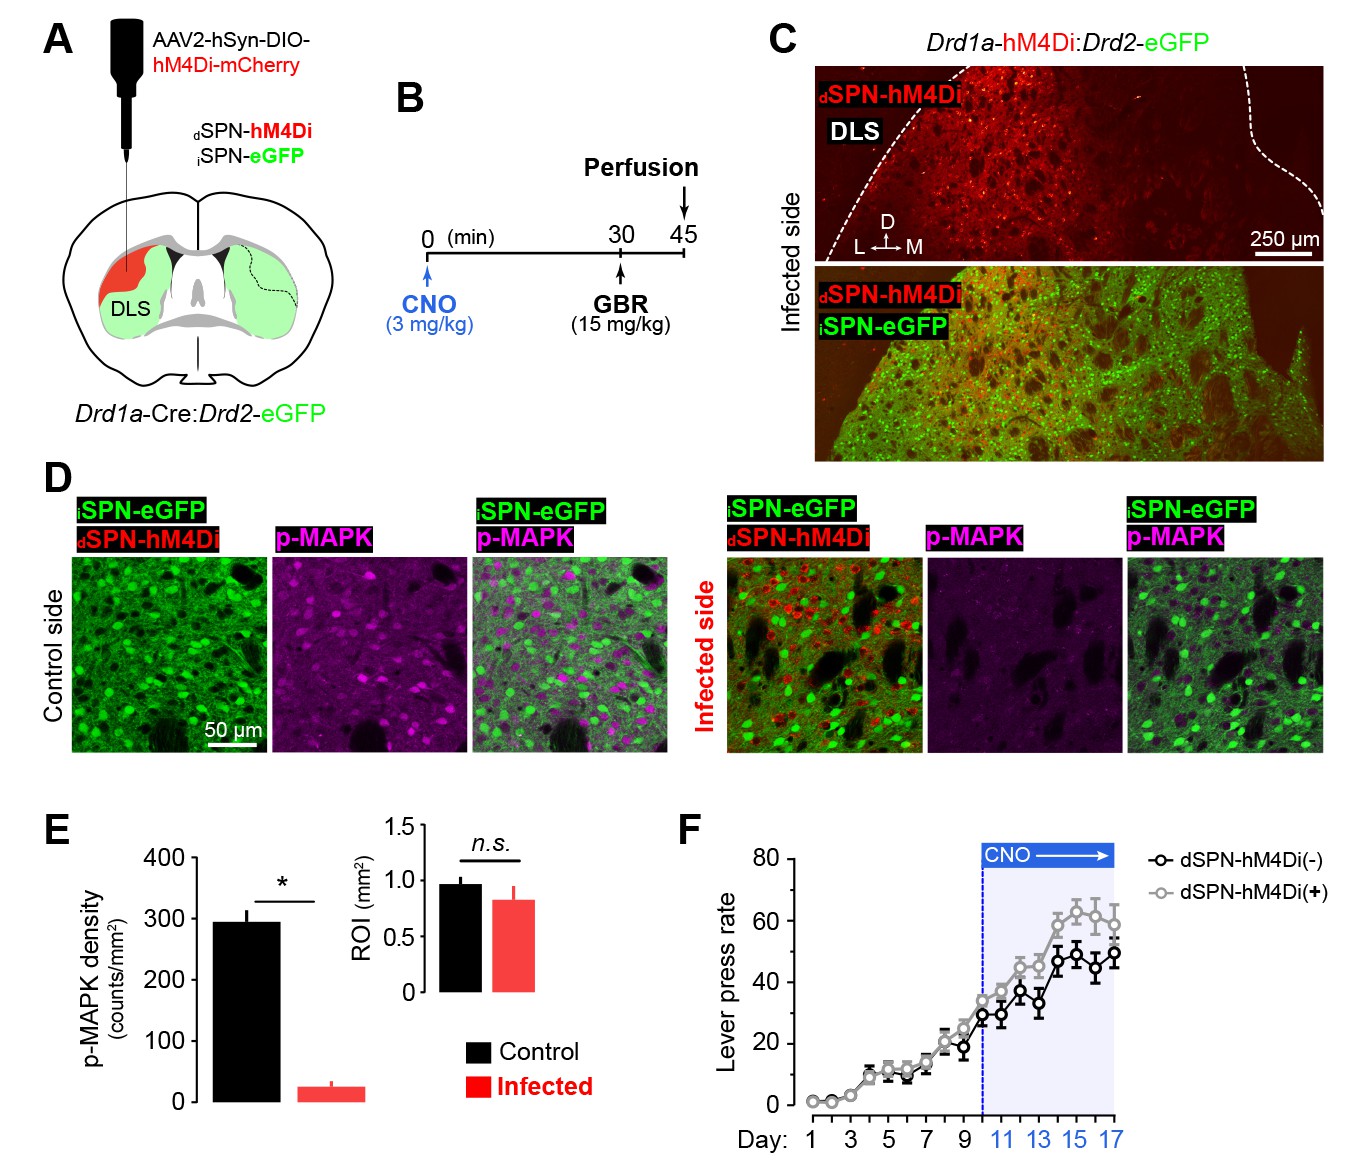
Specific inhibition of dSPN activity in the DLS through chemogenetics.
[Figure 5—source data 2] [Figure 5—source data 1] (A) Young Drd1a-Cre:Drd2-eGFP double transgenic mice were unilaterally microinjected with AAV2-hSyn-DIO-hM4Di-mCherry (1 ul/injection) in a vast extension of the dorsolateral striatum. (C) Upon recovery, the mice were administered with CNO (3 mg/kg, i.p., t = 0), challenged with GBR (15 mg/kg, i.p., t = 30) and perfused at t = 45 min. (B) Confocal micrographs showing the extent of viral infection in the DLS three weeks after surgery. (D) High magnification confocal micrographs showing the specificity of dSPN infection and the efficiency of the chemogenetic inhibition through simultaneous detection of eGFP (iSPNs), the viral infection reporter mCherry (dSPNs) and the neuronal activity marker (p-MAPK) in infected vs. control (noninfected) hemispheres of the same mouse. (E) Quantification of p-MAPK density in infected (ipsilateral to injection) and control (contralateral to injection) areas of the DLS. Inset shows the mean areas of the regions of interest quantified. Data are mean +SEM. Asterisk denotes significant paired effect. N.S., not significant [StatsReport34]. (F) Overall performance (LP rate) of bilaterally injected dSPN-hM4Di(−) and dSPN-hM4Di(+) mice before and after CNO treatment. Data are mean ±SEM [StatsReport12].
Figure 5—figure supplement 2
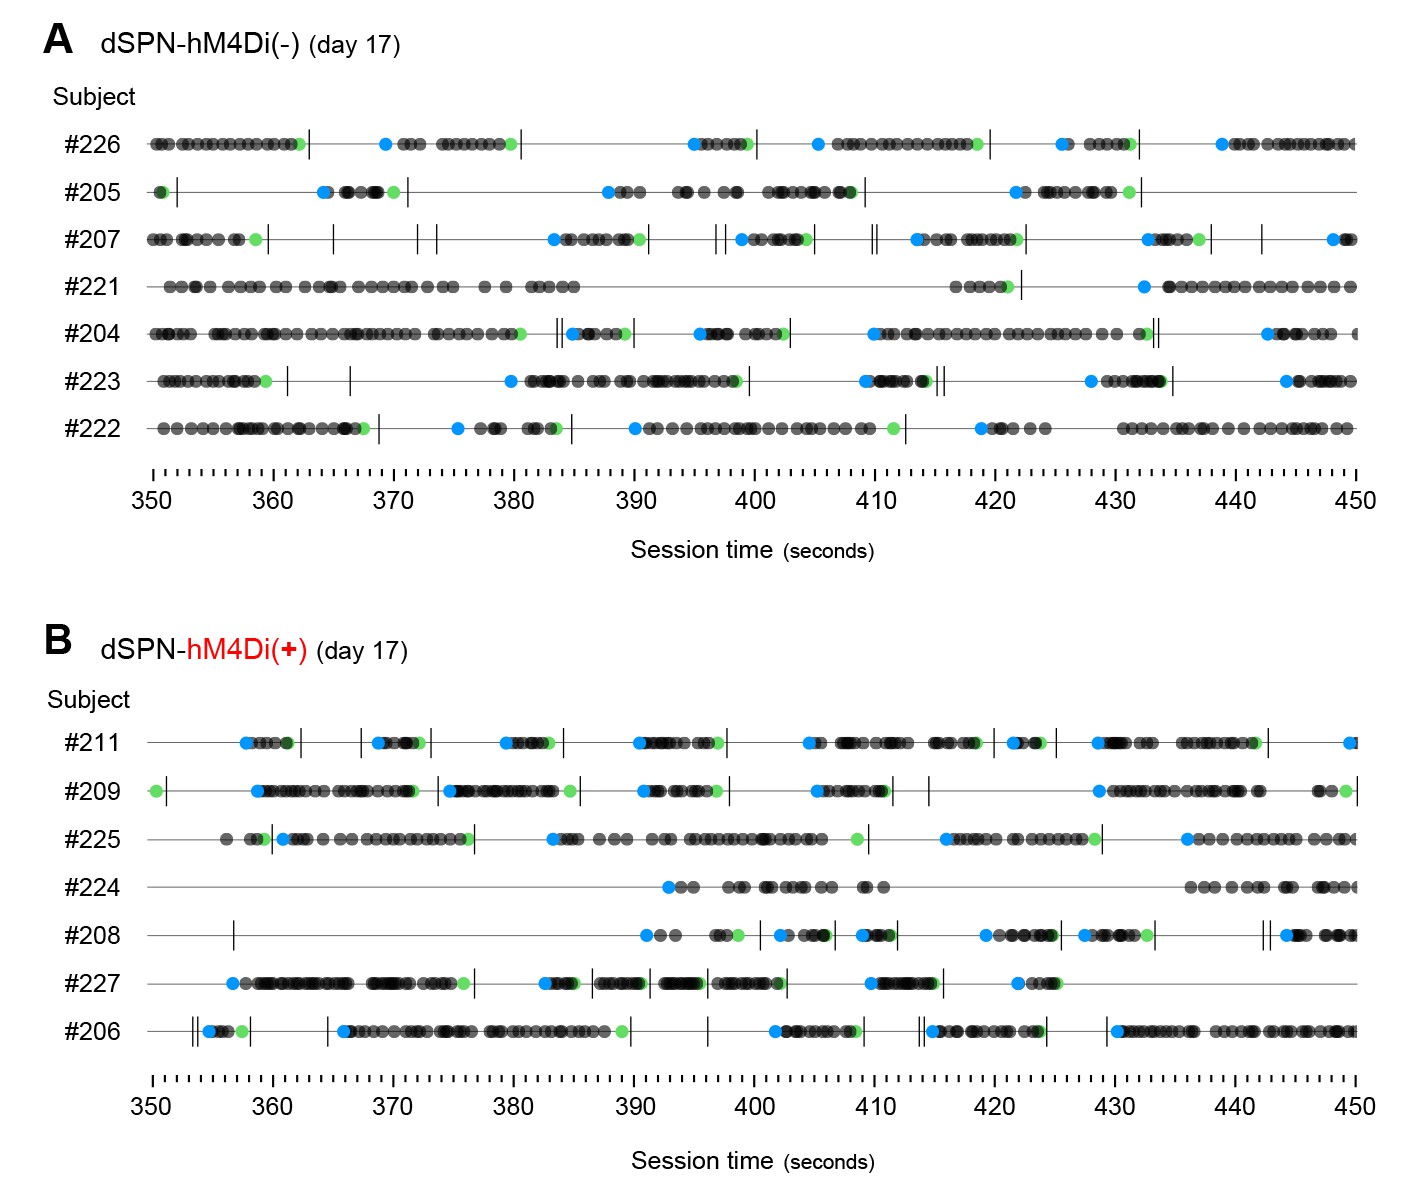
Development of action sequences in dSPN-hM4Di(-) and dSPN-hM4Di(+) mice.
[Figure 5—source data 1] (A, B) Event-time diagrams showing linearly organised LP sequences produced by all dSPN-hM4Di(-) and all dSPN-hM4Di(+) littermates on training day 17. A period of 150 s in which all animals performed action sequences was chosen.
Figure 6 with 1 supplement
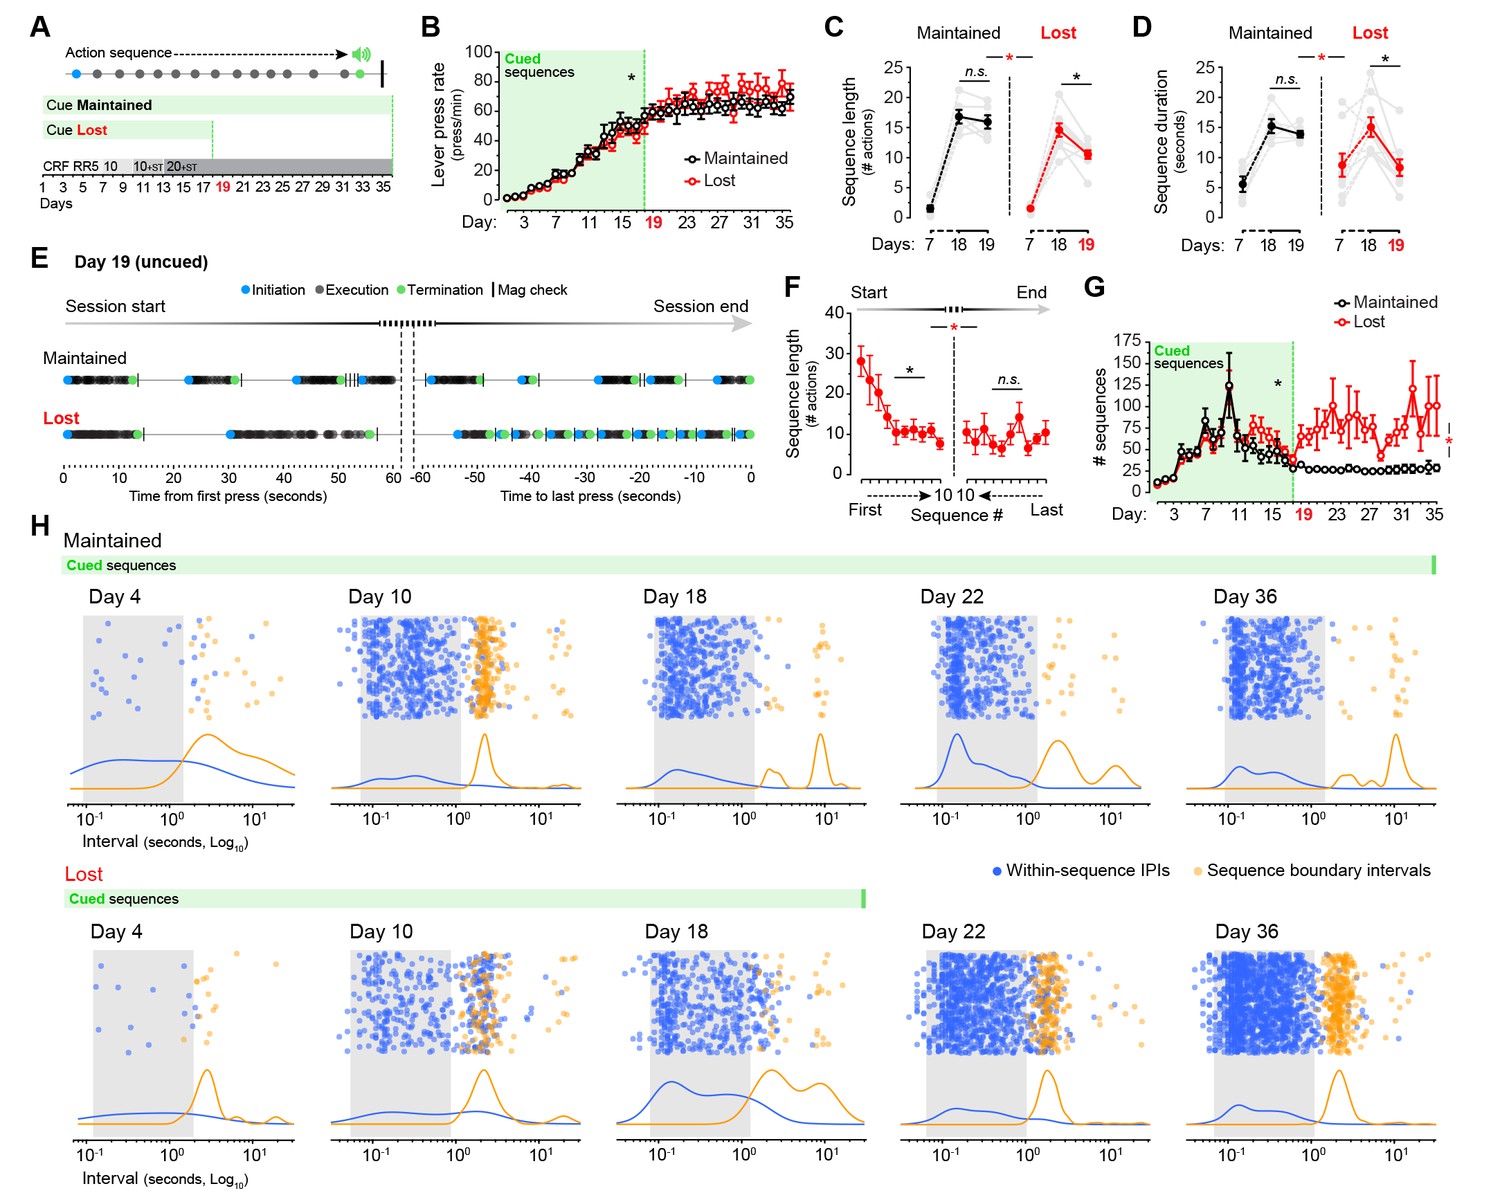
Cues signalling sequence termination temporarily normalise action structure in aged mice.
[Figure 6—source data 1] (A) Aged mice were submitted to extended LP sequence training where the termination element in each sequence was cued with a 0.75 s white noise. One group maintained the termination cue until training day 36 (Cue Maintained), whereas in the other group (Cue Lost) the cue was removed from day 19. (B) Resulting acquisition of LP instrumental behaviour. Data are mean ±SEM (6–8 mice per group). Asterisk denotes significant overall effect of training (see text) [StatsReport18]. (C, D) Average length (C) and duration (D) of the LP sequences produced by both groups on days 7, 18 and 19 of training. Asterisks denote significant day x group interaction (red) and simple effects (black, see text). N.S., not significant [StatsReport19] [StatsReport20]. (E) Structure of LP sequences produced by a ‘Cue Maintained’ and a ‘Cue Lost’ mouse at the start and at the end of the session on training day 19. See also Figure 6—figure supplement 1. (F) Average length of the 10 first sequences and the 10 last sequences produced by ‘Cue Lost’ mice on training day 19. Asterisks denote significant sequence x start/end period interaction (red) and simple effects (black, see text). N.S., not significant [StatsReport21]. (G) Total number of action sequences produced in each day of training before and after the loss of the termination cue. Asterisks denote significant overall effect of training (black) and training x group interaction (red, see text) [StatsReport22]. (H) Scatter plots of each within-sequence inter-press-interval (IPIs, blue) and sequence boundary interval (orange) produced by one ‘Cue Maintained’ (subject #R8_M) and one ‘Cue Lost’ (subject #B4_L) mouse across different days of training. Kernel density curves of each interval type are plotted at the bottom. Grey shades delimitate the within-sequence chunking space.
-
Figure 6—source data 1
Source data for Figure 6.
- https://doi.org/10.7554/eLife.29908.026
Figure 6—figure supplement 1

Aged mice lose action structure as soon as feedback cues are removed.
[Figure 6—source data 1] Aged mice underwent LP sequence training with cued termination elements (see Figure 6A). (A, B) Structure of LP sequences produced by all ‘Cue Maintained’ (A) and all ‘Cue Lost’ (B) mice at the session start and at the session end of training day 19. Subjects ‘Cue Maintained’ #3 and ‘Cue Lost’ #8 are shown in Figure 6H.
Videos
Video 1
Representative performance of a young mouse during the last day of sequence training.
Two fast action sequences are captured (indicated in red font, top left corner). Fast action sequence one is represented in Figure 3A. Subject Young#5; active lever: right; training day 18.
Video 2
Representative performance of an aged mouse during the last day of sequence training.
Two fast action sequences are captured (indicated in red font, top right corner). Fast action sequence one is represented in Figure 3A. Subject Aged#4; active lever: left; training day 18.
Additional files
-
Supplementary file 1
Stats reports.
- https://doi.org/10.7554/eLife.29908.027
-
Transparent reporting form
- https://doi.org/10.7554/eLife.29908.028
Download links
A two-part list of links to download the article, or parts of the article, in various formats.
Downloads (link to download the article as PDF)
Open citations (links to open the citations from this article in various online reference manager services)
Cite this article (links to download the citations from this article in formats compatible with various reference manager tools)
A corticostriatal deficit promotes temporal distortion of automatic action in ageing
eLife 6:e29908.
https://doi.org/10.7554/eLife.29908


