Excitatory motor neurons are local oscillators for backward locomotion
- College of Life Science and Technology, Huazhong University of Science and Technology, China
- Mount Sinai Hospital, Canada
- University of Toronto, Canada
- School of Engineering and Applied Science, University of Pennsylvania, United States
- University of Massachusetts Medical School, United States
- University of California, United States
- University of Pennsylvania, United States
Figures
Figure 1 with 1 supplement

Body bends persist upon the ablation of premotor INs.
(A) The removal of premotor INs or MNs exerts different effects on body bends. Upper panel: schematics of the C. elegans motor circuit components and connectivity in wildtype animals (i) and upon ablation of respective neuronal populations (ii, iii). Hexagons and circles represent premotor INs and ventral cord MNs, respectively. Orange and blue denote components of the forward and reversal motor circuit, respectively. Taupe denotes neurons that participate both forward and backward locomotion. Lower panel: a snap shot of representative body posture exhibited by adult C. elegans with intact motor circuit (i), and upon the ablation of premotor INs (ii) or MNs (iii). (B) Representative curvature kymograms along the body of moving animals in respective genetic backgrounds. The upper and lower panels denote animals without (Control) and with (Ablated) LED illumination-induced neuron ablation during development. Black arrows on kymograms denote the direction of body bend propagation. (i) Wildtype (N2) animals exhibit a preference for continuous forward locomotion, consisting of anterior to posterior body bend propagation, with occasional and short backward locomotion, exhibited as posterior to anterior body bend propagation; (ii) ablation of all premotor INs (Ablated) leads to stalled body bending that prevents the propagation of head bending; (iii) simultaneous ablation of three major MN classes largely eliminates body bending in regions posterior to head. (C) Distribution of body curvatures posterior to head (33–96% anterior-posterior of body length) in wildtype (i), premotor INs-ablated (ii), and MNs-ablated (iii) animals, with (Control) and without (Ablated) LED illumination-induced neuronal ablation. Premotor INs ablation leads to an increase (ii) whereas MN ablation a decrease (iii) of the bending curvature. (D) Distribution of instantaneous velocity, represented by centroid displacement, in wildtype (i) premotor INs-ablated (ii) and MNs-ablated (iii) animals, with (Control) and without (Ablated) neuronal ablation. The ablation of either premotor INs or MNs leads to a drastic reduction of velocity. n = 10 animals per group (C, D). p>0.05 (not significant), ***p<0.001 against the respective non-ablated Control group by the Kolmogorov-Smirnov test.
Figure 1—figure supplement 1
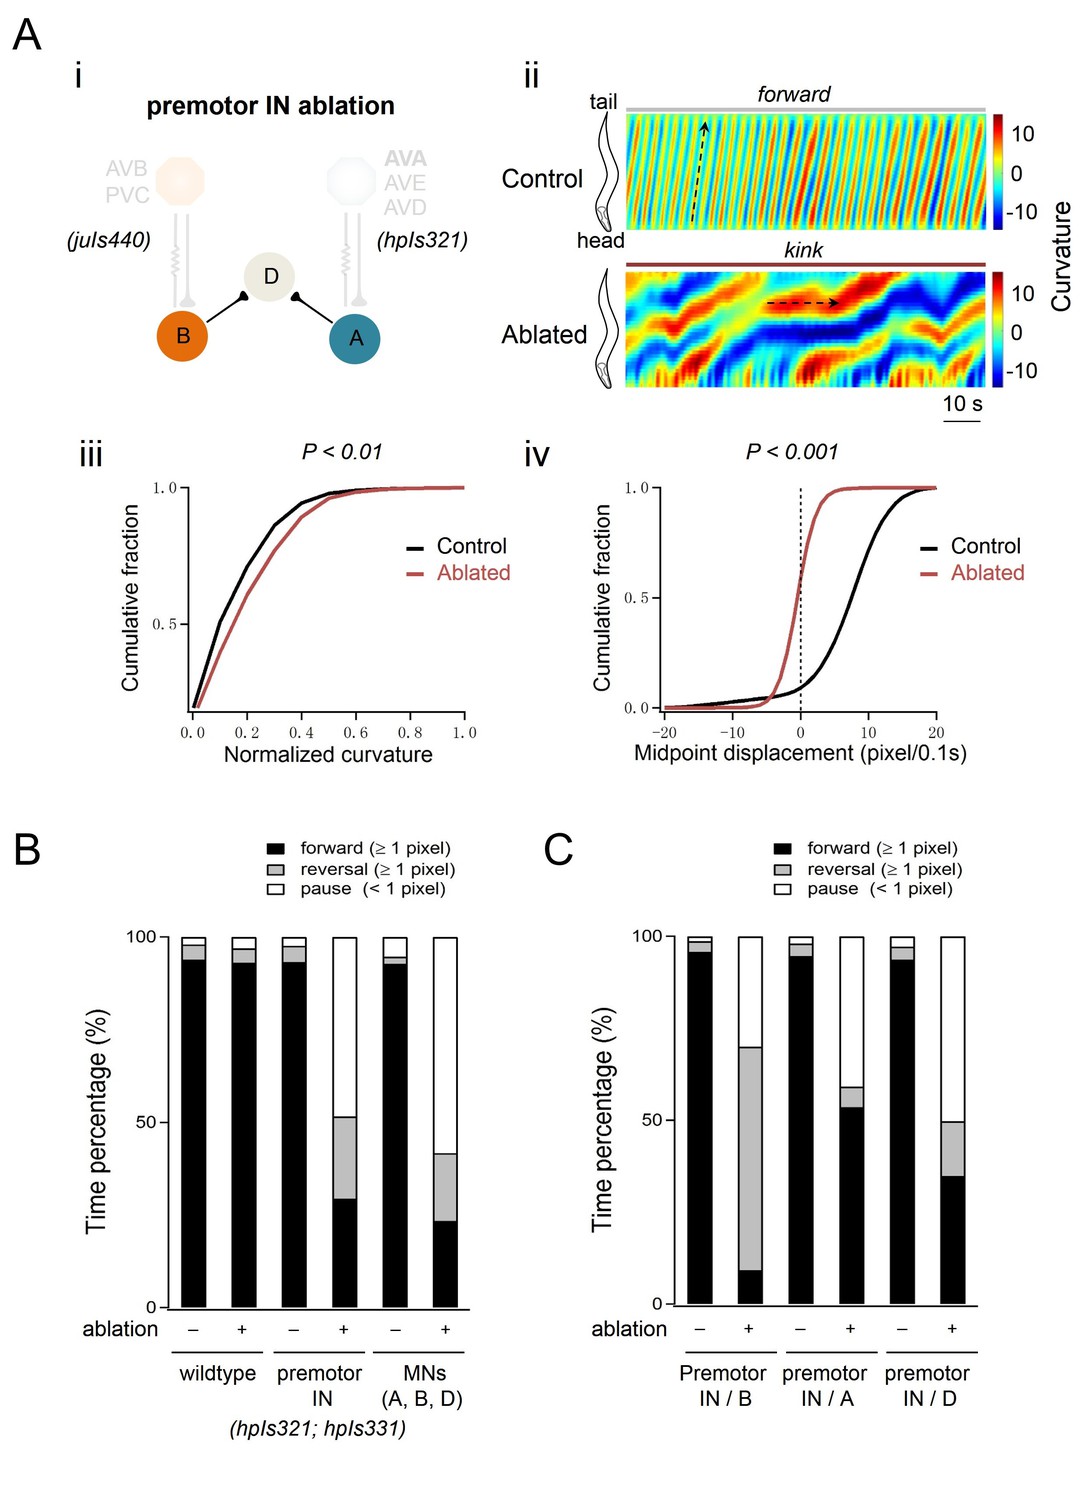
(A) Locomotor phenotypes of animals upon the ablation of premotor INs and (B,C) the propensity of directional movements in animals of respective genotypes.
(A) Ablation of all premotor INs, using a different miniSOG transgene combination, also leads to the kinker motor defects. (i) Schematics of the motor circuit components and connectivity in animals upon ablation of respective neuronal populations. The AVA, AVE, AVD, and PVC INs were ablated using the same transgene as in Figure 1 (hpIs321). Different from Figure 1, AVB INs were ablated using another transgene (juIs440) instead of hpIs331. hpIs331 and juIs440 overlap in miniSOG expression only in AVB. (ii) Representative curvature kymograms of moving animals. The upper and lower panels denote animals without (Control) and with (Ablated) LED illumination-induced neuronal ablation. The horizontal black arrow on the kymorgram denotes the lack of body bend propagation. Ablation of premotor INs leads to antagonizing head and tail body bends, or kink. (iii) Ablation of premotor INs leads to increased curvatures. (iv) Distribution of instantaneous velocity, represented by the animal’s mid-point displacement, without (Control) and with (Ablated) ablation. Premotor INs ablation leads to a drastic reduction of velocity. (B, C) Propensity of directional movements in animals of respective genotypes, quantified by the animal’s mid-point displacement. The ablation of premotor INs or A/B/D-MNs shifts the animal’s preference for backward locomotion and drastic increase propensity for the pause state (B). The co-ablation of premotor INs and B-MNs shifts the animal’s preference for backward locomotion, whereas the co-ablation of premotor INs and A-MNs shifts their preference for forward locomotion (C). The co-ablation of premotor INs and D-MNs does not alleviate the kinker posture (C). All exhibit a drastic increase propensity for the pause state. n = 10 animals per group. p<0.01; p<0.001 against with the respective non-ablated Control group by the Kolmogorov-Smirnov test.
Figure 2
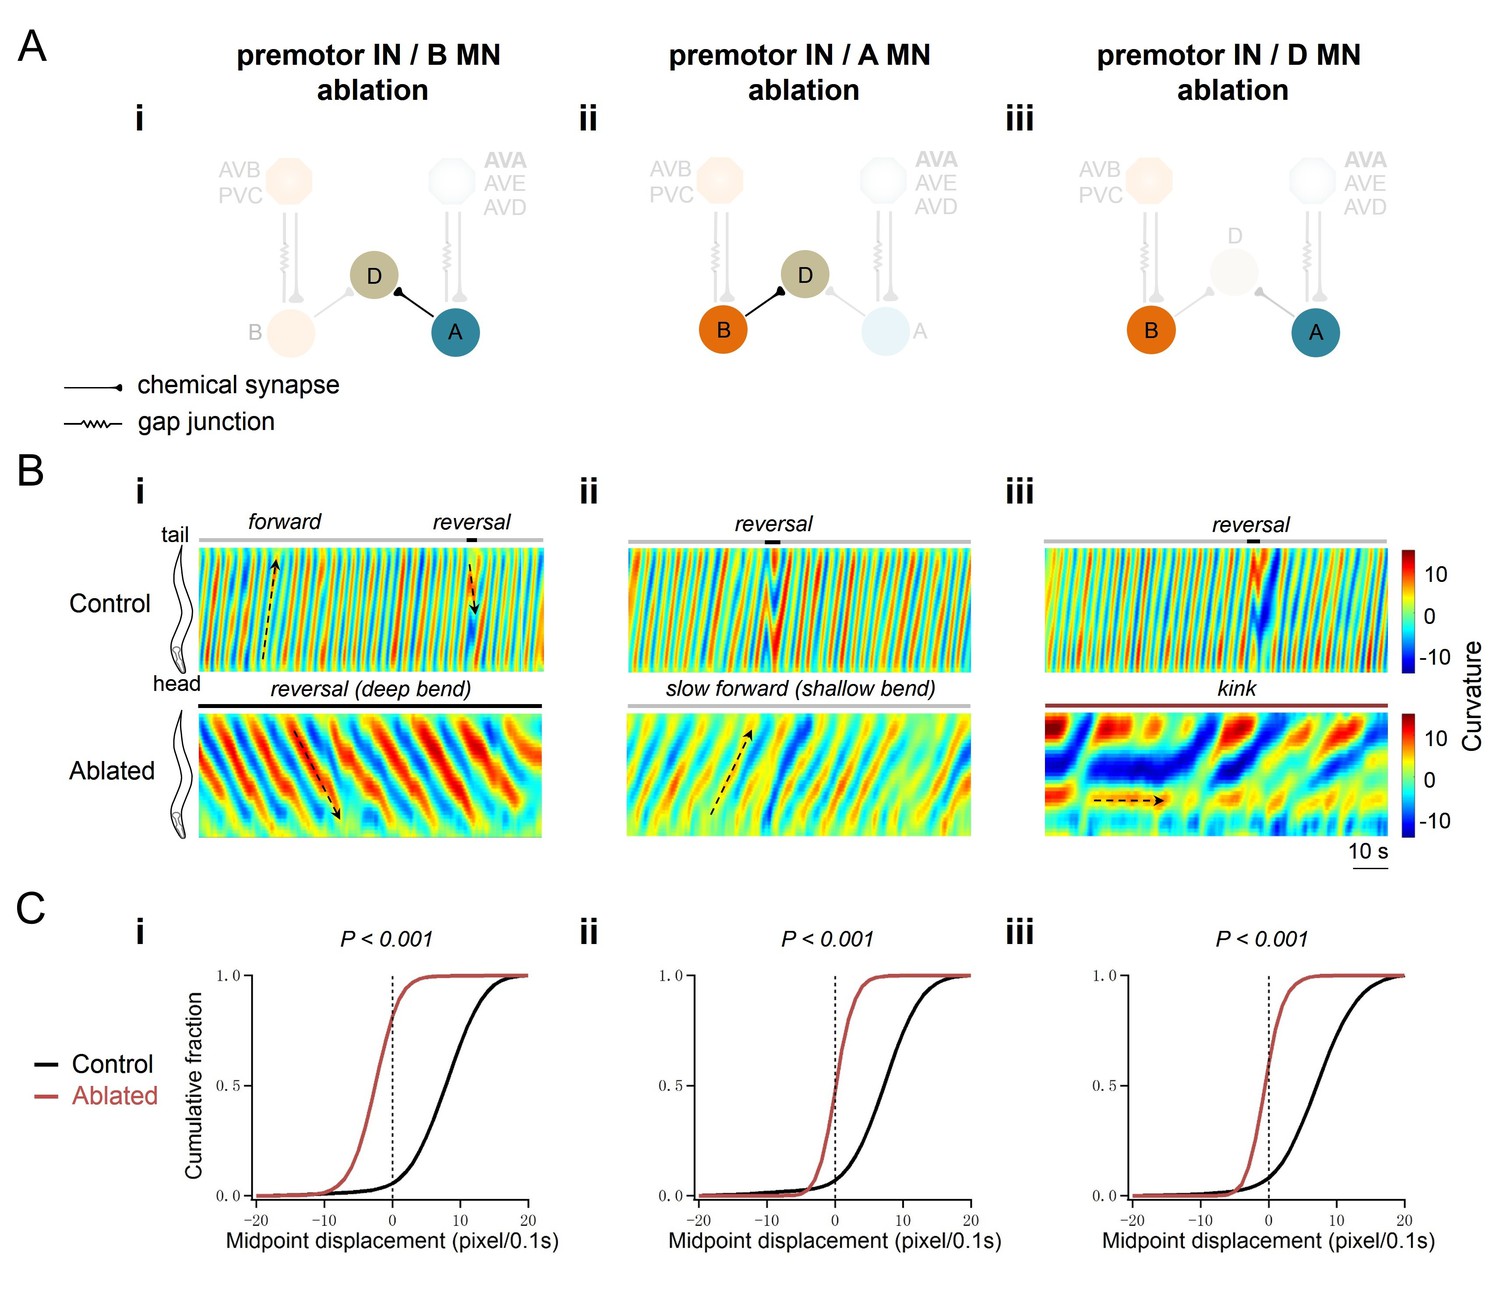
A-MNs execute directional, rhythmic locomotion without premotor INs.
(A) Schematics of the motor circuit components and connectivity of animals of respective genotypes, upon co-ablation of premotor INs and B-MNs (i), premotor INs and A-MNs (ii), or premotor INs and D-MNs (iii). (B) Representative curvature kymograms along the entire length of moving animals, without (Control) and with (Ablated) LED illumination-induced neuronal ablation. Black arrows pointing upwards and downwards on kymograms denote posteriorly or anteriorly propagating body bending, respectively. The horizontal arrow denotes the absence of bending propagation. Animals without premotor INs and B-MNs (i, lower panel) exhibit backward locomotion, as posterior to anterior propagating deep body bends, regardless of the propagation direction of head bending. Those without premotor INs and A-MNs (ii, lower panel) often exhibit slow forward locomotion, consisted of slowly propagating, anterior to posterior, shallow body bends. Animals without premotor INs and D-MNs (iii, lower panel) lead to kinker postures as in premotor INs-ablated animals. (C) Distribution of instantaneous velocity of animals of respective genotypes, represented by the mid-point displacement. The forward velocity (ii) is drastically reduced, whereas reversal velocity (i) is less affected than upon abaltion of premotor INs. n = 10 in each group, p<0.001 against the respective non-ablated Control group by the Kolmogorov-Smirnov test.
Figure 3 with 1 supplement
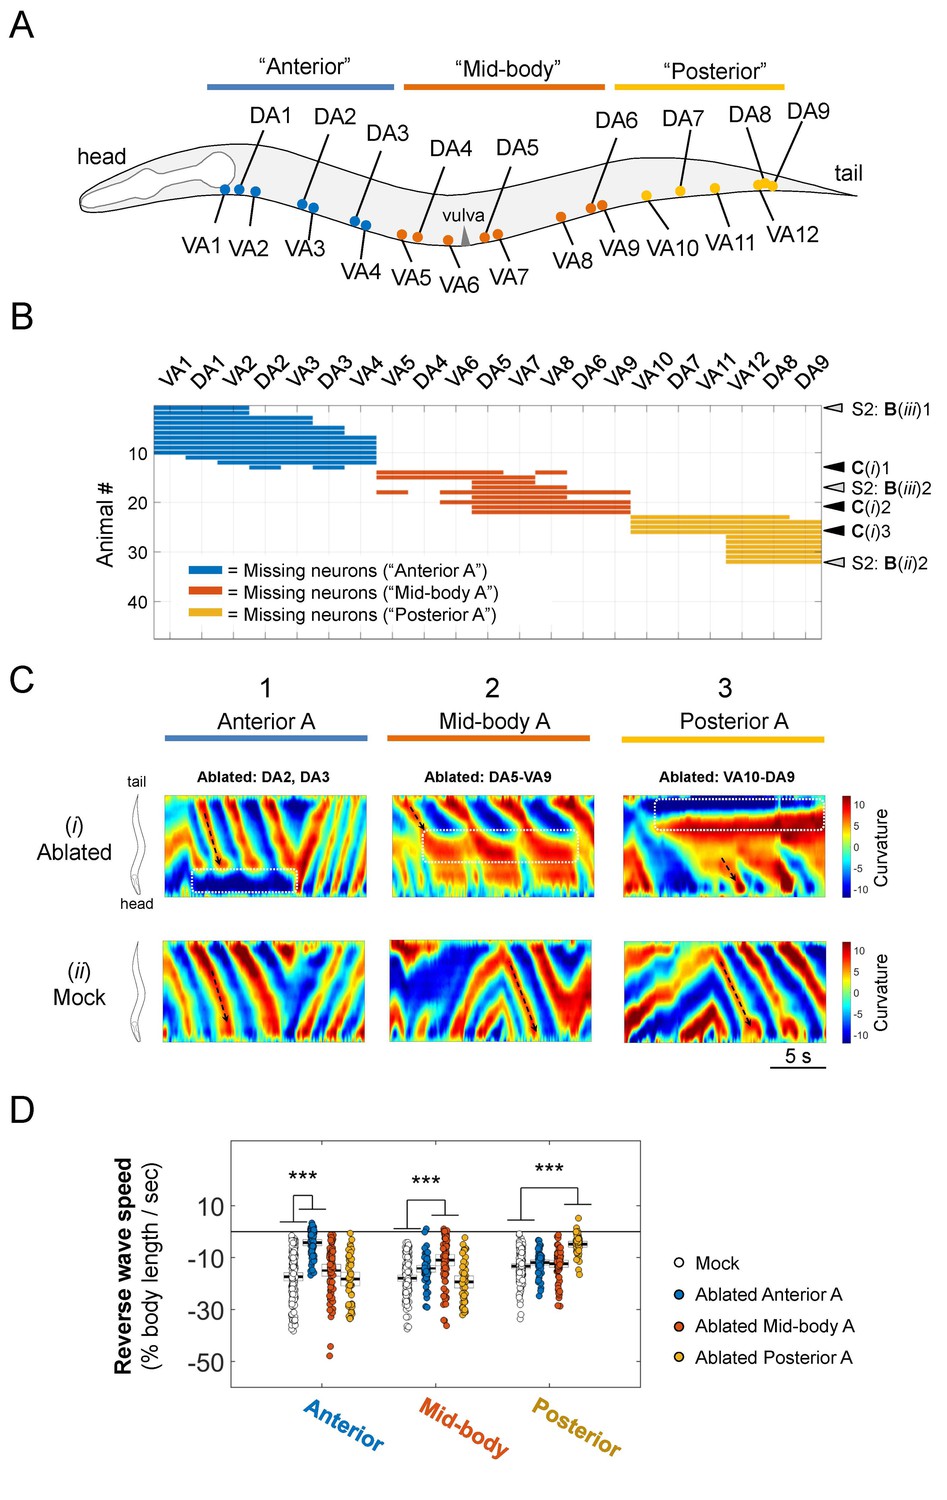
Sparse removal of A-MNs alters, does not abolish backward locomotion.
(A) Schematic of the approximate locations of all A-MNs and regions of targeted ablation. An ablation is classified as ‘Anterior’, 'Mid-body’, or ‘Posterior’ when at least one neuron from each region was ablated, and no neurons from other regions were ablated. (B) Missing A-MNs for each animal that was classified as Anterior (n = 13), Mid-body (n = 9), Posterior (n = 10), or Mock (n = 17) ablated. Black and gray arrowheads denote animals whose curvature kymograms are shown in (C) and Figure 3—figure supplement 1, respectively. (C) Representative curvature kymograms for each ablation type (upper panels) and mock controls for three strains from which pooled ablation data were quantified (lower panels). (D) The rate of reversal bending wave propagation in the anterior, mid- and posterior body for each ablation class. Each dot represents one bout of reversal movement > 3 s. Black bars indicate the mean, and white boxes denote the 95% confidence interval of the mean. Ablation decreases bending frequency locally, but not in other body regions. ***p<0.001 by one-way ANOVA followed by Bonferroni post-hoc comparisons.
Figure 3—figure supplement 1
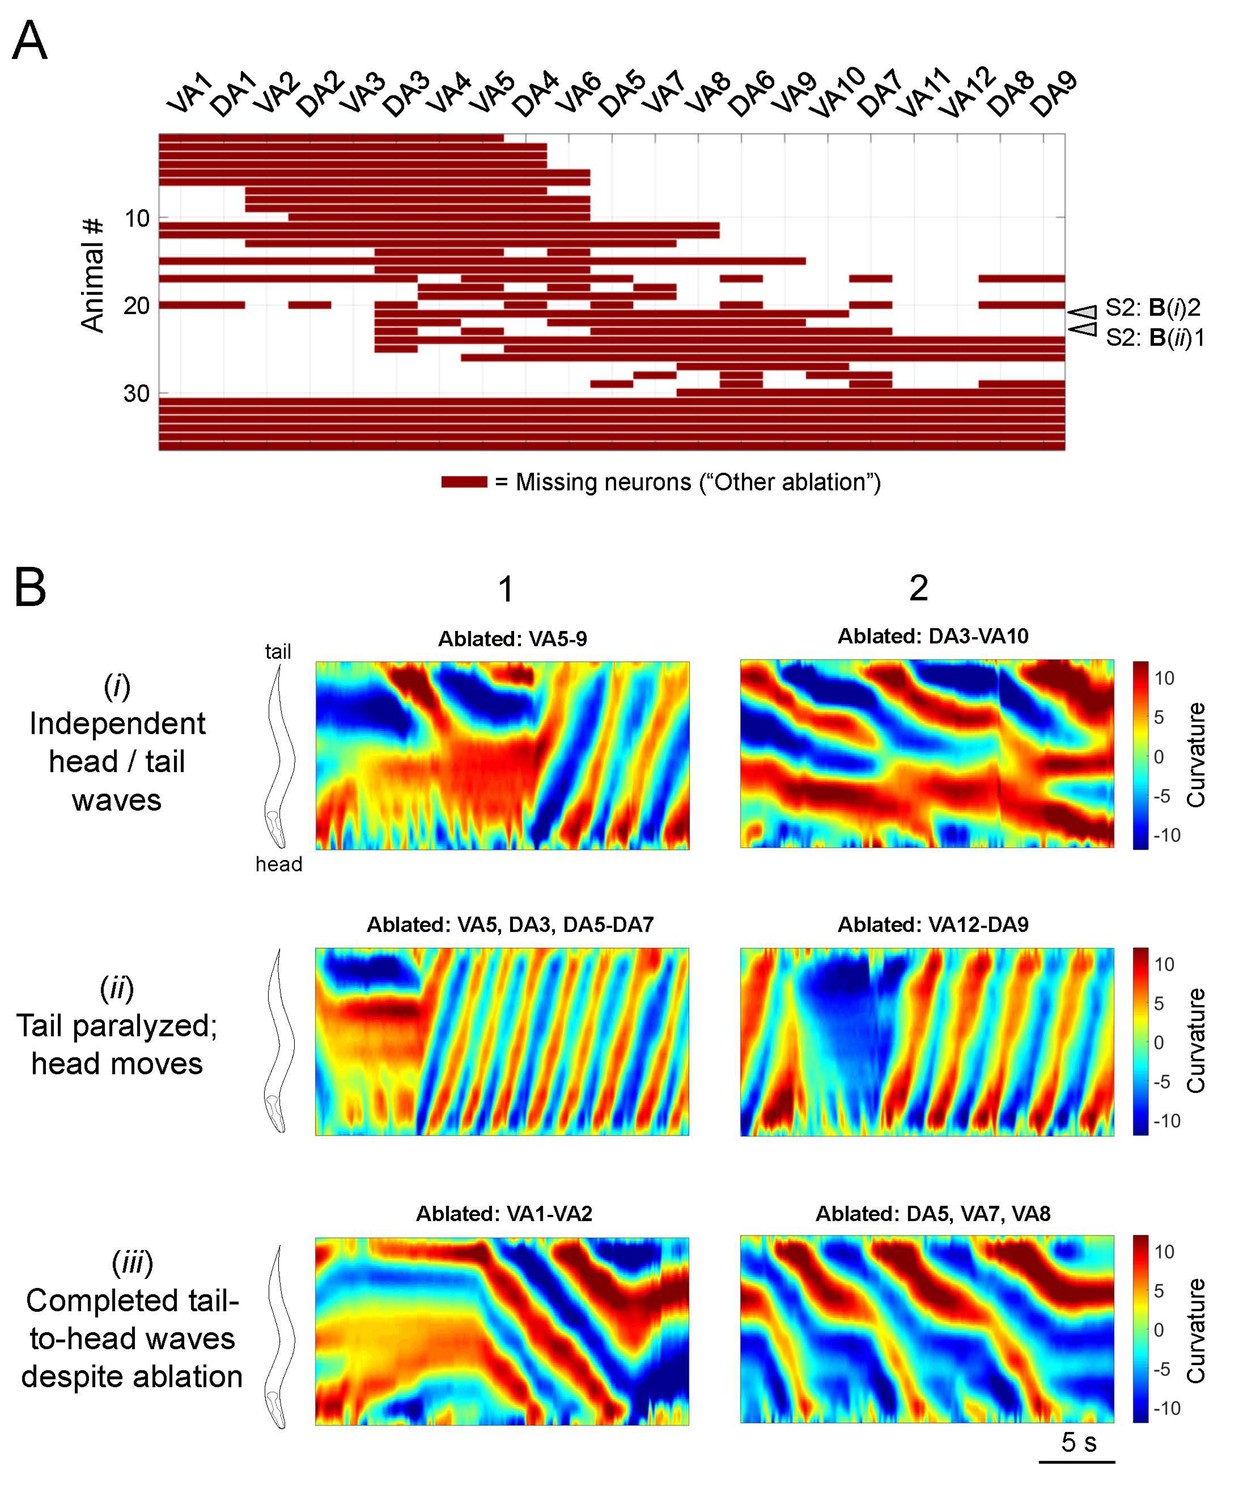
Information on all other partial A-MN-ablated animals.
(A) The ablation pattern of all animals that were examined in our study but could not be classified into the ablation groups as defined in Figure 3. Arrowheads denote animals whose curvature kymograms were shown in Panel B. (B) Additional example curvature kymograms from classified (Figure 3) and not classified (this figure) ablated animals with different phenotypes: those with independent head and tail oscillations (i) head oscillations with little tail oscillations (ii) and complete tail-to-head bending waves despite a few missing motor neurons (iii). Black arrows on kymograms denote the direction of body bending propagation.
Figure 4 with 2 supplements
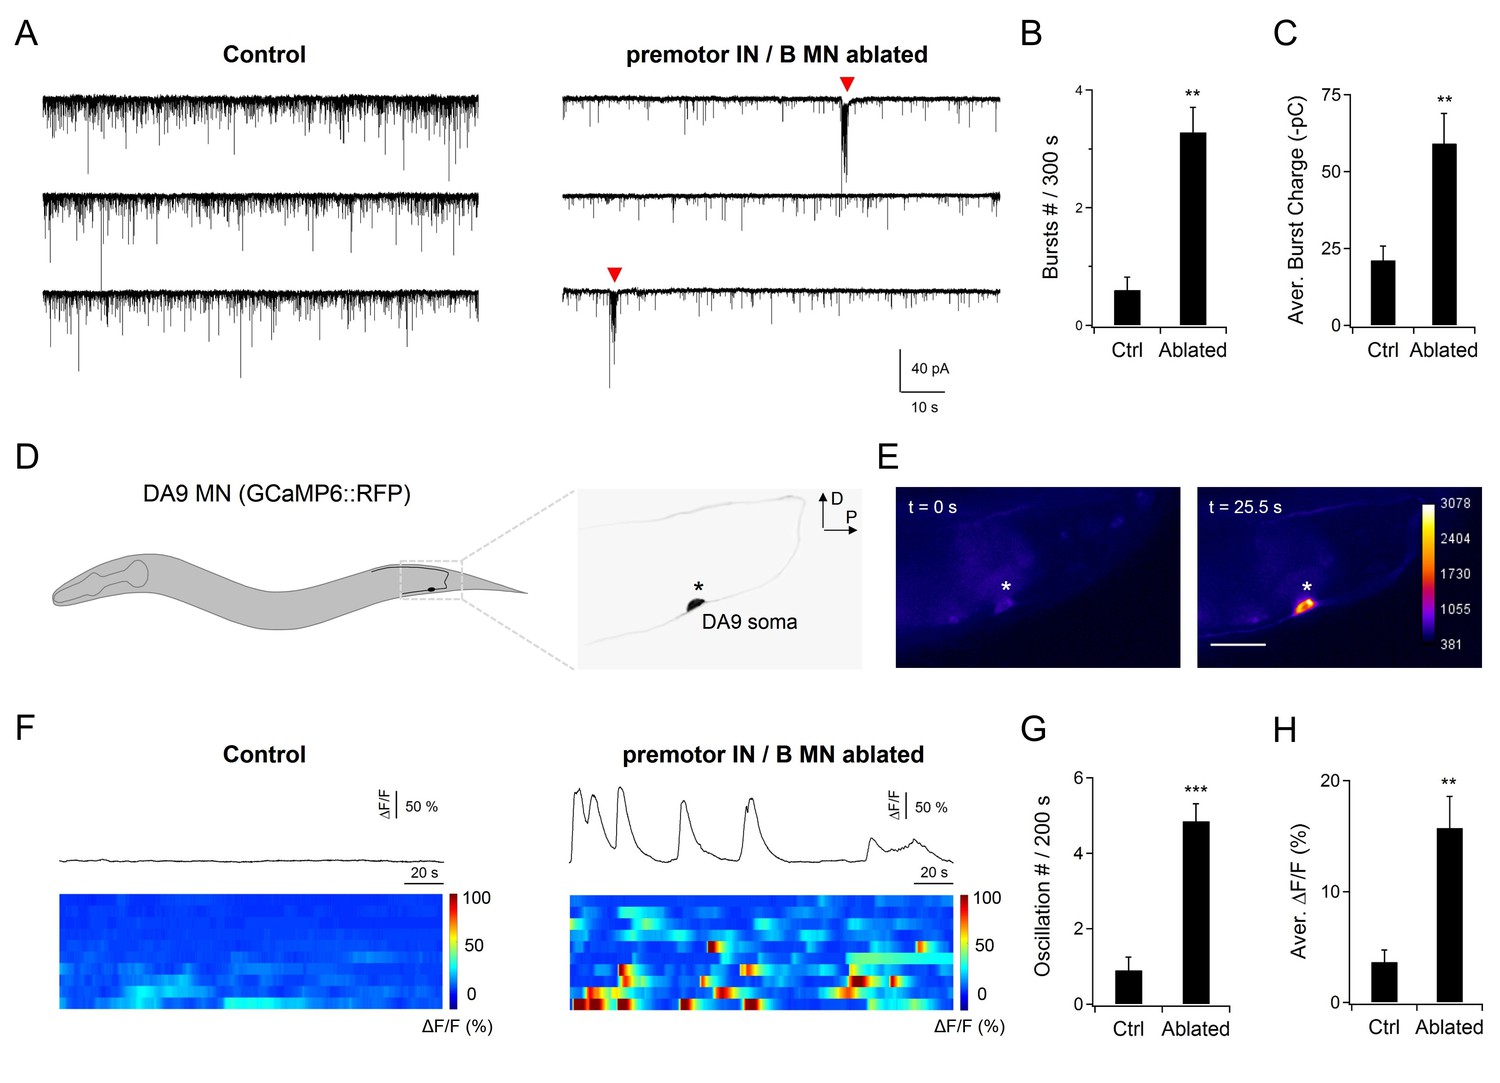
A-MNs exhibit rhythmic activities upon the ablation of premotor INs .
(A) A representative post-synaptic PSC recording at the NMJ preparation of the same genotype, without (Control, left panel) or with (Ablated, right panel) LED illumination-induced ablation of premotor INs and B-MNs. Rhythmic PSC burst events (arrowheads) were consistently observed upon the removal of premotor INs and B-MNs. (B, C) Quantification of the rPSC burst frequency (B) and discharge (C), without (Ctrl) or with (Ablated) ablation. Both the rPSC bursts frequency and discharge are significantly increased in Ablated animals. n = 10 animals each group. (D) Schematics of the morphology and trajectory of the DA9 MN soma and processes, visualized by an A-MN GCaMP6s::RFP Ca2+ reporter. (E) Fluorescent signals during oscillatory Ca2+ changes in the DA9 soma. (F) Examples of the DA9 soma Ca2+ transient traces, and raster plots of recordings from individual animals of the same genotype, without (Control) and with (Ablated) the ablation of premotor INs and B-MNs. n = 10 animals each group. (G, H) Quantification of the Ca2+ oscillation frequency and mean total Ca2+ activities, without (Ctrl) and with (Ablated) the ablation of premotor INs and B-MNs. Both the oscillation frequency and total activity of DA9 are significantly increased in ablated animals. **p<0.01, ***p<0.001 against the respective non-ablated Control group by the Mann-Whitney U test. Error bars, SEM.
Figure 4—figure supplement 1
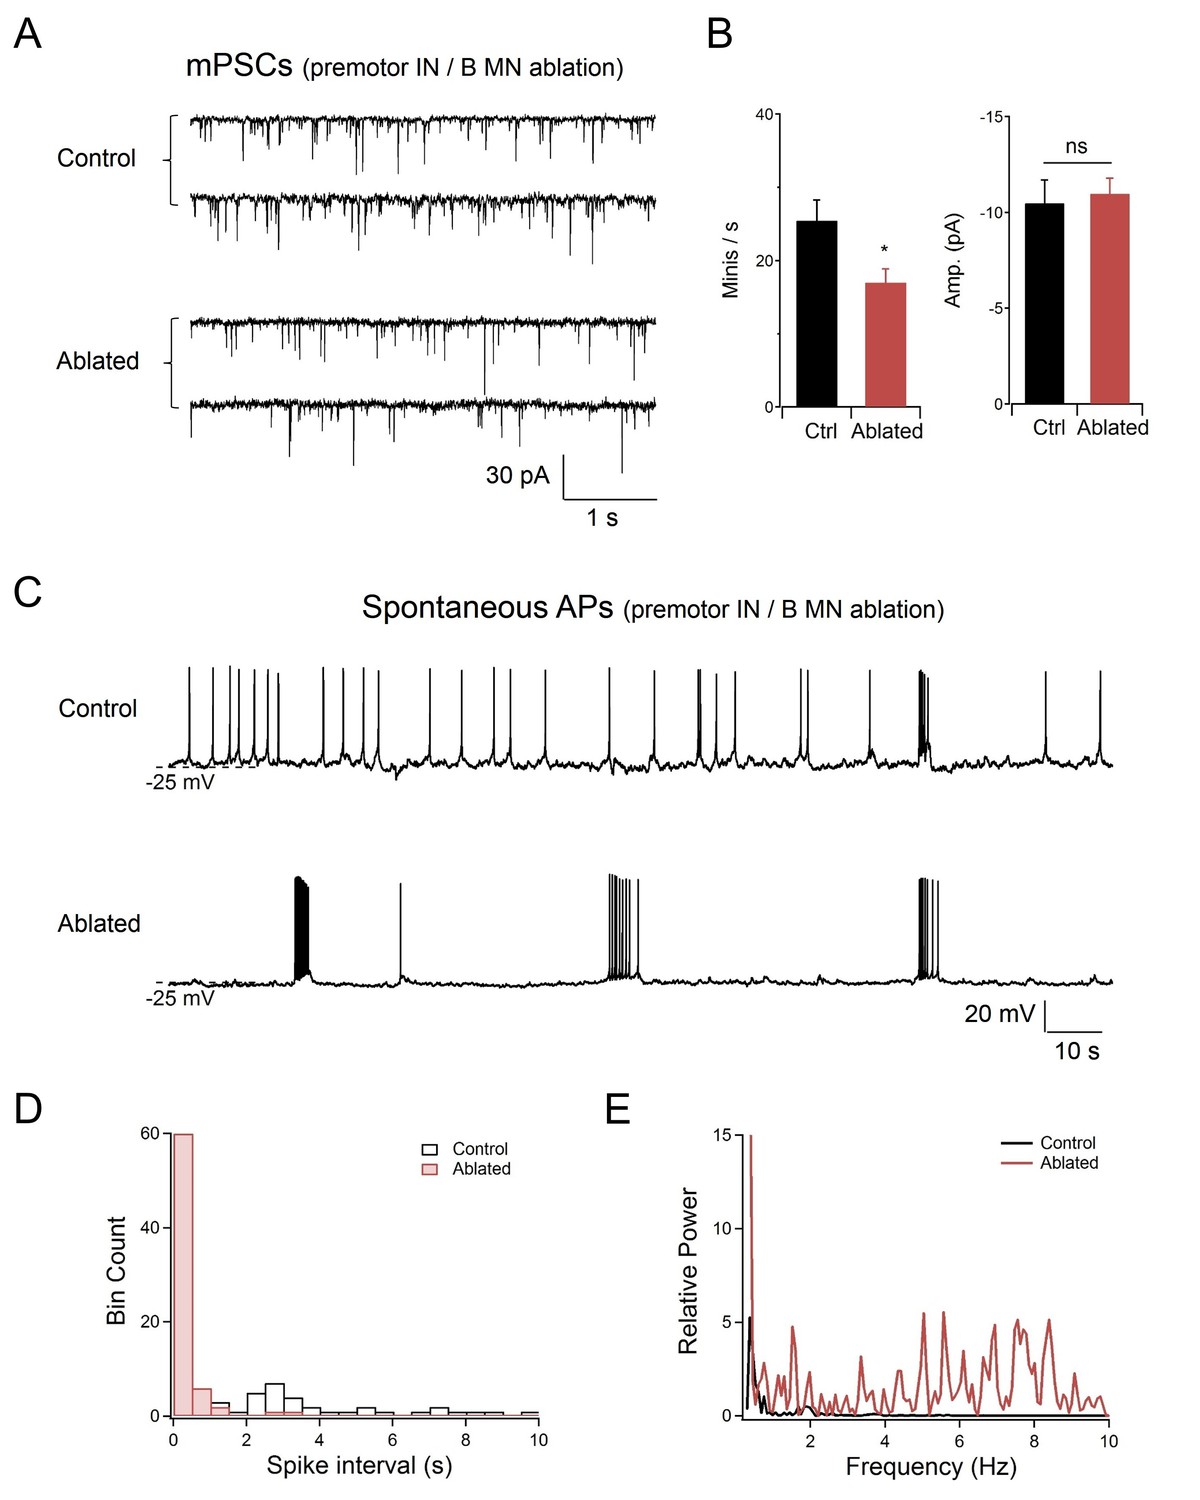
Rhythmic postsynatic action potential bursts were observed upon the co-ablation of premotor INs and B-MNs at the neuromuscular preparation.
(A) Representative spontaneous mini-postsynaptic currents (mPSCs) recorded at −60 mV without (Control) and with (Ablated) the ablation of premotor INs and B-MNs. (B) Quantification of the mPSC frequency and amplitude, without (Ctrl) and with (Ablated) the ablation of premotor INs and B-MNs. Ablation of premotor INs and B-MNs only led to a moderate decrease of mPSC frequency, without changes in the amplitude. n = 10 animals each group, ns, not significant, *p<0.05 against Control by the Mann-Whitney U test. Error bars, SEM. (C) Representative spontaneous action potentials (APs) by body wall muscles held at 0 pA, without (Control) and with (Ablated) the co-ablation of premotor INs and B-MNs. Resting membrane potential was unchanged, but the AP pattern was altered upon ablation. Control preparations exhibited single APs. After the ablation, periodic AP bursts were observed. (D, E) Quantification of the AP spike interval (D) and power spectrum of high frequency AP events (E) exhibited decrease and increase, respectively, upon the ablation of premotor INs and B-MNs.
Figure 4—figure supplement 2
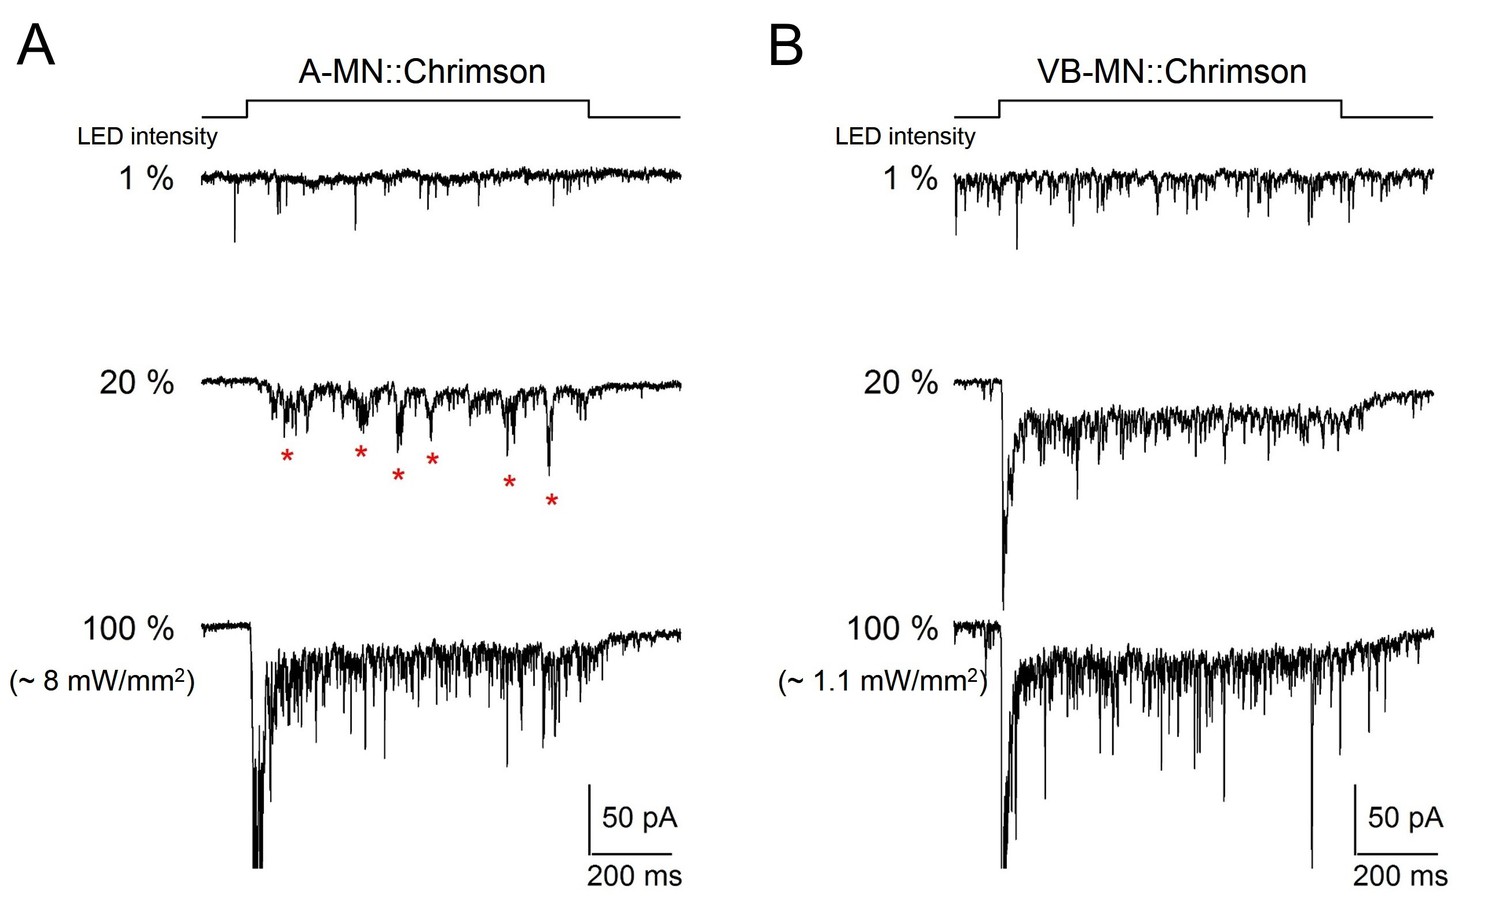
Direct optogenetic stimulation of A-MNs leads to rhythmic PSCs.
(A, B) Representative traces of evoked postsynaptic currents upon LED-mediated optogenetic stimulation (Chrimson) of A-MNs (A), and ventral muscle innervating VB-MNs (B). Muscles were held at −60 mV. Chrimson was expressed by Punc-4 (A-MNs) and Pceh-12 (VB-MNs), respectively. The top panel illustrates the duration of light stimulation. The PSC frequencies, upon sequential increase of light intensity, exhibited corresponding increase in both preparations. rPSCs, denoted as red stars were readily evoked upon the stimulation of A-MNs at intermediate stimulation intensity but were not observed within the examined range of VB-MNs stimulations.
Figure 5
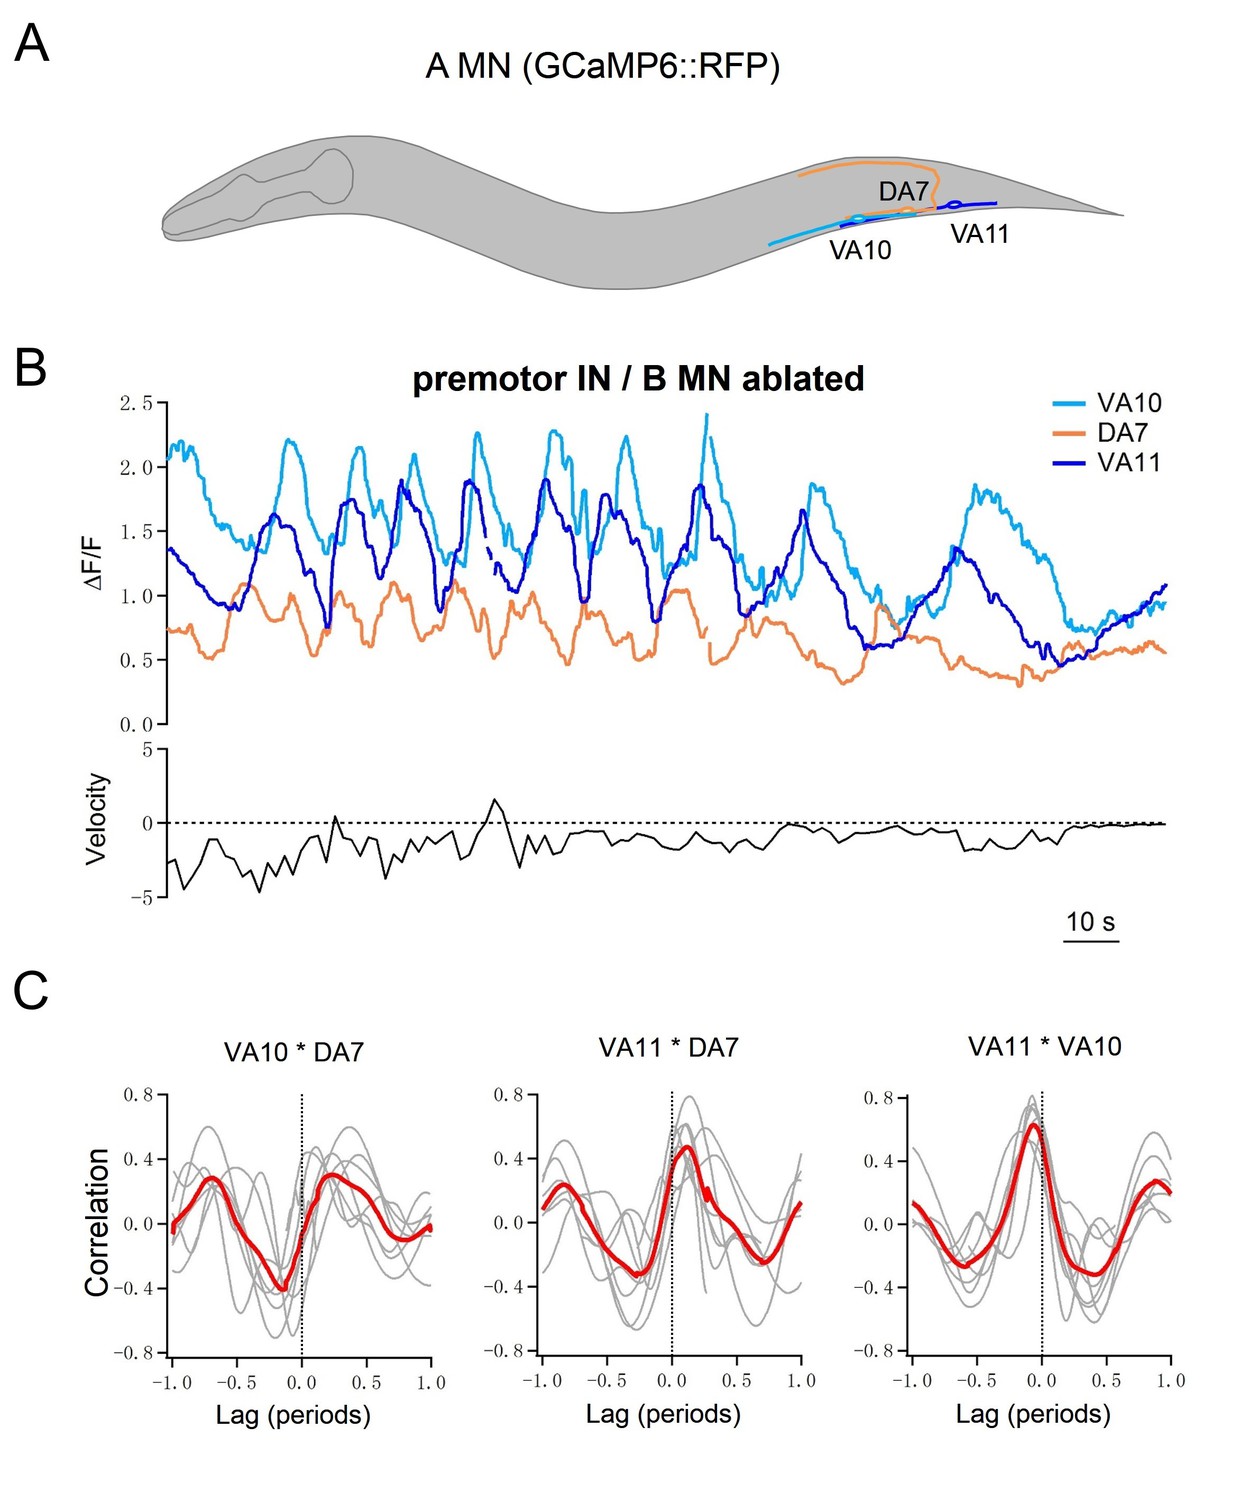
Multiple A-MNs are phase coupled to generate backward locomotion in the absence of premotor INs and B-MNs.
(A) Schematics of the morphology and trajectory of the VA10, DA7, VA11 MN somata and processes. (B) Upper panel: example traces of calcium activities of three A-MNs, in animals where all premotor INs and B-MNs have been ablated. The VA10 and VA11 innervate adjacent ventral body wall muscles; the DA7 innervates dorsal muscles in opposition to those by the VA10 and VA11. Periodic Ca2+ oscillations were observed in all neurons, represented by changes in the GCaMP6/RFP ratio (Y-axis) over time (X-axis). Lower panel: the animal’s instantaneous velocity (Y-axis) simultaneously recorded during calcium imaging, was represented by the displacement of the VA11 soma. Values above and below 0 indicate forward (displacement toward the head) and backward (displacement toward the tail) locomotion, respectively. This animal exhibited continuous reversals. Note that the speed of Ca2+ change during oscillation correlates with reversal velocity. (C) Phasic relationships among DA7, VA10, and VA11. DA7's activity change is anti-phasic to that of VA10 and V11, whereas the activity changes of VA10 and VA11 exhibit a small phase shift, with VA11 preceding VA10. The red line denotes the mean of all recordings. n = 7 animals.
Figure 6

Activation of premotor INs AVA potentiates A-MN-dependent rPSC bursts.
(A) The evoked and spontaneous rPSC bursts share frequency spectrum characteristics. Black traces: frequency spectrum analyses (upper panel) for three rPSC traces upon the optogenetic activation of AVA premotor INs (lower panel); Yellow traces: frequency spectrum analyses (upper panel) for three spontaneous rPSC bursts exhibited by animals upon the co-ablation of premotor INs and B-MNs (lower panel). (B) Representative traces of AVA-evoked rPSC bursts in respective genotypic backgrounds, both in the presence (Control) or absence (Ablated) of specific neuronal groups. +: hpIs270 (AVA-specific ChR2 activation upon exposure to LED, in wildtype background); - AVA: hpIs270; hpIs321 (upon expsure to LED, after a subset of premotor INs including AVA were ablated); - AVB: hp270; hpIs331 (upon exposure to LED, after several INs including AVB were ablated); - A: hpIs270; hpIs371 (upon exposure to LED, after A-MNs were ablated); - B: hpIs270; hpIs604 (upon exposure to LED, after B-MNs were ablated). (C) Quantification of rPSC burst frequencies evoked by AVA activation in respective genetic backgrounds. (D) Quantification of total discharge of rPSC bursts evoked by AVA in respective genetic backgrounds. Both are diminished upon the ablation of AVA, but are not affected by ablation of the AVB premotor INs. They are both significantly decreased in A-, but not B-MN-ablated animals (n ≥ 5 in each data set). ns, not significant (p>0.05), ***p<0.001 against the respective non-ablated Control group by the students’ t - test. Error bars, SEM.
Figure 7 with 2 supplements

An endogenous UNC-2 channel activity regulates A-MN’s rhythmic activity.
(A) Representative PSC recordings of the NMJ preparations of respective genotypes, after the co-ablation of premotor INs and B-MNs. The amplitude and frequency of periodic rPSC bursts (arrowheads) were reduced in unc-2(e55; lf), and increased in unc-2(hp647; gf) mutant animals. (B) Quantification of the rPSC burst frequency in respective genotypes. (C) Quantification of the total discharge of rPSC bursts in respective genotypes. Both were reduced in unc-2(e55; lf), and increased in unc-2(hp647; gf) mutants (n ≥ 7 in each dataset). (D) Example traces of the DA9 soma Ca2+ recording (left panels), and raster plots of all Ca2+ recordings (right panels) in wildtype animals (n = 10), unc-2(e55; lf) (n = 12), and unc-2(hp647; gf) (n = 10) mutants upon the co-ablation of premotor INs and B-MNs. (E) Quantification of DA9’s Ca2+ oscillation frequency in respective genotypes upon the co-ablation of premotor INs and B-MNs ablation. (F) Quantification of the overall DA9 Ca2+ activity in respective genotypes upon premotor INs and B-MNs. When compared to wildtype animals, both the frequency and activity of Ca2+ oscillation are significantly reduced in unc-2(e55; lf) and increased in unc-2(hp647; gf) mutant animals. (G) Example DA9 soma Ca2+ traces (left panels) and raster plots of all Ca2+ traces (right panels) in unc-13(lf) mutants, without (Control, n = 10) and with (Ablated) the co-ablation of premotor INs and B-MNs (Ablated, n = 11). (H, I) Quantification of the Ca2+ oscillation frequency (H) and overall activities (I) in unc-13 mutants. *p<0.05, **p<0.01, ***p<0.001 against the respective non-ablated Control group by the Mann-Whitney U test.
Figure 7—figure supplement 1
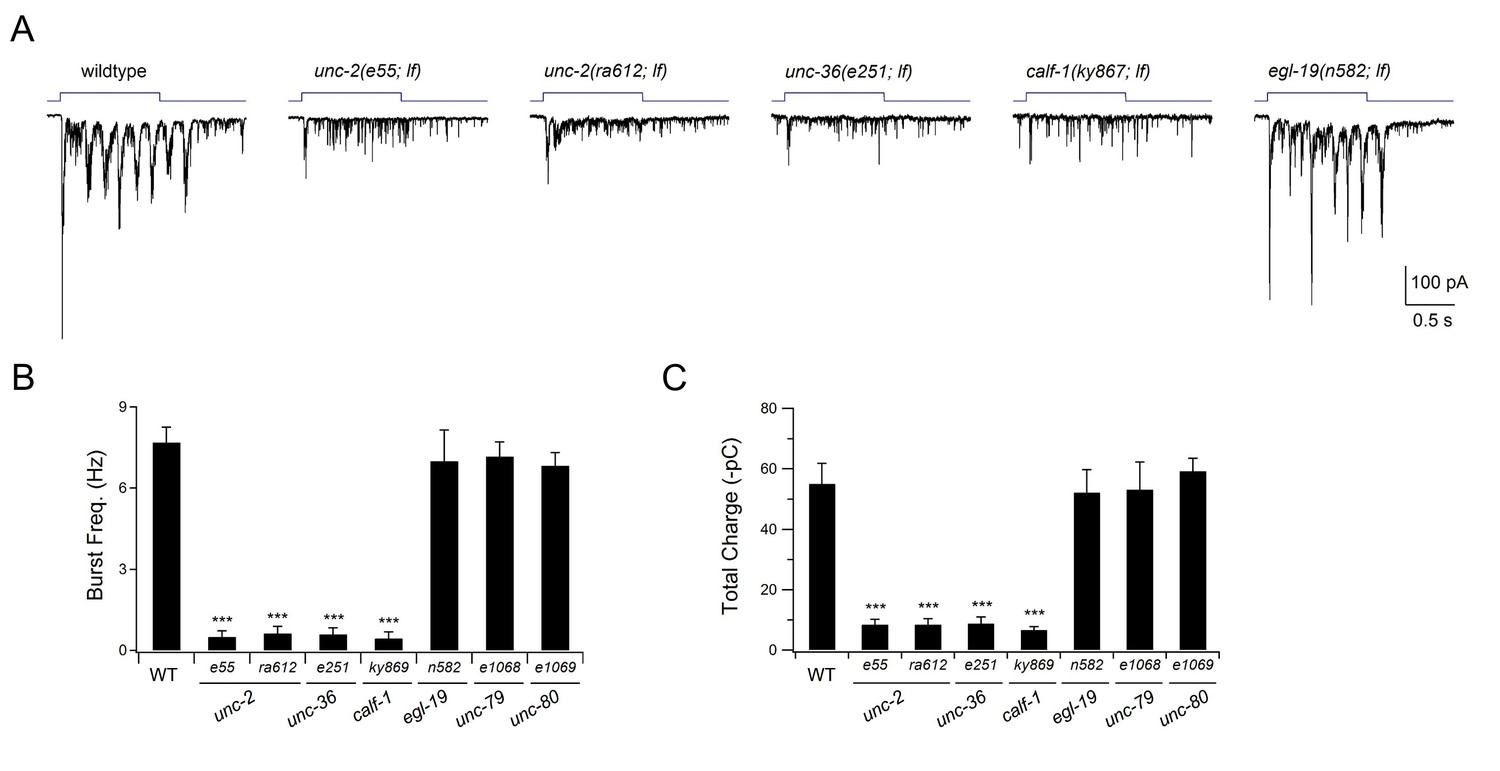
The P/Q/N-type VGCC UNC-2 is required for evoked rPSC bursts.
(A) Representative traces for evoked rPSCs in animals of respectively genotypes. All are loss-of-function (lf) alleles. Wildtype refers to the optogenetic stimulation strain, hpIs166 (Pglr-1::ChR2), which expresses ChR2 in multiple premotor INs including AVA. The top panel illustrates the duration of continuous light stimulation. Partial lf alleles for the pore-forming alpha subunit UNC-2 (e55 and ra612), beta subunit UNC-36 (e251), and the ER delivery subunit CALF-1 (ky867) of the P/Q/N-type VGCC exhibited the same phenotype: optogenetic stimulation of premotor INs led to increased mPSC frequency, but without rPSC bursts. The same stimulation protocol induced robust rPSC bursts in a partial lf mutant for the alpha subunit of the L-type VGCC EGL-19 (n582). (B, C) Quantification of the burst frequency (B) and total charge (C) of the evoked rPSC bursts. Both were reduced in the P/Q/N-VGCC mutants (unc-2, unc-36, and calf-1), but were unaffected in the L-VGCC (egl-19) and NCA sodium leak channel (unc-79 and unc-80) mutants. n ≥ 5. ***p<0.001 against wildtype animals by the Mann-Whitney U test. Error bars, SEM.
Figure 7—figure supplement 2
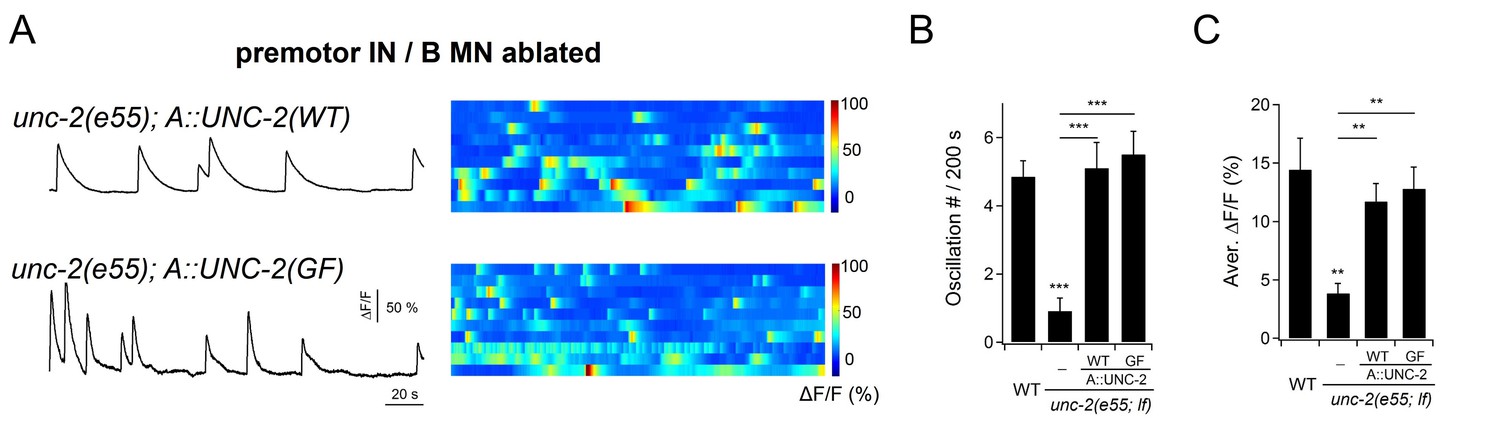
Cell-autonomous UNC-2 conductance underlies DA9 calcium oscillation.
(A) Representative DA9 Ca2+ transient traces (left panels), and raster plots of all Ca2+ recordings (right panels), when UNC-2(WT) or UNC-2(GF) were specifically restored into the A-MNs in unc-2(e55; lf) mutant animals. All data were recorded after the co-ablation of premotor INs and B-MNs. n = 10 per group. (B) Quantification of the DA9 Ca2+ oscillation frequency in respective genotypes. (C) Quantification of overall DA9 Ca2+ activity in respective genotypes. Both the frequency and level of DA9 Ca2+ oscillation are rescued by specific restoration of either UNC-2(WT) or UNC-2(GF) to A-MNs. **p<0.01, ***p<0.001 against the premotor IN and B-MN-ablated wildtype animals by the Mann-Whitney U test. Error bars, SEM.
Figure 8
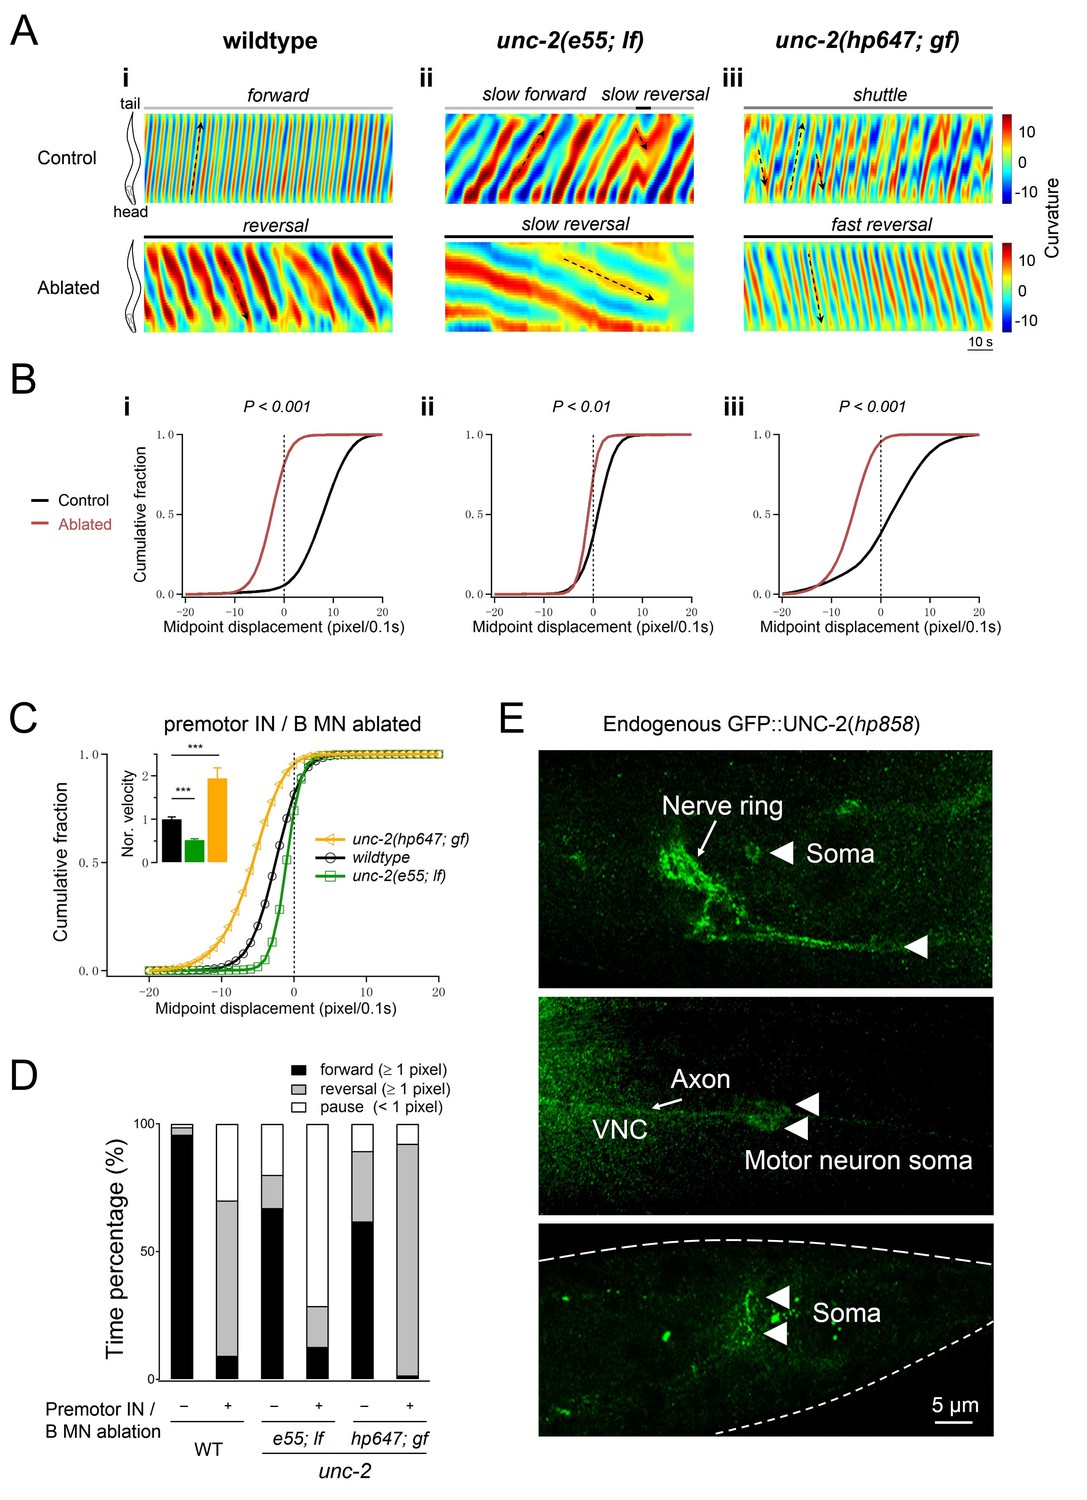
Increased UNC-2 activity leads to increased reversal velocity and duration.
(A) Representative curvature kymograms of wildtype and unc-2 mutant animals, without (Control) and with (Ablated) the co-ablation of premotor INs and B-MNs. Black arrows on kymograms denote directions of bending propagation. (B) Distribution of instantaneous velocity exhibited by animals of respective genotypes, presented by the animal’s mid-point displacement where the positive and negative values represent the forward and backward locomotion, respectively. While all animals exhibit backward locomotion upon the co-ablation of premotor INs and B-MNs, the speed of bending wave propagation, representing the reversal velocity, is significantly reduced and increased in unc-2(lf) and unc-2(gf) mutants, respectively. n = 10 animals per group. **p<0.01, ***p<0.001 against the non-ablated animals of the same genotype by the Kolmogorov-Smirnov test. (C) Distribution of the instantaneous velocity of wildtype, unc-2(lf), and unc-2(gf) mutant animals, upon the removal of premotor INs and B-MNs. Decreased UNC-2 activity leads to drastic reduction of velocity, whilst increased UNC-2 activity leads to increased velocity. ***p<0.001 against premotor IN and B-MN-ablated wildtype animals by the Kolmogorov-Smirnov test. Error bars, SEM. (D) Propensity of directional movements in animals of respective genotypes, quantified by the animal’s mid-point displacement. Upon the removal of premotor INs and B-MNs, all animals shift to a bias for backward locomotion; Note that unc-2(lf) mutants also exhibit a significant increase of pauses, whereas unc-2(gf) mutants eliminate forward locomotion. (E) The expression pattern of endogenous UNC-2, determined by a GFP::UNC-2(hp858) knock-in allele, stained with antibodies against GFP. Dense, punctate signals decorate the nerve processes of the central and peripheral nervous systems, as well as somata in central nervous system (top panel) and ventral cord motor neurons (middle panel), including the DA8 and DA9 soma (bottom panel). VNC, ventral nerve cord. Scale bar: 5 μm.
Figure 9 with 1 supplement
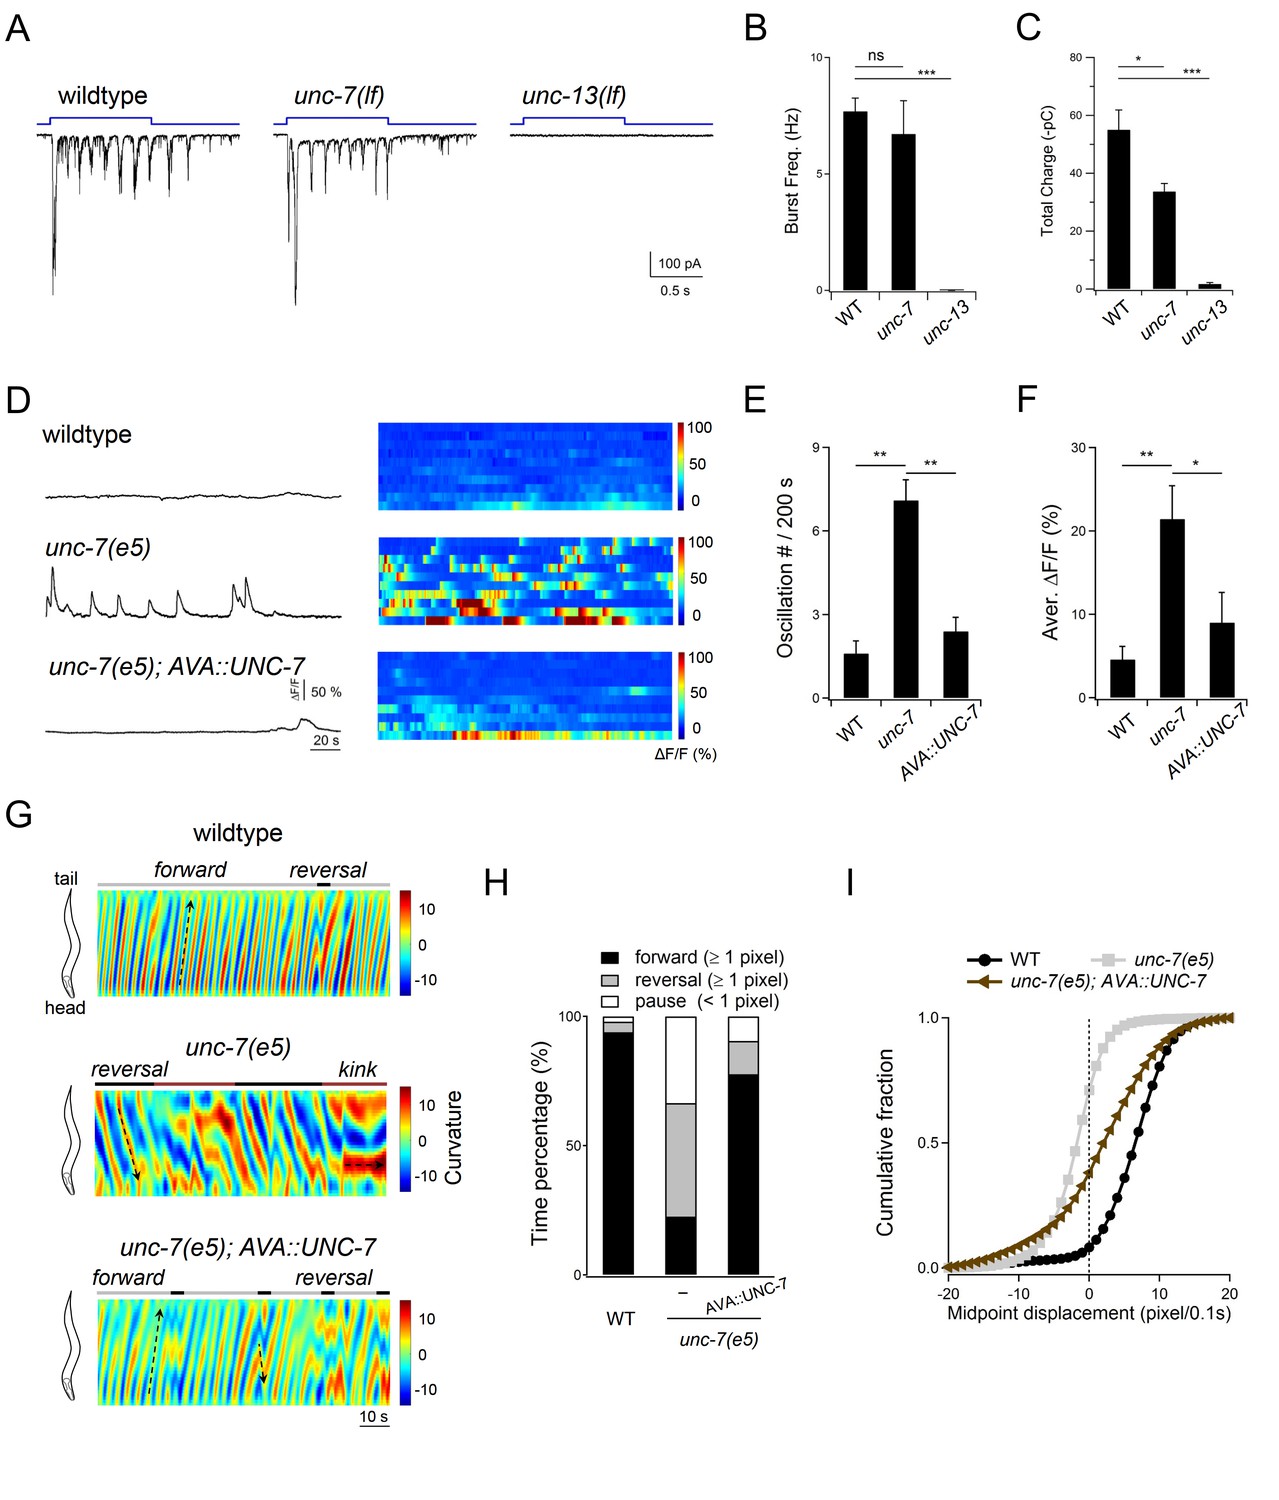
Descending premotor INs AVA exert dual modulation - inhibition and potentiation - of A-MN’s oscillatory activity to control the reversal motor state.
(A) Representative rPSC recordings in wildtype, unc-7(lf) and unc-13(lf) animals upon the optogenetic stimulation of premotor INs AVA. (B, C) Quantification of the frequency (B) and total discharge (C) of rPSC bursts in respective genotypes. n = 16, 7 and 3 animals for wildtype, unc-7 and unc-13, respectively. (D) Representative DA9 soma Ca2+ traces and raster plots of all Ca2+ traces in wildtype, unc-7(lf) and AVA-specific UNC-7-rescued animals, all with the presence of premotor INs and B-MNs. n = 10 animals each group. (E, F) Quantification of the Ca2+ oscillation frequency (E) and mean overall activities (F) in respective genotypes. DA9’s activity exhibits significant increase in unc-7(lf) mutants in the presence of premotor INs and B-MNs. *P<0.05,**p<0.01, ***p<0.001 against the rspective wildtype Control group by the Mann-Whitney U test. Error bars, SEM. (G) Representative curvature kymograms of wildtype, unc-7(lf) and AVA-specific UNC-7-rescued animals in the presence of premotor INs and B-MNs. Upward and downward pointing black arrows on kymograms denote posterior- and anterior-propagating body bends; the horizontal black arrow denotes the absence of propagation. (H) Propensity of directional movements in animals of respective genotypes, quantified by the animal’s mid-point displacement. A specific restoration of UNC-7 in AVA significantly rescued unc-7 mutant animal's bias for backward movement and pause. (I) Distribution of instantaneous velocity of respective genotypes, presented by the animal’s mid-point displacement. AVA-specific UNC-7 expression also partially rescued the mobility of unc-7(lf) mutant. n = 10 animals per group.
Figure 9—figure supplement 1
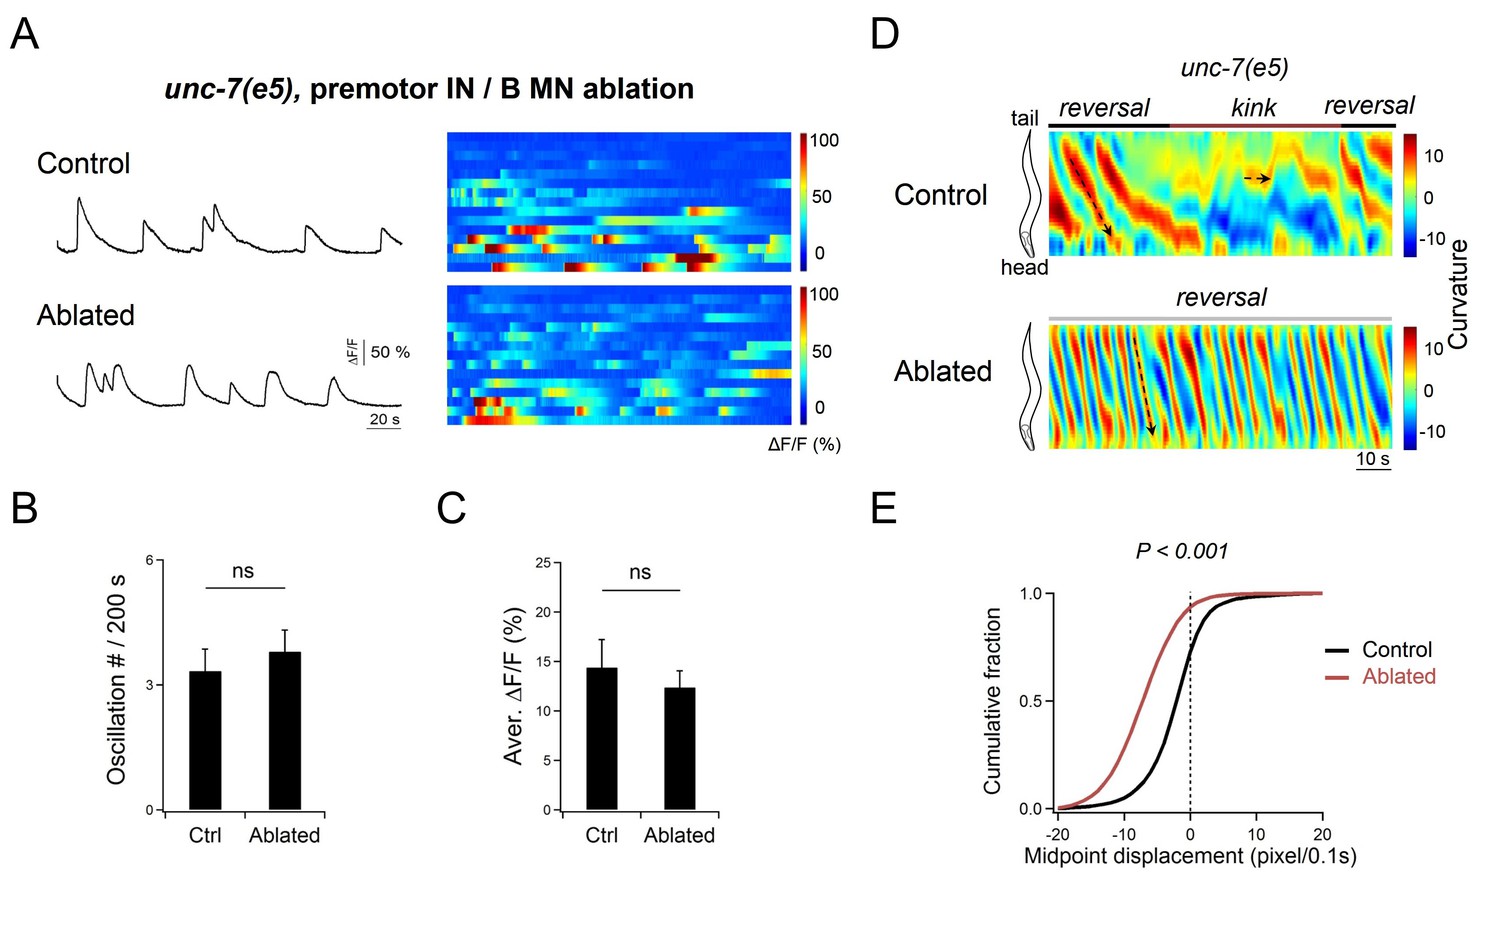
DA9 oscillation is not changed in unc-7 mutant animals after the removal of premotor INs and B-MNs.
(A) Representative DA9 soma Ca2+ traces and raster plots of all Ca2+ traces in unc-7(e5; lf) mutant animals before (Control) and after (Ablated) the ablation of premotor INs and B-MNs. n = 15 animals for each group. (B, C) Quantification of the Ca2+ oscillation frequency (B) and overall activities (C) in respective genotypes. DA9’s activity exhibits no significant difference after the co-ablation of premotor INs and B-MNs in unc-7(e5; lf) mutant animals. ns, not significant against Control animals by the Mann-Whitney U test. Error bars, SEM. (D) Representative curvature kymograms of wildtype and unc-7 mutant animals, without (Control) and with (Ablated) the ablation of premotor INs and B-MNs. The black arrow denotes anteriorly propagating body bends. (E) Distribution of the instantaneous velocity of animals of respective genotypes, presented by the animal’s mid-point displacement. n = 10 animals per group. ***p<0.001 against the respective, non-ablated Control group by the Kolmogorov-Smirnov test.
Figure 10

A model for a distributed reversal oscillator-driven motor circuit, dually regulated by the descending premotor INs to modulate the reversal motor state.
Multiple A-MNs represent distributed and phase-coordinated intrinsic oscillators to drive backward locomotion. The descending premotor INs AVA exert state-dependent dual regulation - inhibition and activation – on A-MN’s oscillatory activity to determine the initiation and substation of the reversal motor state through a mixed electrical and chemical synapse configuration. Left panel: at rest, A-MN intrinsic activity is inhibited by AVA through UNC-7 innexin-dependent coupling. Center panel: the ablation of premotor INs removes AVA-A coupling, releasing UNC-2 VGCC-dependent A-MN calcium oscillation, and permitting slow backward locomotion. Right panel: upon stimulation, AVA potentiate A-MN’s oscillatory activity, primarily through chemical synapses, with a minor contribution from electrical synapses, permitting sustained reversals.
Author response image 1
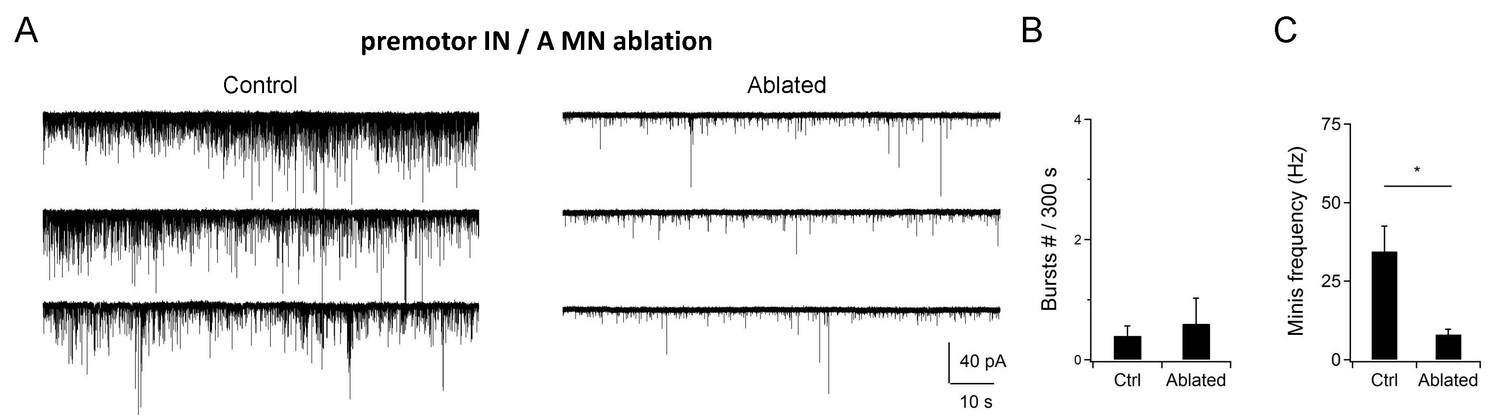
Co-ablation of premotor INs and A-MNs did not increase the rPSC burst.
(A) Example traces of postsynaptic currents (recorded at -60 mV) in animals without (Control) and with (Ablated) premotor IN- and A-MN-ablation.(B, C) Quantification of the PSC burst and minature PSC (mPSC) frequency, without (Ctrl) and with (Ablated) the ablation of premotor INs and A-MNs. PSC events were rare in both preparations, while the mPSC frequency was drastically reduced. n = 10 animals (Control), n = 11 animals (Ablated). * P < 0.05 against Control by the Mann-Whitney U test. Error bars, SEM.
Author response image 2
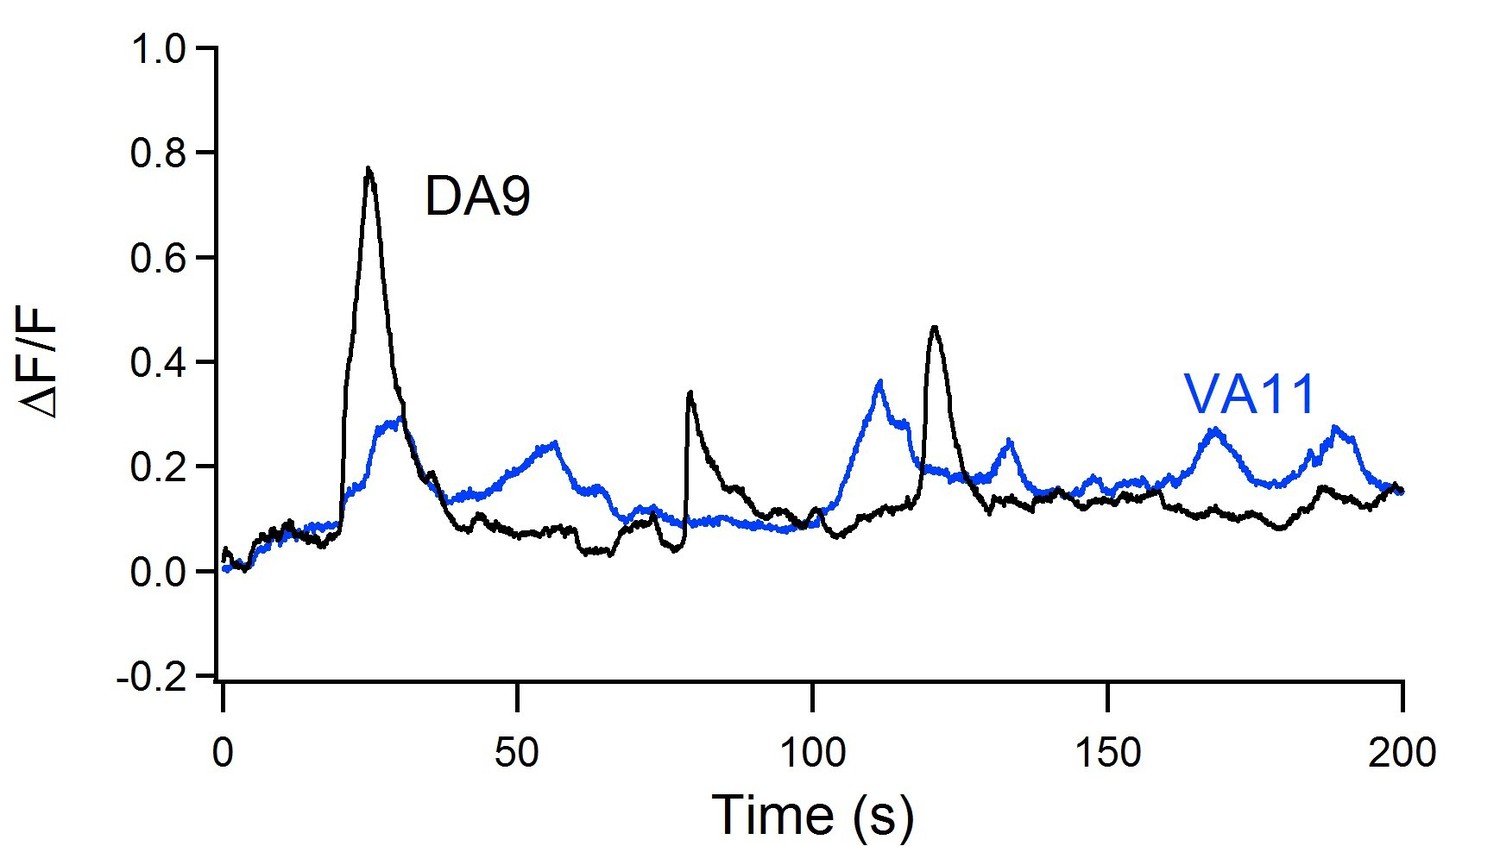
An example trace of simultaneous DA9 and VA11 calcium oscillation in an immobolized animal after the ablation of premotor INs/B-MNs.
https://doi.org/10.7554/eLife.29915.028
Author response image 3
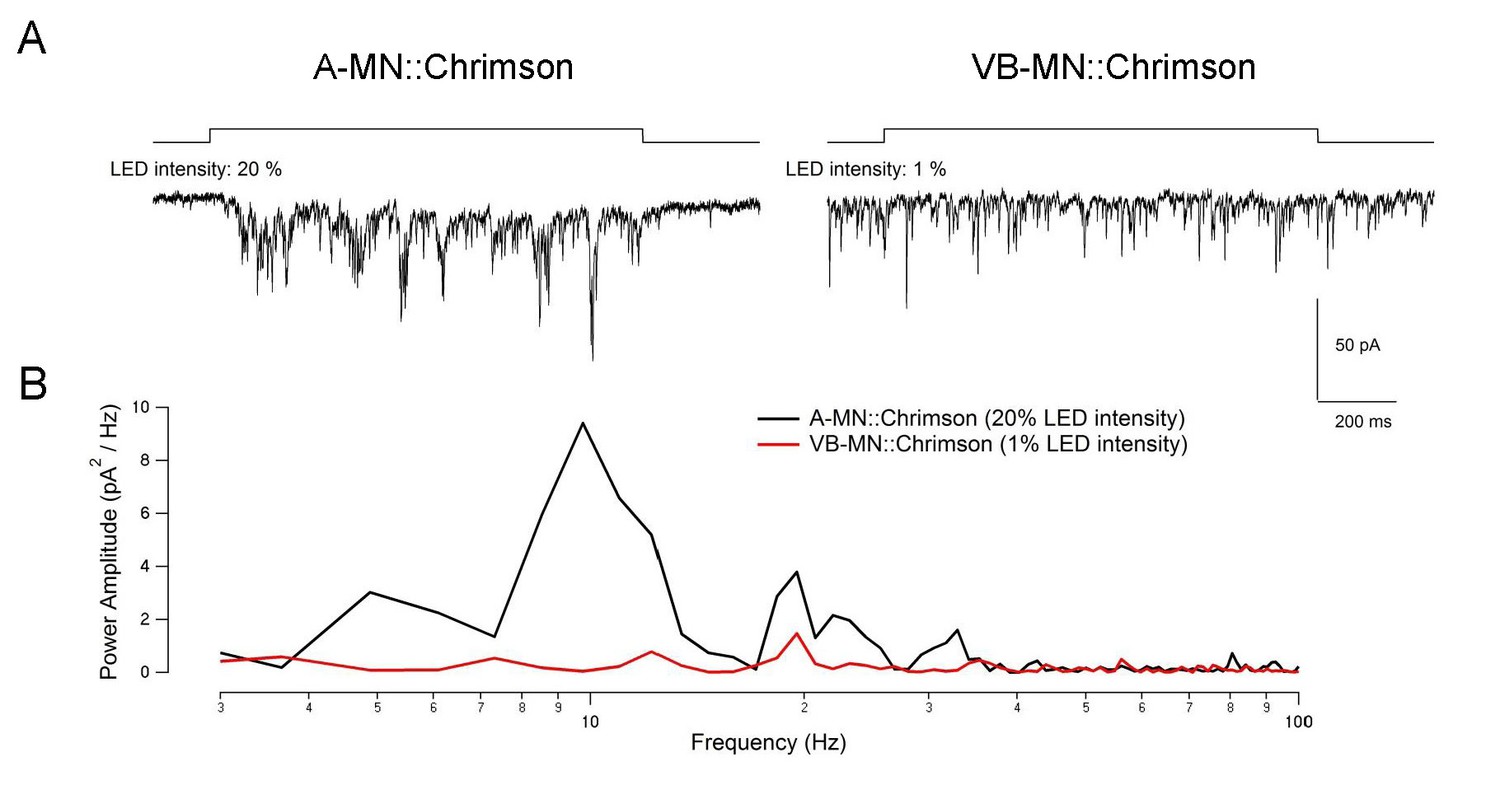
Power spectrum analysis of the current traces in Figure 5—figure supplement 1 A-20% and B-1% revealed no ~10Hz rPSCs burst phase in B-1%.
https://doi.org/10.7554/eLife.29915.029
Author response image 4
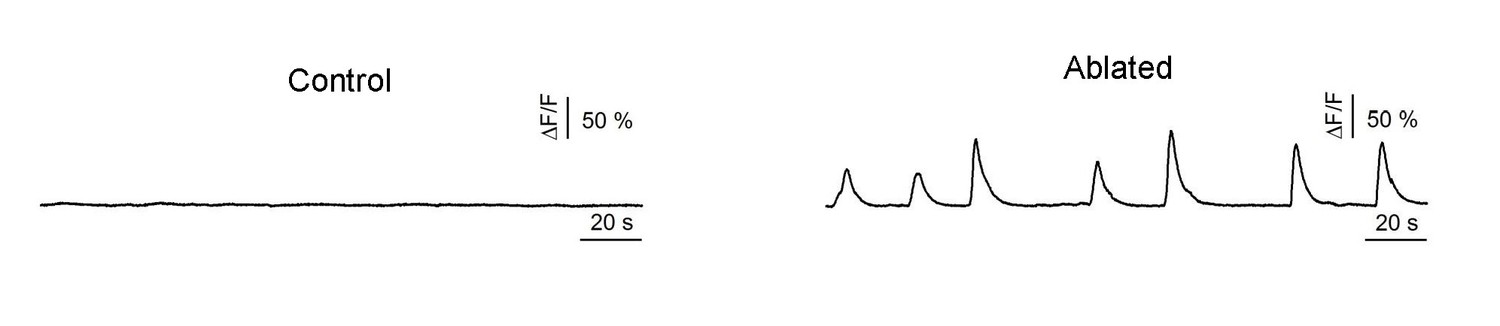
Example traces of DA9 calcium oscillation in a young adult before (Control) and after ablation (Ablated) of premotor INs/B-MNs.
https://doi.org/10.7554/eLife.29915.030Videos
Video 1
Locomotor behaviors (Part 1 and Part 2) and calcium imaging of the body wall muscles (Part 3) of C. elegans without premotor INs.
(Part 1, 2) Upon ablation of all premotor INs, animals exhibit kinked posture and uncoordinated local body bends; head oscillations persist but fail to propagate along the body. (Part 3) Calcium imaging of body wall muscles was carried out in transgenic animals after the ablation of all premotor INs. Calcium activity persists in muscles, and high calcium activity corroborates with body bending. Left panel: RFP signals in body wall muscles (with extra signals in the gut from the miniSOG transgene). Right panel: GCaMP3 signals in body wall muscles.
Video 2
Co-ablation of premotor INs with either A-, B- or D-MNs leads to different locomotor behaviors.
(Parts 1, 2) Upon co-ablation of the premotor INs and B-MNs, animals exhibit sluggish forward locomotion where the body passively follows head oscillation. (Parts 3, 4) Upon the co-ablation of premotor INs and A-MNs, animals exhibit exclusively reversallocomotion, with active body bending, robust rhythmicity, and velocity. Periodically, reversals were interrupted, when, with exaggerated head oscillation, the anterior and posterior body segments are pulled into opposing directions. (Parts 5, 6) Upon the co-ablation of premotor INs and D-MNs, animals exhibit kinker-like postures.
Video 3
Local ablation of some A-MNs does not prevent body bends in other segments.
During reversals, localized ablations of a fraction of the A-MNs lead to defective local bends, but do not abolish bending in other segments. Example movies for the behavioral consequence of ablating anterior, mid-body, and posterior A-MNs are shown.
Video 4
The DA9 soma exhibits robust Ca2+ oscillation upon the co-ablation of all premotor INs and B-MNs.
An example video of Ca2+ oscillation at the DA9 motor neuron in an animal without premotor INs and B-MNs.
Tables
Table 1
Constructs and transgenic arrays generated or acquired for this study.
https://doi.org/10.7554/eLife.29915.023| Purpose | Plasmid | Description | Host strain/ Injection marker | Transgene | Strain |
|---|---|---|---|---|---|
| Neuron Ablation | pJH2843 | Punc-4::tomm20::miniSOG-SL2::RFP (A-MNs/others)* | lin-15/Lin-15 | hpIs366* | ZM7690* |
| hpIs371* | ZM7691* | ||||
| pJH2842 | Pacr-5::tomm20-miniSOG-SL2::RFP (B-MN/others) | lin-15/Lin-15 | hpIs372 | ZM7798 | |
| pJH2844 | Punc-25::tomm20-miniSOG-SL2::RFP (D-MN/others) | lin-15/Lin-15 | hpIs376 | ZM7696 | |
| pJH2827 | Pnmr-1::tomm20-miniSOG-SL2::RFP (AVA/E/D/others) | lin-15/Lin-15 | hpIs321 | ZM7054 | |
| pJH2890 | Plgc55B::tomm20::miniSOG-SL2::RFP (AVB/others) | lin-15/Lin-15 | hpIs331 | ZM7297 | |
| † | Psra-11::tomm20-miniSOG/ Psra-11::RFP (AVB/others) | † | juIs440† | CZ19093 † | |
| pJH3626 | Pacr-2(s)::tomm20-miniSOG-SL2::RFP (A-/B-MN-specific) | lin-15/Lin-15 | hpIs583 | ZM9062 | |
| pJH3458 | Pttr-39::tomm20-miniSOG-SL2::BFP (D-MN-specific) | lin-15/Lin-15 | hpIs590 | ZM9123 | |
| pJH3409/pJH3410 | Pceh-12::tomm20-miniSOG-SL2::BFP/ Punc-129(DB)::tomm20-miniSOG-SL2::BFP (B-MN-specific) | lin-15/Lin-15 | hpIs481 | ZM8607 | |
| pJH3449/pJH3453/pJH3456 | Plgc-55B::tomm20-miniSOG-SL2::BFP/ Pnmr-1::tomm20-miniSOG-SL2::BFP/ Pacr-5::tomm20-miniSOG-SL2::BFP (all premotor IN/B MN/others) | lin-15/Lin-15 | hpIs603 | ZM9176 | |
| Neuron ID | pJH1841 | Pacr-2::RFP | dpy-20/Dpy-20 | qhIs4 | YX146 |
| Optogenetic Stimulation of Neurons | pJH1697 | Pglr-1::ChR2(H134R)::YFP (AVA/AVE/AVD/others) | lin-15/Lin-15 | hpIs166 | ZM4624 |
| pJH2690/pJH2673 | Prig-3::FRT ::ChR2(H134R)::RFP/ Pnmr-1::FLP (AVA-specific) | lin-15/Lin-15 | hpIs270 | ZM6804 | |
| pJH3558 | Punc-4::Chrimson::Cherry (A-MNs/others)* | lin-15/Lin-15 | hpIs569* | ZM8958* | |
| pJH3577 | Pceh-12::Chrimson::Cherry (VB-MNs) | lin-15/Lin-15 | hpIs578 | ZM8983 | |
| UNC-2 Localization | pJH3931/pJH3932 | sgRNA and repair template for GFP insertion at the unc-2 locus | N2 | hp858 | ZM9583 |
| UNC-2 Rescue | pJH3916 | Punc-4::GFP::UNC-2 (WT) | unc-2(e55); hpIs603; hpIs459/ Pmyo-2::RFP | hpEx3856 | ZM9495 |
| pJH3917 | Punc-4::GFP::UNC-2 (L653F; gf) | unc-2(e55); hpIs603; hpIs459/ Pmyo-2::RFP | hpEx3859 | ZM9498 | |
| AVA-specific UNC-7 Rescue | pJH4119/pJH2673 | Prig-3::FRT::UNC-7::GFP/ Pnmr-1::FLP (AVA) | unc-7(e5)/ Pmyo-3::RFP | hpEx3969 | ZM9816 |
| Calcium Imaging | pJH3137 | Punc-4::GCaMP6::RFP* (A-MNs/others) | lin-15/Lin-15 | hpIs459a | ZM8428* |
| hpIs460* | ZM8429* | ||||
| ‡ | Pmyo-3::GCaMP3::RFP (body wall muscles) | ‡ | ljIs131‡ | ZM7982‡ |
-
*In adults, Punc-4 expression is more prominent in VC-MNs than A-MNs. We did not observe rhythmic calcium signals in VCs as in A-MNs (Gao and Zhen, unpublished). Mini-SOG ablation was performed in late L2 larvae; optogenetic stimulation in young L4 larvae, to ensure A-MN-specific ablation and activation.
†Acquired. Information about the construct, transgene and strain was described in Qi, Y. B. et al. Photo-inducible cell ablation in Caenorhabditis elegans using the genetically encoded singlet oxygen generating protein miniSOG. Proc Natl Acad Sci U S A 109, 7499–504 (2012).
-
‡Acquired. Information about the construct, transgene and strain was described in Butler, V. J. et al. A consistent Muscle activation strategy underlies crawling and swimming in Caenorhabditis elegans. J R Soc Interface 12, 20140963 (2015).
Table 2
Additional strains that were generated using the transgenic arrays in Table 1.
https://doi.org/10.7554/eLife.29915.024| Strain | Genotype | Purpose/Notes | Figure/Video |
|---|---|---|---|
| For behavior analyses upon sparse A-MN ablation | |||
| YX167 | hpIs366/qhIs4; qhIs1* | * A transgene irrelevant to this study | Figure 3; Video 3 |
| YX148 | qhIs4; qhIs1* | * A transgene irrelevant to this study | Figure 3; Video 3 |
| For behavior and electrophysiology analyses upon neuron ablation | |||
| ZM7971 | hpIs321; hpIs331 | All premotor IN ablation | Figure 1; Video 1 |
| ZM9133 | hpIs583 hpIs589 | A-/B-/D-MN ablation | Figure 1 |
| ZM8415 | hpIs321; juIs440 | All premotor IN ablation | Figure 1—figure supplement 1 |
| ZM7862 | hpIs321; hpIs331; hpIs372 | All premotor IN/B-MN ablation | Figure 2; Video 2; Figure 4 |
| ZM7870 | hpIs321; hpIs331; hpIs371 | All premotor IN/A-MN ablation | Figure 2; Video 2 |
| ZM7921 | hpIs321; hpIs331; hpIs376 | All premotor IN/D-MN ablation | Figure 2; Video 2 |
| ZM8668 | unc-2(e55; lf); hpIs321; hpIs331; hpIs372 | All premotor IN/B-MN ablation | Figure 8 |
| ZM9022 | unc-2(hp647; gf); hpIs321; hpIs331; hpIs372 | All premotor IN/B-MN ablation | Figure 8 |
| ZM9999 | unc-7(e5); hpIs603 | All premotor IN/B-MN ablation | Figure 9—figure supplement 1 |
| For Ca22+imaging and/or behavior analyses | |||
| ZM7465 | hpIs321; hpIs331; ljIs131 | Muscle Ca2+ imaging, upon all premotor IN ablation | Video 1 |
| ZM9228 | hpIs603; hpIs459 | A-MN Ca2+ imaging, upon all premotor IN/B-MN ablation | Figures 4 and 5; Video 4 |
| ZM9229 | unc-2(e55; lf); hpIs603; hpIs459 | A-MN Ca2+ imaging and behavior, upon all premotor IN/B-MN ablation | Figure 7 |
| ZM9495 | unc-2(e55; lf); hpIs603; hpIs459; hpEx3856 | A-MN Ca2+ imaging, UNC-2 (WT) rescue in A-MN | Figure 7—figure supplement 2 |
| ZM9498 | unc-2(e55; lf); hpIs603; hpIs459; hpEx3859 | A-MN Ca2+ imaging, UNC-2 (GF) rescue in A-MN | Figure 7—figure supplement 2 |
| ZM9231 | unc-2(hp647; gf); hpIs603; hpIs459 | Same as above | Figure 7 |
| ZM9557 | unc-13(s69; lf); hpIs603; hpIs459 | Same as above | Figure 7 |
| ZM8654 | unc-7(e5; lf); hpIs460 | Same as above | Figure 9 |
| ZM9885 | unc-7(e5; lf); hpIs460; hpEx3966 | Same as above | Figure 9 |
| ZM9657 | unc-7(e5; lf); hpIs603; hpIs460 | Same as above | Figure 9—figure supplement 1 |
| For optogenetic stimulation and electrophysiology analyses | |||
| ZM7920 | hpIs321; hpIs270 | AVA ChR2 stimulation, upon AVA/AVE/AVD/others ablation | Figure 6 |
| ZM7861 | hpIs331; hpIs270 | AVA ChR2 stimulation, upon AVB/others ablation | Figure 6 |
| ZM8408 | hpIs371; hpIs270 | AVA ChR2 stimulation, upon A-MN/others ablation | Figure 6 |
| ZM9093 | hpIs481; hpIs166 | AVA/others ChR2 stimulation, upon B-MN/others ablation | Figure 6 |
| ZM7615 | unc-2(e55; lf); hpIs166 | AVA/others ChR2 stimulation | Figure 7—figure supplement 1 |
| ZM6646 | unc-2(ra612; lf); hpIs166 | AVA/others ChR2 stimulation | Figure 7—figure supplement 1 |
| ZM7608 | unc-36(e251; lf); hpIs166 | AVA/others ChR2 stimulation | Figure 7—figure supplement 1 |
| ZM7780 | calf-1(ky867; lf); hpIs166 | AVA/others ChR2 stimulation | Figure 7—figure supplement 1 |
| ZM6646 | unc-79(e1068; lf); hpIs166 | AVA/others ChR2 stimulation | Figure 7—figure supplement 1 |
| ZM7533 | unc-80(e1069; lf); hpIs166 | AVA/others ChR2 stimulation | Figure 7—figure supplement 1 |
| ZM7509 | elg-19(n582; lf); hpIs166 | AVA/others ChR2 stimulation | Figure 7—figure supplement 1 |
| ZM6639 | unc-13(e1091; lf); hpIs166 | AVA/others ChR2 stimulation | Figure 9 |
| ZM4728 | unc-7(e5; lf); hpIs166 | AVA/others ChR2 stimulation | Figure 9 |
Additional files
-
Transparent reporting form
- https://doi.org/10.7554/eLife.29915.025
Download links
A two-part list of links to download the article, or parts of the article, in various formats.
Downloads (link to download the article as PDF)
Open citations (links to open the citations from this article in various online reference manager services)
Cite this article (links to download the citations from this article in formats compatible with various reference manager tools)
Excitatory motor neurons are local oscillators for backward locomotion
eLife 7:e29915.
https://doi.org/10.7554/eLife.29915


