Msn2/4 regulate expression of glycolytic enzymes and control transition from quiescence to growth
- NYU Langone Medical Center, United States
- Johns Hopkins University School of Public Health, United States
Figures
Figure 1 with 1 supplement
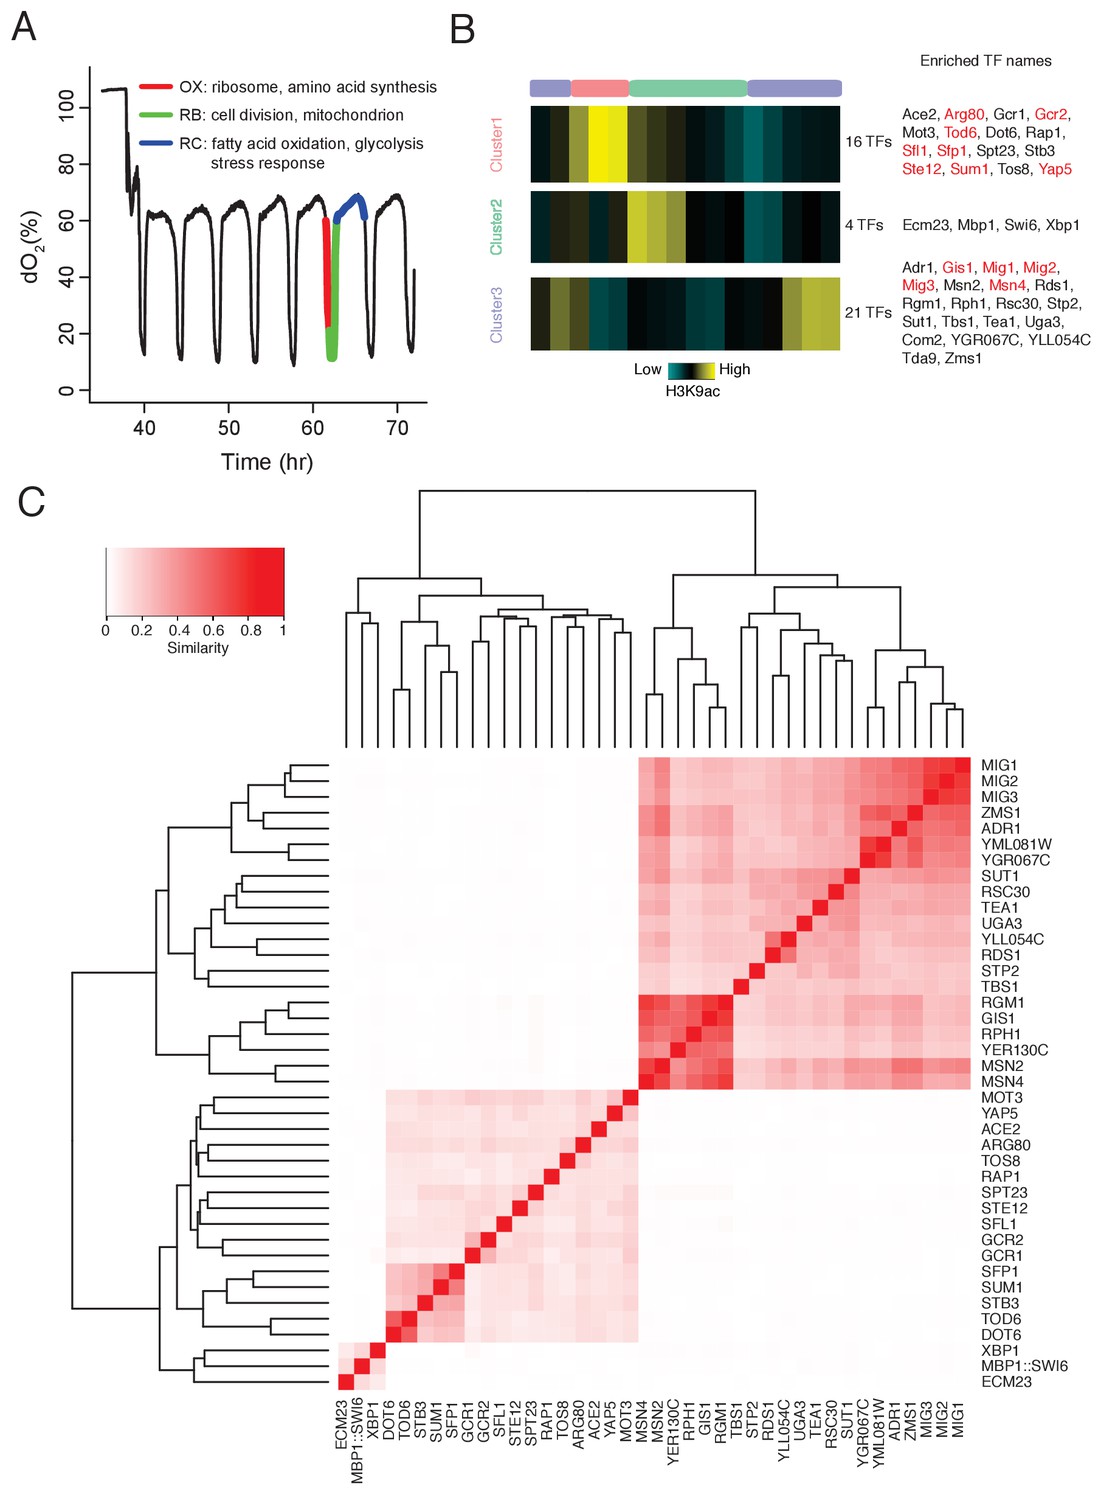
DynaMO analysis in YMC identifies key TFs driving YMC.
(A) Respiratory oscillations (dissolved O2 concentration) of prototrophic yeast strain under continuous nutrient limited condition with a period of 4 ~ 5 hr. Three transcriptional and metabolic different phases are defined: oxidative (OX), reductive/building (RB) and reductive/charging (RC), which are marked by red, green and blue curves. The color scheme is used for labeling the three phases throughout the paper. (B) Clustering of predicted motif sites based on temporal H3K9ac signals. TFs with their motif sites enriched in clusters are listed to the right of the heat map. TFs expression which is correlated with corresponding clusters are marked in red. Similar data are presented for completeness in the companion paper by Kuang et al. (2017) Figure 2A. (C) Similarity of predicted targets of predicted important TFs. Similarity is defined by the ratio of common targets to total targets of two TFs.
-
Figure 1—source data 1
Similarity scores of predicted targets of predicted important TFs.
- https://doi.org/10.7554/eLife.29938.004
-
Figure 1—source data 2
GO analysis for predicted targets of each predicted important TFs.
- https://doi.org/10.7554/eLife.29938.005
Figure 1—figure supplement 1
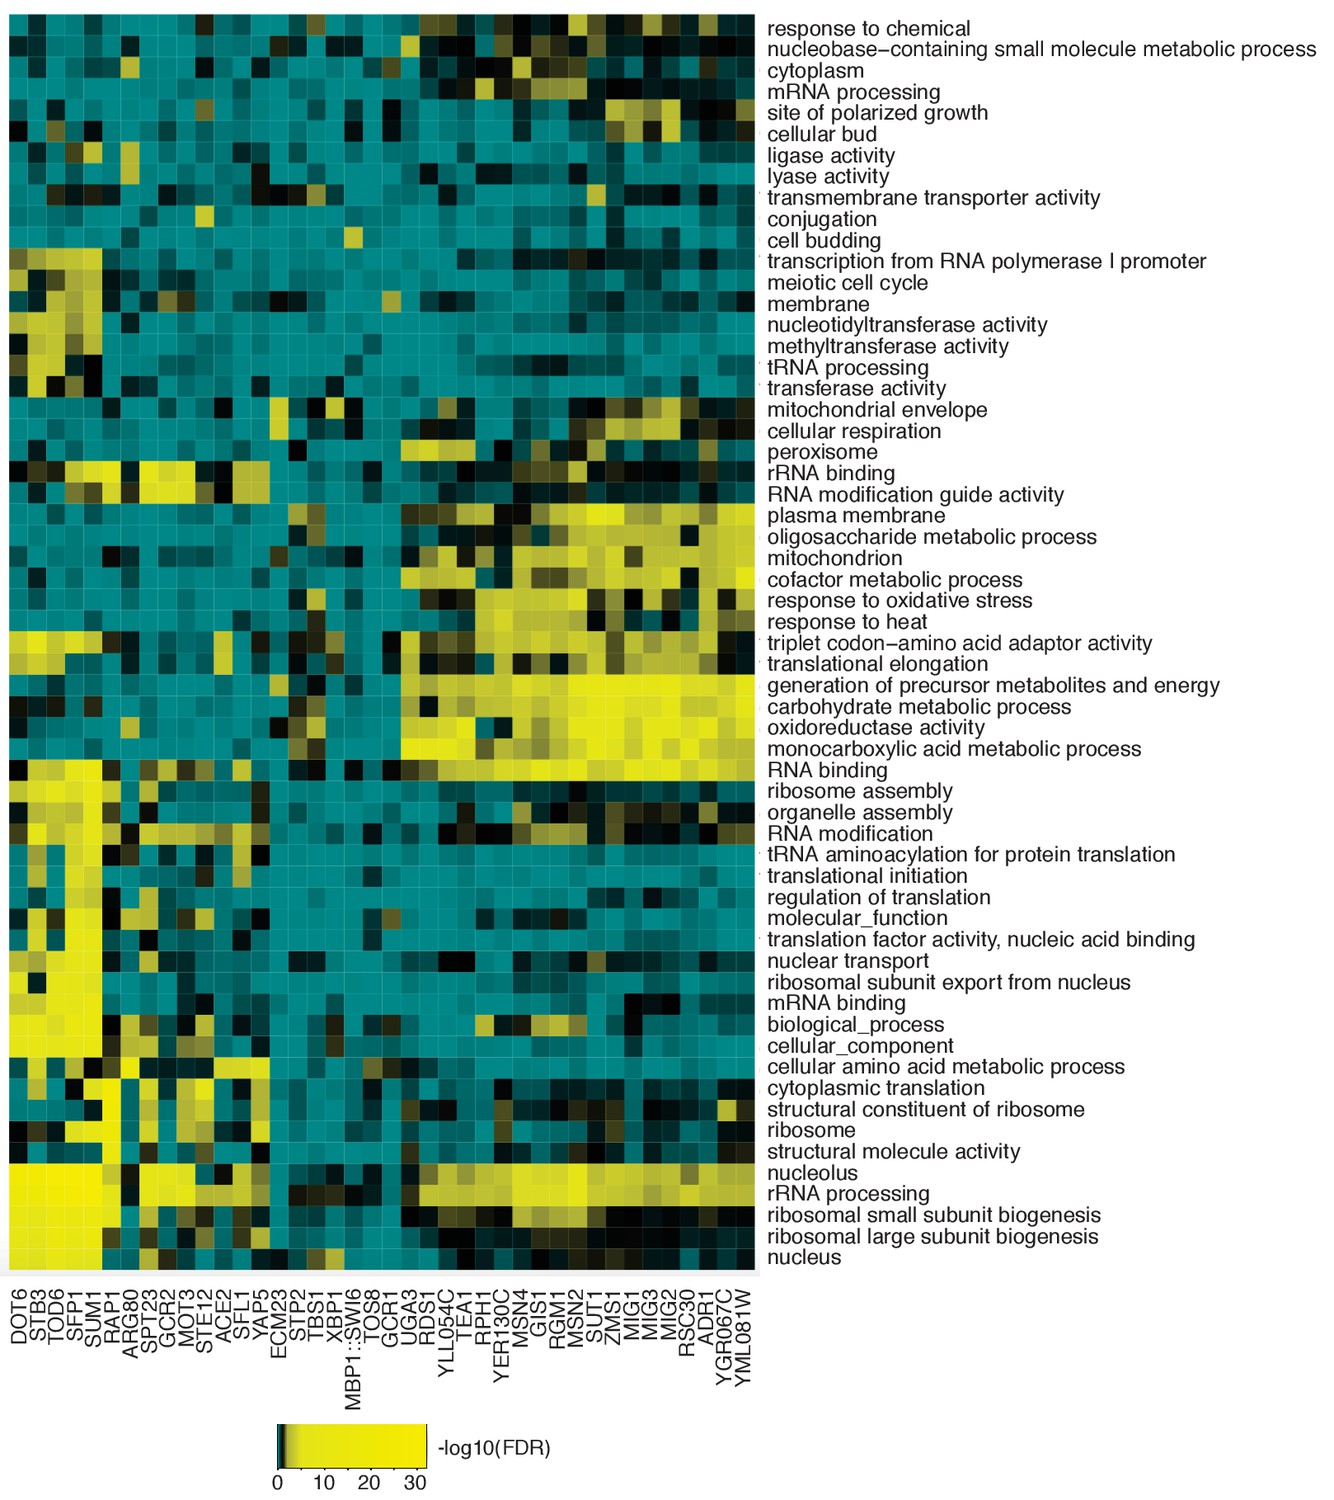
Hierarchical clustering of enriched GO terms based on Fisher Exact test derived FDRs for predicted targets of each predicted important TFs shown in Figure 1B.
TFs with similar enriched GO terms are also clustered in close proximity.
Figure 2 with 1 supplement

Msn2 and Msn4 regulate the length of RC/quiescence phase.
(A) Oscillation defects in msn2Δ, msn4Δ and msn2Δmsn4Δ mutants. Similar data are presented for completeness in the companion paper by Kuang et al. (2017) Figure 2C. (B) Dynamics of MSN2 and MSN4 transcripts in YMC. (C) A snapshot of Msn2 and Msn4 binding across the six time points in YMC. Tracks represent ChIP-seq signals at consecutive time points. Note the consistency of pattern during the RC phase. (D) Temporal patterns of Msn2/4 binding centered at each binding site and flanked by 1000 bp. (E) Venn graphs showing substantial overlaps between Msn2 and Msn4 peaks and target genes. (F) Enriched GO terms of Msn2 and Msn4 target genes. Red are terms of OX phase genes and blue are terms of RC phase genes. RB phase genes did not have statistically significant GO Term enrichment.
-
Figure 2—source data 1
Binding sites of Msn2.
- https://doi.org/10.7554/eLife.29938.008
-
Figure 2—source data 2
Binding sites of Msn4.
- https://doi.org/10.7554/eLife.29938.009
Figure 2—figure supplement 1
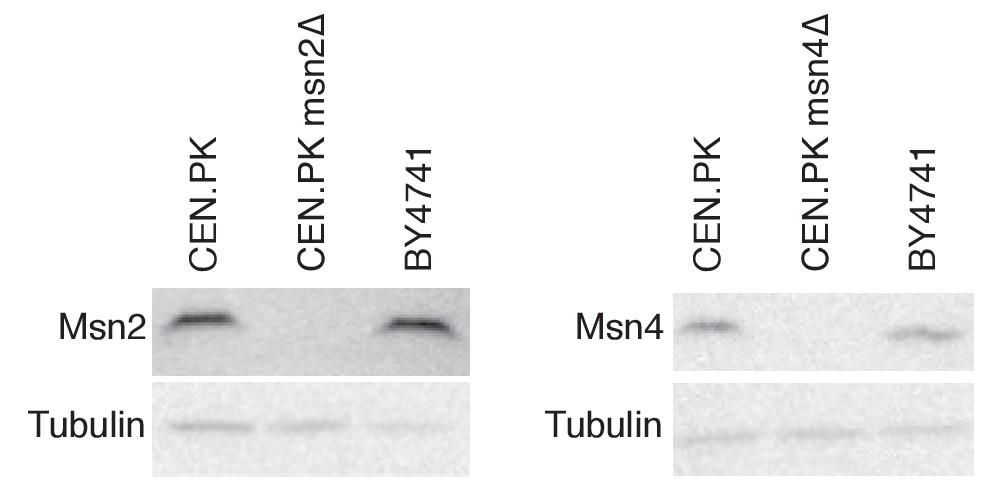
Western blots of WT, msn2Δ and msn4Δ lysates against Msn2 and Msn4 antibodies.
https://doi.org/10.7554/eLife.29938.007
Figure 3 with 3 supplements

Msn2 and Msn4 regulate accumulation of acetyl-CoA through glycolysis.
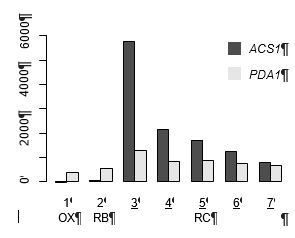
(A) Acetate addition immediately induces OX phase. The graph shows the dO2 oscillation of msn2Δ and the arrows mark the time when acetate was added. (B) Seven time points of WT cells and eleven time points of msn2Δmsn4Δ mutant cells were collected for examination of acetyl-CoA level and gene expression level. The first seven time points of mutant cells have the same absolute time intervals as the seven time points of WT cells. The remaining four time points of mutant cells represent the relative positions in the RC phase of WT cells. (C) shows the relative acetyl-CoA levels in one cycle of WT or msn2Δmsn4Δ cells. (D) shows the glycolysis pathway and genes encoding the enzymes at each step. Red genes are predicted to be bound by Msn2/4 using DynaMO and subsequently validated by ChIP-seq. Orange genes are not predicted but actually bound by Msn2/4. Black genes are neither predicted nor validated to be bound by Msn2/4. (E) shows the RT-PCR results of representative glycolytic genes in one cycle of WT or msn2Δmsn4Δ cells.
Figure 3—figure supplement 1
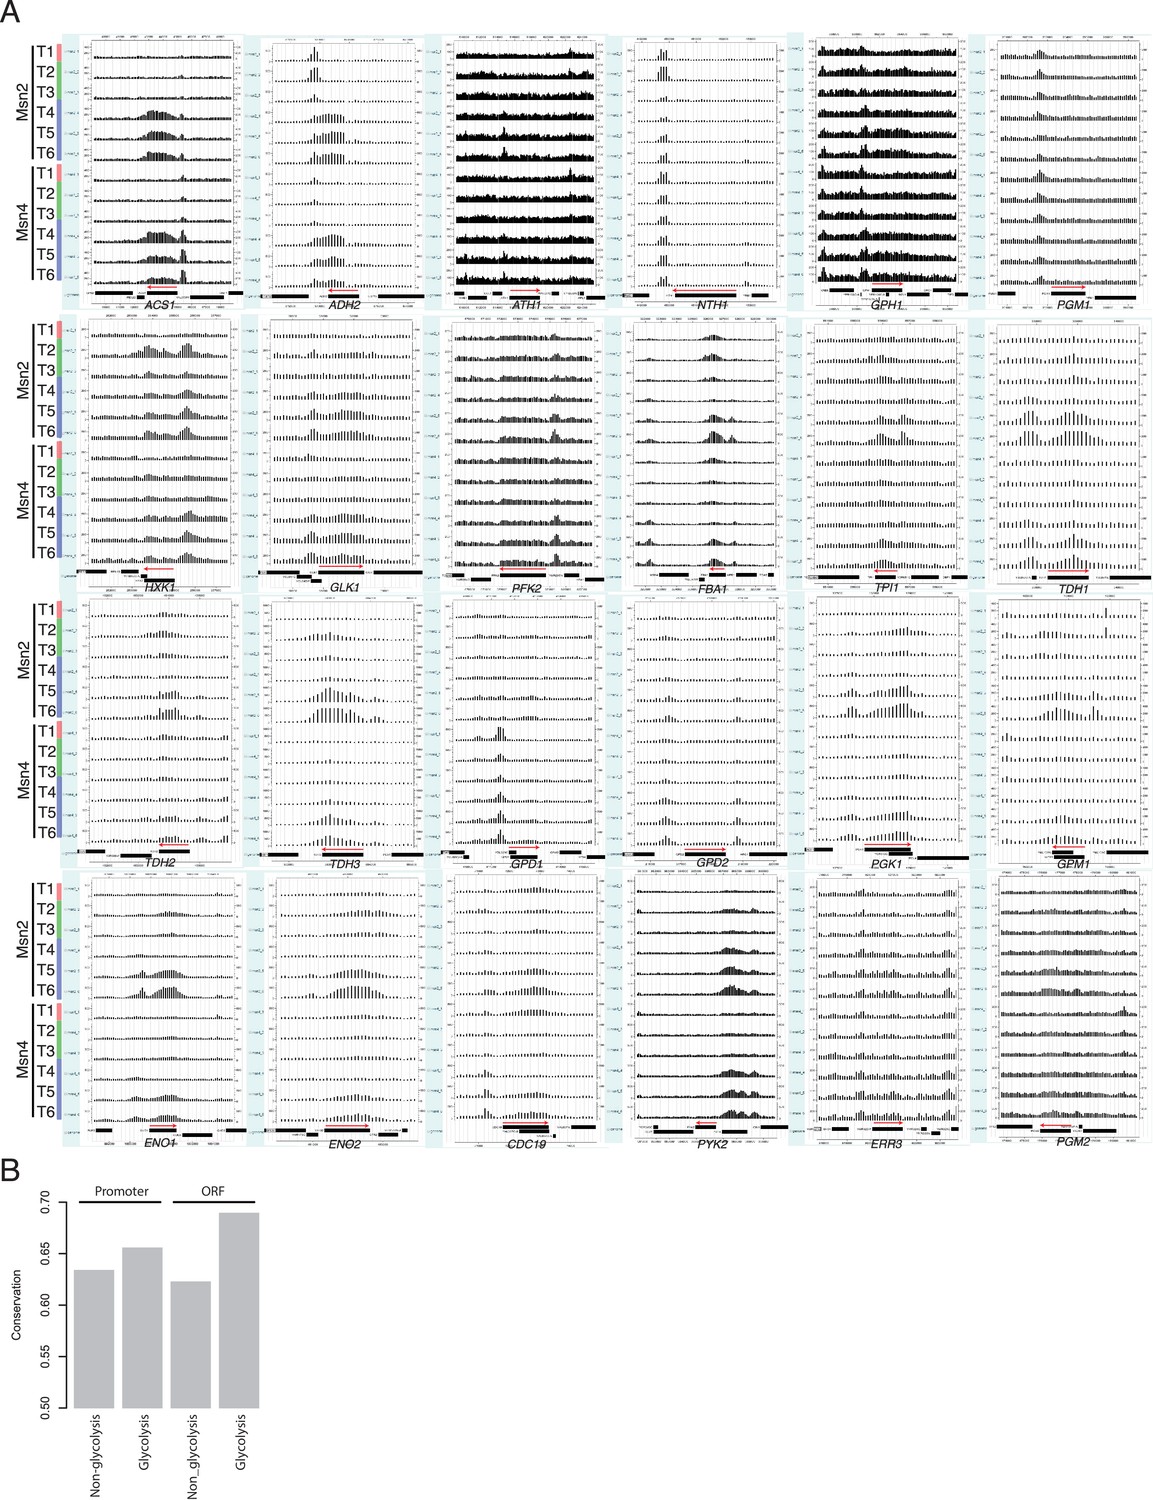
Msn2/4 binding signals at glycolytic genes.
(A) CisGenome views of Msn2 and Msn4 binding at glycolytic genes. (B) Conservation scores for coding regions (ORF) and promoter regions of glycolytic and non-glycolytic genes in Saccharomyces strains.
Figure 3—figure supplement 2
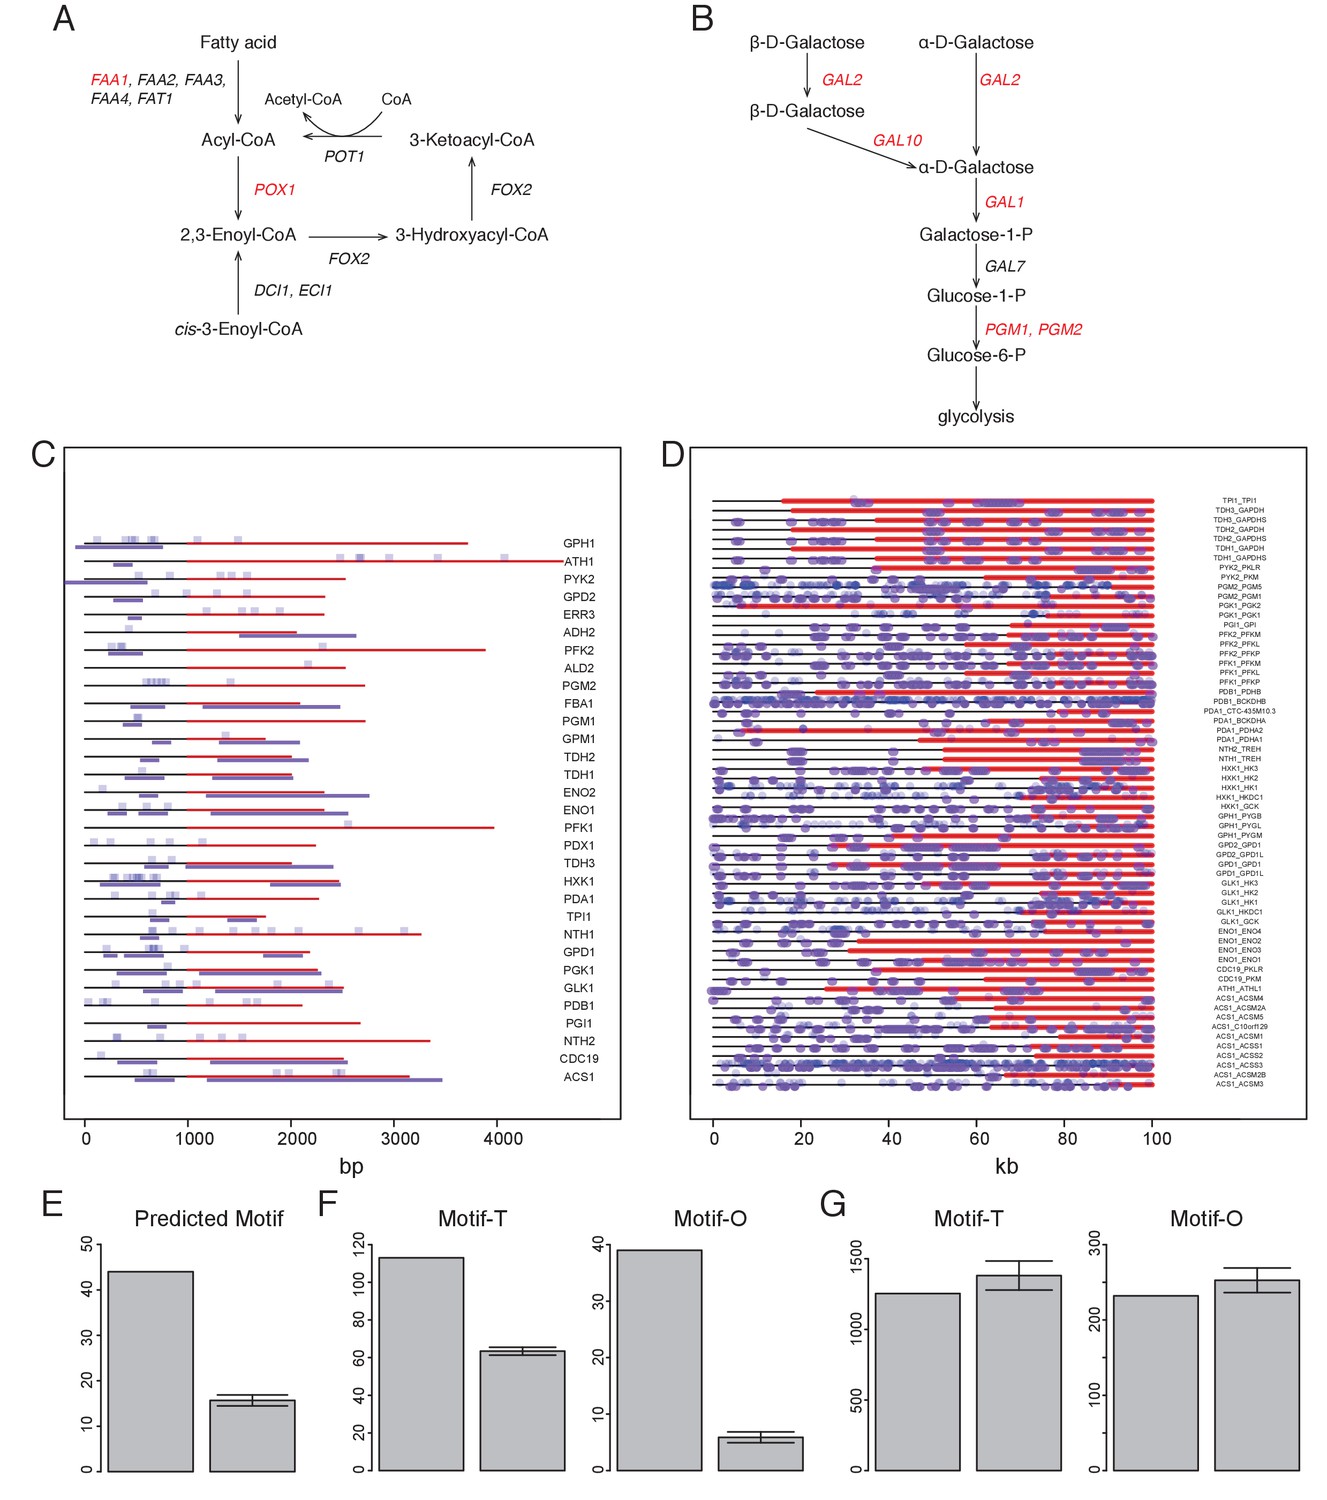
Combinatorial analysis of Msn2 and Msn4 motifs and ChIP-seq in YMC.
(A–B) show the fatty acid oxidation pathway (A) or the galactose metabolic pathway (B) and genes encoding the enzymes at each step. Red genes are bound by Msn2 and Msn4 from Msn2/4 ChIP-seq data. Black genes are not bound by Msn2/4 from the ChIP-seq data. (C) Spatial distribution of Msn2/4 motif sites and ChIP-seq peaks at yeast glycolytic genes. Coding regions are marked by red and upstream 1000 bp regions are marked by black. Blue dots represent Msn2/4 motif sites and purple lines represent Msn2/4 peaks. (D) Spatial distribution of Msn2/4 motif sites and DNase at human homologs of the yeast glycolytic genes shown in (C). Annotated longest transcript regions and 20 kb upstream regions are scaled to 100%, as shown in the x axis. Blue dots represent Msn2/4 motif sites and purple lines represent DNase hypersensitive regions. (E) Number of predicted Msn2/4 motif sites by DynaMO at glycolytic genes (left) and random sets of genes (right). Motif sites within the regions from −1000 bp to the stop codon of query genes were counted. A same size of random genes from the genome were generated 100 times and the mean and 95% confidence intervals were plotted as the right bar and in (F) and (G). (F) Numbers of total Msn2/4 motif sites at glycolytic genes (left) and random sets of genes (right) are plotted in the left graph and numbers of Msn2/4 motif sites overlapping Msn2/4 ChIP-seq peaks are plotted in the right graph. (G) Numbers of total Msn2/4 motif sites at human homologs of yeast glycolytic genes (left) and random sets of genes (right) are plotted in the left graph and numbers of Msn2/4 motif sites overlapping DNase hypersensitive regions are plotted in the right graph. Motif sites within the regions from −20000 bp to transcription end sites of query genes were counted.
Figure 3—figure supplement 3
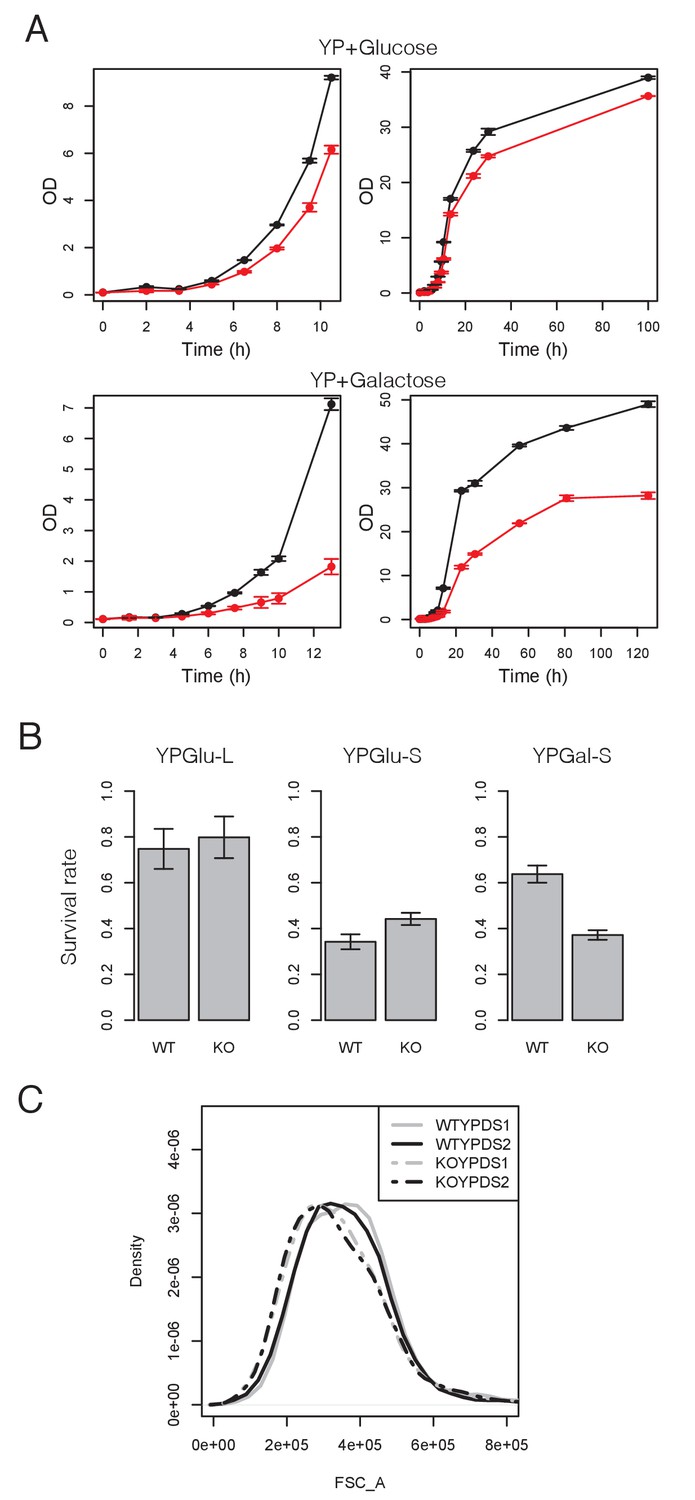
Msn2/4 regulate the transition from quiescence to growth in batch culture.
(A) Growth curves of 3 replicates of WT (black) and msn2Δmsn4Δ (red) after inoculating 6 day stationary cells in YP +glucose or galactoce fresh medium at OD 0.1. Error bars represent standard error of the mean (SEM). (B) Survival rates of 3 replicates of WT and msn2Δmsn4Δ strains in log and stationary phase of YP +glucose medium and stationary phase of YP +galactose medium. Error bars represent SEM. (C) Size distribution of stationary WT and msn2Δmsn4Δ cells in YP +glucose medium measured by flow cytometer.
Figure 4 with 1 supplement
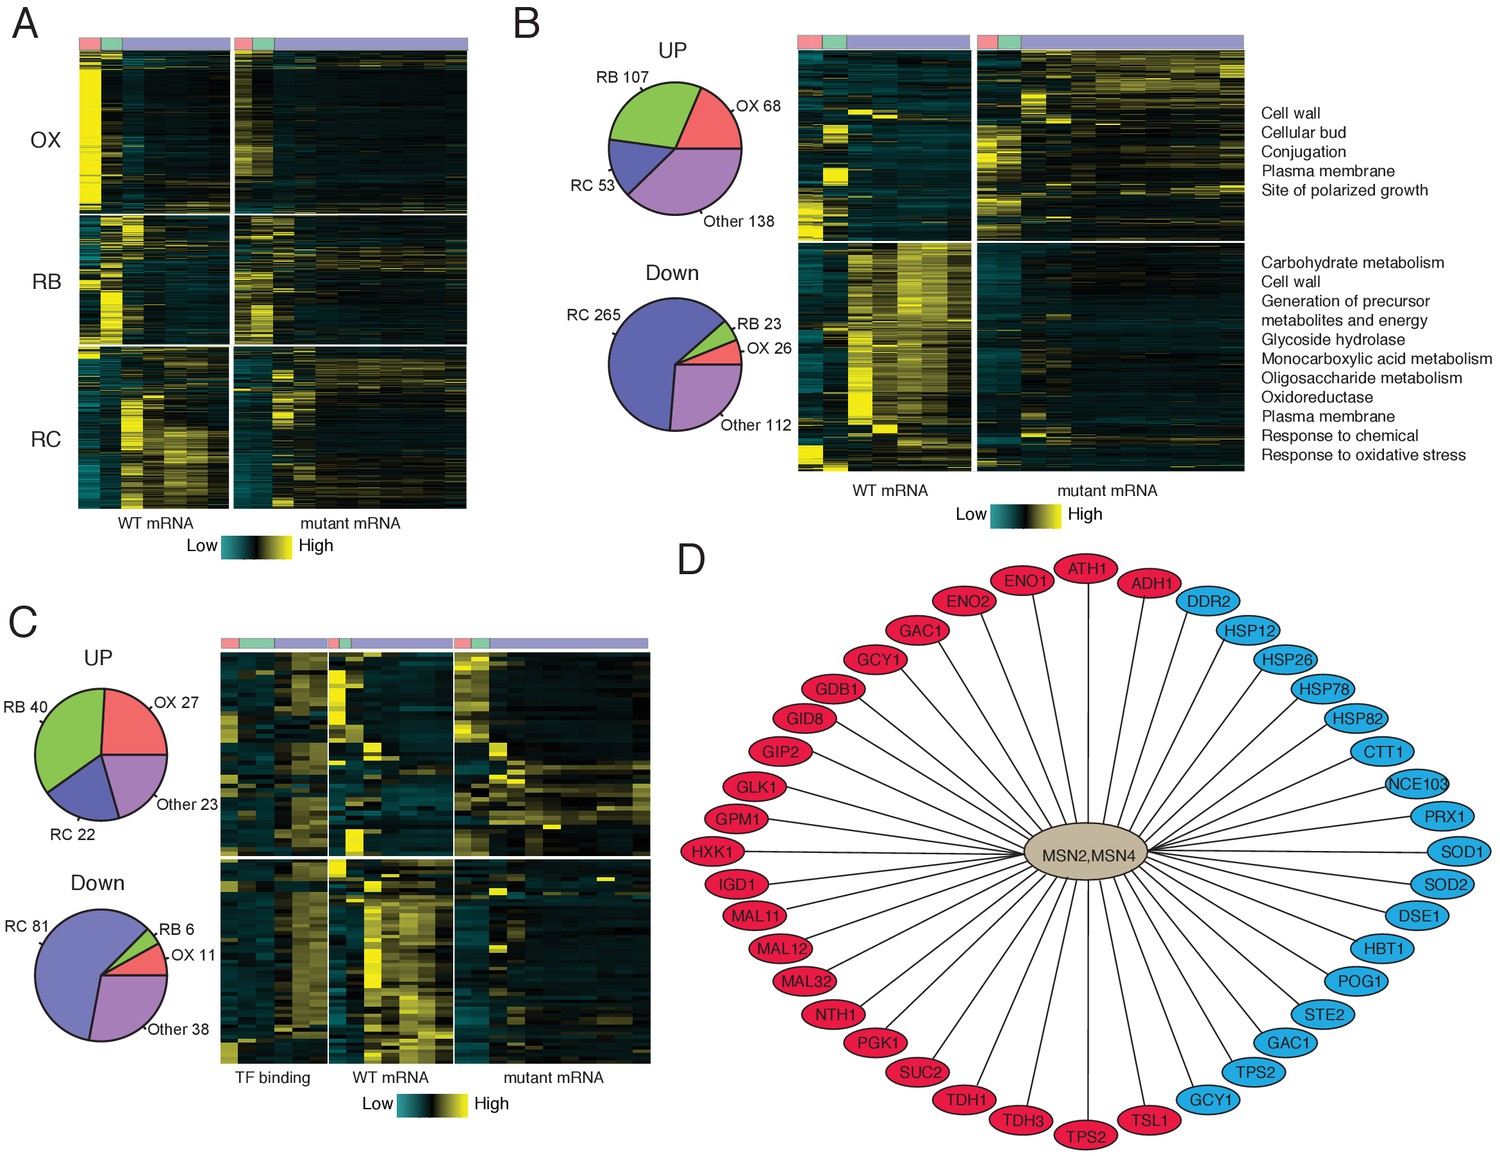
Analysis of Msn2/4 targets by RNA-seq and ChIP-seq.
(A) A heat-map shows temporal expression patterns of all OX, RB and RC phase genes in WT and msn2Δmsn4Δ cycling cells. More samples were taken of the mutant cells due to their elongated YMC. (B) A heatmap shows temporal expression patterns of differential expressed genes between WT and msn2Δmsn4Δ cycling cells. Pie charts show the numbers of up- or down- regulated genes in OX, RB, RC and non-cycling (other) genes. (C) Temporal expression patterns and Msn2/4 binding patterns of ‘core’ Msn2/4 target genes. ‘Core’ targets were genes bound by Msn2/4 and expressed differentially in msn2Δmsn4Δ cells. Pie charts show the numbers of core targets in OX, RB, RC and non-cycling (other) genes. (D) Representative ‘core’ Msn2/4 target genes. Genes in red ovals are carbohydrate metabolism genes and those in blue ovals are genes encoding stress responses.
-
Figure 4—source data 1
FPKMs for seven time point WT and eleven time point msn2Δmsn4Δ double mutant across YMC.
- https://doi.org/10.7554/eLife.29938.016
-
Figure 4—source data 2
Msn2/4 targets characterized by Msn2/4 binding and expression levels of target genes in the msn2Δmsn4Δ mutant.
- https://doi.org/10.7554/eLife.29938.017
-
Figure 4—source data 3
Stress related and mitochondrion related genes in YMC.
- https://doi.org/10.7554/eLife.29938.018
Figure 4—figure supplement 1
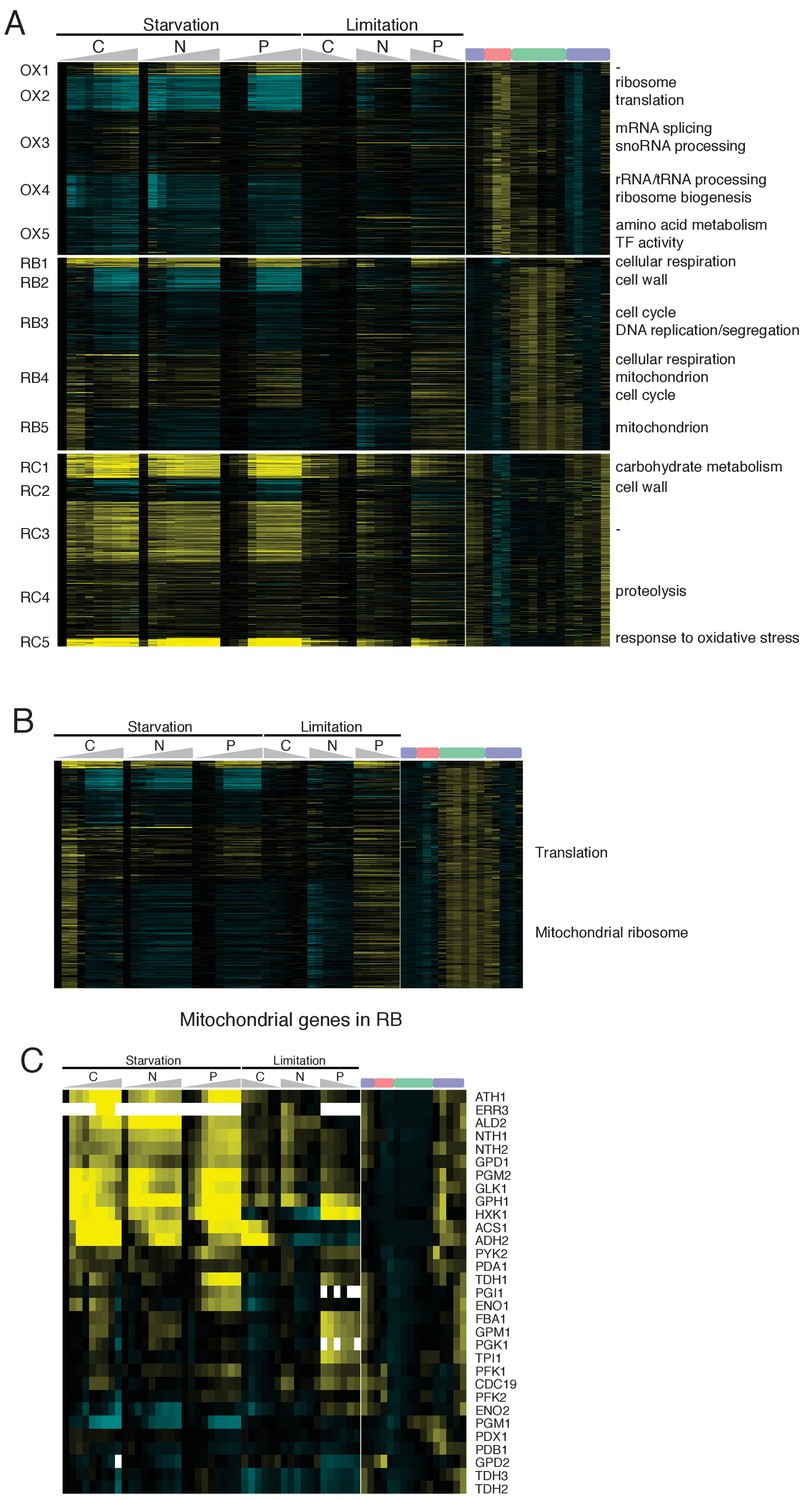
Comparison of RC phase cells with nutrient limitation or starvation quiescence cells.
(A) Heatmap shows combinatorial gene expression patterns of cycling genes in YMC and glucose (C), nitrogen (N), and phosphate (P) starvation and limitation. Five subclusters were defined within OX, RB and RC phase genes and enriched GO terms were listed on the right side of the heatmap. (B) Combinatorial gene expression patterns of RB/Mitochondrial genes in YMC and nutrient starvation/limitation. (C) Combinatorial gene expression patterns of glycolytic genes in YMC and nutrient starvation/limitation.
Author response image 1
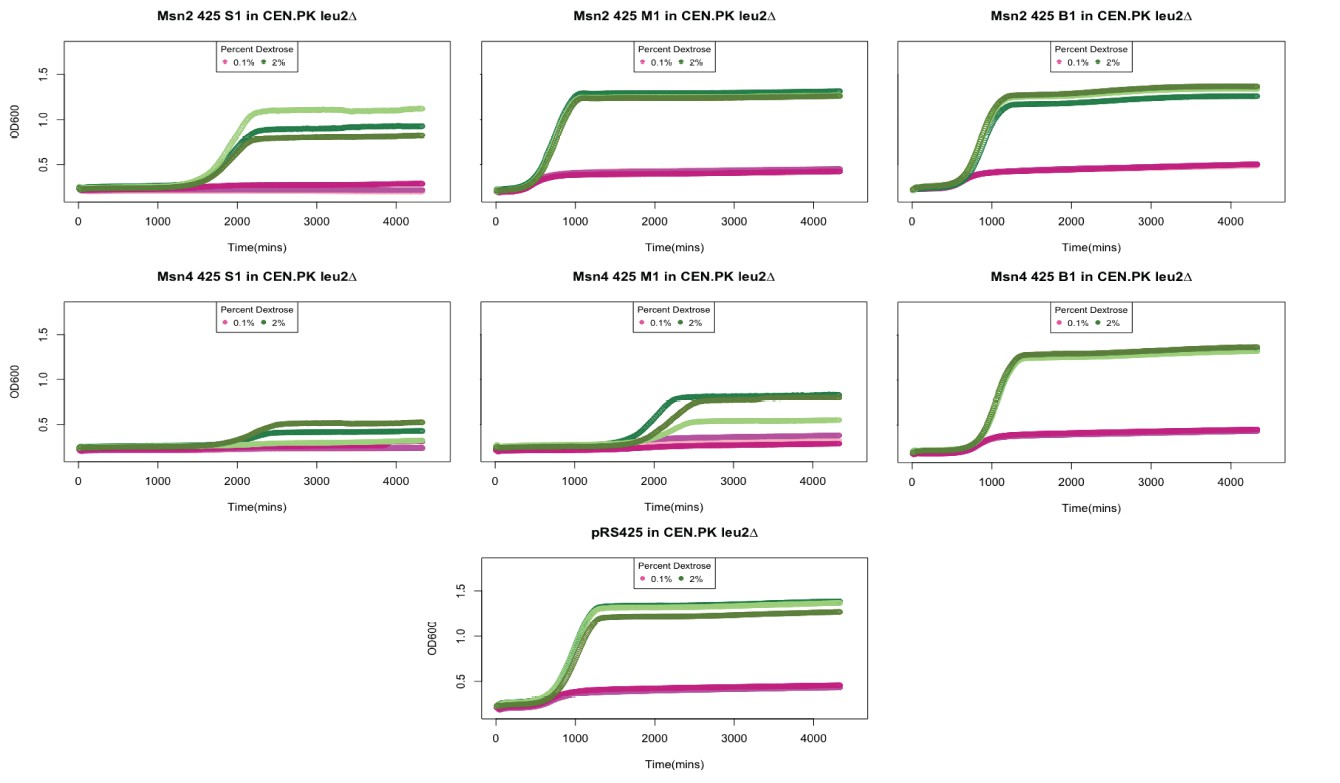
Growth curves of strains overexpressing Msn2 and Msn4.
Msn2 and Msn4 were cloned onto a 2 micron plasmid and transferred into a leu2Δ CEN.PK strain. We observed variability in colony sizes. Shown here are technical replicated of growth curves from a small (S). medium (M) and big (B) colony overexpressing Msn2 and Msn4. 6 day old stationary cultures were diluted back into YP media containing 0.1% (shown in oink) or 2% Dextrose (shown in green) and OD600 was measured over 72 hours. pRS425 is the empty vector control.
Author response image 2
Additional files
-
Transparent reporting form
- https://doi.org/10.7554/eLife.29938.020
Download links
A two-part list of links to download the article, or parts of the article, in various formats.
Downloads (link to download the article as PDF)
Open citations (links to open the citations from this article in various online reference manager services)
Cite this article (links to download the citations from this article in formats compatible with various reference manager tools)
Msn2/4 regulate expression of glycolytic enzymes and control transition from quiescence to growth
eLife 6:e29938.
https://doi.org/10.7554/eLife.29938


