aPKC-mediated displacement and actomyosin-mediated retention polarize Miranda in Drosophila neuroblasts
- University of Dundee, United Kingdom
Figures
Figure 1 with 3 supplements
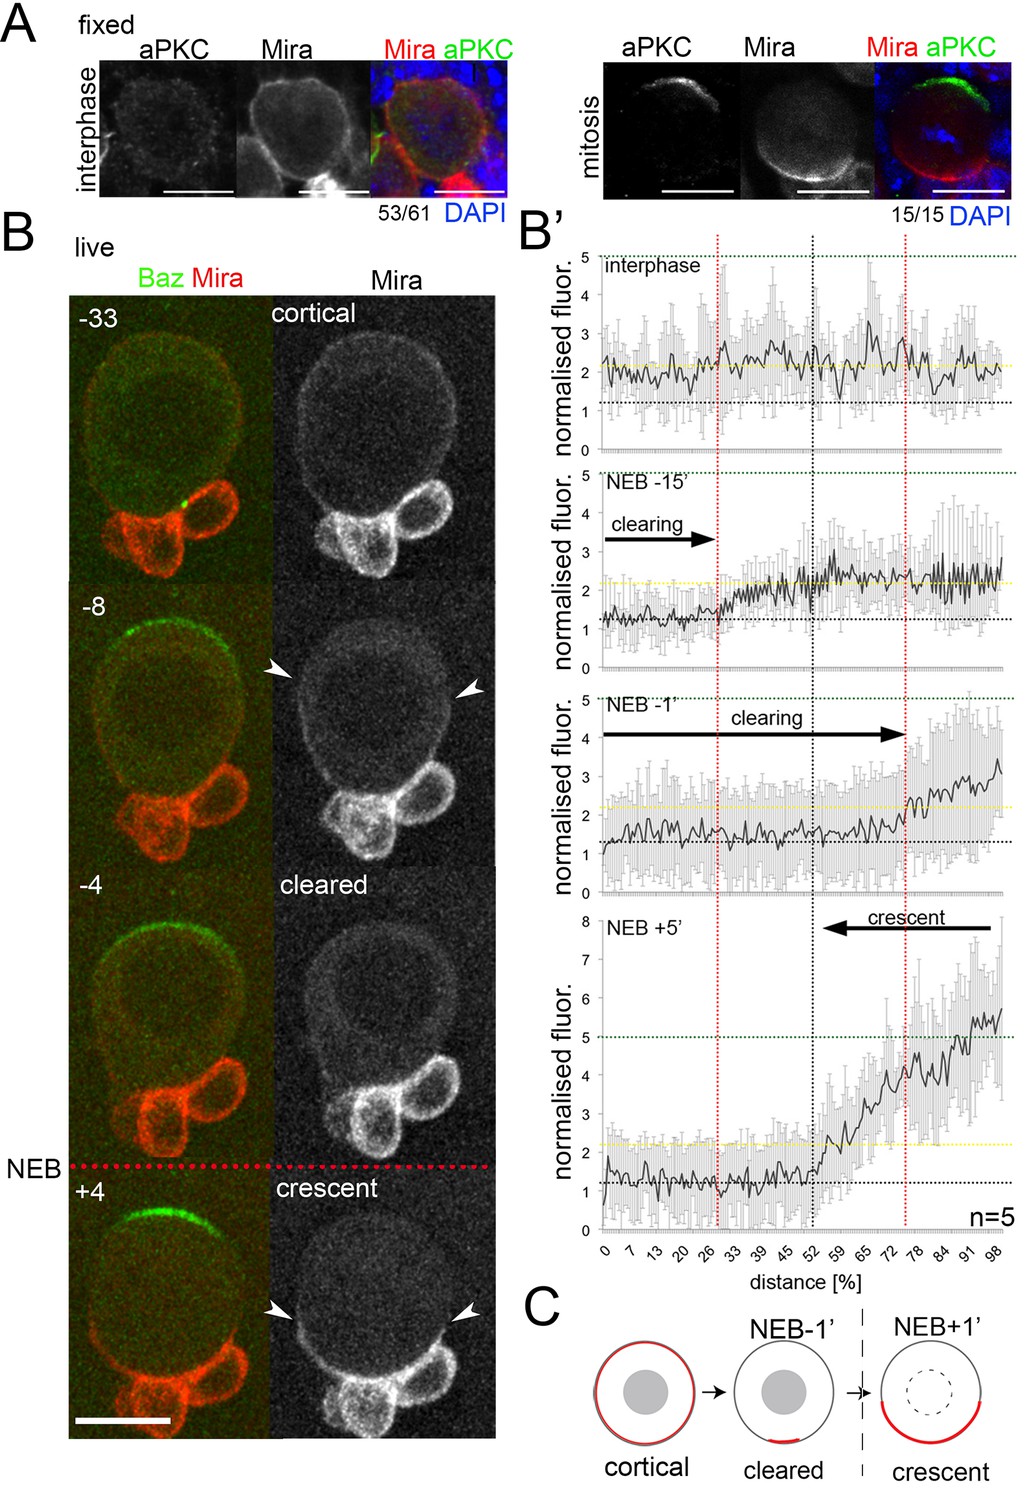
Miranda is cleared from the cortex before localizing in a basal crescent in mitosis.
(A) Larval brain NBs fixed and stained as labeled at the indicated cell cycle stage. (B) Selected frames from Video 1. NB in primary cell culture expressing Baz::GFP (green) and Mira::mCherry (red) in the transition from interphase to mitosis. Arrowheads point at Mira being cleared (−8) and at basal Mira crescent (+4). (B’) Quantification of cortical Mira::mCherry signal plotting the fluorescence intensities from the apical to the basal pole computationally straightening (Kocsis et al., 1991) the cortices of five NBs against the distance in percent. Fluorescence was background subtracted and normalized to background subtracted cytoplasmic signal (1, dotted line). Cortical signal (yellow dotted line) and signal after NEB (green dotted line). Error bars, standard deviation. (C) Schematic of Mira localization. BAC{mira::mcherry-MS2} was the source of Mira::mCherry. Scale bar 10 µm. Time stamp: minutes.
Figure 1—figure supplement 1
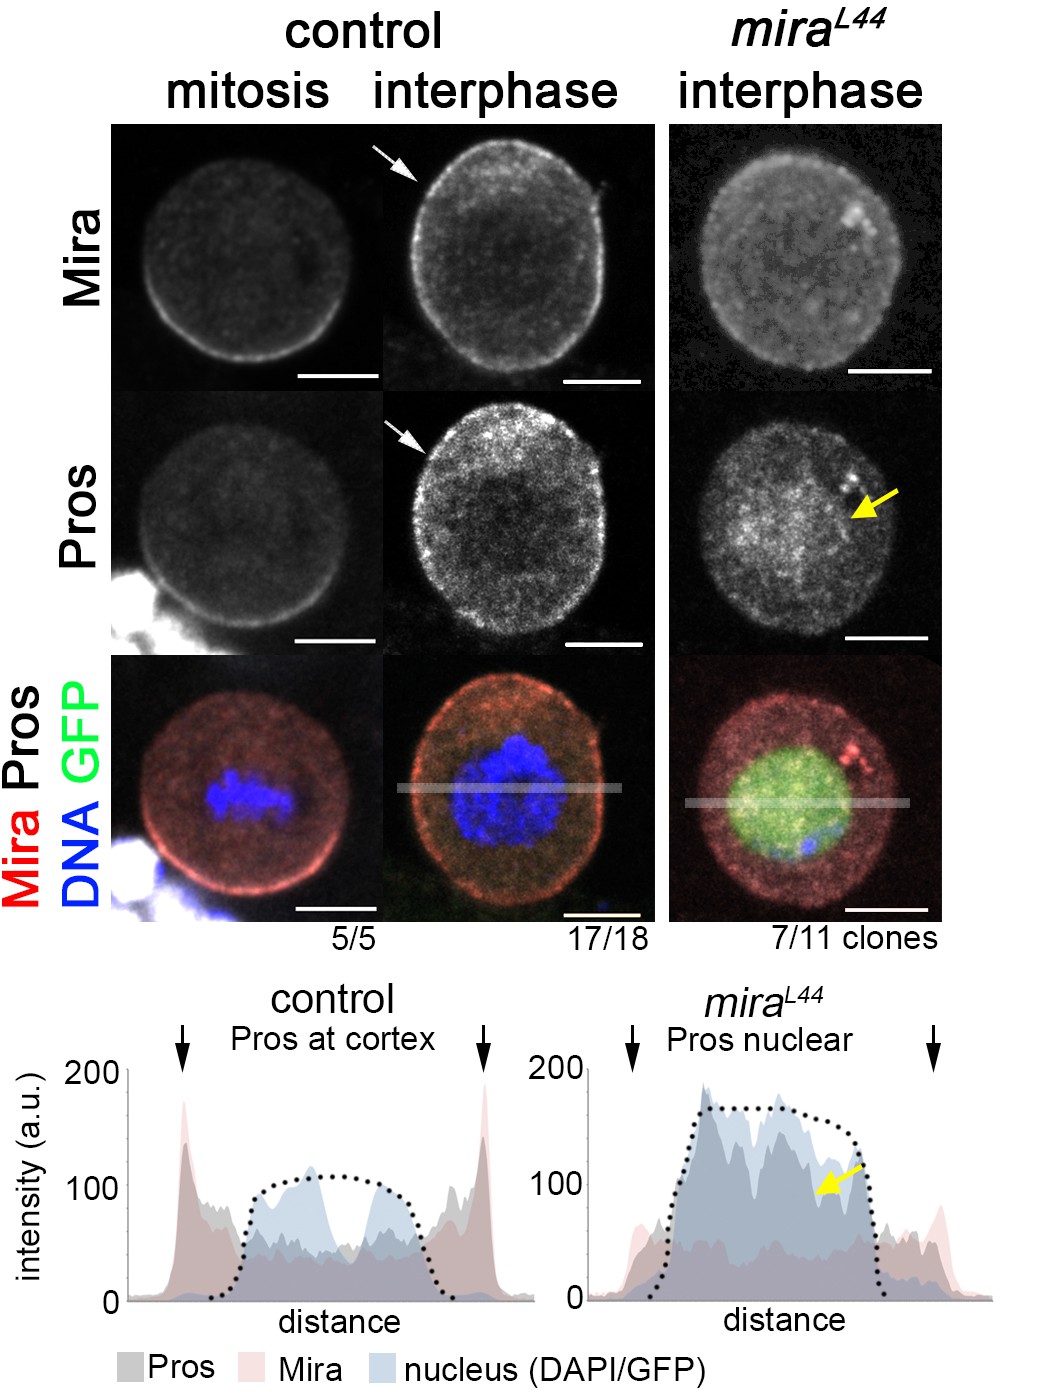
Uniform cortical Prospero depends on Miranda in interphase larval NBs.
In w1118 brains, Mira and Pros form basal crescents in mitosis and both are cortical in interphase (arrow). In an interphase miraL44 NB (MARCM clone, GFP+) cortical Mira and Pros are strongly reduced and Pros accumulates in the nucleus (yellow arrow). Transparent bars in merge interphase (control) and miraL44 indicate area used for plot profiles shown below. Pros and Mira are at the cortex (arrows) in the control and Pros is enriched in the nucleus in the mutant (yellow arrow). Arrows: outline of cell. Dotted line: nucleus (based on DAPI, control and GFP (MARCM clone). Scale bar: 10 µm.
Figure 1—figure supplement 2
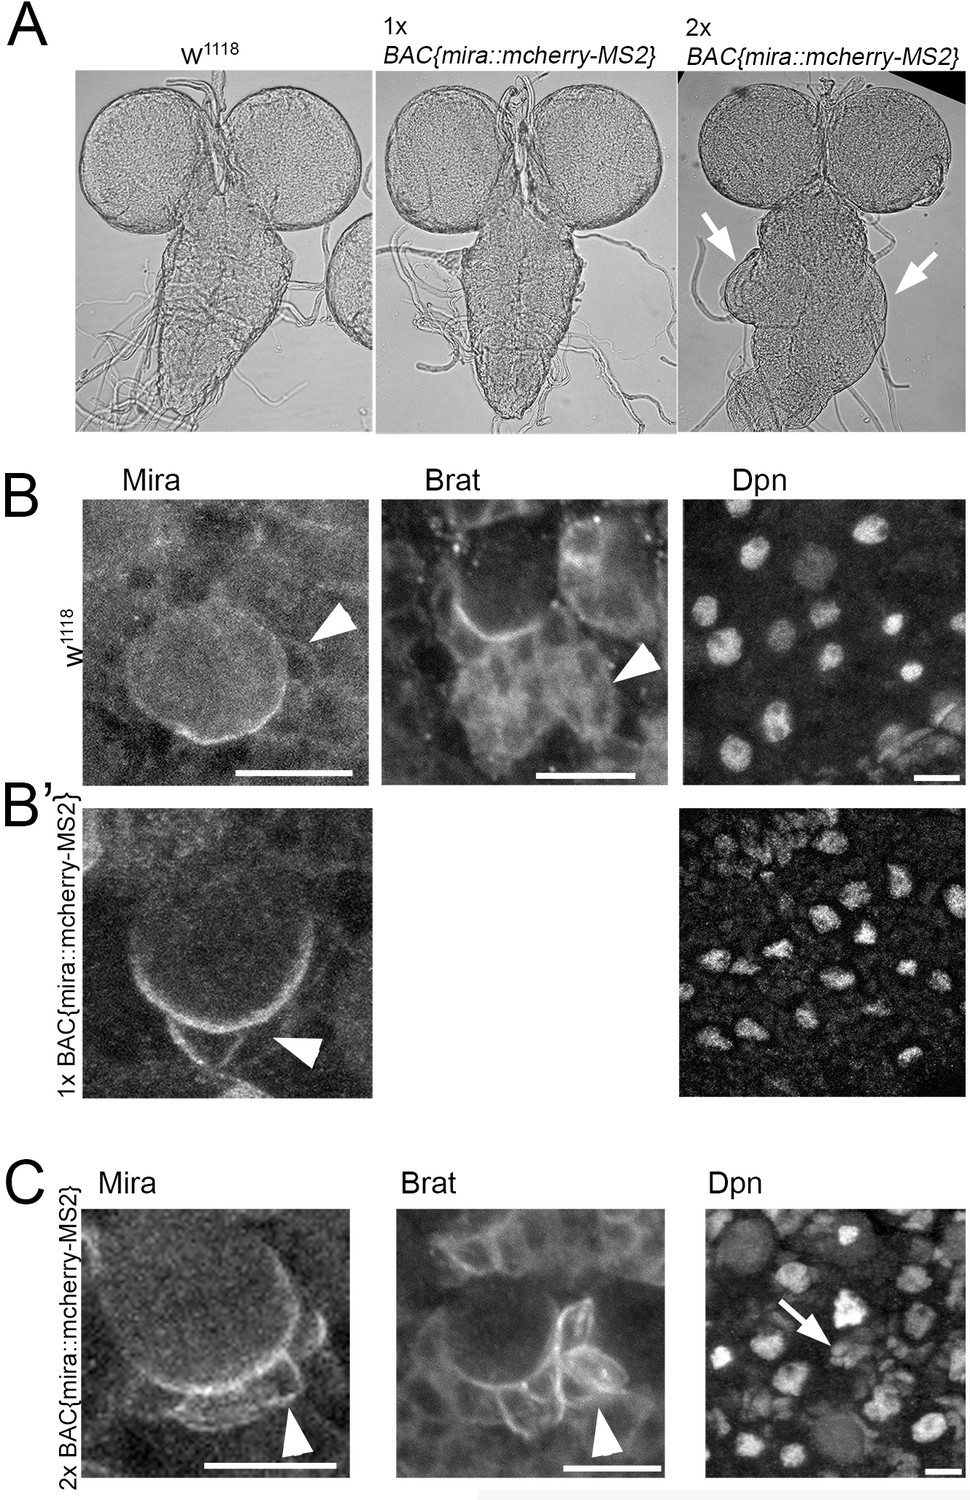
BAC{mira::mcherry-MS2} rescues embryonic lethality of the loss of function allele miraL44 over the deficiency DF(3R)oraI9.
However, animals die during puparium formation, when BAC{mira::mcherry-MS2} is the only source of Mira. (A) Brightfield images of fixed whole mount brain preparations. w1118 (control, n = 5) a BAC{mira::mcherry-MS2} brain over a wild type chromosome (1x BAC{mira::mcherry-MS2}, n = 12) and a brain from BAC{mira::mcherry-MS2} Df(3R)oraI9 over a unrecombined miraBACmCherry chromosome (2x BAC{mira::mcherry-MS2}, n = 12). 2x BAC{mira::mcherry-MS2} animals die as pharates. The ventral ganglion (VG) of these brains is frequently overgrown (arrows). Similar effects are seen with CrispR generated, homozygous mira::mCherry::HA larvae (not shown). (B) In fixed w1118 brains Mira as well as its cargo Brat are diffuse in the cytoplasm of NB daughter cells and Deadpan (Dpn) staining is restricted to NB nuclei. (B’) BAC{mira::mcherry-MS2}brains are not overgrown, Mira is sometimes more stable at the cortex in a daughter cell (arrowhead), but Dpn is normal. (C) In 2x BAC{mira::mcherry-MS2} animals, Mira is strongly cortical in several NB daughter cells and so is Brat (arrowheads). Dpn is no longer restricted to NB nuclei but frequently found in clusters of smaller nuclei close to NBs suggesting that Mira is stabilized at the cortex and fails to release its cargo, inducing fate changes. mCherry is fused to the C-terminus of Mira which was shown to be required for cargo release (Fuerstenberg et al., 1998; Matsuzaki et al., 1998). Scale bars: 10 µm.
Figure 1—figure supplement 3
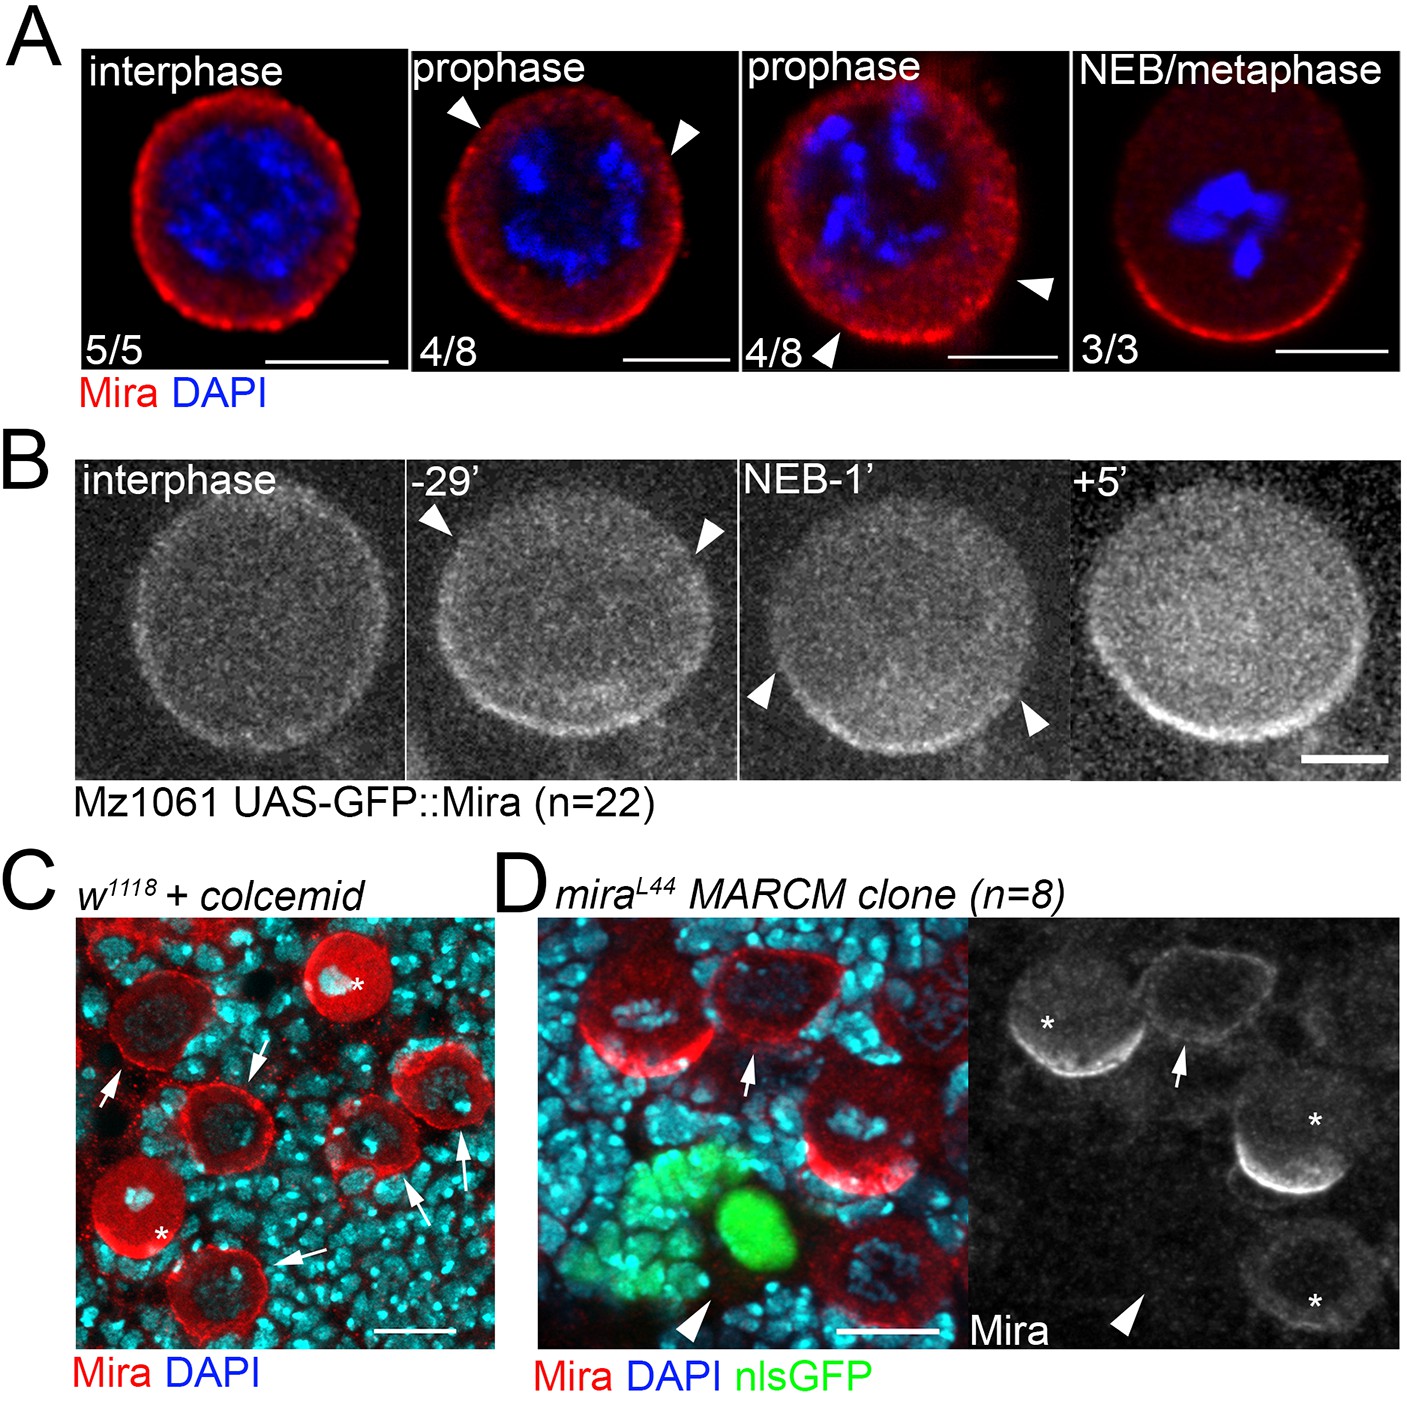
Cortical Mira can be detected by antibody staining, in UAS-GFP-Mira overexpressing NBs and upon colcemid treatment, but not in interphase miraL44 loss of function clones.
(A) Antibody staining against Mira performed on different fixed isolated NBs in primary cell culture. In this assay Mira (red) is cortical in an interphase NB (judged by DAPI, blue). In prophase NBs, differently sized Mira ‘crescents’ can be detected the ends of which are labeled by arrowheads. In a metaphase NBs Mira forms a crescent that appears larger than some of those seen in prophase NBs. (B) A living NB in primary cell culture expressing Mira::GFP driven by Mz1061. GFP signal is at the cortex in interphase, 29 min prior to NEB, GFP signal becomes cleared apically (arrowheads) until most of the cortex is cleared 1 min prior to NEB. 5 min after NEB a robust, larger crescent has formed. (C) Control brain (n = 5) treated with 50 µM colcemid for 30 min and stained for Mira. Over condensed chromatin in mitotic NBs demonstrates the effect of colcemid yet in all interphase NBs Mira remains at the cortex. (D) Fixed brain containing an interphase NB MARCM miraL44 clone surrounded by control NBs. In the clone, cortical Mira signal is gone (arrowhead) while present in a control interphase NB (arrow). Asterisks: mitotic NBs. Scale bar 10 µm.
Figure 2 with 1 supplement
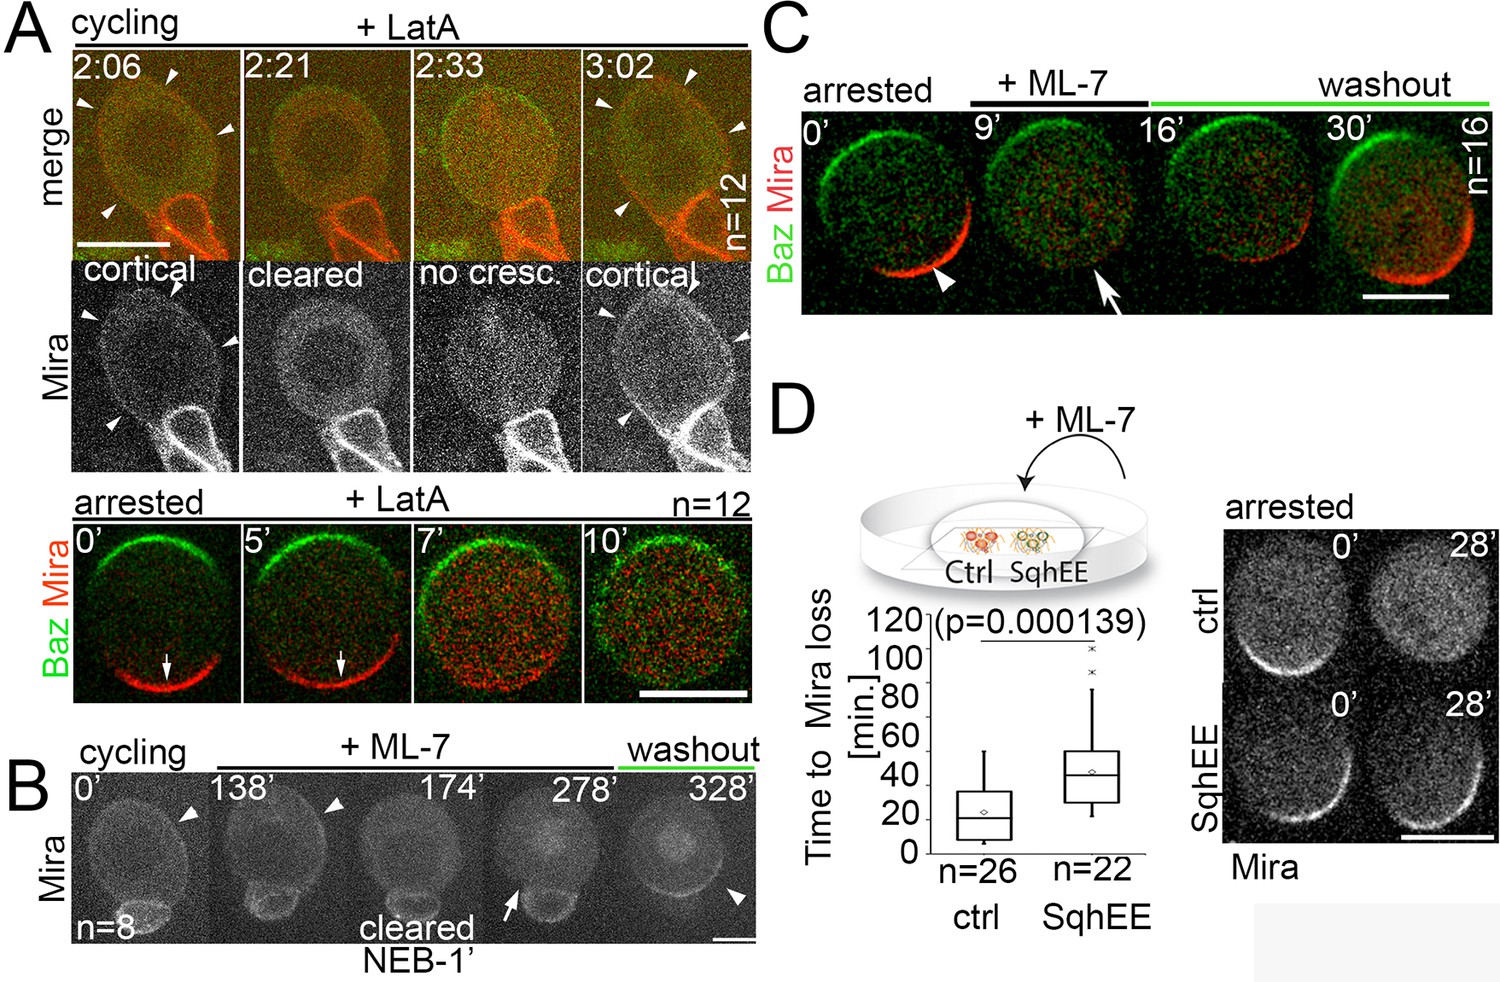
Differential response of Mira localization in interphase and mitosis to disruption of the actin cytoskeleton.
(A) Stills from Video 3. LatA was added to a cycling NB in primary cell culture expressing Baz::GFP (green) and Mira::mCherry (red). Arrowheads point at cortical Mira after culturing ~1 hr with LatA (2:06). At 1 min to NEB, Mira::mCherry is cleared from the cortex (2:21). Mira forms no crescent in the next mitosis (2:33), but after cytokinesis fails (note bi-nucleated cell at 3:02), Mira is recruited to the cortex (arrowheads). Bottom panels: Colcemid-arrested NBs expressing Baz::GFP and Mira::mCherry. LatA was added at 5 µM prior to imaging at 15 s. intervals. Mira crescents (arrows) are lost upon LatA treatment. (B) Cycling NB in primary cell culture expressing Mira::mCherry, that remains cortical upon ML-7 addition (15 µM; interphase: 0’ and 138’, arrowheads), is cleared 1 min prior to NEB (174’), does not form a crescent after NEB (278’, arrow), but accumulates on the spindle (seen in cross section). After ML-7 washout, a basal Mira::mCherry crescent recovers (arrowhead, 328’). (C) Related to Video 5. Colcemid-arrested NB in primary cell culture expressing Baz::GFP (green) and Mira::mCherry (red). After addition of 20 µM ML-7 Mira (arrowhead, 0’) becomes cytoplasmic (arrow,+9’), but upon ML-7 washout a Mira crescent recovers. (D) The effect of 20 µM ML-7 can be quenched by overexpressing a phospho-mimetic form Sqh (SqhEE). Colcemid arrested NBs (ctrl: Mira::mCherry: SqhEE: Mira::mCherry co-expressing SqhEE by worniuGal4). Ctrl and SqhEE were co-cultured and ML-7 added (related to Video 6). Quantification of the time required to cause Mira::mCherry to become cytoplasmic shown on the left. Two-tailed t test for independent means revealed significance. BAC{mira::mcherry-MS2} was the source of Mira::mCherry. Scale bar: 10 µm.
Figure 2—figure supplement 1
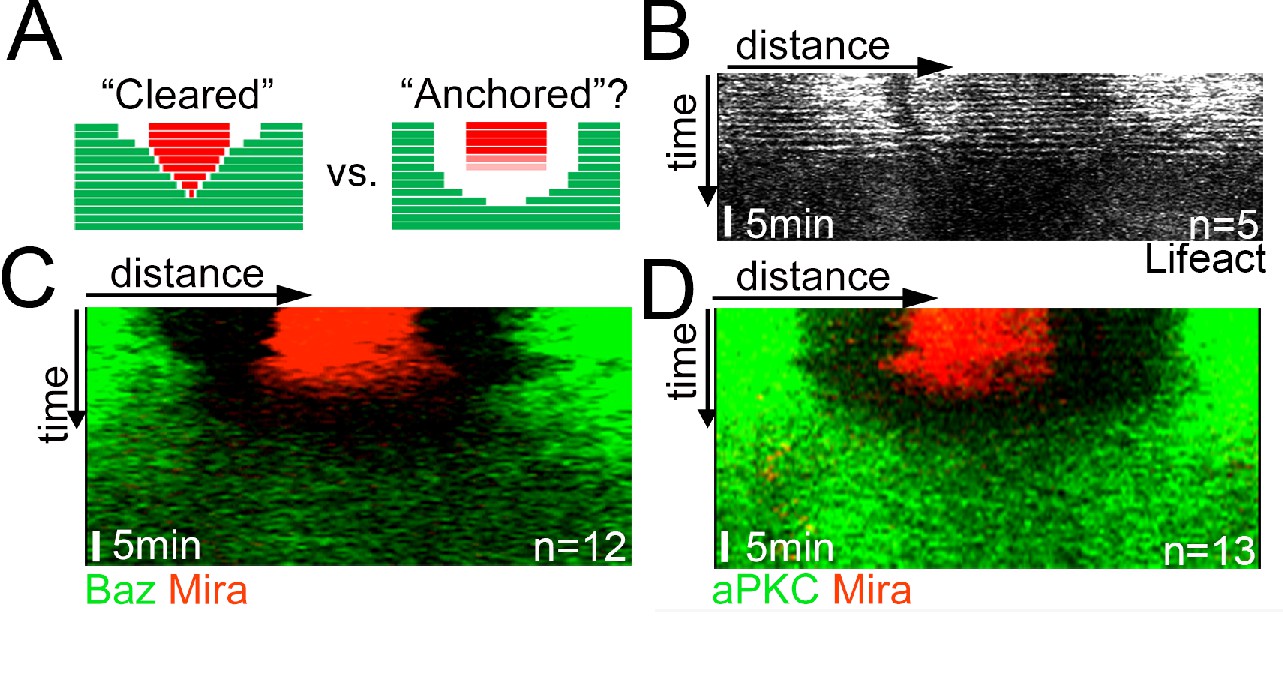
Mira falls homogenously off the cortex upon LatA treatment, which is not driven by aPKC cortical displacement.
(A) Schematic depicting the expected kymograph profile for clearing versus anchoring. (B–D) Kymographs of colcemid arrested NBs expressing Lifeact-Ruby, Baz::GFP and Mira::mCherry or aPKC::GFP and Mira::mCherry (related to Video 4) upon the addition of 5 µM LatA. The equatorial perimeter of the NB was straightened out for each time point. Time scale bar: 5 min. BAC{mira::mcherry-MS2} was the source of Mira::mCherry. Scale bar: 10 µm.
Figure 3 with 1 supplement
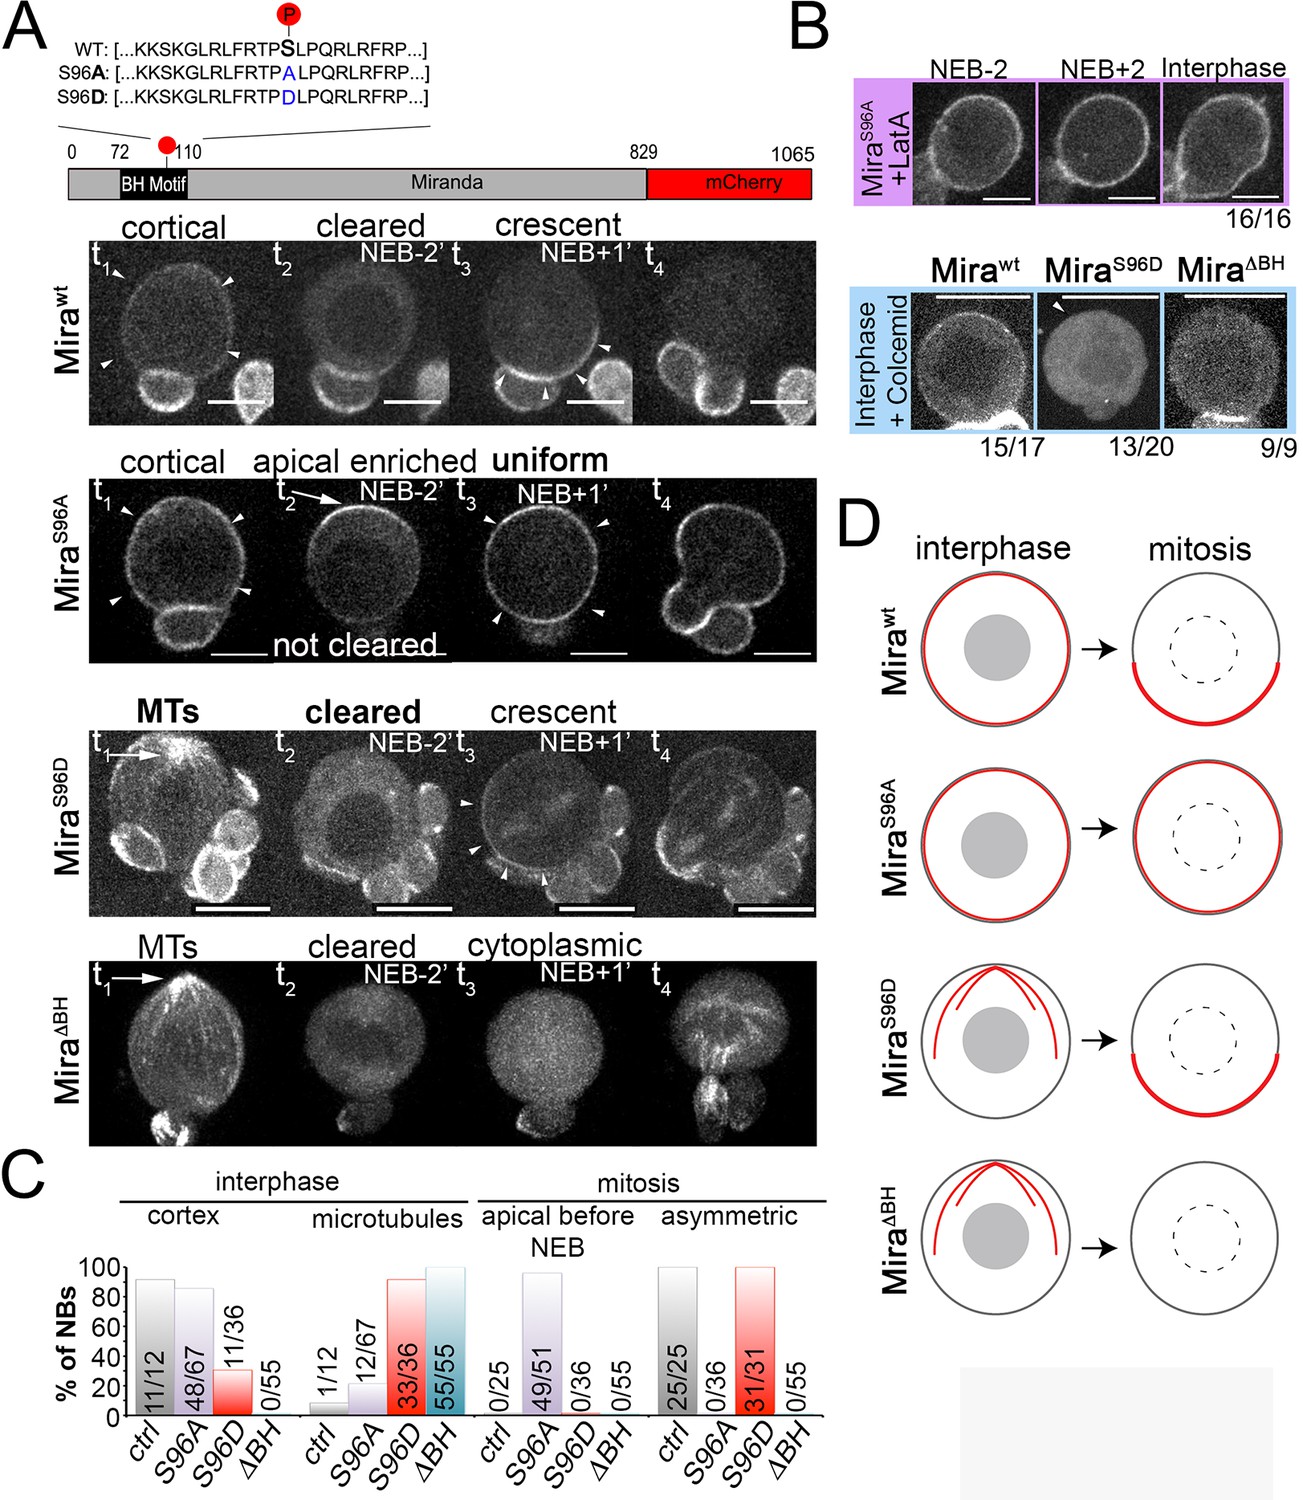
Miranda binds to the plasma membrane in interphase NBs via its BH motif.
(A) Schematic indicating the different Mira alleles used. Mira::mCherry localizes cortically uniform in interphase (arrowheads t1), is cleared from the cortex shortly before NEB and forms a crescent (arrowheads t3) thereafter that is inherited by daughter cells (related to Video 8). The phosphomutant S96A is uniformly cortical in interphase, accumulates apically shortly before NEB (arrow, t2), and is uniformly cortical after NEB (arrowheads t3) and in telophase (t4, related to Video 9). The phosphomimetic S96D localizes to cortical microtubules in interphase (arrow t1), is cleared from the cortex before NEB and asymmetric after NEB (arrowheads t3) and segregates to daughter cells (related to Video 10). Deletion of the BH motif leads to cortical microtubule localization in interphase (arrow t1), cytoplasmic localization before and after NEB and reappearance on microtubules around cytokinesis (related to Video 11). (B) Neuroblasts expressing the indicated Mira alleles were treated with 1 µM LatA or 50 µM colcemid for 60 min. Cortical localization of S96A is insensitive to LatA treatment. Below: While the control remains cortical, S96D and ΔBH become cytoplasmic upon colcemid treatment. (C) Frequency of indicated localization of the different Mira mutants. (D) Schematic of the localization of the different Mira alleles. Scale bar: 10 µm.
Figure 3—figure supplement 1

Effects of aPKCΔN expression in NBs on Mira localization.
(A) Control: Mira is cortical in interphase (91% cortex, 9% cytopl., n = 53), forms a crescent in metaphase (93% crescent, 7% cytopl., n = 15) and is found in telophase at the basal cortex (100%, n = 9). aPKCΔN: Mira is cytoplasmic in interphase (85% cytoplasm, 15% cortex, n = 40) and metaphase (89% cytopl., 11% crescent, n = 15), but detectable at the basal cortex in telophase (100%, n = 12). Antibody staining (left two columns) and live NBs co-expressing Mira::mCherry (right column, n = 20). (A’) Quantification of Mira localization and telophase rescue in living NBs.
Figure 4 with 1 supplement
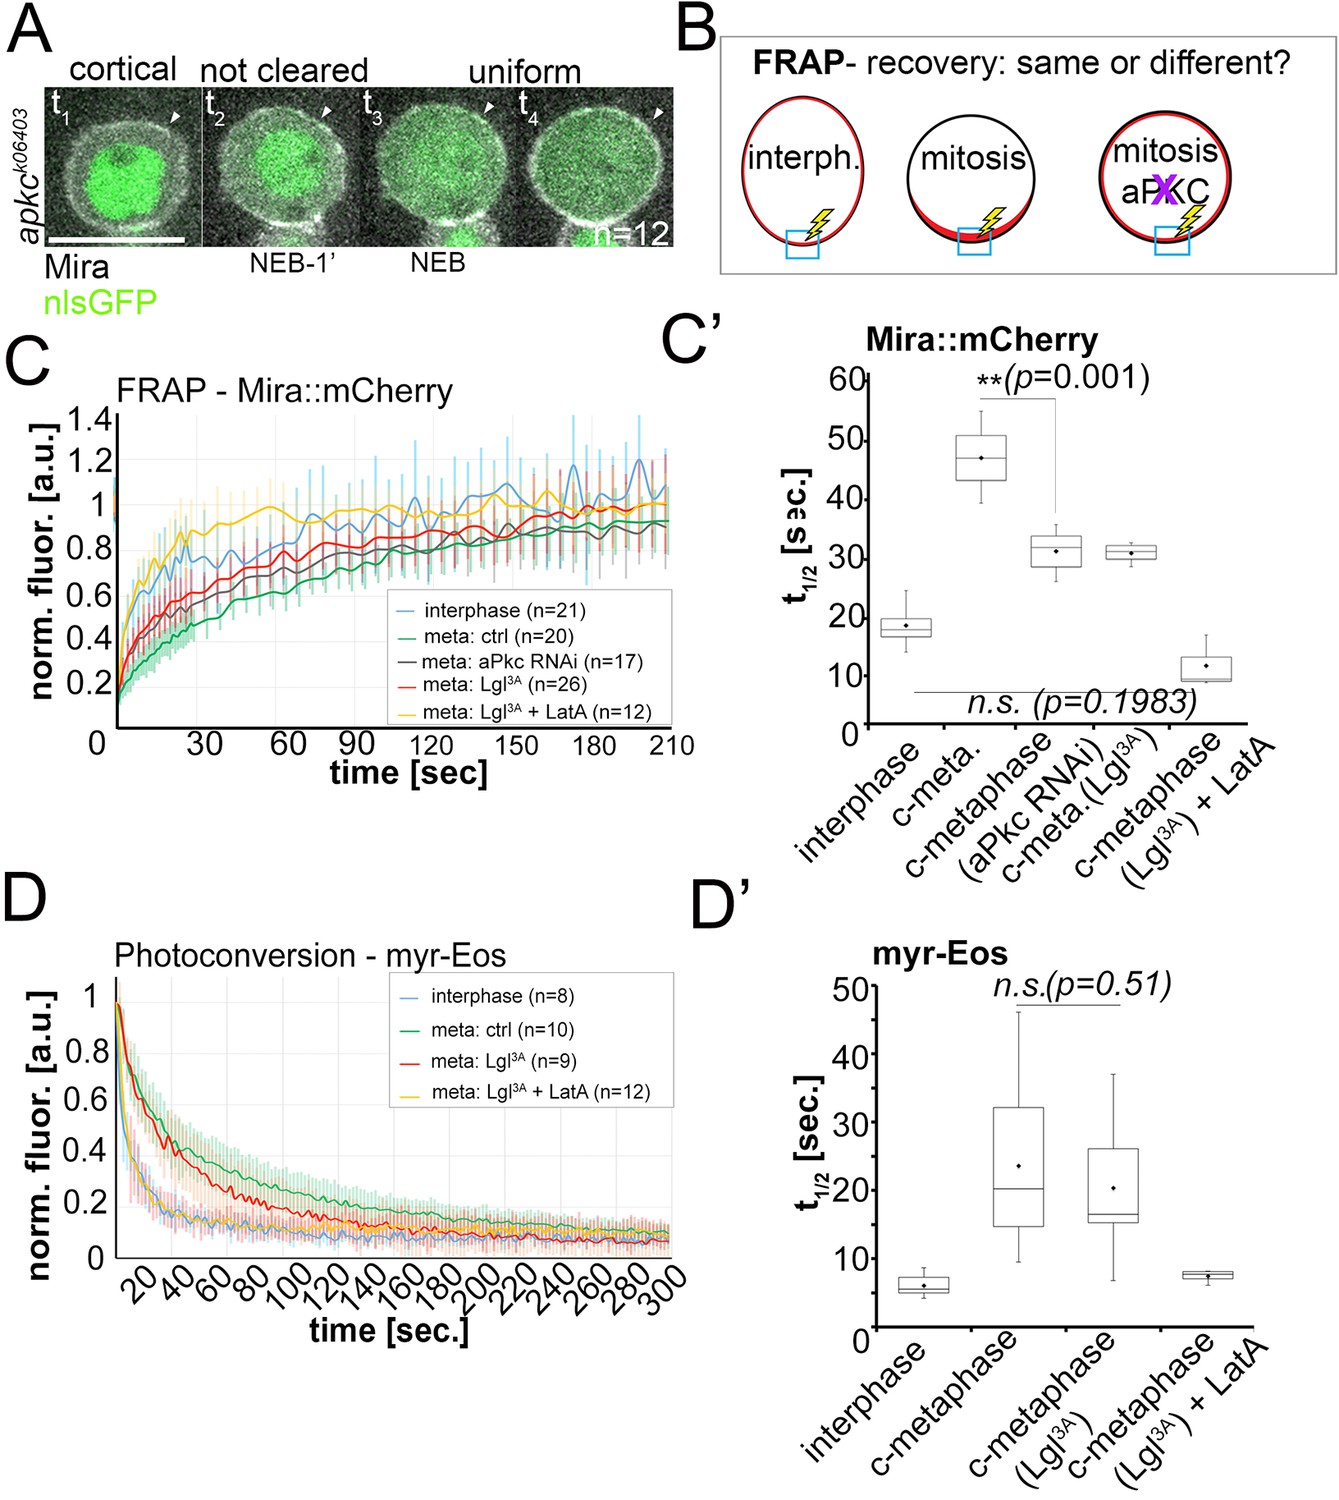
Lateral diffusion and cytoplasmic exchange of cortical Miranda are different in control and aPKC impaired mitotic NBs.
(A) Stills from Video 12 of an apkck06403 mutant NB (MARCM clone labeled with nlsGFP, green) expressing Mira::mCherry (grey). Mira is cortical in interphase, as the NB enters mitosis, and after NEB (arrowheads, t1 – t4). (B) Conditions analyzed by FRAP. (C) Fluorescence redistribution curves of cortical Mira::mCherry at the indicated conditions. (C’) Estimates of t1/2 [sec.] for cortical Mira::mCherry under the indicated conditions derived from curve fitting (Rapsomaniki et al., 2012). (D) Photo-conversion experiment monitoring loss of myr-EOS converted signal over time. (D’) Estimates of t1/2 [sec.] for cortical Mira::mCherry under the indicated conditions from curve fitting. Overexpression was driven by worniu-Gal4. p values: two-tailed t test for independent means. Scale bar: 10 µm.
Figure 4—figure supplement 1
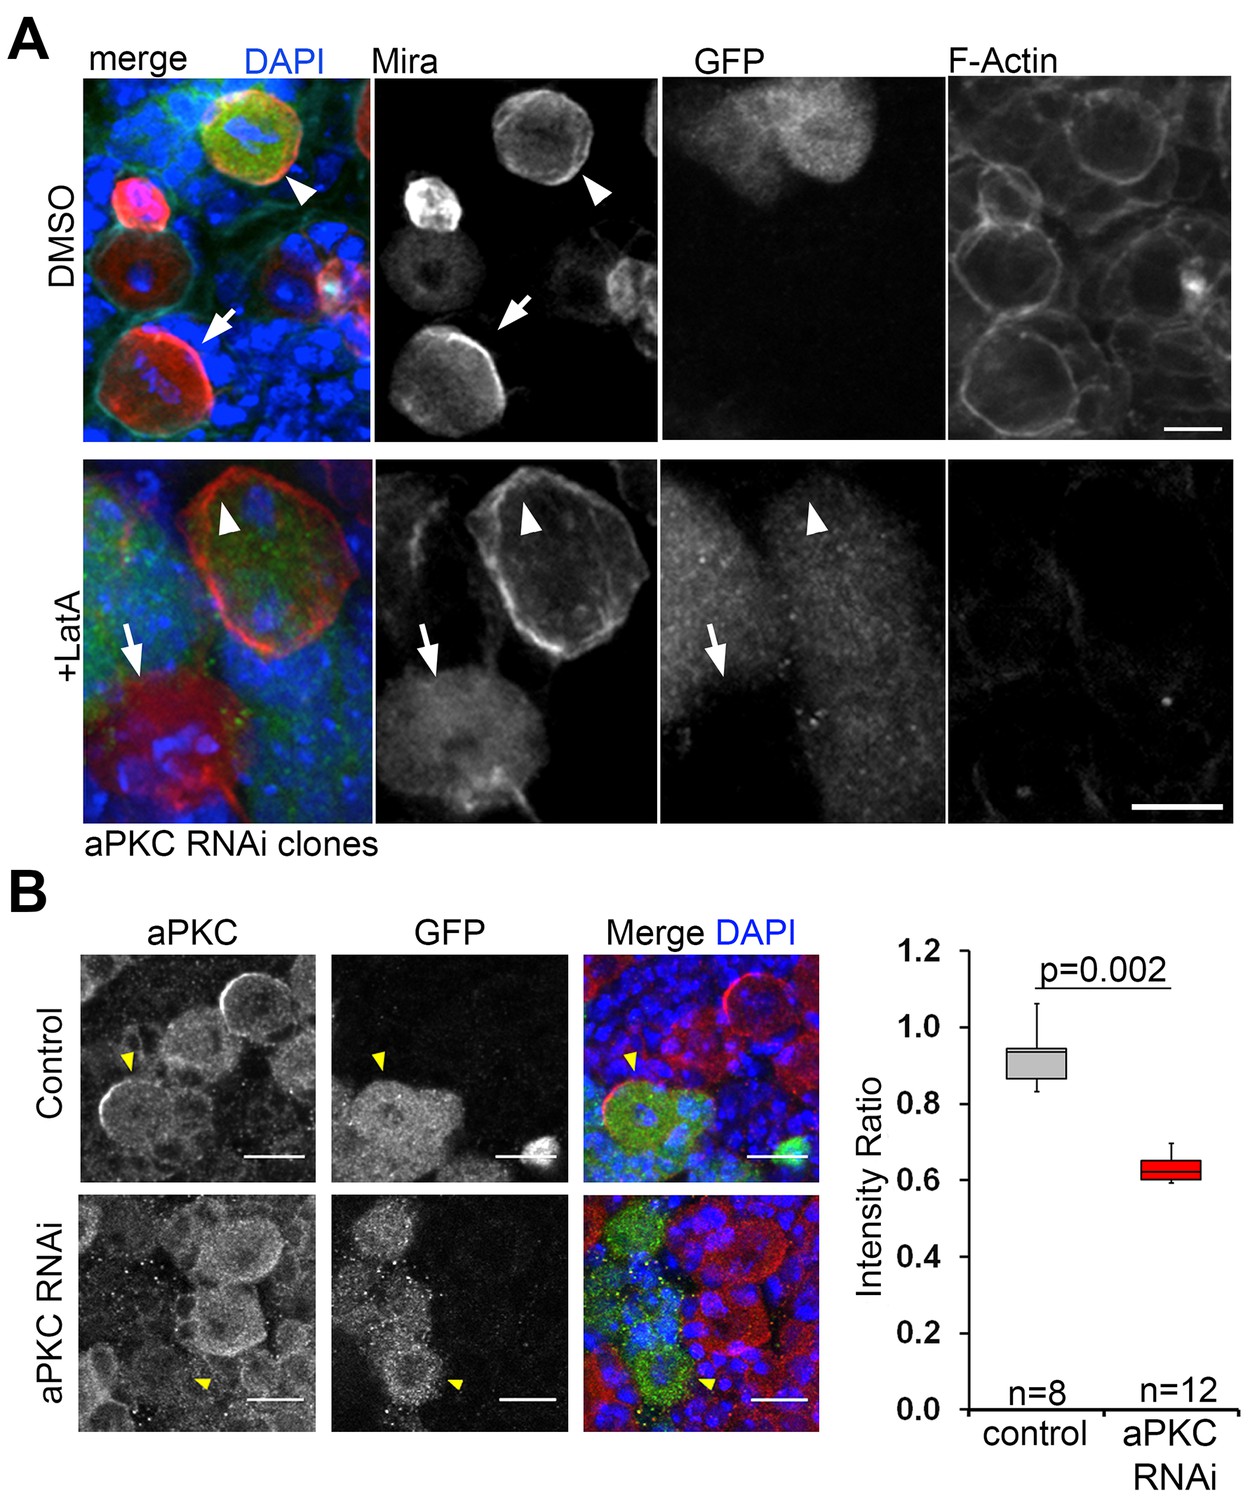
Mira localization to the mitotic NB cortex occurs independently of F-actin upon aPKC knock down.
(A) aPKC RNAi expressing flip out clones (GFP positive, arrowheads) and GFP negative control NBs (arrows) treated with DMSO or 5 µM LatA and stained with an antibody against Mira and with Phalloidin to label F-Actin. In GFP negative mitotic control NBs, Mira is in a crescent (DMSO) or cytoplasmic (LatA). Mira is cortical in DMSO as well as LatA treated mitotic aPKC RNAi NBs (100%, n = 5, arrowheads). (B) aPKC is efficiently knocked down by RNAi in flip out clones. Unpaired t test. aPKC RNAi NBs have significantly less aPKC. BAC{mira::mcherry-MS2} was the source of Mira::mCherry Scale bar: 10 µm.
Figure 5 with 1 supplement
Mira crescent size is affected by a Y-27632-sensitive mechanism that operates before NEB.
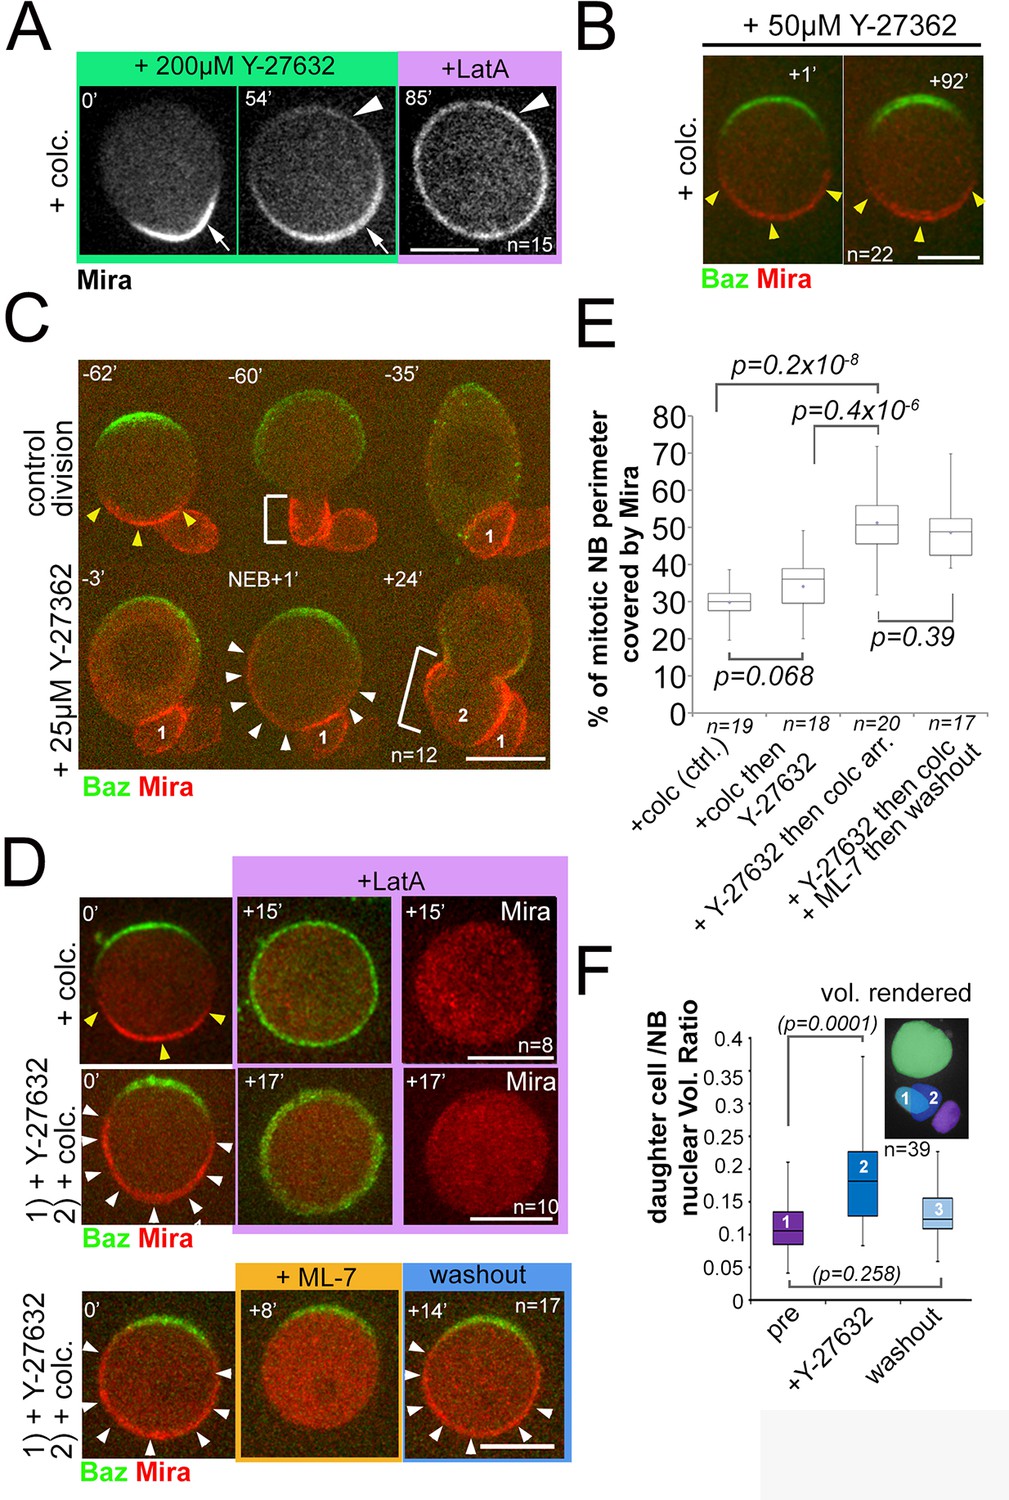
(A) Stills from Video 15. Colcemid arrested NBs were treated with 200 µM Y-27632. After >50 min Mira becomes faintly detectable apically, but retains a basal bias. LatA addition (5 µM) abolishes that asymmetric bias and Mira is uniformly distributed on the membrane. (B) Culturing colcemid-arrested NBs in 50 µM Y-27632 did not alter Mira crescent size (yellow arrowheads, quantified in E). (C) NBs polarizing in the presence of 25 µM Y-27632 show enlarged Mira crescents. Control division (−62’ to −35’) with normally sized Mira crescent and daughter cell size (−60’; yellow arrowheads, bracket, respectively). Dividing in the presence of Y-27632 (−3, NEB +1) leads to an enlarged Mira crescent (NEB +1, white arrowheads) and enlarged daughter cell size (+24’, brackets, 2). (D) NBs were allowed to polarize in the absence (upper row) or presence of 25 µM Y-27632 (middle and lower row) followed by colcemid arrest. upper row: Control NB with normal Mira crescent (yellow arrowheads) was depolarized by 1 µM LatA. Mira was displaced into the cytoplasm. middle row: adding 1 µM LatA leads to displacement of the enlarged Mira crescent (yellow arrowheads) in the cytoplasm. Lower row: adding 20 µM ML-7 drives Mira into the cytoplasm (+8’). Upon ML-7 washout, Mira recovered to an enlarged crescent (+14’, white arrowheads). (E) Quantification of Mira crescent size in the aforementioned experiments (unpaired t test). (F) Plot of the ratio of daughter cell to NB nuclei as a measure of the effect of Y-27632 on daughter cell size. NBs expressing NLSGFP were imaged by DIC to follow daughter cell birth order during three consecutive divisions [(1) pre-treatment; (2) division in the presence of 25 µM Y-27632; (3) division after drug washout]. A high-resolution z-stack of nlsGFP was recorded, and the nuclear volumes rendered and calculated using IMARIS to plot their ratio. p values: Dunn’s test. Time stamp: min. Labels as indicated. BAC{mira::mcherry-MS2} was the source of Mira::mCherry. Scale bar: 10 µm.
Figure 5—figure supplement 1
Standard used to quantify Mira crescent size.
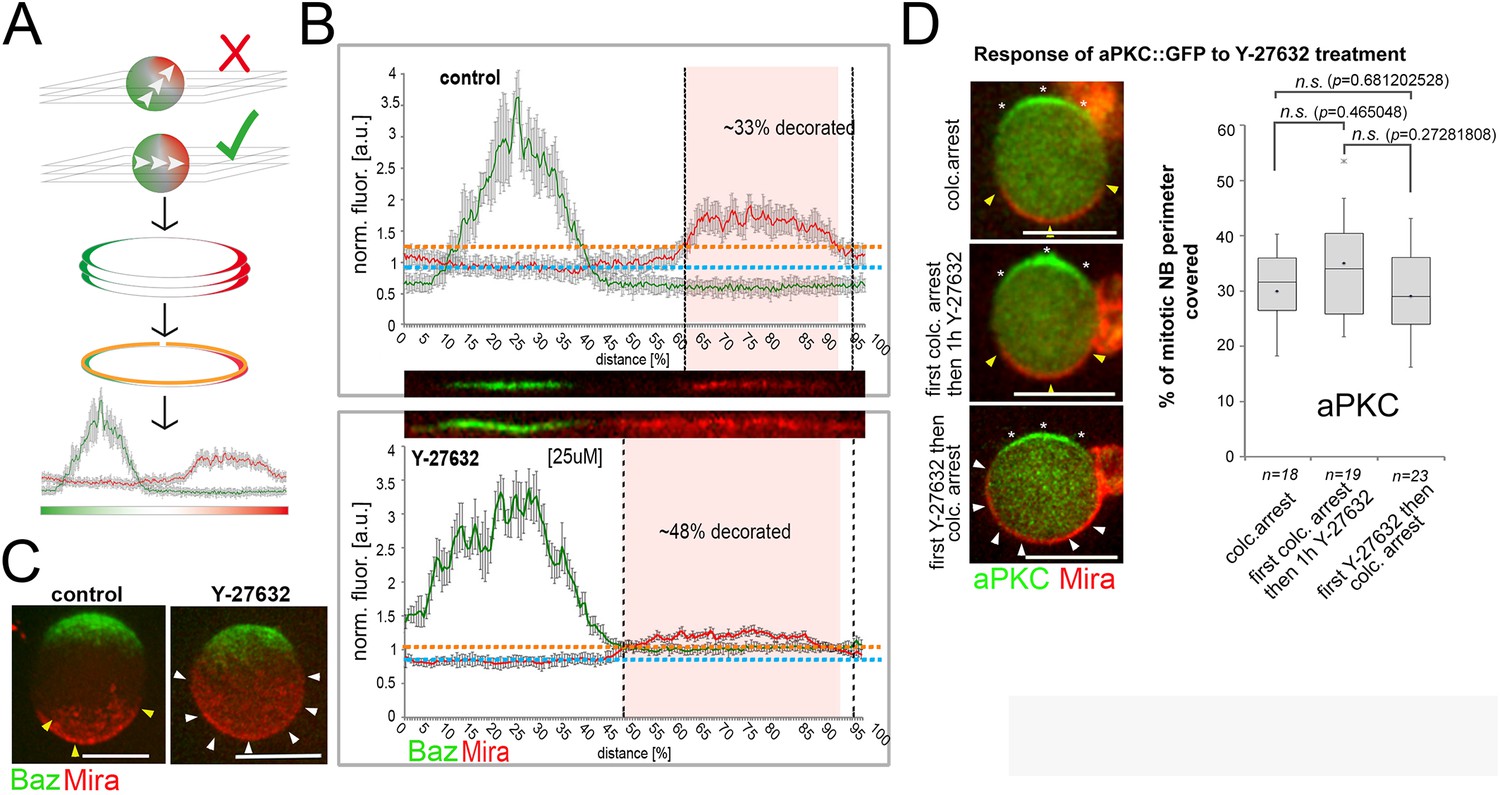
(A) Schematic of workflow. NBs that have a polarity axis parallel to the imaging plane are selected. Optical planes (3–5) are collected covering 2–3 µm of the equator of the NB. (B) Fluorescence is normalized against the cytoplasmic background and straightened line plots are derived from each section. The average background and the average standard deviation is determined. Signal:>avg. background plus two times the average standard deviation. (C) 3D projections of z-sections covering the entire NBs, ctrl vs. a NB that polarized in the presence of 25 µM Y-27632. (D) Quantification of aPKC::GFP crescent size under the indicated conditions (unpaired t test). Asterisks: aPKC; yellow arrowheads: normal sized crescents; white arrowheads: enlarged Mira crescents. BAC{mira::mcherry-MS2} was the source of Mira::mCherry. Scale bar: 15 µm.
Figure 6
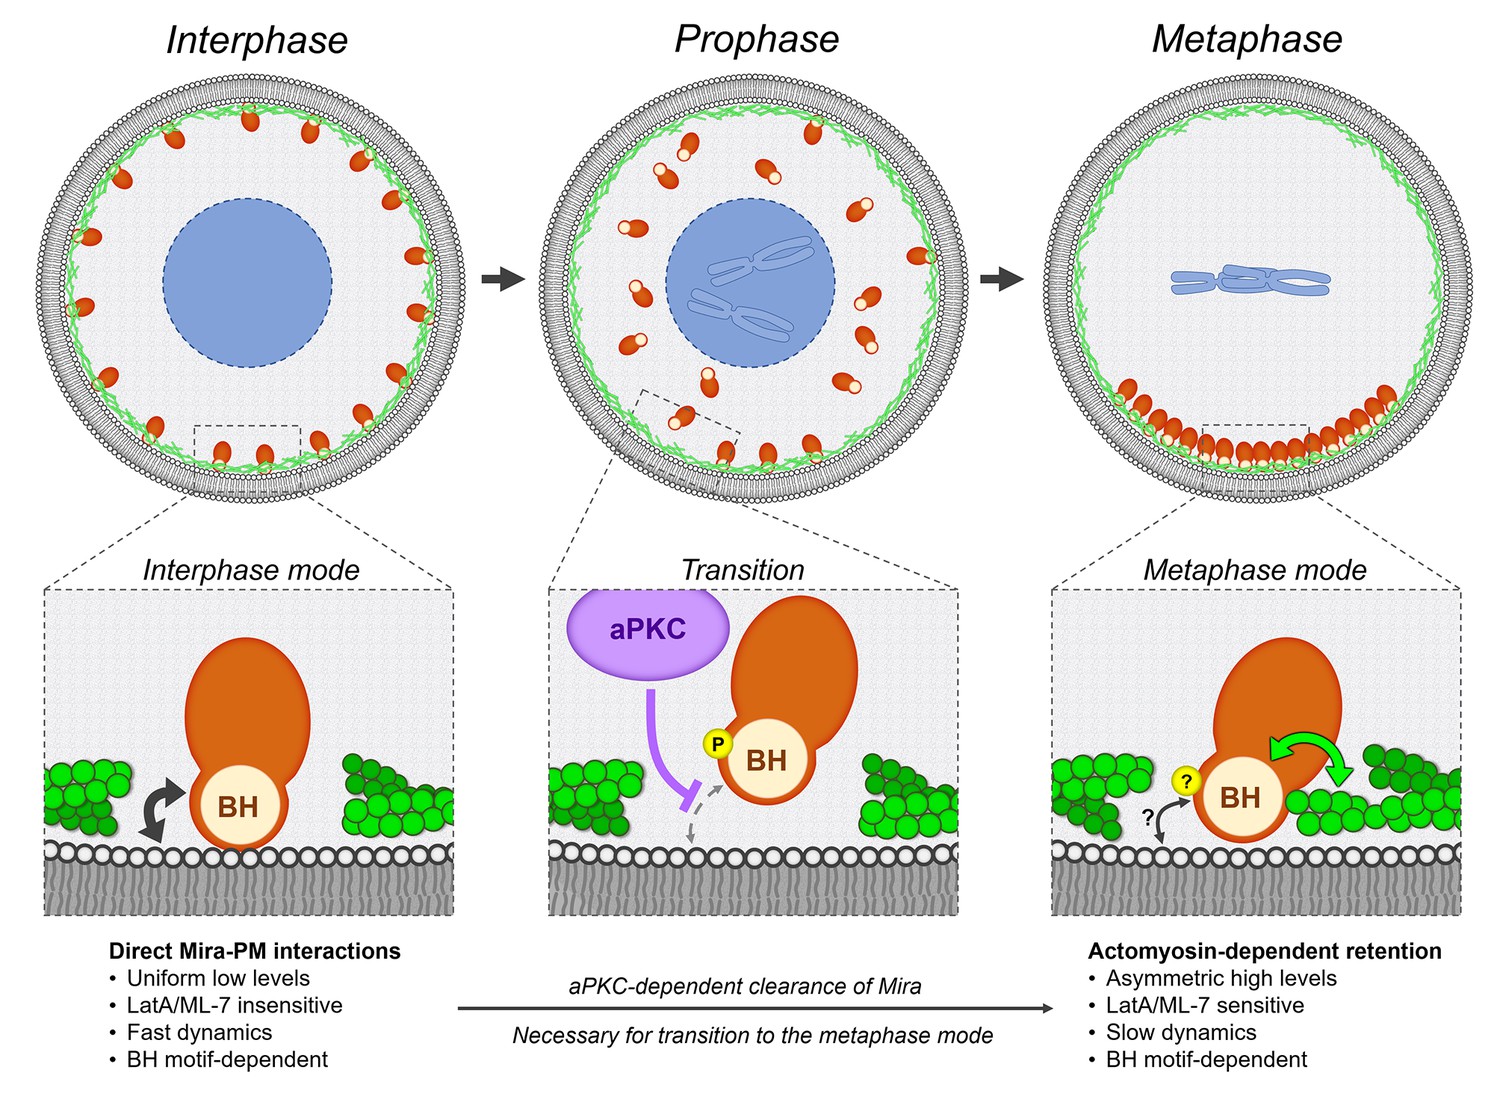
Model.
Mira associates with the cortex using two different modes, which characteristics are detailed in the bottom row. During interphase, Mira directly binds to the phospholipids of the PM via its BH motif (black double arrow). During prophase, aPKC-dependent phosphorylation of this motif abolishes this interaction, resulting in the progressive clearance of Mira from the cortex, in an apical-to-basal manner driven Mira into the cytoplasm. This clearance in prophase is necessary for Mira to associate with the basal cortex after NEB, via Actomyosin-dependent retention. Both the precise phosphoregulation and molecular characteristics of this mode remain to be determined. The BH motif, also required at this step, may directly or indirectly mediate interactions between Mira and actomyosin (green double arrow). PM interactions via its BH motif (black double arrow) may still contribute, but are not sufficient to mediate Mira basal retention after NEB.
Videos
Video 1
Interphase cortical Miranda is removed at the onset of mitosis.
Spinning disc confocal image of a neuroblast expressing Baz::GFP (red) and Mira::mCherry (green). For this and all subsequent videos maximum projection after a 3D Gaussian blur (FIJI, radius 8/.8/1) of 7 consecutive equatorial planes taken at 0.4 µm spacing is shown. Z-stacks taken every minute. Time stamp: hh:mm.
Video 2
Interphase cortical Miranda is removed at the onset of mitosis.
Spinning disc confocal image of a neuroblast expressing aPKC::GFP (green) and Mira::mCherry (red). Z-stacks taken every minute. Time stamp: hh:mm.
Video 3
Interphase cortical Miranda is actin independent.
Spinning disc confocal image of a NB expressing Baz::GFP (red) and Mira::mCherry (green) showing a control division before 1 µM LatA was added. Z-stacks taken every minute. Time stamp: hh:mm.
Video 4
Colcemid-arrested NB expressing aPKC::GFP and Mira::mCherry that was treated with 5 µM LatA at the beginning of the recording at 16 s intervals.
The cortex was straightened out and split at the apical pole such that aPKC::GFP appears right and left and Mira in the center. Fluorescence profiles shown below. Note that Mira falls off homogenously from the cortex and becomes cytoplasmic at 5:36 (red arrowhead), while the detectable borders of cortical aPKC (green arrowheads) have not yet changed. Only from 07:12 onward aPKC rise above cytoplasmic levels where Mira was localized. Time stamp: mm:ss.
Video 5
Colcemid-arrested NB expressing Baz::GFP and Mira::mCherry that were treated with 5 µM LatA at the beginning of the recording at 16 s intervals.
The cortex was straightened out and split at the apical pole such that Baz::GFP appears right and left and Mira in the center. Fluorescence profiles shown below. Note that Mira falls off homogenously from the cortex and becomes cytoplasmic at 9:00 (asterisks), while the detectable borders of cortical Baz (arrowheads) have not yet changed. Only from 12:30 onward Baz rise above cytoplasmic levels where Mira was localized. Time stamp: mm:ss.
Video 6
Myosin inhibition reversibly affects basal Mira anchoring in a polarized NB.
A colcemid arrested NB expressing Baz::GFP (green) and Mira::mCherry (red) in primary cell culture was treated with 20 µM ML-7 which was washed out when indicated. Left panel Baz::GFP, middle panel Mira::mCherry, right panel merge. Z-stacks taken every minute. Time stamp: mm:ss.
Video 7
The effect of ML-7 on cortical Mira localization in mitosis can be delayed by overexpressing SqhEE.
Mira::mCherry NB (ctrl) and Mira::mCherry NB co-expressing SqhEE (rescue) were co cultured in neighboring clots in the same dish and the effect of ML-7 on cortical Mira recorded. Z-stacks taken every two minutes. Time stamp: hh:mm.
Video 8
Control miramCherry allele generated by CrispR/Cas9.
Mira localizes to the interphase cortex, from where it is cleared before NEB. Then Mira relocalizes to a larger crescent. Therefore this allele and Mira::mCherry (BAC rescue) are undistinguishable in terms of Mira dynamics. This control further shows that the MS2 binding site in the BAC rescue construct does not interfere with Mira cortical dynamics. Time stamp: hh:mm.
Video 9
Phosphomutant S96A allele of Mira tagged with mCherry at the C-terminus.
Mira localizes uniformly to the interphase cortex. Shortly before NEB, S96A is apically enriched, before being uniformly cortical after NEB and during division. Time stamp: hh:mm.
Video 10
Phosphomimetic S96D allele of Mira tagged with mCherry at the C-terminus.
S96D localizes to microtubules in interphase, but is asymmetric in mitosis. Note the signal resembling subcortical microtubules in interphase converging at the apical pole. After NEB a basal crescent is detectable. At 115:30 a z-stack spanning the entire NB was collected and the maximum projection is frozen. After this, 50 µM colcemid was added to reveal if MiraS96D::mCherry binds to the cortex. Next frozen frame: similar stack after 30 min in colcemid. Next frozen frame: 50 min in colcemid – no cortical signal is detectable. Last frozen frame 65 min in colcemid. Time stamp: mm:ss. Scale 15 µm.
Video 11
Mira requires its BH motif for interphase cortical localization (see main text) and basal localization in mitosis.
The BH motif in Mira has been deleted by gene editing and this Mira mutant tagged with mCherry at the C-terminus (miraΔBHmCherry). MiraΔBH::mCherry when homozygous is found on the interphase microtubule network and in the cytoplasm during mitosis. Time stamp: hh:mm.
Video 12
Miranda remains at the cortex throughout the cell cycle in apkck04603 mutant NBs.
Mutant NB, labeled with nlsGFP (green) expressing Mira::mCherry (white). Z-stacks taken every minute. Time stamp: hh:mm.
Video 13
Miranda remains at the entire cell cortex throughout the cell cycle in NBs treated with 200 µM Y-27632.
A Baz::GFP (Green) and Miranda::mCherry (Red) NB was imaged through one cell cycle in the presence of 200 µM Y-27632. Miranda remained cortical throughout while Bazooka still localised apically in mitosis (n = 12). Z stacks taken every 2 min. Time stamp: hh:mm. Scale: 10 µM.
Video 14
200 µM Y-27632 induced uniform cortical Mira in mitosis localizes independently of an intact actin network.
A Baz::GFP and Mira::mCherry expressing NB was cultured in the presence of 200 µM Y-27632 and then arrested with colcemid. 5 µM LatA was added after the first frame of the movie. LatA induces loss of Baz asymmetry, yet Mira remains cortical. Z-stacks shown. Z stacks taken every 2 min. Time stamp: hh:mm.
Video 15
Colcemid arrested NB expressing Baz::GFP and Mira::mCherry, treated with 200 µM Y-27632.
Mira starts to become visible ~36 min after Y-27632 addition in this example, but remains asymmetrically distributed, until LatA is added. Z-stacks shown. Z stacks taken every 2 min. Time stamp: mm:ss.
Additional files
-
Transparent reporting form
- https://doi.org/10.7554/eLife.29939.030
Download links
A two-part list of links to download the article, or parts of the article, in various formats.
Downloads (link to download the article as PDF)
Open citations (links to open the citations from this article in various online reference manager services)
Cite this article (links to download the citations from this article in formats compatible with various reference manager tools)
aPKC-mediated displacement and actomyosin-mediated retention polarize Miranda in Drosophila neuroblasts
eLife 7:e29939.
https://doi.org/10.7554/eLife.29939


