Subcellular analysis of pigeon hair cells implicates vesicular trafficking in cuticulosome formation and maintenance
- Simon Nimpf

- Erich Pascal Malkemper
- Mattias Lauwers
- Lyubov Ushakova
- Gregory Nordmann
- Andrea Wenninger-Weinzierl
- Thomas R Burkard
- Sonja Jacob
- Thomas Heuser
- Guenter P Resch
- David A Keays
- Vienna Biocenter, Austria
- Vienna BioCenter Core Facilities GmbH, Austria
- Nexperion e.U., Austria
Figures
Figure 1 with 6 supplements
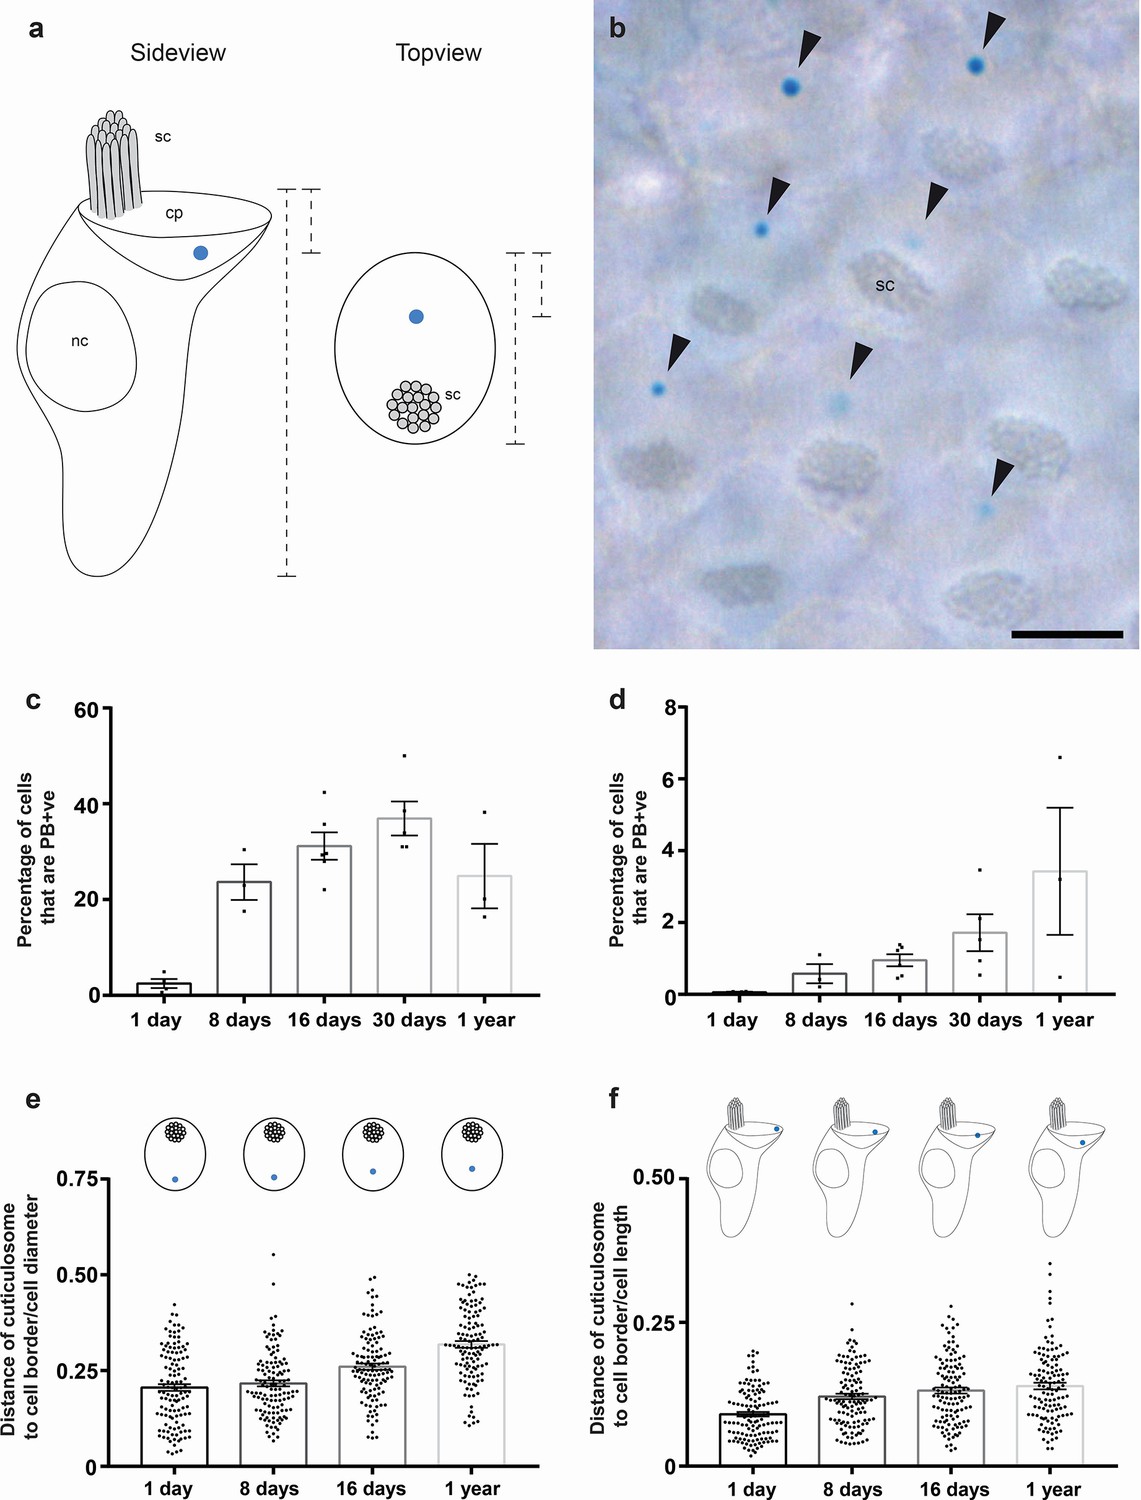
Development and cellular localization of cuticulosomes.
(a) Schematic representation showing the localization of iron-rich organelles in hair cells viewed from the side and the top. The stereocilia (sc), the nucleus (nc) and the cuticular plate (cp) are labelled. Dashed lines indicate measurements that were taken for (e and f) (b) Basilar papilla whole mount from a one year old bird that was stained with Prussian blue, showing a top-down view on hair cells with stereocilia (sc) and PB +ve iron-rich organelles highlighted with arrowheads. Scale bar represents 5 μm. (c) Graph showing the percentage of hair cells that contain Prussian blue positive cuticulosomes in the basilar papilla of 1 day old pigeons (2.46%, n = 4 birds, n = 36644 cells), 8 day old pigeons (23.66%, n = 3 birds, n = 37292 cells), 16 day old pigeons (31.19%, n = 6 birds, n = 86558 cells), 30 day old pigeons (36.9%, n = 5 birds, n = 64668 cells) and 1 year old pigeons (24.9%, n = 3 birds, n = 33312 cells). Dots show the percentage of PB +ve hair cells in individual birds. (d) Graph showing the percentage of hair cells that contain Prussian blue positive cuticulosomes in the lagena of 1 day old pigeons (0.06%, n = 4 birds, n = 24888 cells), 8 day old pigeons (0.57% n = 3 birds, n = 25396 cells), 16 day old pigeons (0.95%, n = 6 birds, n = 103196 cells), 30 day old pigeons (1.72%, n = 5 birds, n = 79536 cells) and 1 year old pigeons (3.43%, n = 3 birds, n = 57264 cells). Dots show the percentage of PB +ve hair cells in individual birds. (e) Graph showing the distance of cuticulosomes from the lateral cell border as a ratio of the cell width at four developmental time points (n = 3–4 birds and n = 120 individual measurements per time point). Dots show ratio for individual cells. (f) Graph showing the distance of cuticulosomes from the apical cell border as a ratio of the cell height at four developmental time points (n = 3 birds per timepoint, n = 120 individual measurements per time point). Dots show ratio for individual cells. Error bars for all graphs show the mean ± SEM.
-
Figure 1—source data 1
Quantitation of Prussian blue positive hair cells in the basilar papilla and lagena macula.
This table shows the estimated numbers of total hair cells, total PB +ve hair cells and the percentage of PB +ve hair cells in the basilar papilla and lagenar macula of all pigeons used for the analysis shown in Figure 1c and d and Figure 1—figure supplements 2–6 ‘R’ and”L’ stand for ‘right’ or ‘left’ cochlear duct.
- https://doi.org/10.7554/eLife.29959.009
Figure 1—figure supplement 1
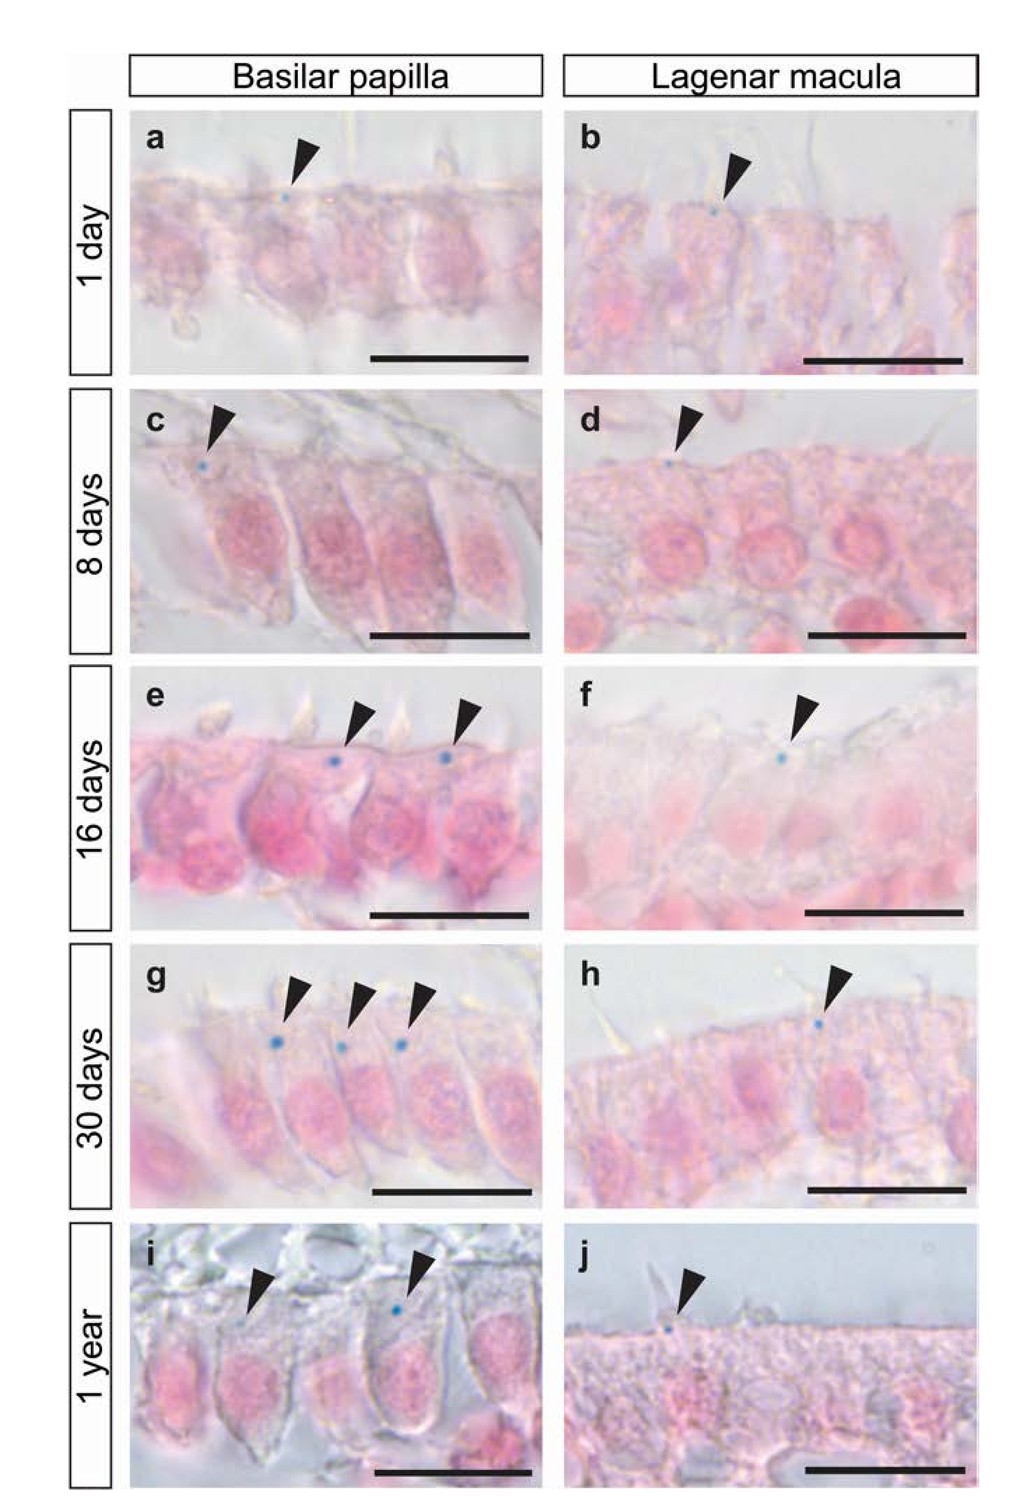
Developmental time line of iron-rich organelles.
(a–j) Images of histological sections from the basilar papilla and lagenar macula of 1 day (a and b), 8 days (c and d), 16 days (e and f), 30 days (g and h) and 1 year old pigeons (i and j) stained with Prussian blue and Nuclear Fast Red. Arrowheads highlight the Prussian blue positive cuticulosomes. Scale bars represent 10 μm. We have replicated this staining more than five times.
Figure 1—figure supplement 2
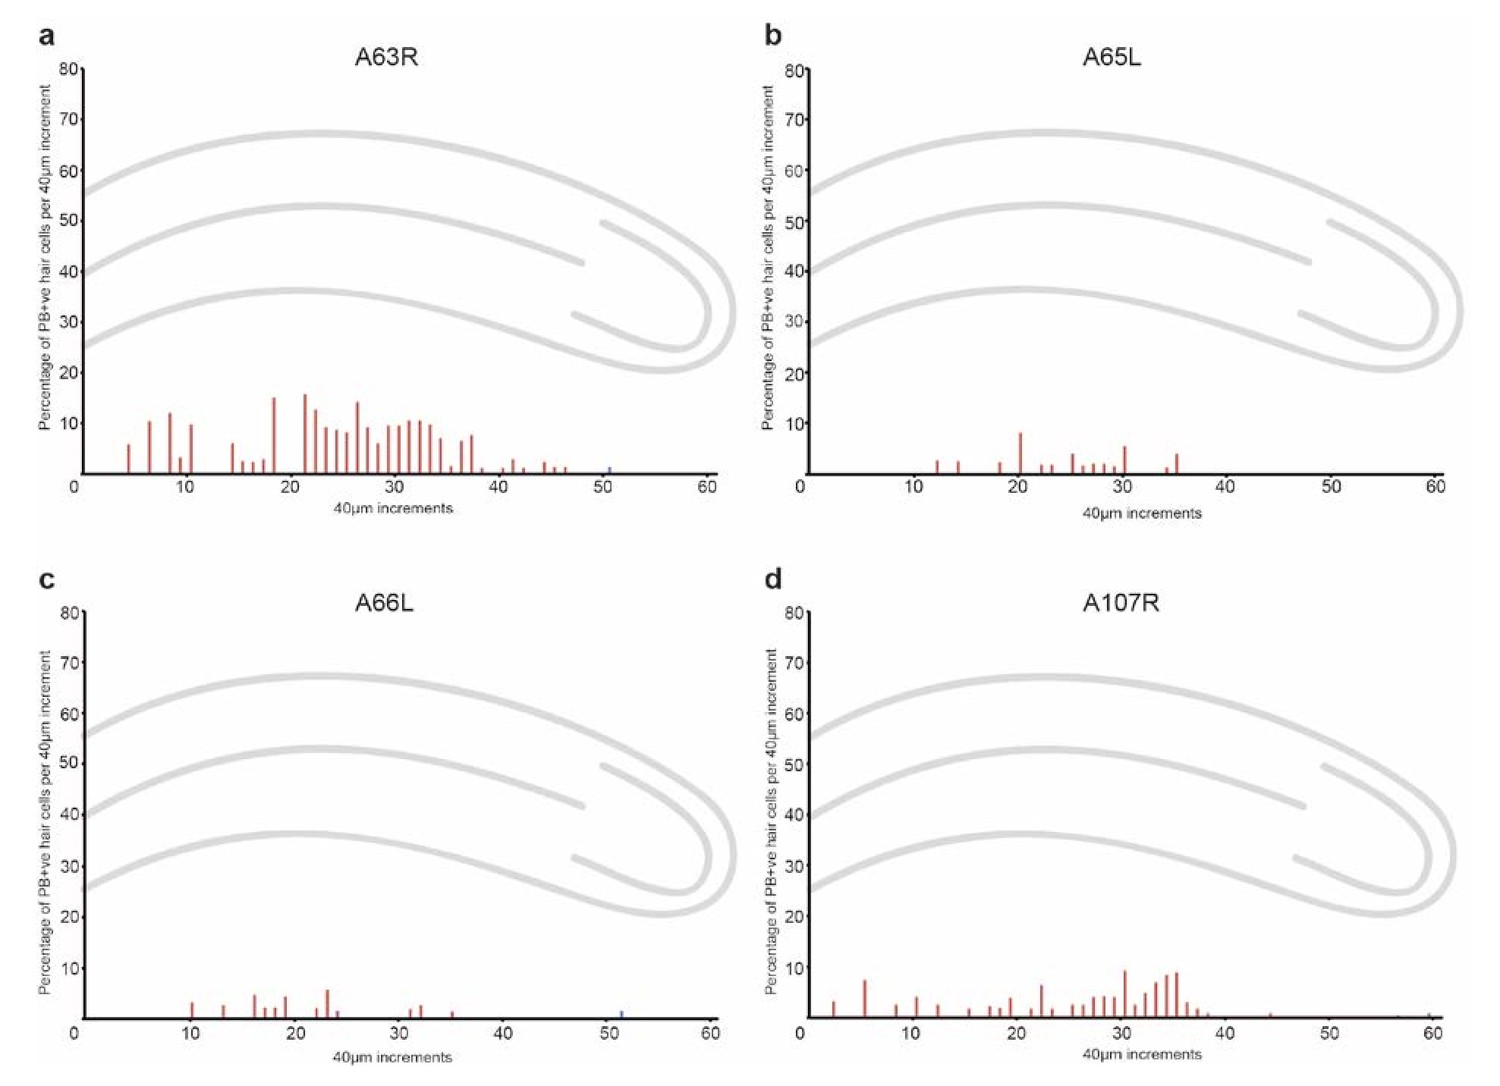
Quantitation and distribution of iron-rich organelles in the cochlear duct of 1 day old pigeons.
Graphs show the percentage of PB +ve hair cells along the length of the basilar papilla (shown in red) and the lagena (shown in blue) in 40 µm increments from four individual birds.
Figure 1—figure supplement 3
Quantitation and distribution of iron-rich organelles in the cochlear duct of 8 day old pigeons.
Graphs show the percentage of PB +ve hair cells along the length of the basilar papilla (shown in red) and the lagena (shown in blue) in 40 µm increments from three individual birds.
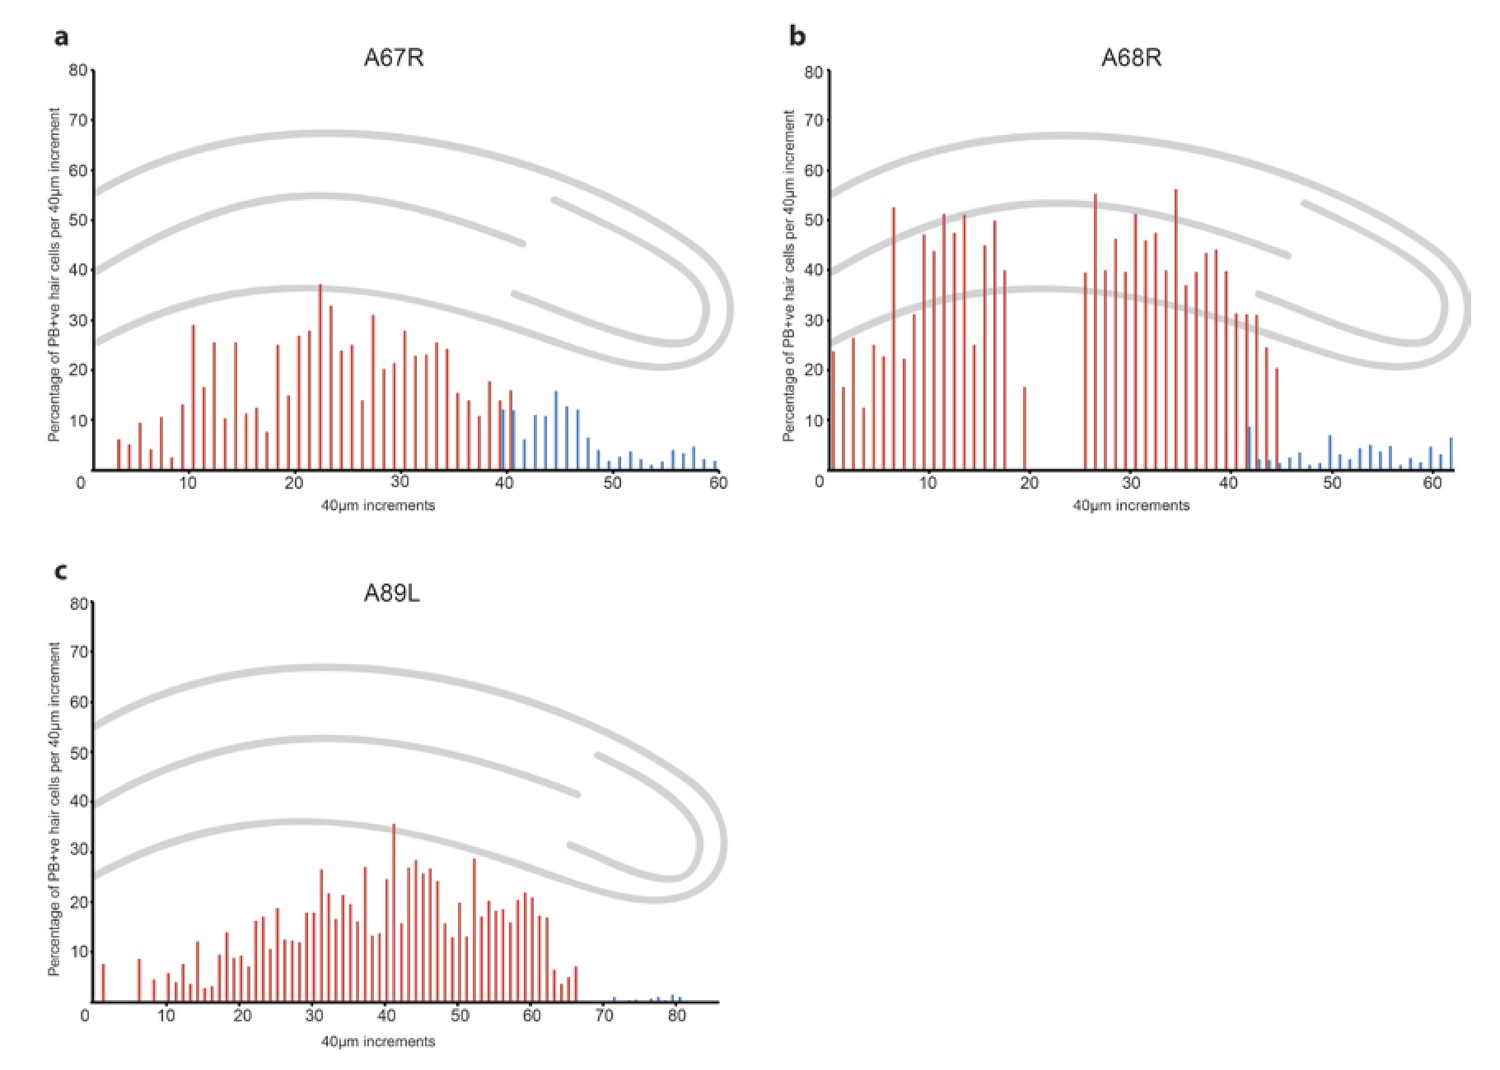
Figure 1—figure supplement 4
Quantitation and distribution of iron-rich organelles in the cochlear duct of 16 day old pigeons.
Graphs show the percentage of PB +ve hair cells along the length of the basilar papilla (shown in red) and the lagena (shown in blue) in 40 µm increments from six individual birds.
Figure 1—figure supplement 5
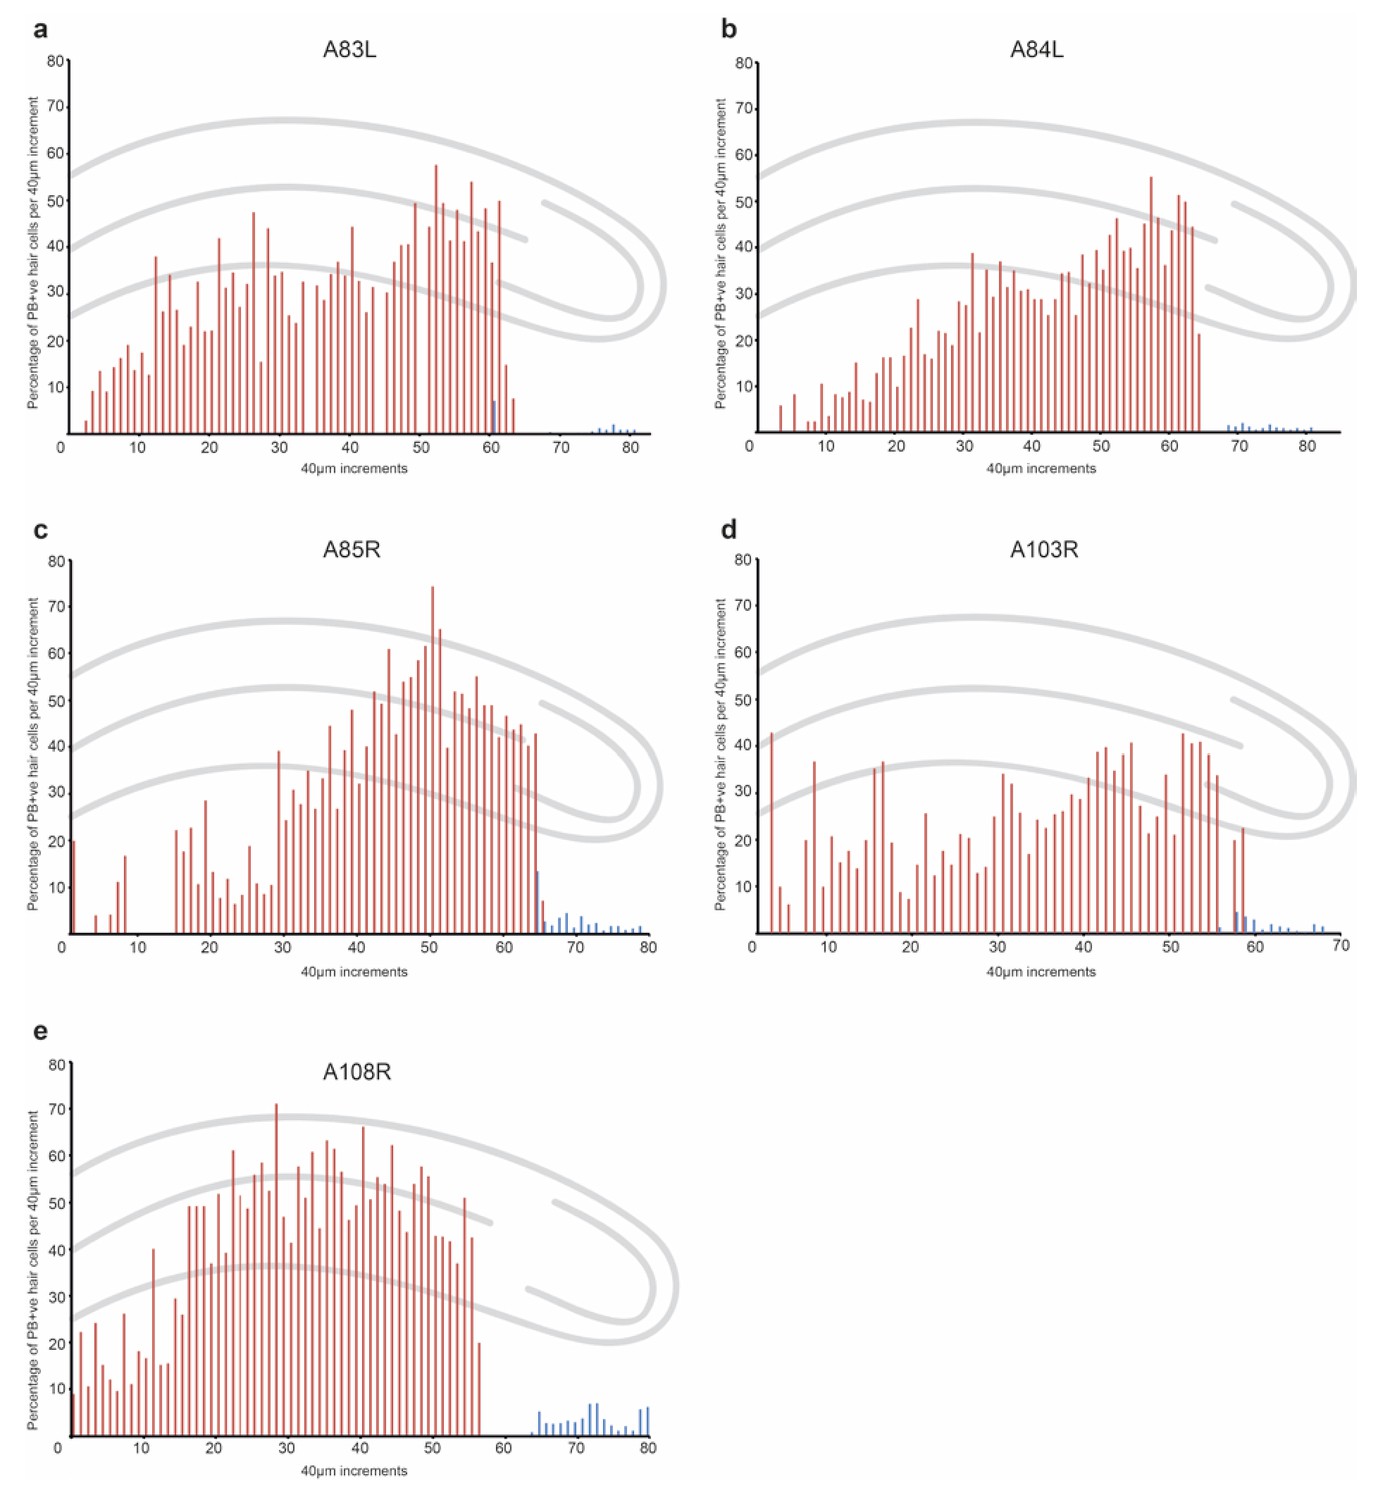
Quantitation and distribution of iron-rich organelles in the cochlear duct of 30 day old pigeons.
Graphs show the percentage of PB +ve hair cells along the length of the basilar papilla (shown in red) and the lagena (shown in blue) in 40 µm increments from five individual birds.
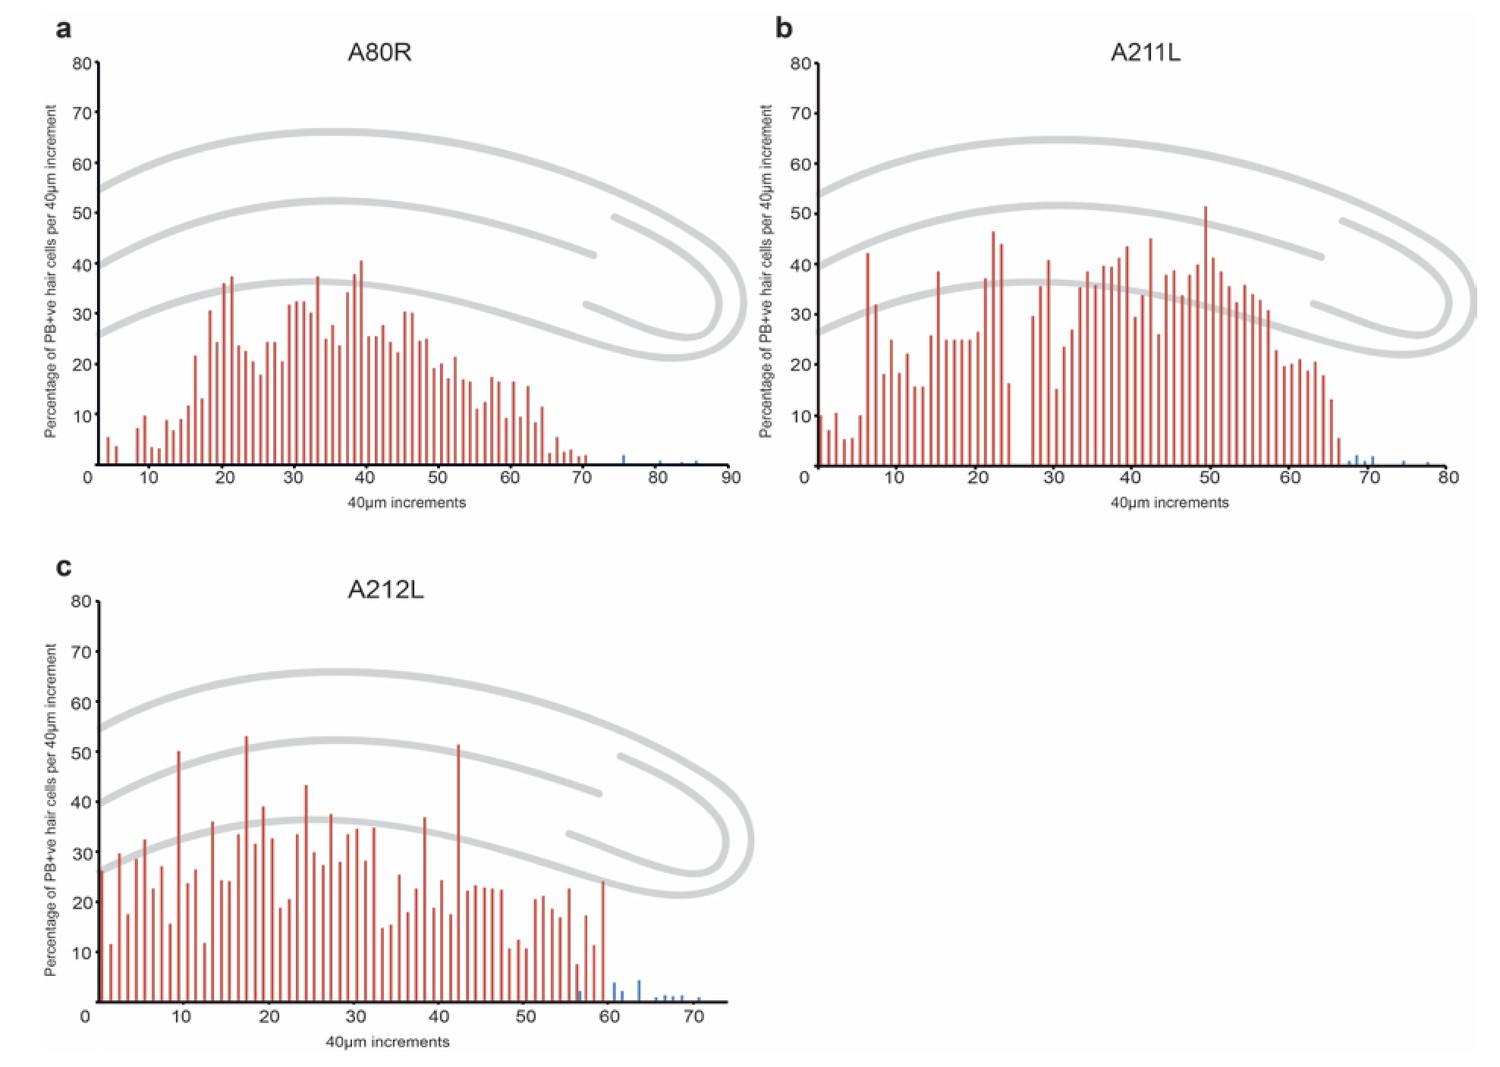
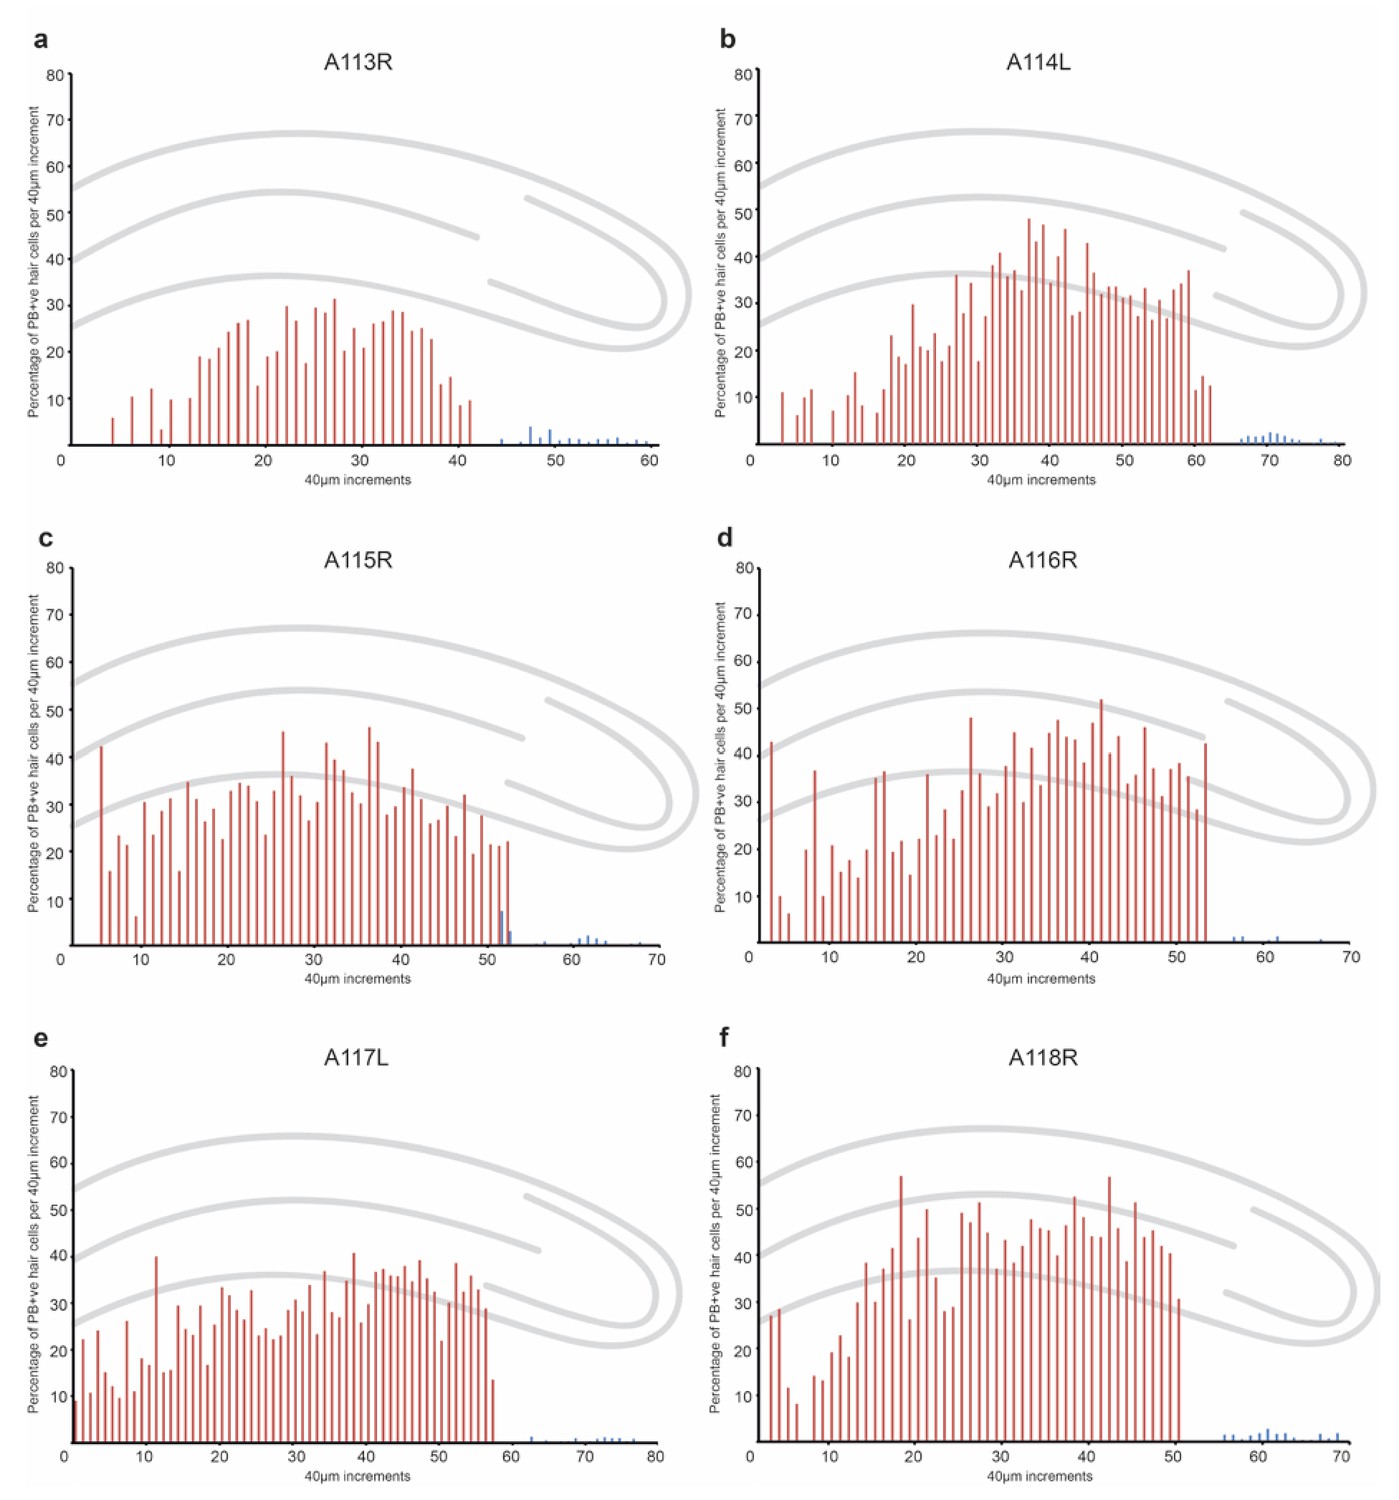
Figure 1—figure supplement 6
Quantitation and distribution of iron-rich organelles in the cochlear duct of 1 year old pigeons.
Graphs show the percentage of PB +ve hair cells along the length of the basilar papilla (shown in red) and the lagena (shown in blue) in 40 µm increments from three individual birds.
Figure 2 with 1 supplement
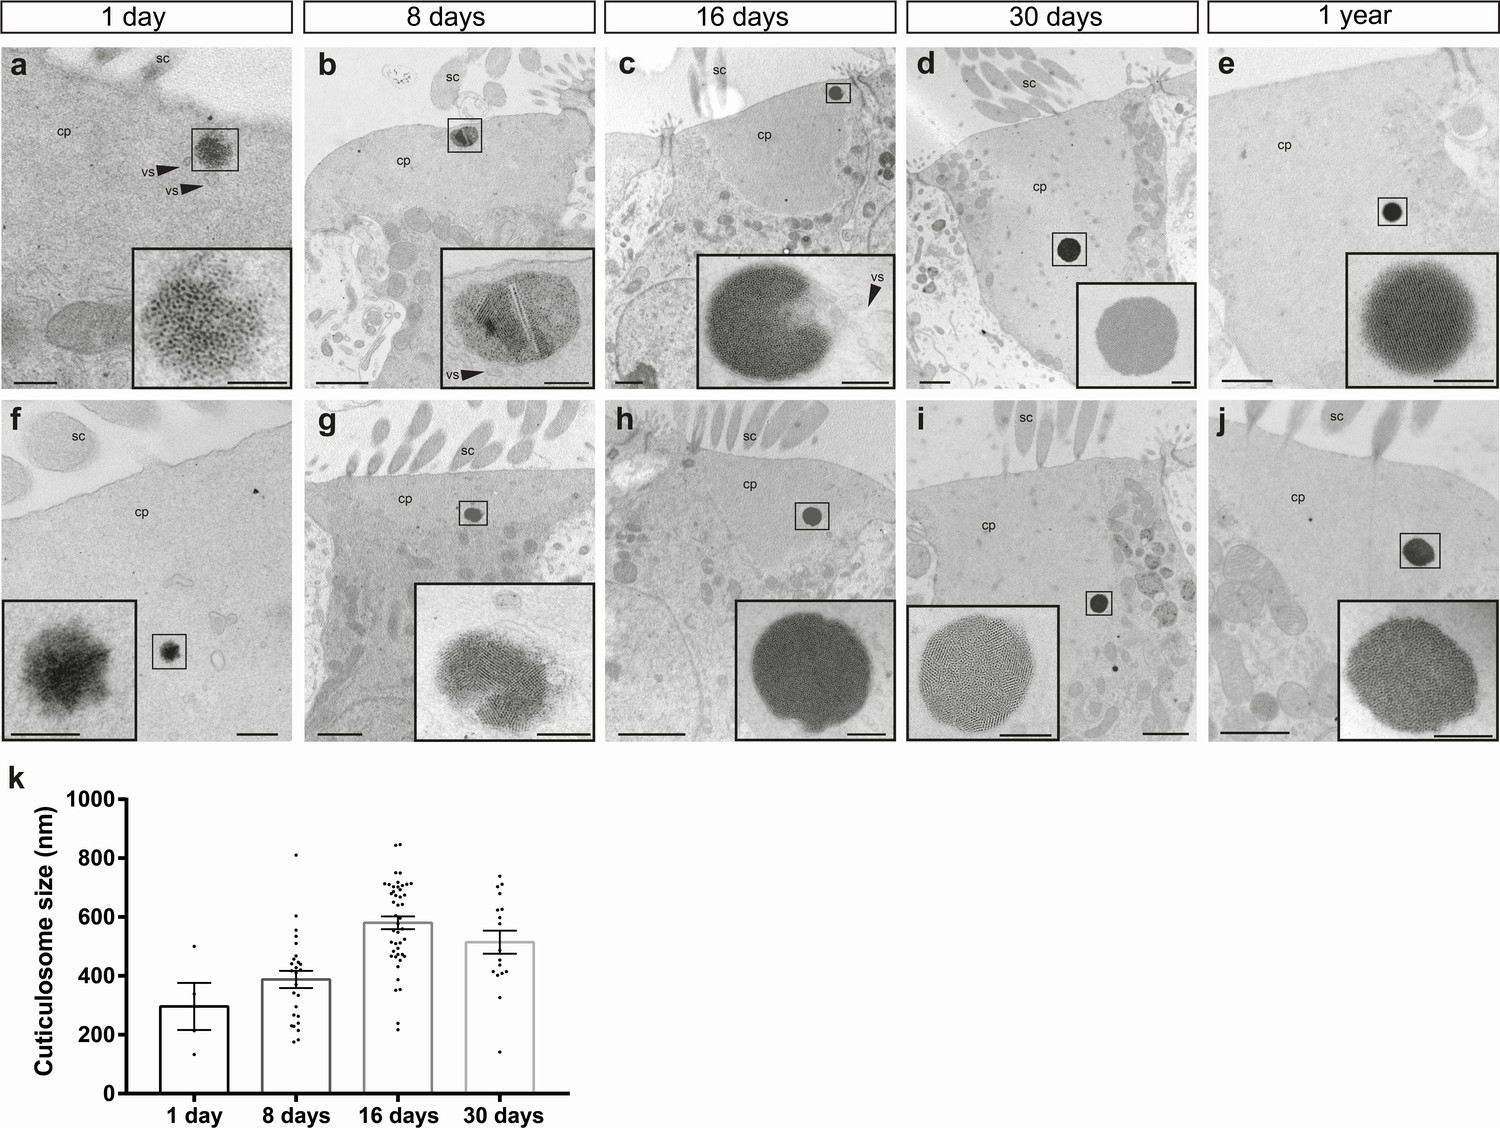
Subcellular architecture of iron-rich organelles during development.
(a–h) Electron micrographs showing cuticulosomes in the cuticular plate (cp) apically located beneath the stereocilia (sc) in hair cells from the basilar papilla of 1 day (a and f), 8 day (b and g), 16 day (c and h), 30 day (d and i) and 1 year old pigeons (e and j). At hatching cuticulosomes are amorphous aggregations of ferritin nanoparticles, that increase in size, density and organisation as they mature. In some cases, cuticulosomes are organized in paracrystalline arrays (e and inset), surrounded by membranes (c, h and insets) and decorated with vesicles (vs) (a,b, c, and insets). (i) Graph showing the mean diameter of cuticulosomes from the basilar papilla of 1 day (296.4 ± 69.2 nm, n = 3 birds, n = 4 cuticulosomes), 8 day (387.9 ± 29.0 nm, n = 3 birds, n = 26 cuticulosomes), 16 day (580.7 ± 21.7 nm, n = 3 birds, n = 45 cuticulosomes) and 30 day old birds (514.3 ± 38 nm, n = 3 birds, n = 17 cuticulosomes). Dots show measurements for individual cuticulosomes. Error bars show the mean ± SEM. Scale bars represent 0.25 μm in a and f, 1 μm in b, c, d,e, g, h, i and j, 200 nm in insets of b, c, d, e, g, h, i and j and 100 nm in insets of a and f.
-
Figure 2—source data 1
Properties of cuticulosomes at different ages.
This table shows the percent of cuticulosomes that are surrounded by membranes, associated with vesicles, have a paracrystalline organisation, and those that are incomplete at 1 day, 8 days, 16 days, 30 days and 1 year. Data for 1 year was taken from (Lauwers et al., 2013).
- https://doi.org/10.7554/eLife.29959.012
Figure 2—figure supplement 1
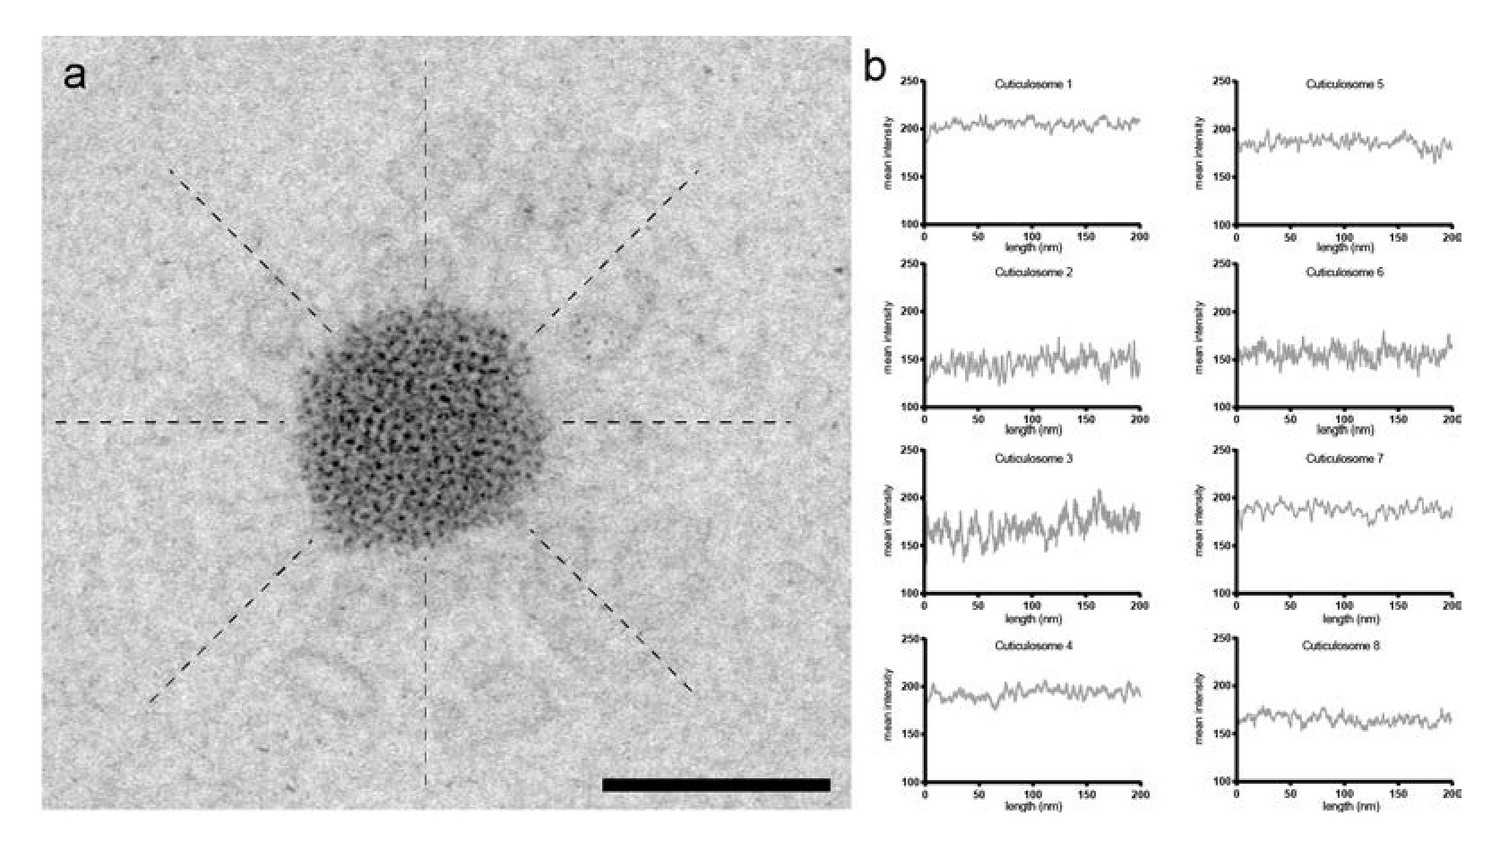
Density analysis of the cuticular plate.
(a) Electron micrograph of a cuticulosome of an 8 day old pigeon. Lines were drawn (200 nm in length) radially from the edge of cuticulosomes at 45° intervals. The mean density along these lines was plotted (n = 3 birds aged 8 days) and shown in (b). Scalebar in a shows 200 nm.
Figure 3 with 4 supplements
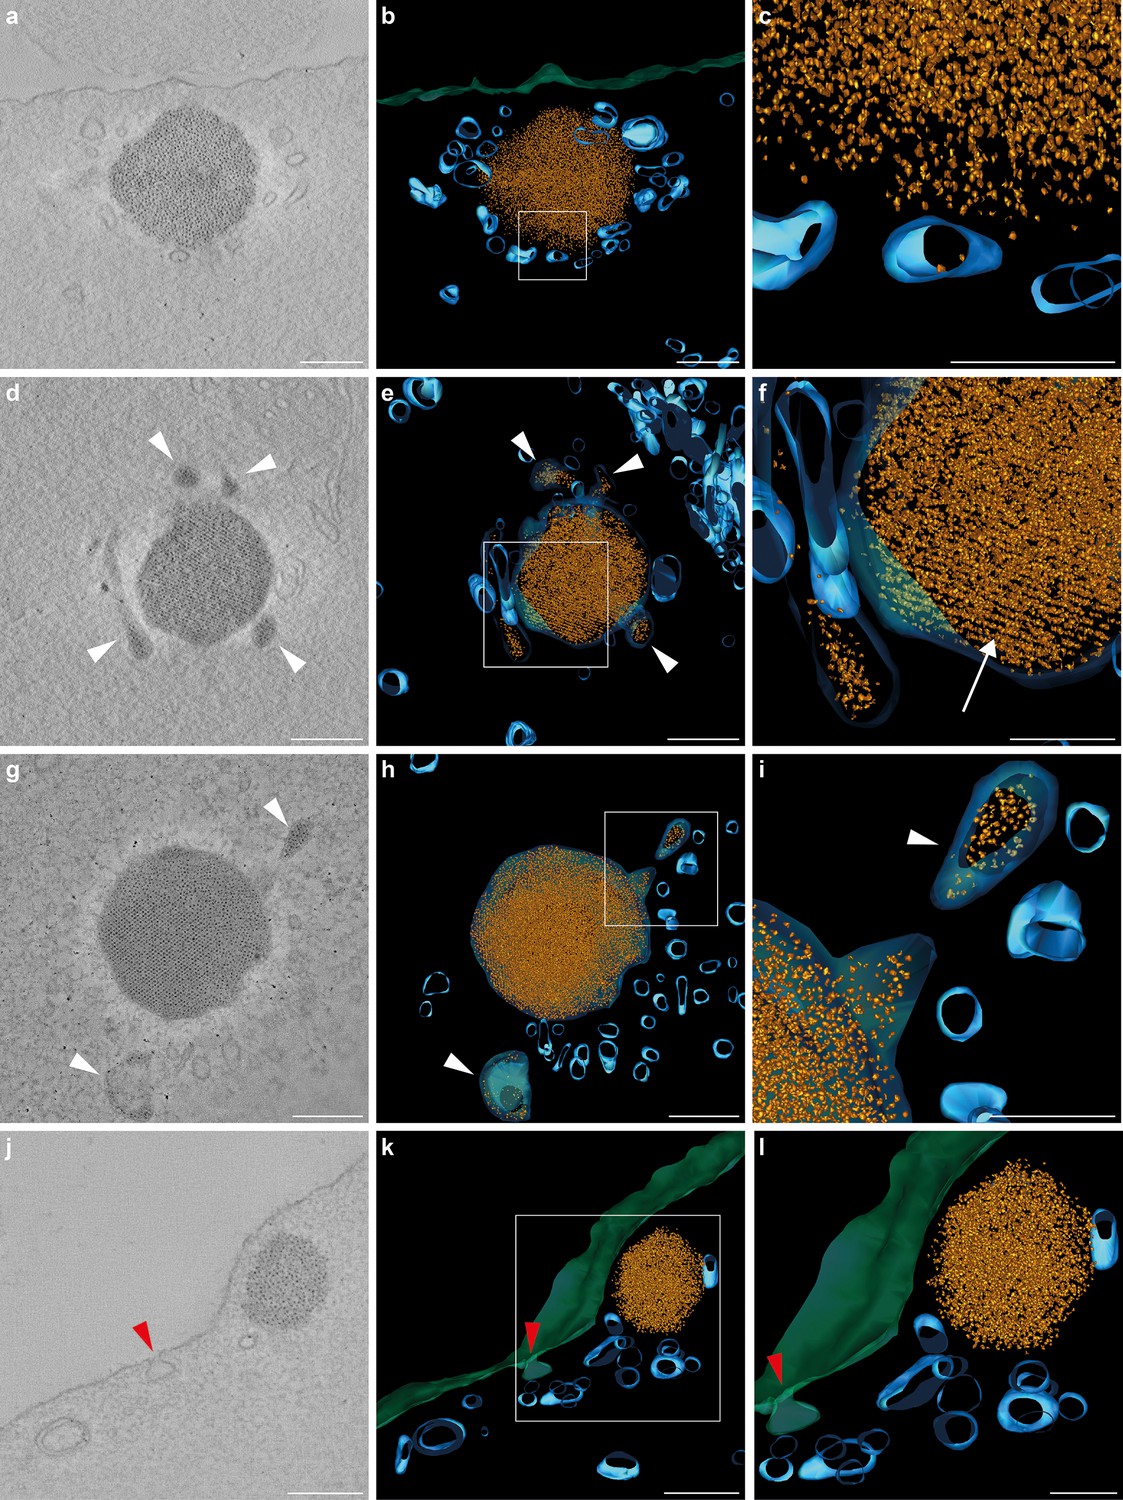
Tomograms and three-dimensional reconstructions of cuticulosomes in 8 days old pigeons.
(a, d, g, j) Images of 9 nm thick sections computational derived from tomograms of cuticulosomes from the basilar papillar of pigeons aged 8 days (n = 3 birds, n = 4 cells). (b, e, h, k) 3D-reconstructions of the cuticulosomes shown in panels a, d, g and j. Ferritin nanoparticles are shown in gold, vesicular structures in blue, and the apical membrane of the hair cell in green (c, f, i, l). Enlargements of boxes shown in b, e, h and k. In some, but not all, cases ferritin nanoparticles can be observed within vesicles (highlighted with a white arrowhead). In panels h and i a vesicle containing ferritin nanoparticles is visible and appears to be fusing with a larger membrane-bound cuticulosome. Note that in panels e and f the cuticulosome exhibits partial paracrystalline organisation with a linear arrangement of ferritin nanoparticles (highlighted with a white arrow). In panels j, k and l, the apical membrane of the cell is invaginated, indicative of an endocytotic event, with an accumulation of intracellular vesicles in its vicinity (red arrowheads). Scale bars show 200 nm in panels a, b, d, e, g, h, j and k and 100 nm in panels c, f, i and l.
Figure 3—video 1
Tomographic reconstruction of a developing cuticulosome.
This movie shows a tomographic model of a developing cuticulosome in a 8 day old pigeon. The model was generated from a dual axis tilt series with a tilt range from −60° to +60° with one degree increments. Ferritin nanoparticles are shown in gold, vesicular structures in blue, and the apical membrane of the hair cell in green. This cuticulosome is in close proximity to the membrane of the hair cell and is surrounded by numerous vesicular structures.
Figure 3—video 2
Tomographic reconstruction of a developing cuticulosome.
This movie shows a tomographic model of a developing cuticulosome in a 8 day old pigeon. The model was generated from a dual axis tilt series with a tilt range from −60° to +60° with one degree increments. Ferritin nanoparticles are shown in gold, vesicular structures in blue, and the apical membrane of the hair cell in green. Notably this membrane-bound cuticulosome is surrounded by a number of vesicles that contain ferritin nanoparticles, and the central organelle exhibits partial paracrystalline organisation.
Figure 3—video 3
Tomographic reconstruction of a developing cuticulosome.
This movie shows a tomographic model of a developing cuticulosome in a 8 day old pigeon. The model was generated from a dual axis tilt series with a tilt range from −60° to +60° with one degree increments. Ferritin nanoparticles are shown in gold, vesicular structures in blue, and the apical membrane of the hair cell in green. This membrane-bound cuticulosome is surrounded by a number of vesicles, two containing ferritin nanoparticles.
Figure 3—video 4
Tomographic reconstruction of a developing cuticulosome.
This movie shows a tomographic model of a developing cuticulosome in a 8 day old pigeon. The model was generated from a dual axis tilt series with a tilt range from −60° to +60° with one degree increments. Ferritin nanoparticles are shown in gold, vesicular structures in blue, and the apical membrane of the hair cell in green. This cuticulosome is in close proximity to the membrane of the hair cell, and a trail of vesicles appear to originate from the lateral edge of the cuticular plate. At a single locus the apical membrane of the cell is envaginated indicative of an endocytotic/exocytotic event.
Figure 4 with 2 supplements

Heavy chain ferritin is a component of the cuticulosome.
(a–c) Transmitted light images of sections of the basilar papilla of 1 day, 8 days and 1 year old pigeons. Cuticulosomes are highlighted with black arrows. (d–f) Confocal images of the same sections, showing immunoreactivity of cuticulosomes with sera against ferritin heavy chain. Punctate structures are highlighted with white arrows. (g–i) Merged images of transmitted light and immunostainings confirming that heavy chain ferritin staining co-localizes with cuticulosomes. (j–l) Confocal images of basilar papilla whole mounts from 1 day, 8 days and 1 year old pigeons stained with sera against ferritin and actin. The ferritin positive cuticulosomes, shown in red, are highlighted with white arrows and the actin rich stereocilia are shown in green. All scale bars show 10 μm. We have replicated this experiment three times.
Figure 4—figure supplement 1
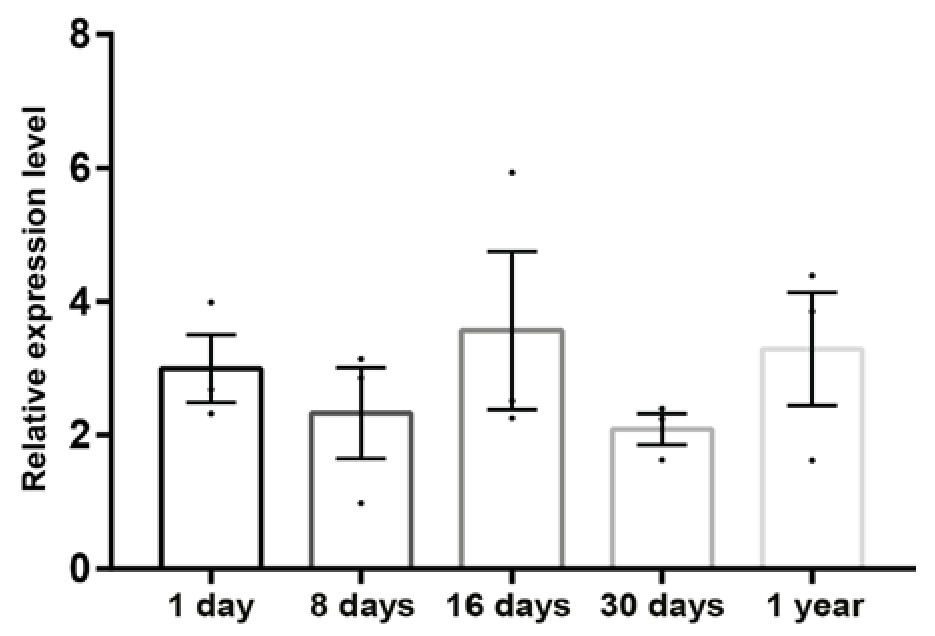
Ferritin expression during development.
Quantitative real-time PCR results for Ferritin heavy chain from isolated hair cell layers of pigeons aged 1 day, 8 days, 16 days, 30 days and 1 year (n = 3 birds per timepoint). Expression levels were calculated relative to the geometric mean of the control genes GAPDH and HPRT and are plotted as mean ± SEM. Ferritin heavy chain is expressed at high levels throughout development.
Figure 4—figure supplement 2
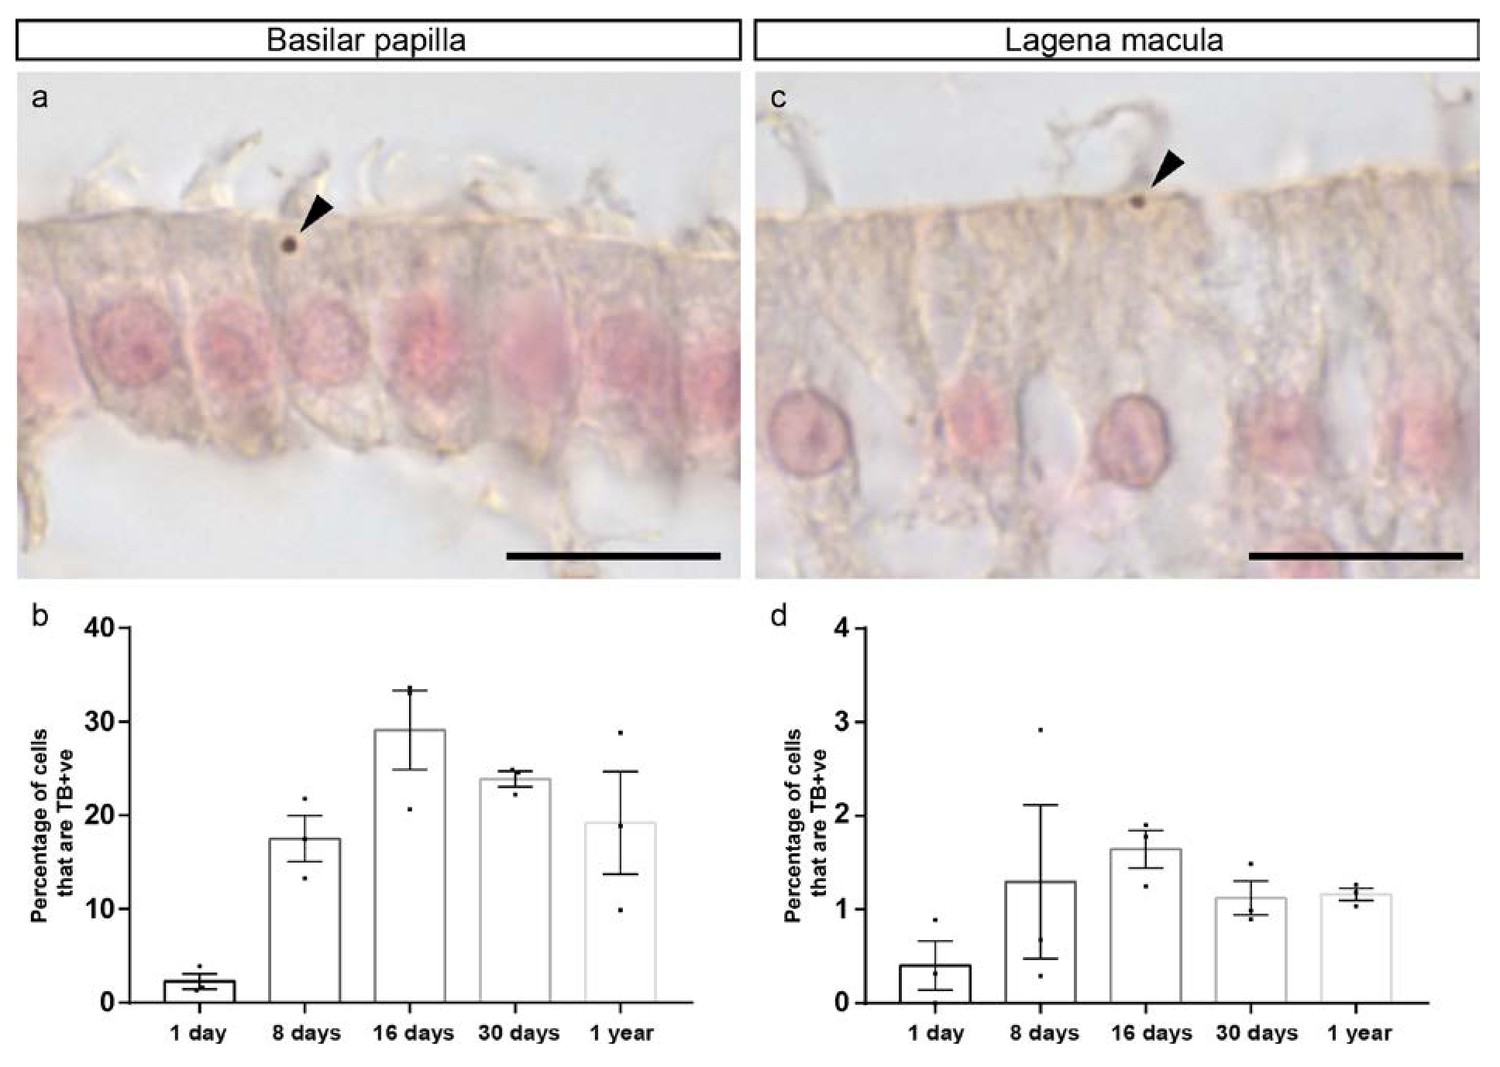
Quantitation of Turnbull blue positive hair cells.
(a and c) Images of histological sections from the basilar papilla (a) and lagenar macula (c) of a 16 days old pigeon stained with Turnbull blue (TB), intensified with DAB and counterstained with Nuclear Fast Red. Arrowheads highlight the Turnbull blue positive cuticulosomes. (b) Graph showing the percentage of hair cells that contain Turnbull blue positive cuticulosomes in the basilar papilla of 1 day old pigeons (2.27%, n = 3 birds, n = 841 cells), 8 day old pigeons (17.5%, n = 3 birds, n = 536 cells), 16 day old pigeons (29.12%, n = 3, n = 796 cells), 30 day old pigeons (23.9%, n = 3 birds, n = 881 cells) and 1 year old pigeons (19.2%, n = 3 birds, n = 905 cells). Dots show the percentage of TB +ve hair cells in individual birds. (d) Graph showing the percentage of hair cells that contain Turnbull blue positive cuticulosomes in the lagenar macula of 1 day old pigeons (0.4%, n = 3 birds, n = 962 cells), 8 day old pigeons (1.3%, n = 3 birds, n = 2007 cells), 16 day old pigeons (1.64%, n = 3, n = 2935 cells), 30 day old pigeons (1.12%, n = 3 birds, n = 2678 cells) and 1 year old pigeons (1.16%, n = 3 birds, n = 3104 cells). Dots show the percentage of TB +ve hair cells in individual birds. Error bars represent the mean ± SEM. Scale bars represent 10 μm.
Figure 5 with 1 supplement
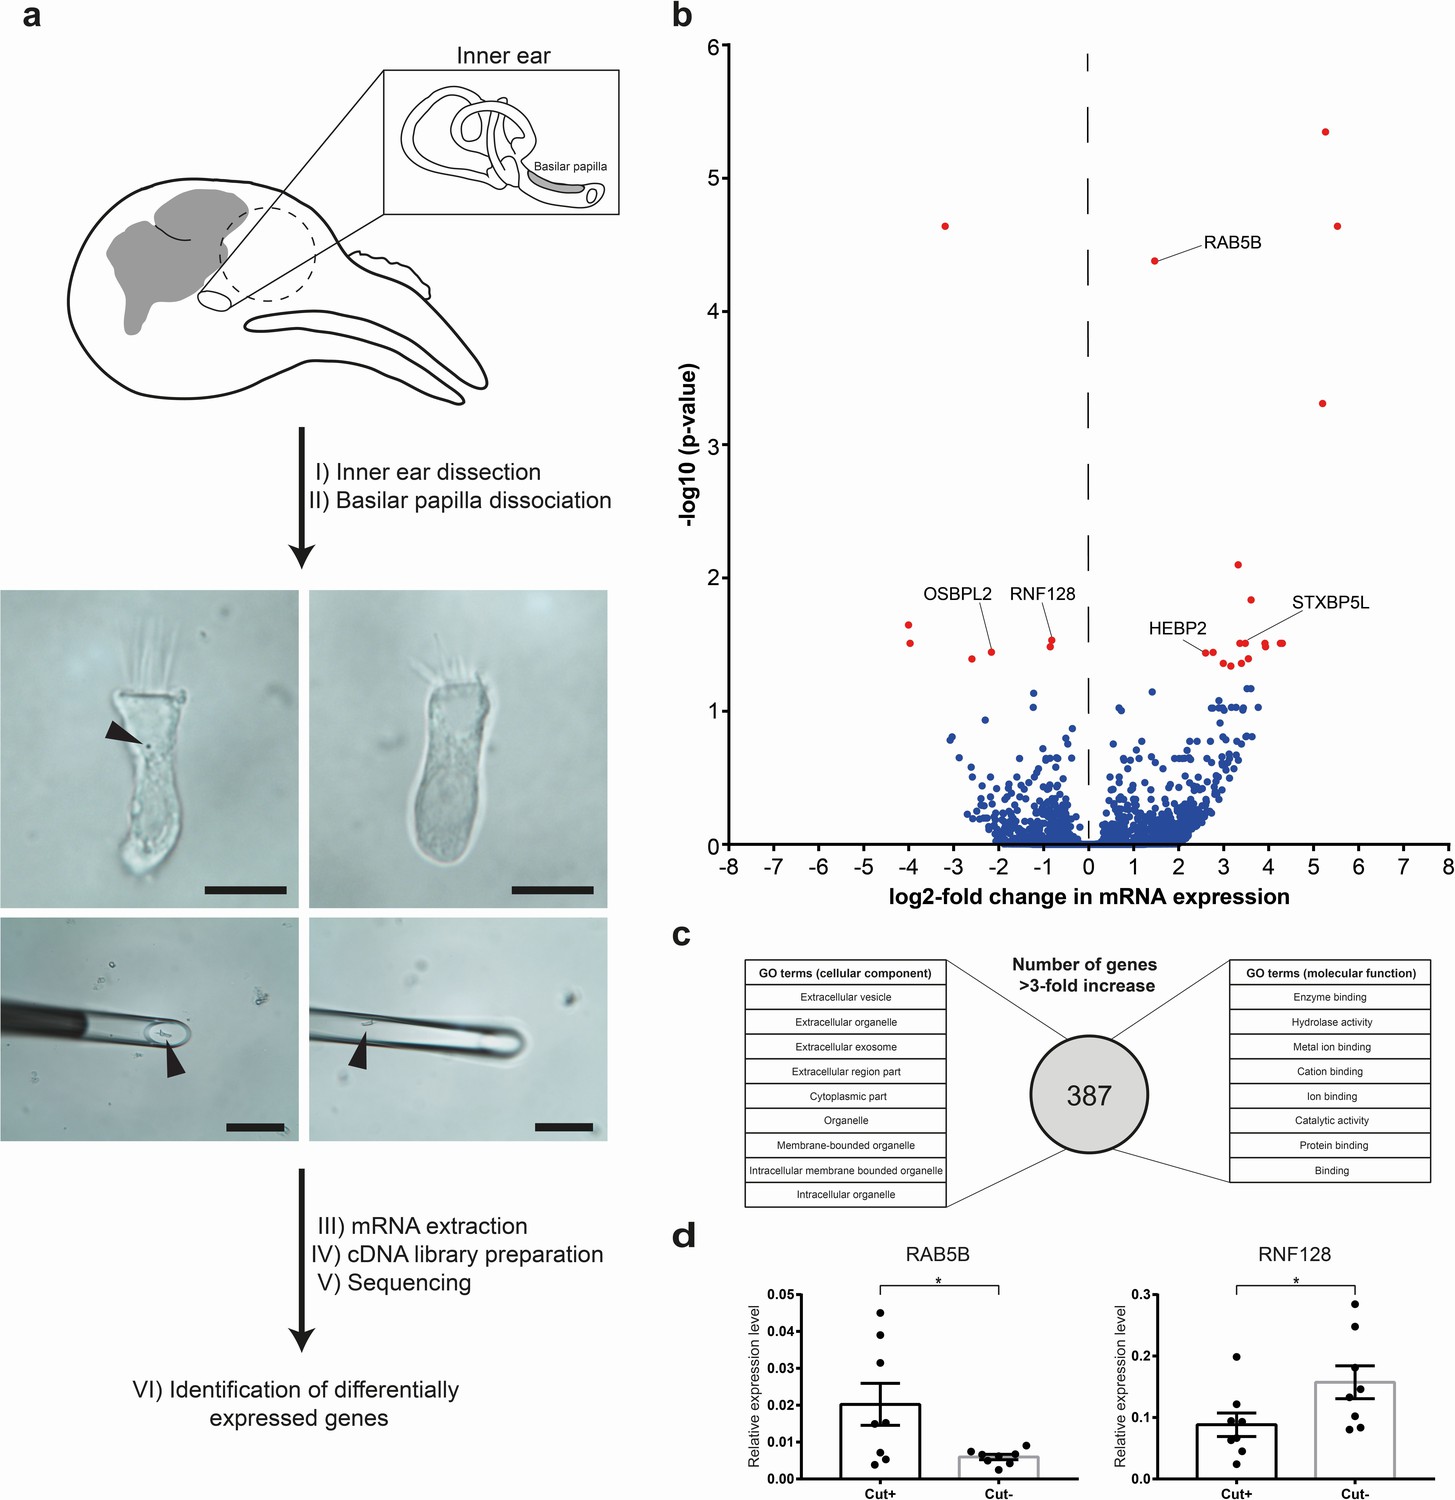
Transcriptomic analysis of hair cells with or without cuticulosomes.
(a) Diagram showing the methodology employed for transcriptomic analysis. Following the dissection of the cochlear duct and removal of the lagena, the basilar papilla and surrounding tissue were subject to light trypsinization. Hair cells with (n = 30 hair cells, n = 9 birds), or without cuticulosomes (n = 30 hair cells, n = 9 birds), were then picked with a micromanipulator at 4°C. Following RNA extraction, and cDNA library preparation, next generation sequencing was performed, transcripts annotated and subject to differential gene expression analysis. (b) Volcano plot showing differential gene expression analysis between hair cells with and without cuticulosomes (n = 9 birds). The x-axis shows the log2-fold change in mRNA expression level when comparing hair cells with and without cuticulosomes and the y-axis shows corresponding adjusted P-values (-log10 scaled). Genes with a P- value ≤0.05, following correction for multiple testing, are highlighted in red. (c) Diagram representing the results of the gene ontology analysis for the 387 genes that were upregulated (more than 3-fold increase) in cuticulosome positive hair cells. (d) Quantitative real-time PCR results for RAB5B and RNF128 confirming differential expression of these transcripts in cuticulosome positive and cuticulosome negative cells (n = 8 birds). Gene expression levels of individual genes were calculated relative to the geometric mean of the control genes GAPDH and HPRT and plotted as mean ± SEM. (*p-value<0.05, paired one-tailed t-test). The scale bars in a represent 10 μm in the top panels and 100 μm in the bottom panels.
-
Figure 5—source data 1
Transcripts Identified by RNA Sequencing.
List of all genes that were identified in the RNA sequencing experiment (mean FPKM >1), showing the log2-fold change between cuticulosome positive and negative hair cells, adjusted P-values, and expression levels (FPKM) for all individual samples.
- https://doi.org/10.7554/eLife.29959.023
-
Figure 5—source data 2
Significantly differentially expressed genes between hair cells with and without iron-rich organelles.
This table shows a list of adjusted p-values, log2-fold changes and general information about the genes that were significantly, differentially expressed between hair cells with and without cuticulosomesomes.
- https://doi.org/10.7554/eLife.29959.024
-
Figure 5—source data 3
GO enrichment analysis for ‘cellular component’.
This table shows all GO terms (cellular component) that were significantly enriched in genes that were upregulated in cuticulosome positive hair cells (>3 fold).
- https://doi.org/10.7554/eLife.29959.025
-
Figure 5—source data 4
GO enrichment analysis for ‘molecular function’.
This table shows all GO terms (molecular function) that were significantly enriched in genes that were upregulated in cuticulosome positive hair cells (>3 fold).
- https://doi.org/10.7554/eLife.29959.026
Figure 5—figure supplement 1
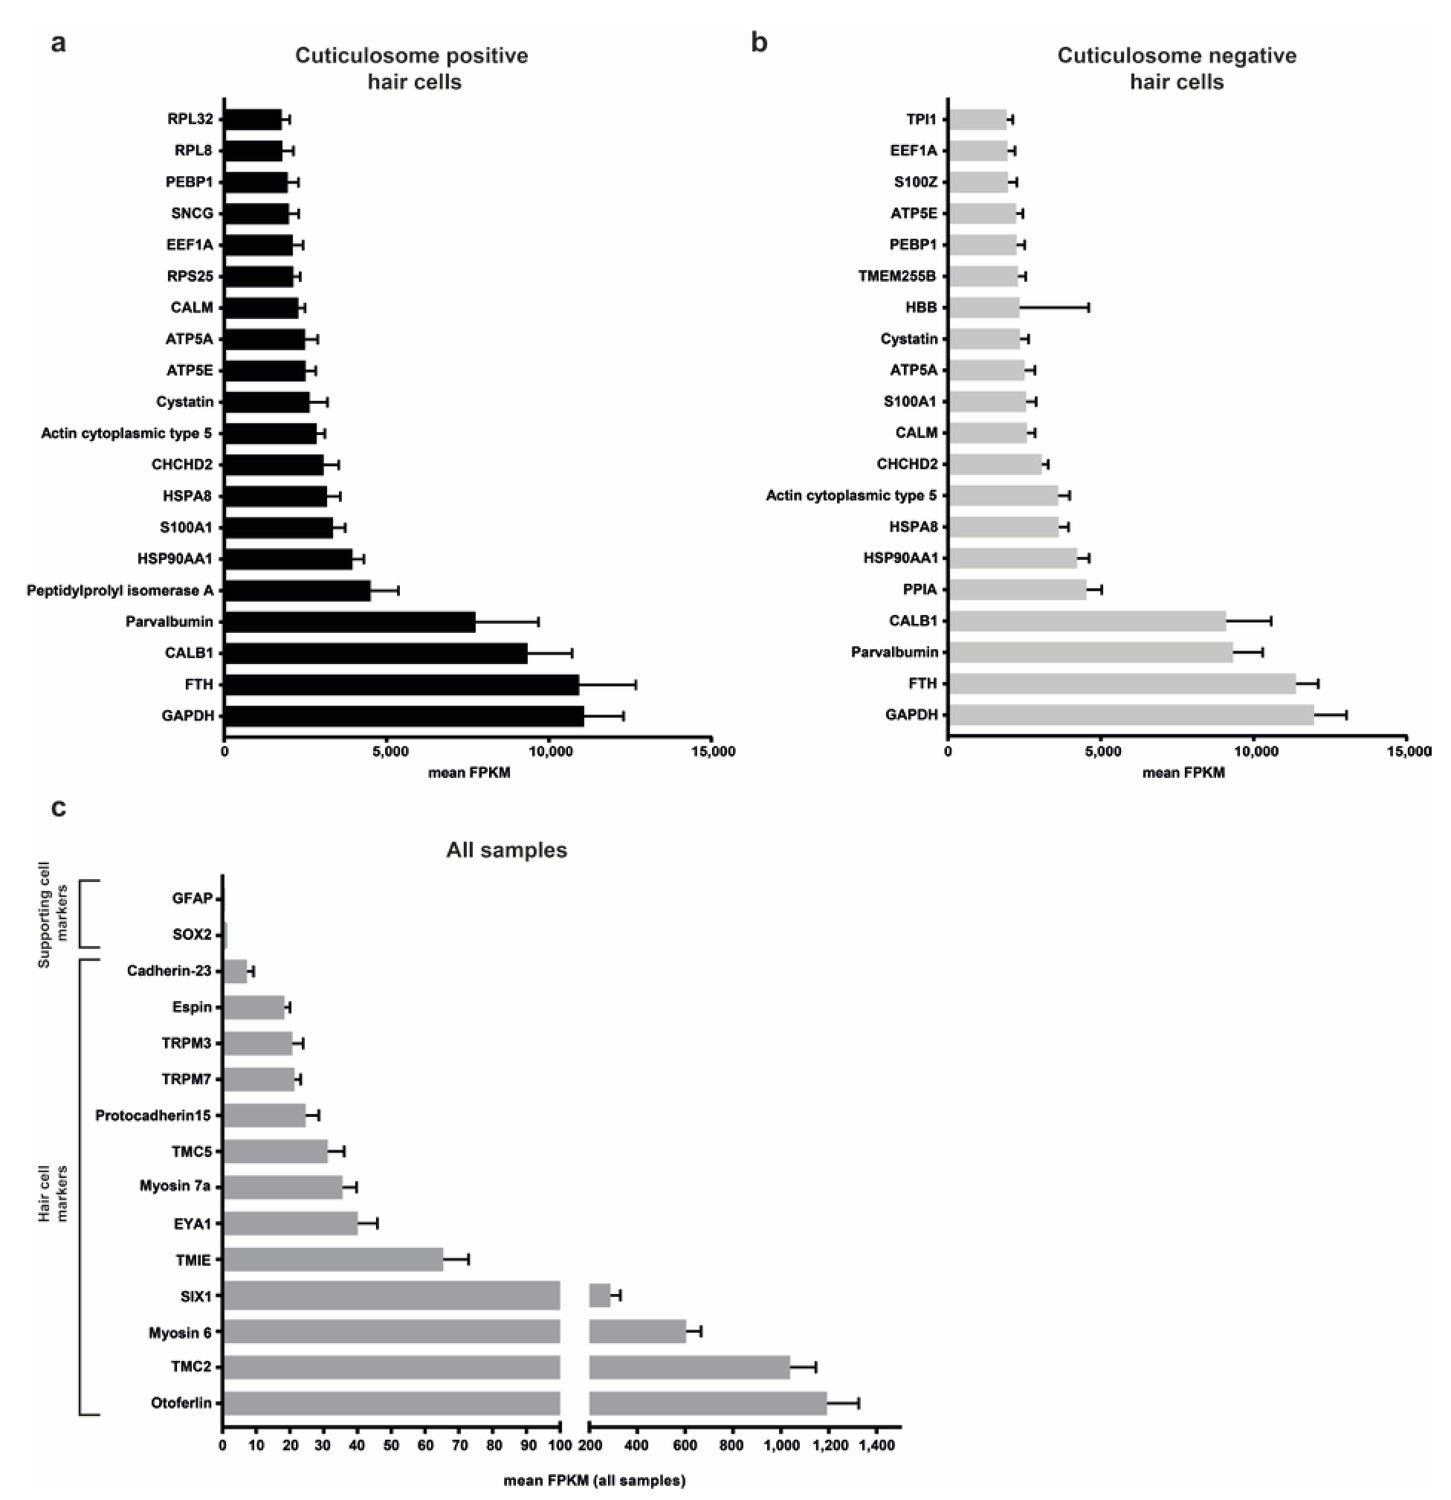
Analysis of RNA sequencing results.
(a and b) Graphs show the 20 highest expressed genes in cuticulosome positive and negative hair cells (mean FPKM, n = 9 per cell type). (c) Graph showing the expression levels (mean FPKM, all samples) of hair cell and supporting cell markers. Data are presented as mean ± SEM.
Figure 6
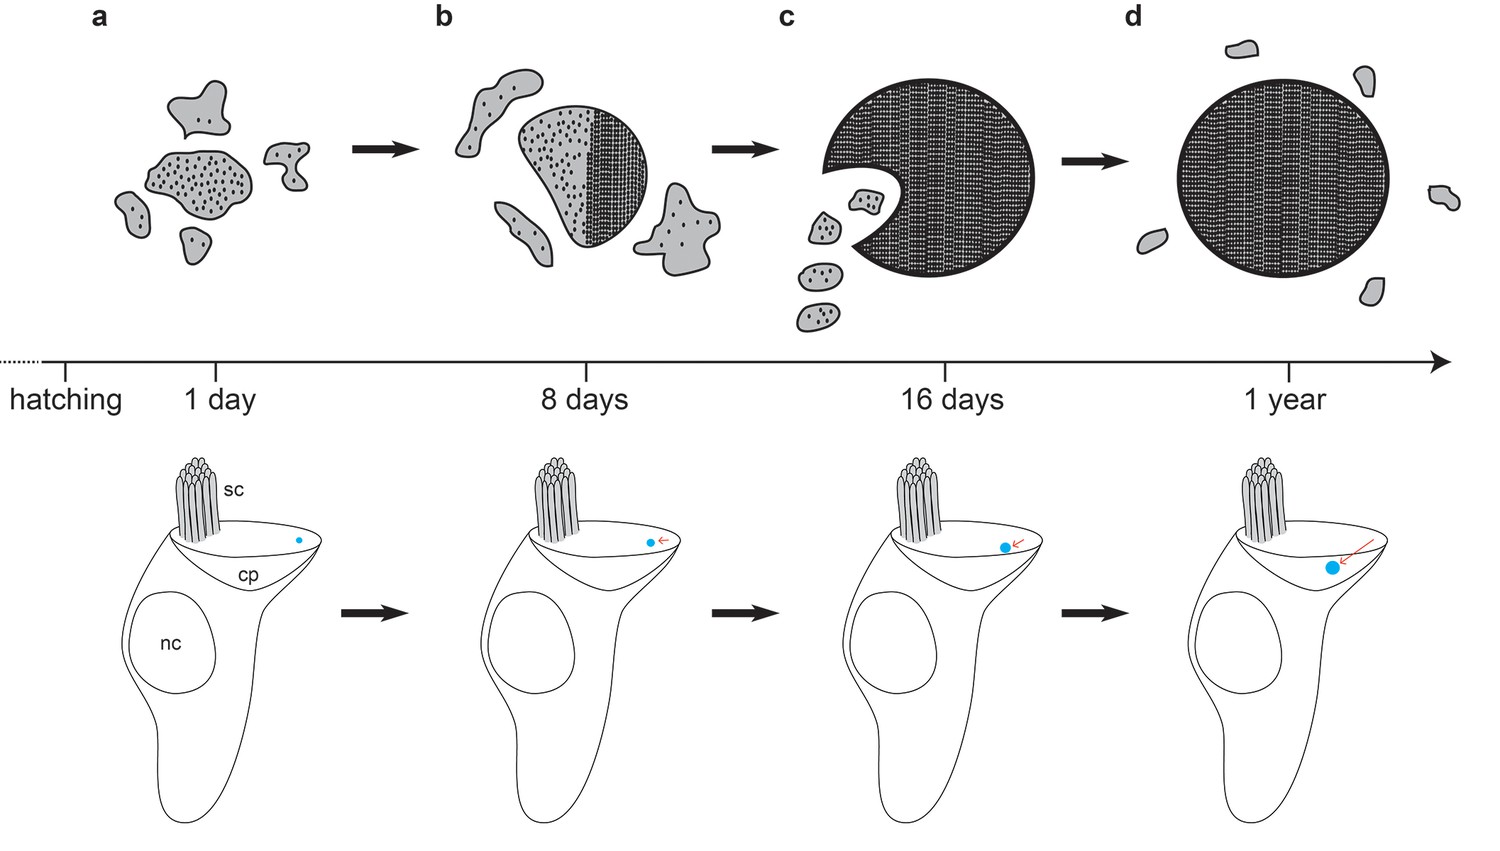
Model of cuticulosome development.
(a) Cuticulosomes start to form shortly after hatching at the lateral apical edge of the cuticular plate, opposite the kinocilium. They initially resemble electron dense accumulations of amorphous shape with a diameter of approximately 300 nm. (b) Eight days after hatching the percentage of cuticulosome containing hair cells in the basilar papilla has increased 8-fold (20%) in comparison to 1 day old pigeons (2.5%). The size of the cuticulosome has increased to approximately 400 nm in diameter, with a notable increase in density. This increase in density is correlated with the development of paracrystalline arrays which result in the alignment of the ferritin nanoparticles. (c) Sixteen days after hatching cuticulosomes have reached their mature size (~580 nm), and their position within the cuticular plate has become more medial and basal. Distinct trails of vesicles from the lateral boundary of the cuticular plate are evident in some instances. (d) At one year of age cuticulosomes are mature. Approximately one quarter are still associated with vesicular structures and some exhibit complete paracrystalline organisation.
Additional files
-
Transparent reporting form
- https://doi.org/10.7554/eLife.29959.028
Download links
A two-part list of links to download the article, or parts of the article, in various formats.
Downloads (link to download the article as PDF)
Open citations (links to open the citations from this article in various online reference manager services)
Cite this article (links to download the citations from this article in formats compatible with various reference manager tools)
Subcellular analysis of pigeon hair cells implicates vesicular trafficking in cuticulosome formation and maintenance
eLife 6:e29959.
https://doi.org/10.7554/eLife.29959


