Structure of PINK1 and mechanisms of Parkinson's disease-associated mutations
- University of Dundee, United Kingdom
- School of Life Sciences, University of Dundee, United Kingdom
Figures
Figure 1 with 1 supplement
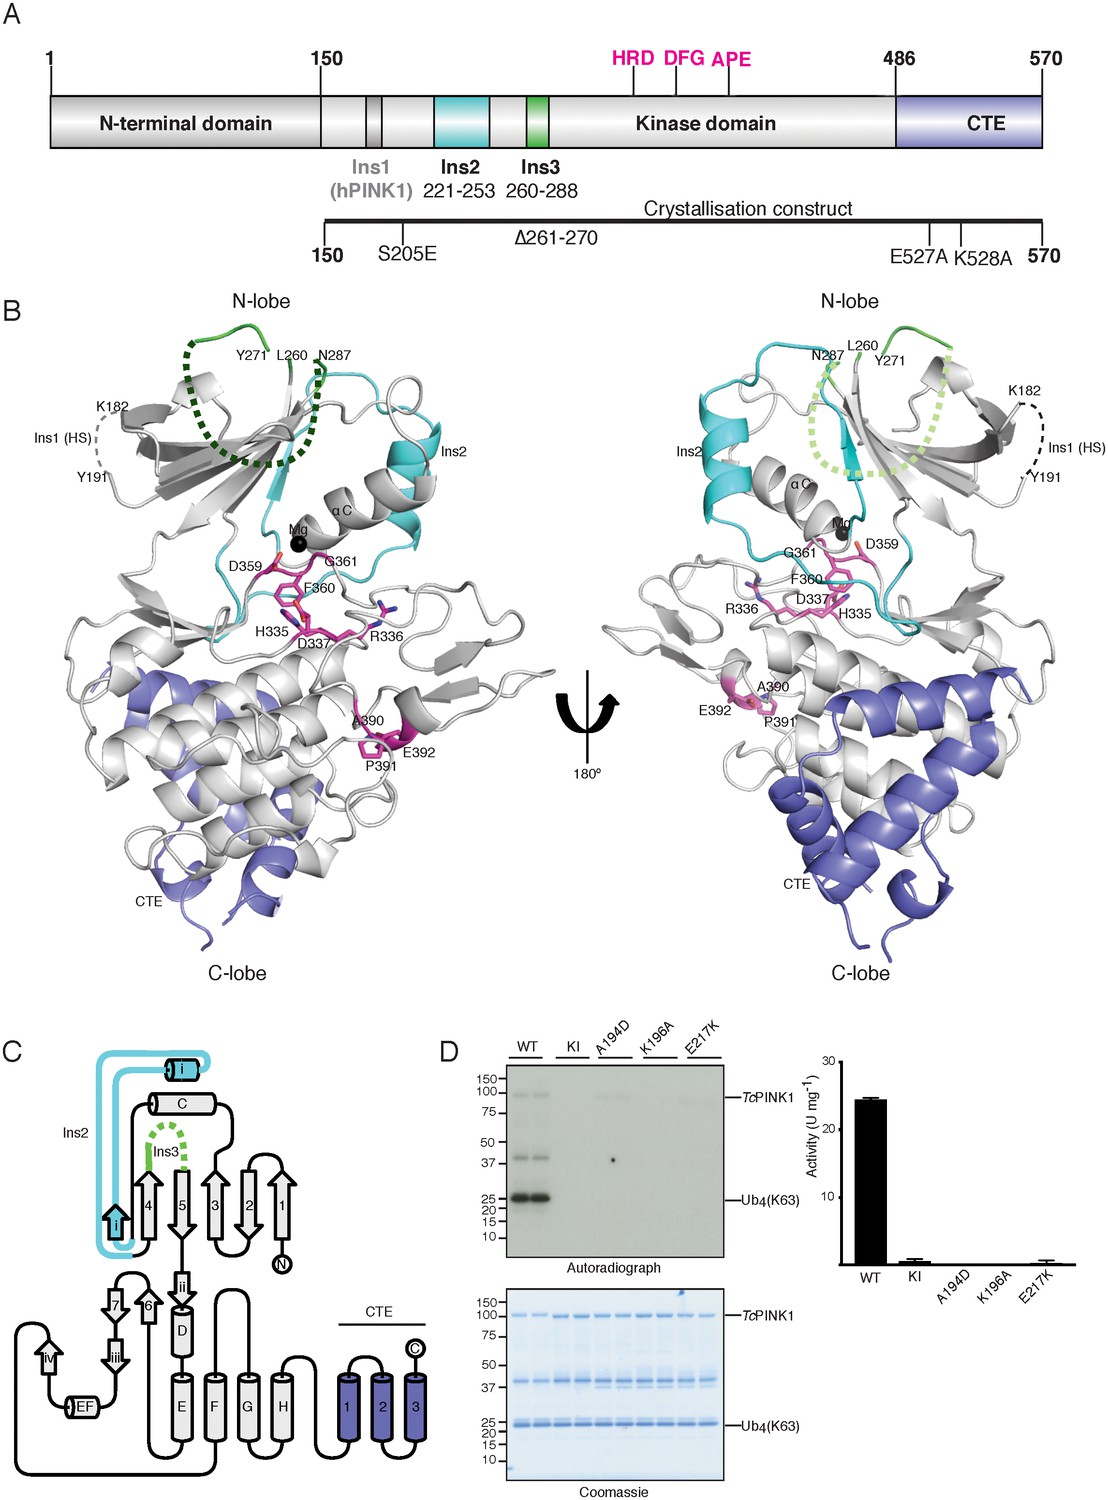
Overall structure of TcPINK1.
(A) Domain architecture of TcPINK1 showing kinase domain (150-486); location of Ins2, Ins3, catalytic motif (HRD) and activation loop motifs (DFG; APE) and CTE (487-570). The location of hPINK1 Ins1, which is largely absent in TcPINK1, is indicated. CTE, C-terminal extension; Ins, insertion. Created with IBS (Liu et al., 2015). The boundaries of the crystallisation construct with the mutations introduced is also shown, lower panel. (B) Overall structure of TcPINK1 showing the canonical N-lobe and C-lobe (grey). Catalytic and activation loop motifs are shown in magenta sticks and Mg2+ is shown as a black sphere. Ins2, Ins3 and CTE of TcPINK1 are coloured as in Figure 1A; disordered regions of PINK1 are shown in dashed line; Ins1 of hPINK1 is also shown as part of disordered loop in TcPINK1. (C) Topology diagram of the TcPINK1 structure. Core kinase domain secondary structure elements are shown in grey and indicated with numbers (β-sheet) and letters (α-helices) according to the nomenclature in (Hanks and Hunter, 1995). Non-canonical secondary structure elements (CTE, C-terminal extension; Ins, insertion) are indicated with Roman numerals for Ins2 (cyan), Ins3 (green) and numbering for CTE (blue). Created with TopDraw (Bond, 2003). (D) Ubiquitin phosphorylation assay with full-length TcPINK1 (WT), kinase-inactive D359A mutant (KI), and ATP-binding pocket mutations A194D, K196A and E217K. 2 μg of indicated enzyme was incubated with 2 μM ubiquitin (K63-linked tetraubiquitin) and [γ-32P] ATP for 10 min. Gels were analysed by Coomassie staining (lower panel) and [γ-32P] incorporation visualised by autoradiography (upper panel) followed by Cerenkov counting of substrate bands for quantification (right panel).
Figure 1—figure supplement 1
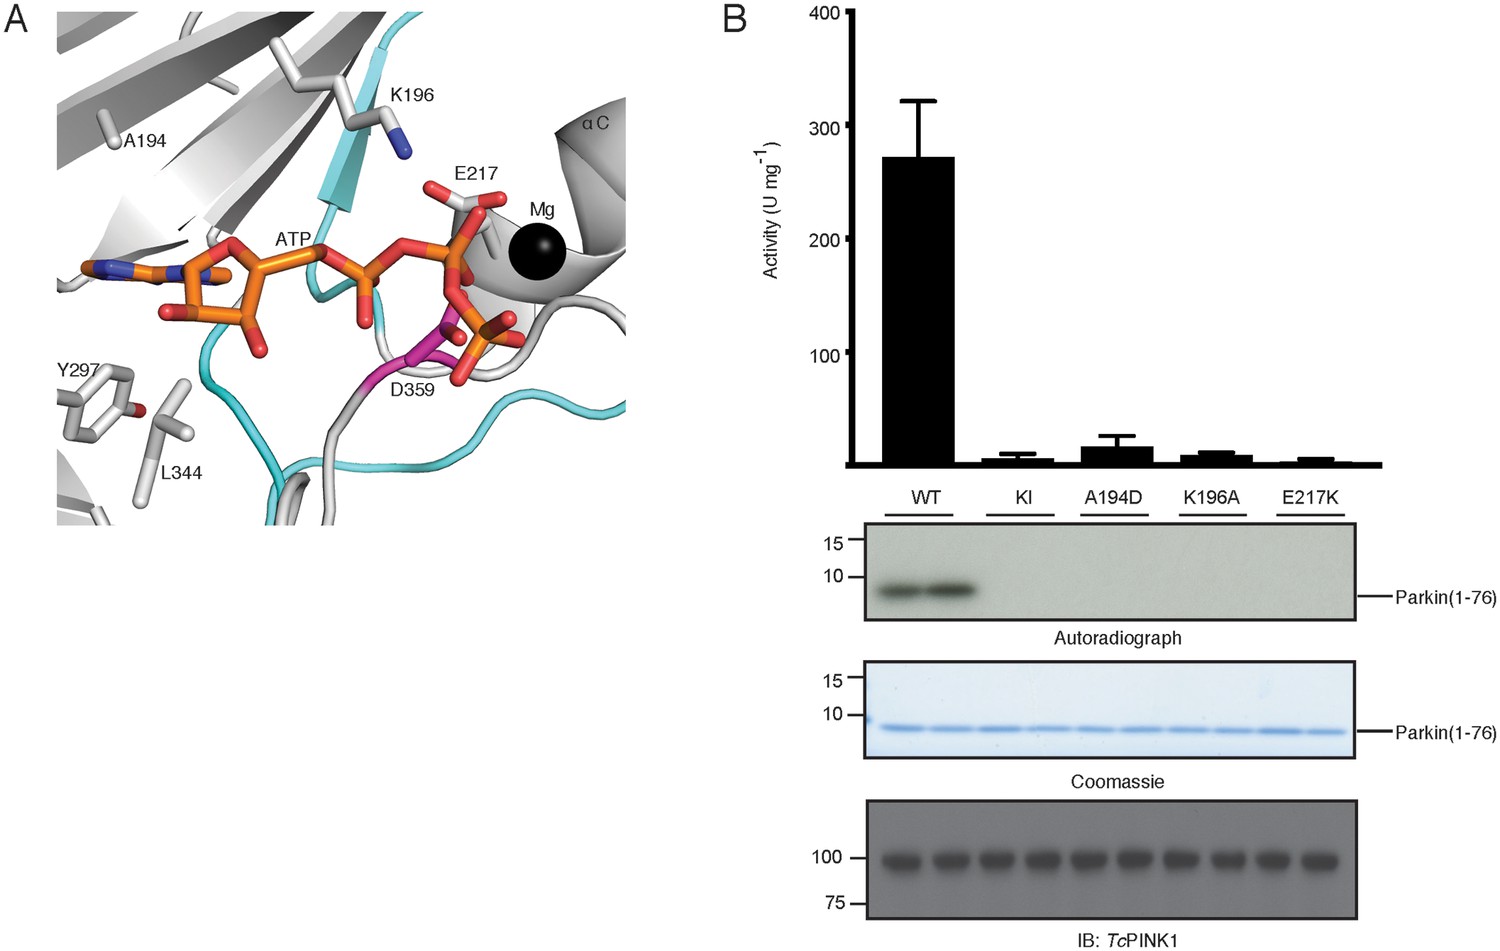
Mutations in the TcPINK1 ATP binding pocket result in loss of kinase activity.
(A) ATP (orange sticks) was modeled in the TcPINK1 structure using superposed coordinates of cAMP-dependent protein kinase in complex with ATP (pdb id:1ATP), TcPINK1 residues involving interactions with ATP are shown in grey sticks, remaining features of TcPINK1 are colored as in Figure 1B. (B) Parkin Ubl phosphorylation assay with full-length TcPINK1 (WT), kinase-inactive D359A mutant (KI), and ATP-binding pocket mutants A194D, K196A and E217K. 30 ng of indicated enzyme was incubated in the presence of 2 μM Ubl domain of Parkin (1-76) and [y-32P] ATP for 10 min. Reactions were terminated by addition of SDS sample buffer and separated by SDS-PAGE. [γ-32P] incorporation visualised by autoradiography (upper panel), followed by Cerenkov counting of substrate bands for quantification (top panel), western blot against TcPINK1 (lower panel) and Coomassie stained gels showing UBL (middle panel) are used as loading control.
Figure 2 with 1 supplement
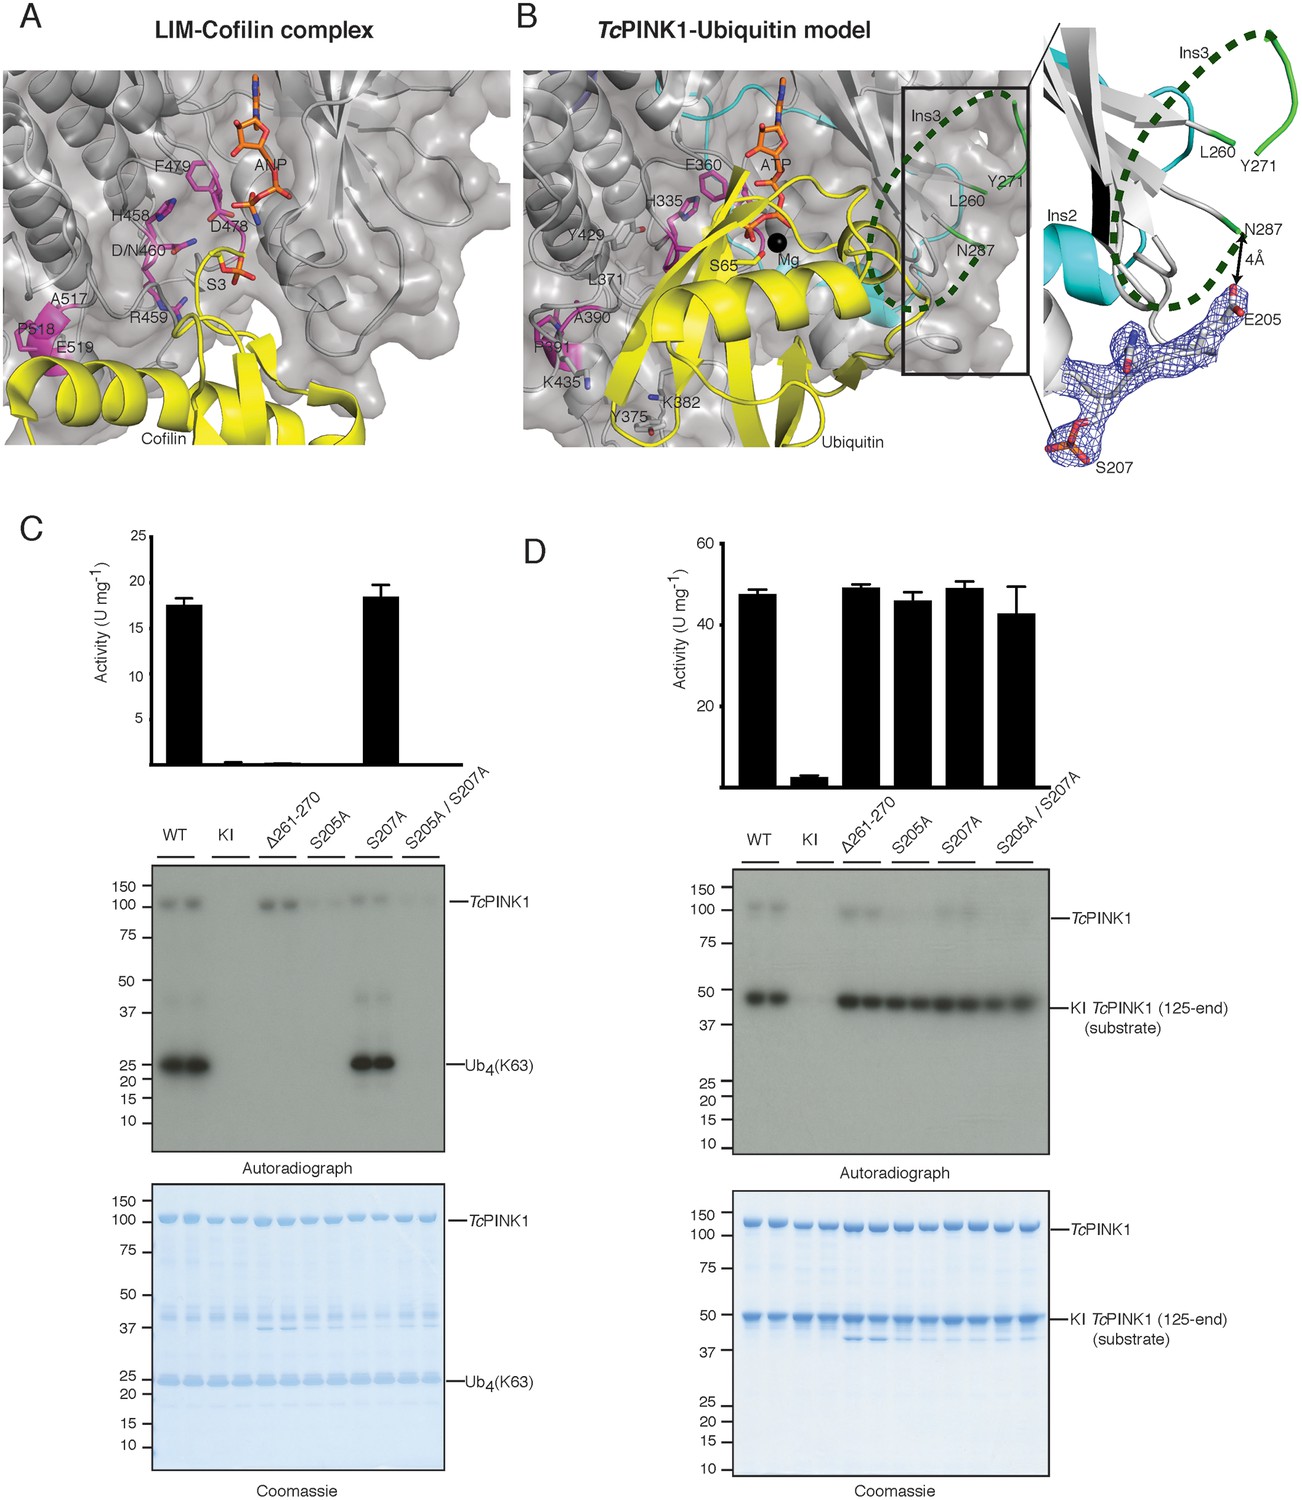
Identification of the PINK1 substrate binding bowl.
(A) Crystal structure of the LIM kinase substrate complex (pdb id: 5HVK, 18) showing LIM kinase (coloured as TcPINK1 in Figure 1B) and bound substrate cofilin (yellow) with Ser3 (yellow stick) poised in acceptor position. (B) Ubiquitin (yellow) was modelled in TcPINK1 (coloured as in Figure 1B) by superposing Ser3 of cofilin with Ser65 (shown as sticks) of ubiquitin after superposing the TcPINK1 and LIM kinase domains; disordered Ins3 is marked by dashed green line; 2Fo-Fc map, contoured at 1.5σ, corresponding to phosphorylated Ser207 region is shown highlighting the Glu205 position in respect to Asn287 (tail of disordered Ins3), inset. (C) Ubiquitin phosphorylation assay with full-length TcPINK1 (WT), kinase-inactive D359A mutant (KI), insertion three deletion mutant (Δ261–270), S205A and/or S207A mutants in the autophosphorylation sites. 2 µM ubiquitin (K63-linked tetraubiquitin) was used as substrate; assay conditions were similar to Figure 1D. Gels were analysed by Coomassie staining (lower panel) and [γ-32P] incorporation visualised by autoradiography (middle panel) followed by Cerenkov counting of substrate bands for quantification (upper panel). (D) TcPINK1 transphosphorylation assay with full-length TcPINK1 (WT) or various mutants as in Figure 2C. 2 µM of kinase inactive TcPINK1 (125-end) was used as substrate; assay conditions were similar to Figure 1D. Gels were analysed by Coomassie staining (lower panel) and [γ-32P] incorporation visualised by autoradiography (middle panel) followed by Cerenkov counting of substrate bands for quantification (upper panel).
Figure 2—figure supplement 1

TcPINK1 Mutations in Ins3, autophosphorylation site and canonical substrate binding region result in loss of activity.
(A) Parkin Ubl phosphorylation assay with full-length TcPINK1 (WT), kinase-inactive D359A mutant (KI), Ins3 deletion (∆261–270), S205A, S207A and S205A/S207A. 30 ng of indicated enzyme was incubated in the presence of 2 μM Ubl domain of Parkin (1-76) and [y-32P] ATP for 10 min. Reactions were terminated by addition of SDS sample buffer and separated by SDS-PAGE. [γ-32P] incorporation visualised by autoradiography (upper panel), followed by Cerenkov counting of substrate bands for quantification (top panel), Western blot against TcPINK1 (lower panel) and Coomassie-stained gels showing Ubl (middle panel) are used as loading control. (B) Ubiquitin phosphorylation assay with TcPINK1 (WT), kinase-inactive D359A mutant (KI), and canonical substrate-binding mutants L371A, Y375A, K382A, and K435A. 2 μg of indicated enzyme was incubated in the presence of 2 μM ubiquitin (K63-linked tetraubiquitin), and [γ32-P] ATP for 10 min. Reactions were terminated by addition of SDS sample buffer and separated by SDS-PAGE. Gels were analysed by Coomassie staining (lower panel) and [γ-32P] incorporation visualised by autoradiography (middle panel), followed by Cerenkov counting of substrate bands for quantification (upper panel).
Figure 3 with 1 supplement

Ins2 of TcPINK1 adopts a unique conformation.
(A) Close up view of active site of TcPINK1 (coloured as in Figure 1B) showing key ionic interactions involving Asp381 of the activation loop with Arg336 of the HRD motif and Arg216 of the αC helix; and Asp366 with Lys212 of the αC helix and Arg240 of Ins2. (B) Ubiquitin phosphorylation assay with full-length TcPINK1 (WT), kinase-inactive D359A mutant (KI), D381A, R216A, K212A and R240A mutants. 2 µM of Ubiquitin (K63-linked tetraubiquitin) was used as substrate; conditions were similar to Figure 1D. Gels were analysed by Coomassie staining (lower panel) and [γ-32P] incorporation visualised by autoradiography (upper panel) followed by Cerenkov counting of substrate bands for quantification (right panel). (C) Structural comparison of TcPINK1 and the CDK-Cyclin complex (pdb id: 5IF1) showing intramolecular interactions between Ins2 (cyan) and αC helix (grey) of TcPINK1 that resemble the intermolecular interactions between CDK (grey) and Cyclin (cyan). The salt bridge between Glu and Lys (shown in sticks) for kinase activation is represented by a dashed line. Interactions between the C-lobe and the distal Ins2 loop are highlighted (Inset). (D) Ubiquitin phosphorylation assay with full-length TcPINK1 (WT), kinase-inactive D359A mutant (KI) and TcPINK1 Ins2 mutants with βi-strand and αi-helix deletion (∆222–242), αi-helix deletion (∆231–242), or distal loop deletion (∆243–253). 2 µM of Ubiquitin (K63-linked tetraubiquitin) was used as substrate, conditions were similar to Figure 1D. Gels were analysed by Coomassie staining (lower panel) and [γ-32P] incorporation visualised by autoradiography (middle panel) followed by Cerenkov counting of substrate bands for quantification (upper panel).
Figure 3—figure supplement 1
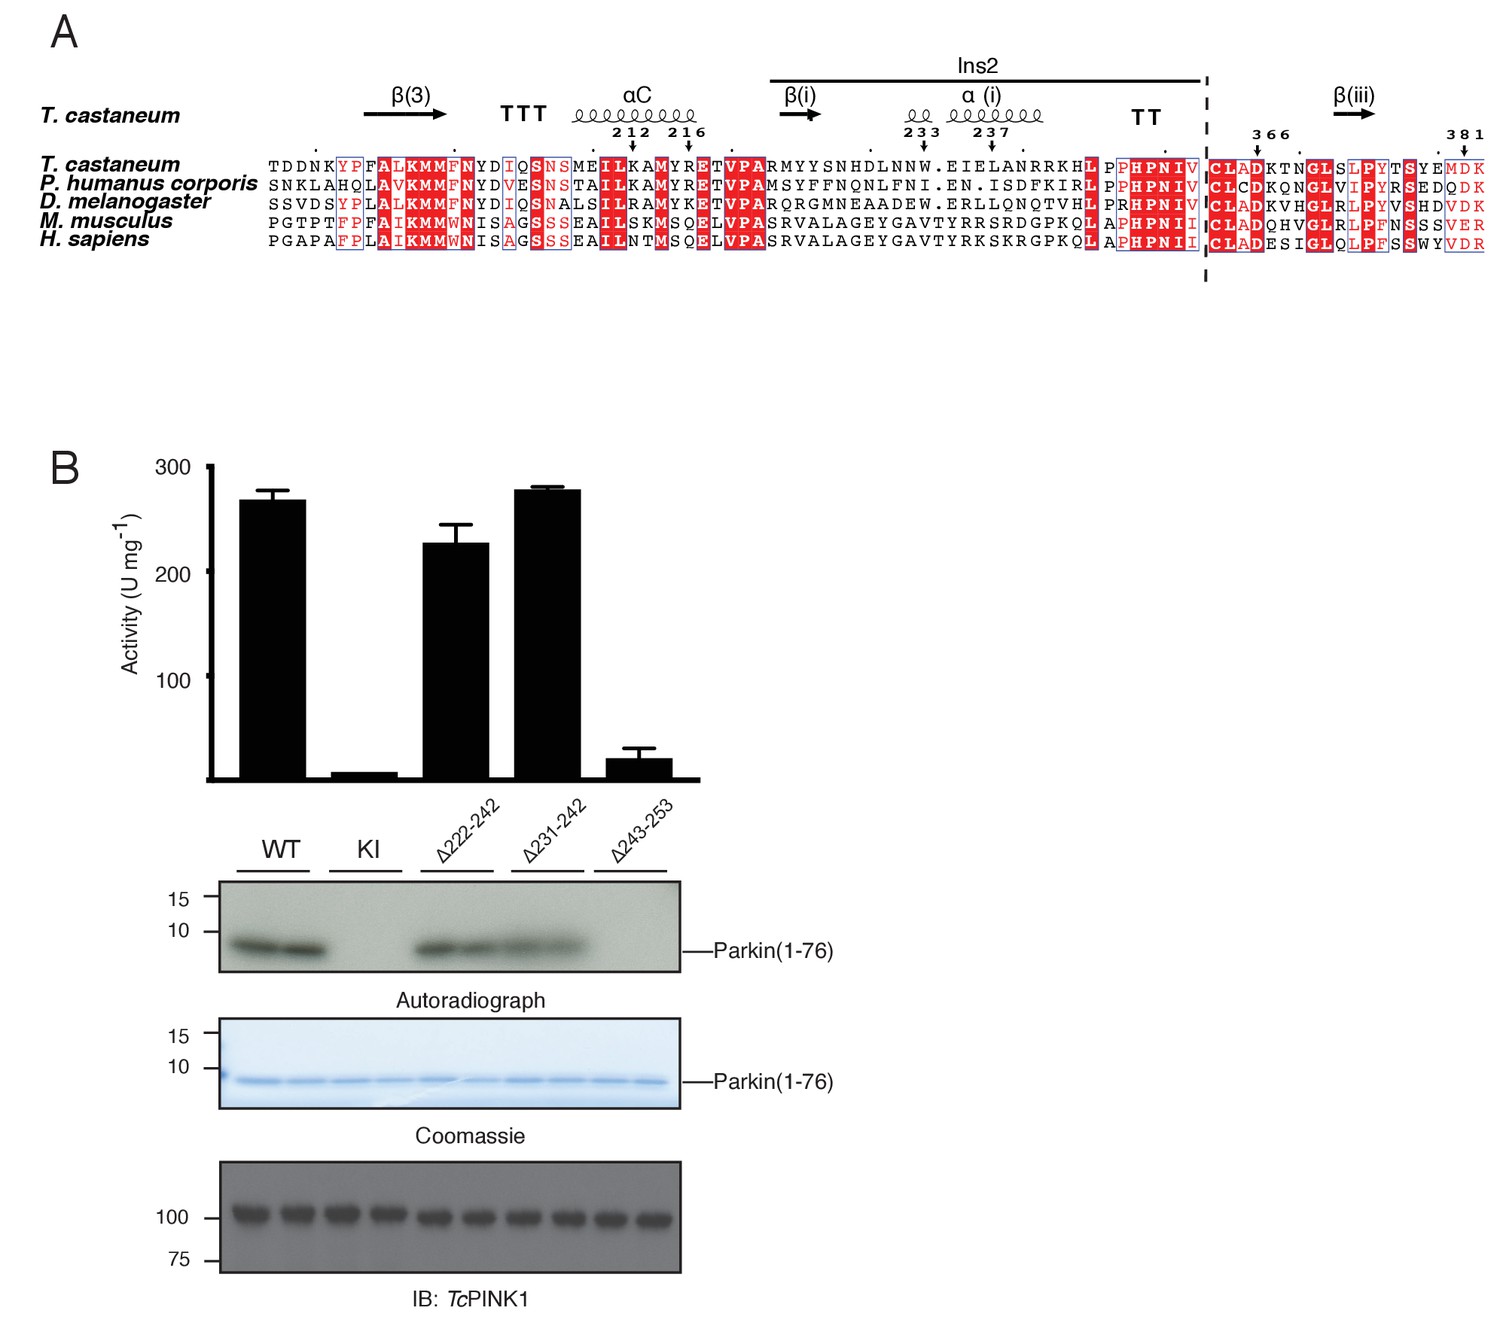
High conservation and functionally important role of C-terminal distal loop of Ins2 in TcPINK1 activity.
(A) Multiple sequence alignment of PINK1 kinases showing conservation of important residues/regions highlighted in Figure 3. Secondary structure elements are included based on TcPINK1 structure; elements numbering is consistent with Figure 1C. Numbering of residues is according to TcPINK1 sequence; marked arrows represent residues highlighted in catalytic cleft of TcPINK1 in Figure 3. Two different regions in the alignment are separated by dashed line. (B) Parkin Ubl phosphorylation assay with full-length TcPINK1 (WT), kinase-inactive D359A mutant (KI), PINK1 Ins2 mutants with βi-strand and αi-helix deletion (∆222–242) or αi-helix deletion (∆231–242) or distal loop deletion (∆243–253) in Ins2. Ubl was used as substrate under the same conditions as Figure 1—figure supplement 1.
Figure 4 with 1 supplement
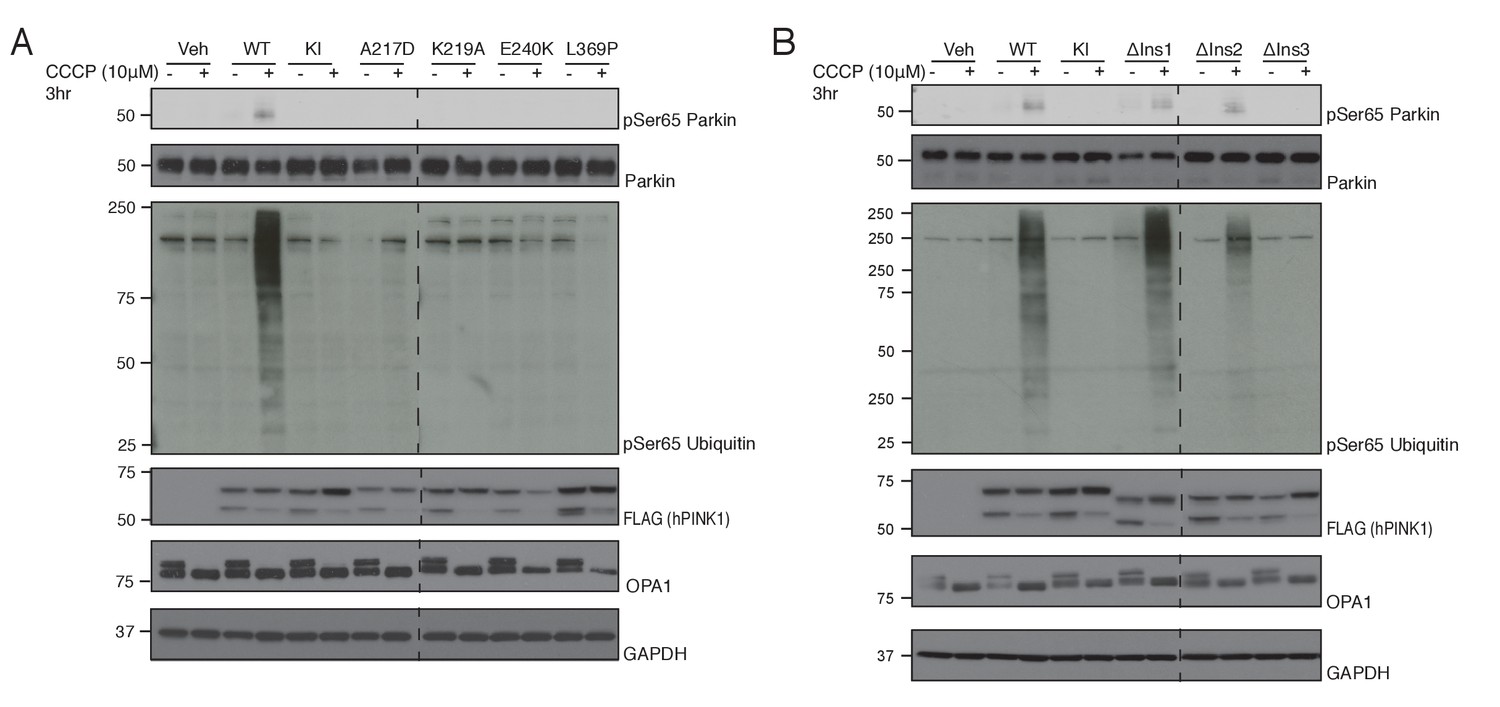
Conservation of ATP and substrate binding mechanism in hPINK1.
(A) hPINK1 knock out HeLa cells transiently co-expressing WT human Parkin and 3xFLAG tagged hPINK1 WT, KI or hPINK1 ATP-binding mutants A217D, K219A, E240K, L369P. A217, K219, E240 and L369 correspond to A194, K196, E217 and L344 of TcPINK1, respectively. Cells were stimulated with 10 μM CCCP or DMSO for 3 hr. Lysates were subjected to immunoblotting as follows: pSer65 Parkin (anti-phospho-Parkin); Parkin (anti-Parkin), pSer65 ubiquitin (anti-phospho-ubiquitin), hPINK1 (anti-FLAG), OPA1 (anti-OPA1) and GAPDH (anti-GAPDH). (B) hPINK1 knock out HeLa cells transiently co-expressing WT human Parkin and 3xFLAG tagged hPINK1 WT, KI or hPINK1 Ins mutants ∆Ins1 (180–209 deletion), ∆Ins2 (245–265 deletion), ∆Ins3 (285-294). Cells were stimulated with 10 μM CCCP or DMSO for 3 hr. Lysates were subjected to immunoblotting as follows: pSer65 Parkin (anti-phospho-Parkin); Parkin (anti-Parkin), pSer65 ubiquitin (anti-phospho-ubiquitin), hPINK1 (anti-FLAG), OPA1 (anti-OPA1) and GAPDH (anti-GAPDH).
Figure 4—figure supplement 1
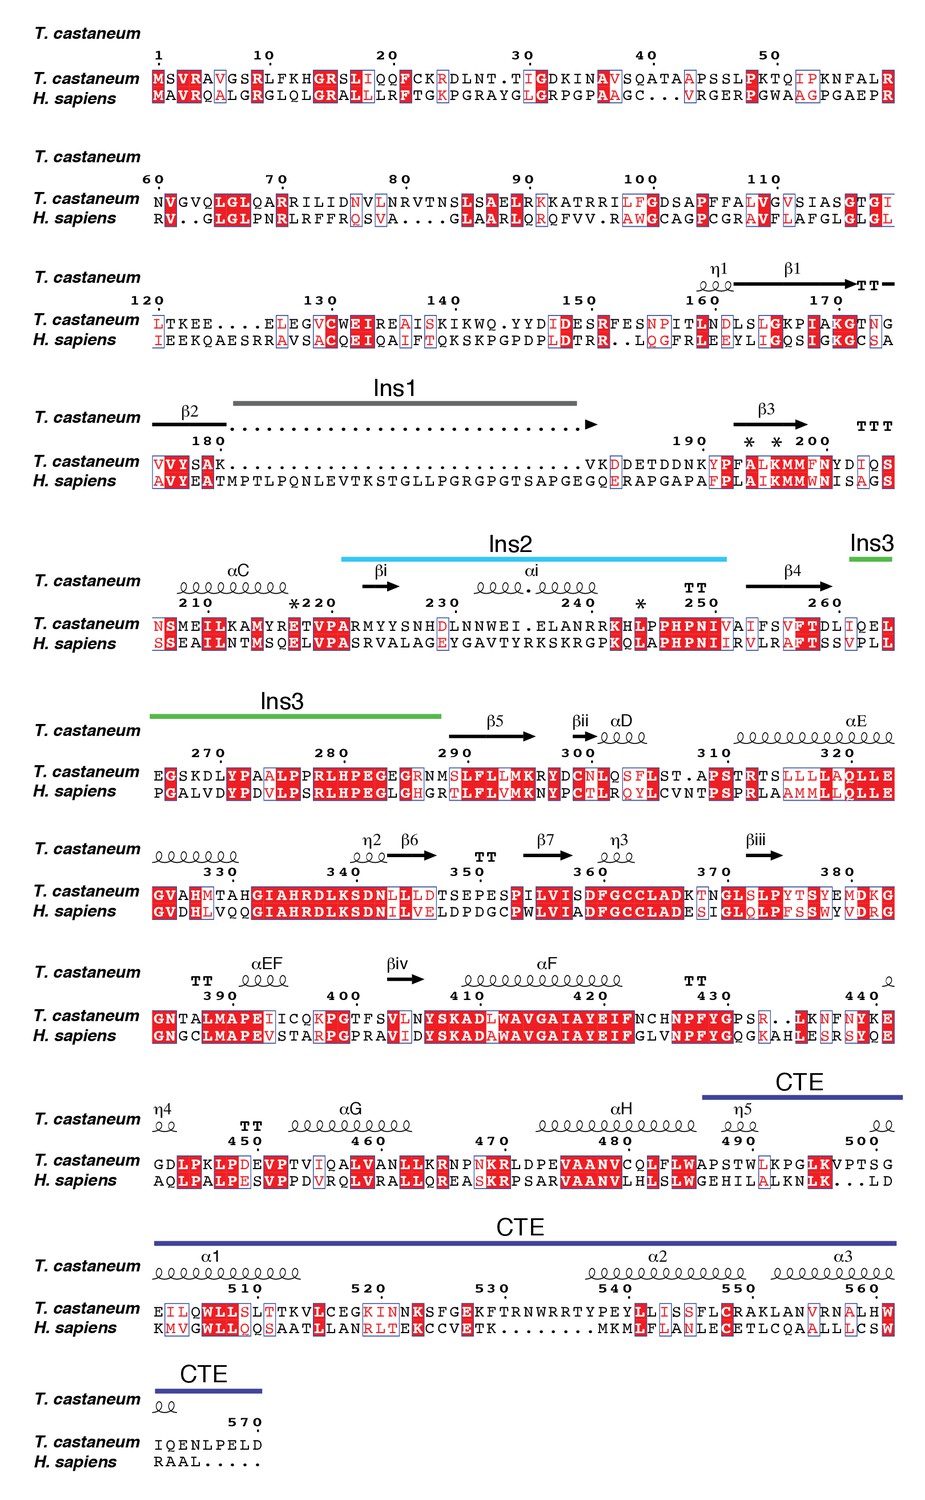
Sequence alignment of TcPINK1 and hPINK1.
Secondary structure elements are included based on TcPINK1 structure. Elements numbering is consistent with Figure 1C; numbering of residues is according to the TcPINK1 sequence. ATP-binding residues shown in Figure 1 are marked with *. Locations of loop insertions are coloured according to Figure 1.
Figure 5
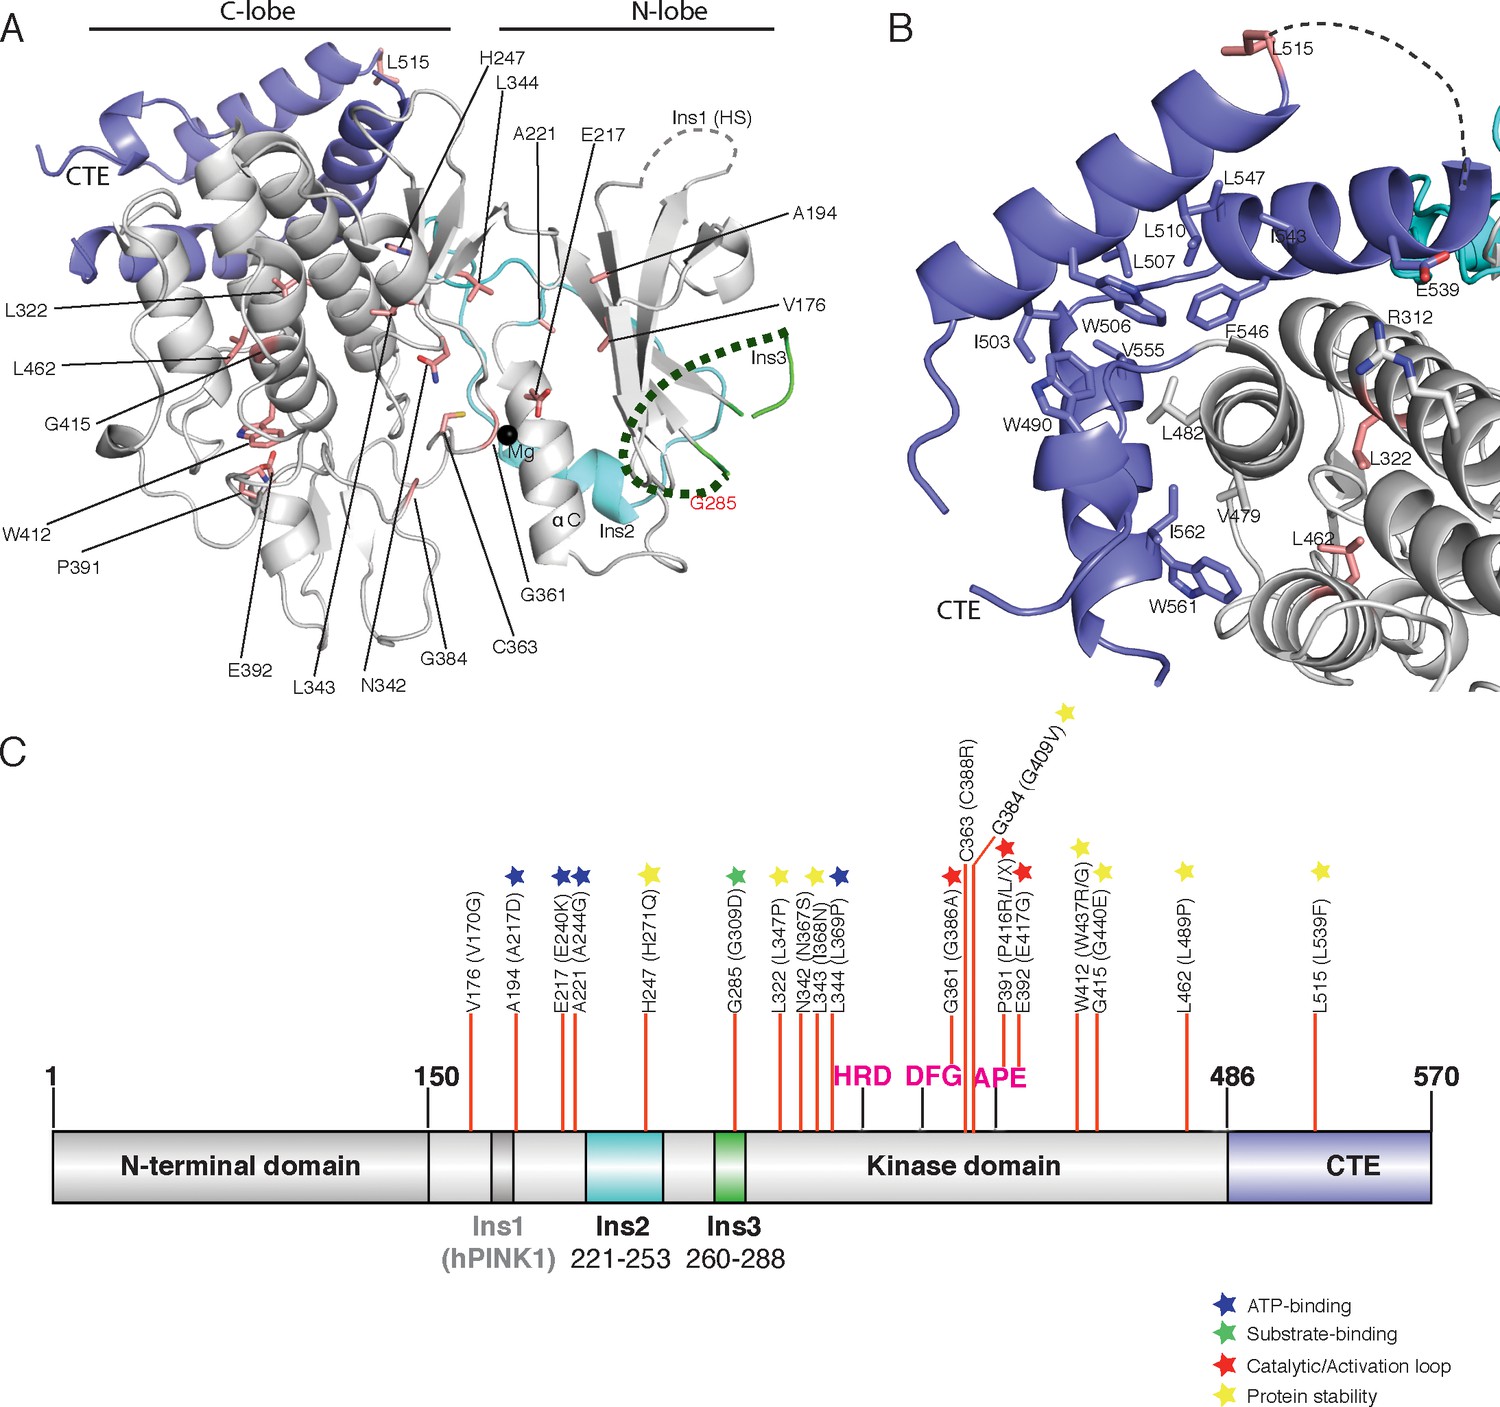
Spatial map of Parkinson’s disease (PD) linked mutations within hPINK1.
(A) Mapping of PD mutations onto the TcPINK1 structure (coloured as in Figure 1B). Pathogenic hPINK1 disease mutant residues are shown in red sticks; disease mutants in the disordered region (represented by dashed line) of Ins3 are labelled in red characters. (B) Interface of the CTE and C-lobe of TcPINK1 showing the hydrophobic core (shown in grey or blue) of the TcPINK1 kinase domain. hPINK1 PD mutations in the vicinity of the hydrophobic core are shown in red sticks. (C) Location of hPINK1 PD mutations (marked with red lines) on the primary TcPINK1 sequence. hPINK1 mutations are shown in parenthesis.
Author response image 1
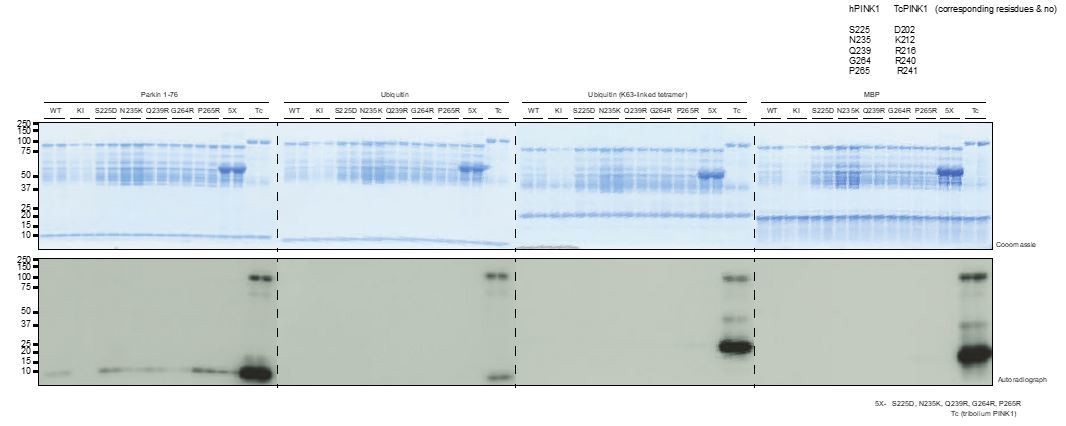
Incorporation of basic residues around the catalytic pocket, identified from TcPINK1 structure (Figure 3A), do not result in an active hPINK1 enzyme.
Author response image 2

Author response image 3
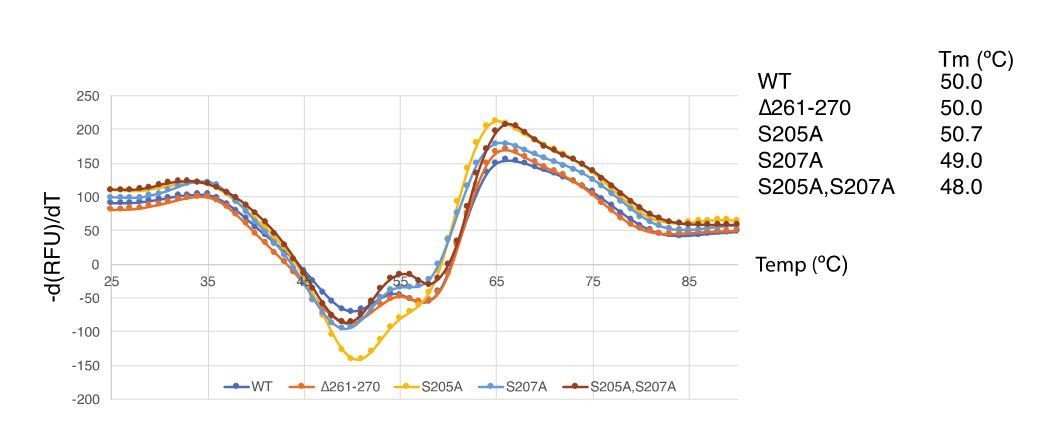
Thermal shift assay of TcPINK1 mutants
Tables
Table 1
Diffraction data and refinement statistics.
https://doi.org/10.7554/eLife.29985.012| TcPINK1 (Native) | |
|---|---|
| Data collection | |
| Space group | P1 21 1 |
| Cell dimensions | |
| a, b, c (Å) | 84.92 116.74 179.34 |
| α, b, g (°) | 90.00 94.29 90.00 |
| Wavelength (Å) | 1.03 |
| Resolution (Å) | 178.84–2.78 (2.83–2.78)* |
| Rmerge | 8.5 (122.4) |
| I/σ(I) | 13.0 (1.4) |
| CC1/2 | 99.9 (59.4) |
| Completeness (%) | 99.9 (99.8) |
| Redundancy | 6.7 (6.8) |
| Refinement | |
| Resolution (Å) | 178.84 (2.78) |
| No. reflections | 83545 |
| Rwork/Rfree | 20.6/24.5 |
| No. atoms | |
| Protein | 16722 |
| Ligand/ion | 6 |
| Water | 30 |
| B factors | |
| Protein | 80.8 |
| Ligand/ion | 81.6 |
| Water | 70.9 |
| R.m.s. deviations | |
| Bond lengths (Å) | 0.01 |
| Bond angles (°) | 1.8 |
-
Single crystals were used for structure determination.
*Values in parentheses are for highest-resolution shell.
Additional files
-
Supplementary file 1
List ofhPINK1 PD mutations conserved in TcPINK1 and their predicted impact
- https://doi.org/10.7554/eLife.29985.013
-
Supplementary file 2
List of Antibodies used and their source
- https://doi.org/10.7554/eLife.29985.014
-
Transparent reporting form
- https://doi.org/10.7554/eLife.29985.015
Download links
A two-part list of links to download the article, or parts of the article, in various formats.
Downloads (link to download the article as PDF)
Open citations (links to open the citations from this article in various online reference manager services)
Cite this article (links to download the citations from this article in formats compatible with various reference manager tools)
Structure of PINK1 and mechanisms of Parkinson's disease-associated mutations
eLife 6:e29985.
https://doi.org/10.7554/eLife.29985


