Transient hypothyroidism favors oligodendrocyte generation providing functional remyelination in the adult mouse brain
- Sorbonne Universités, Muséum d’Histoire Naturelle, France
- INSERM U1128, France
- Université Paris Descartes, France
- Instituto de Ciencias Biomédicas, Facultad de Ciencias de la Salud, Universidad Autónoma de Chile, Chile
- Sorbonne Universités UPMC Univ Paris 06, France
- Institute of Experimental Medicine, Hungarian Academy of Sciences, Hungary
- Tufts Medical Center, United States
- AP-HP, Hôpital Pitié-Salpêtrière, France
Figures
Figure 1 with 3 supplements
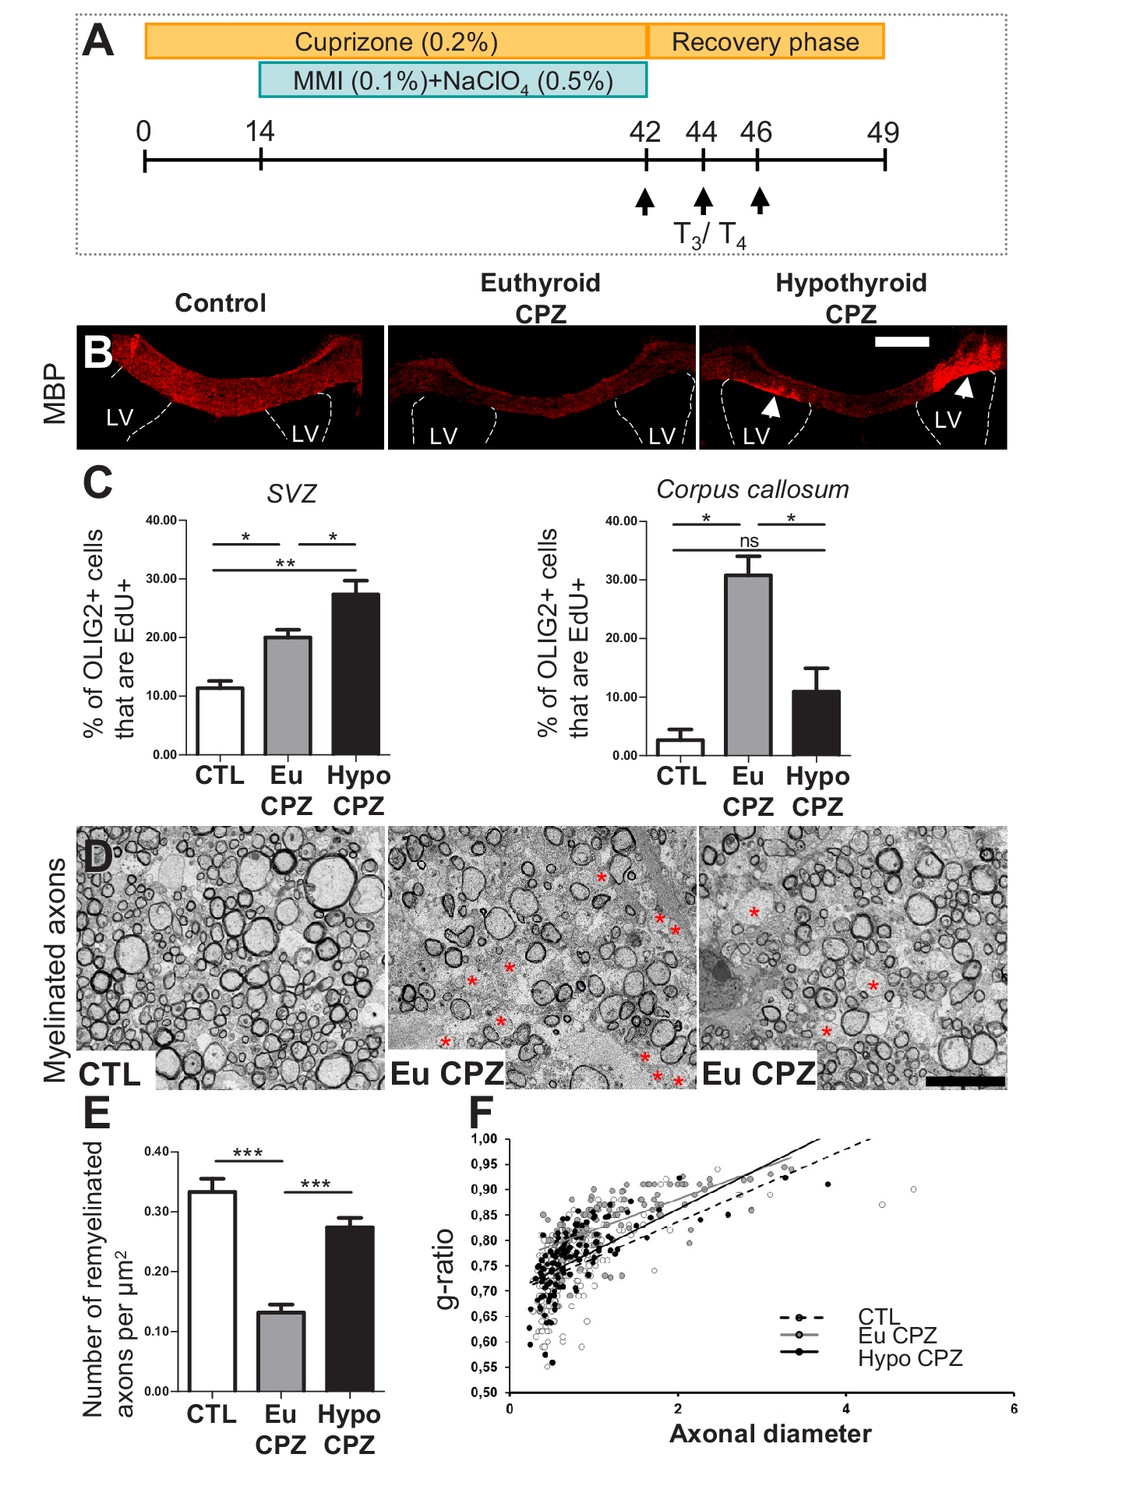
Hypothyroidism during demyelination favors oligodendrogenesis.
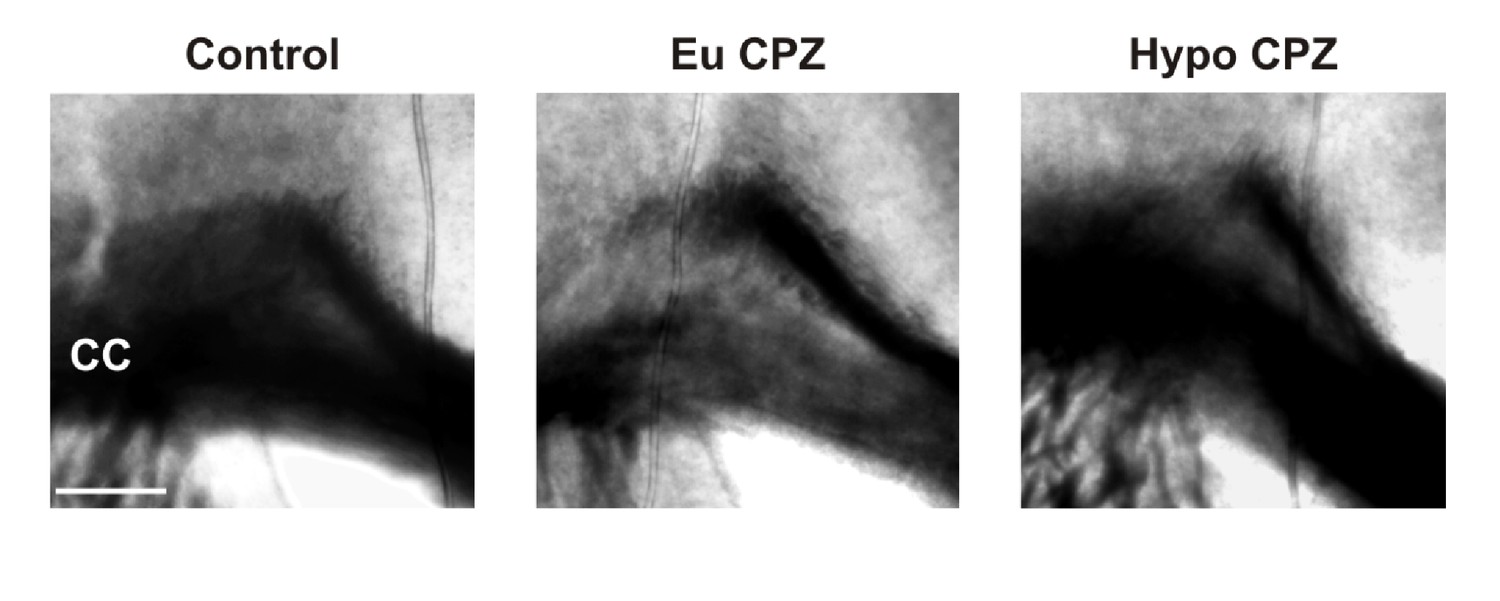
(A) Experimental procedure: Cuprizone (CPZ) was added to the diet for 6 weeks (d0 to d42) and a T3-free window applied for one month, two weeks after onset of CPZ treatment (d14 to d42). Three intraperitoneal injections of T3/T4 (d42, d44, d46) were given to accelerate remyelination after return to normal diet. (B) Extent of de/re-myelination in the corpus callosum was evaluated by MBP immunostaining 7d post-CPZ treatment. LV = lateral ventricle (C) Quantification of actively cycling oligodendrocyte progenitors (EdU+ OLIG2+) in the SVZ (mean ± SEM, n = 5–6 mice per group, **p=0.0015; Kruskal-Wallis test) and cycling pOPCs in corpus callosum during demyelinisation (d28) (mean ± SEM, n = 4–6 mice per group, *p=0.0109; Kruskal-Wallis test). (D) Remyelination of the corpus callosum after CPZ diet analyzed by electron microscopy of ultra-thin sections (Representative fields). Note that non-myelinated axons (red asterisks) are more numerous in EuCPZ compared to HypoCPZ samples. (E) Density of remyelinated axons per area (µm2) in CTL, EuCPZ and HypoCPZ after CPZ-induced demyelination (mean ± SEM, n = 12–18 sections from 2 (CTL) or 3 (EuCPZ and HypoCPZ) mice, CTL versus EuCPZ ***p<0.001, t = 7.952; EuCPZ versus HypoCPZ ***p<0.001, t = 25.835; One-way Anova test followed by Bonferroni post-hoc test) (F) Scatter plot of g ratio values in CTL (dotted black line, n = 198), EuCPZ (grey line, n = 112), HypoCPZ (black line, n = 122). Scale bar in (B): 500 µm, in (D): 5 µm.
-
Figure 1—source data 1
Hypothyroidism during demyelination favors oligodendrogenesis.
- https://doi.org/10.7554/eLife.29996.006
Figure 1—figure supplement 1
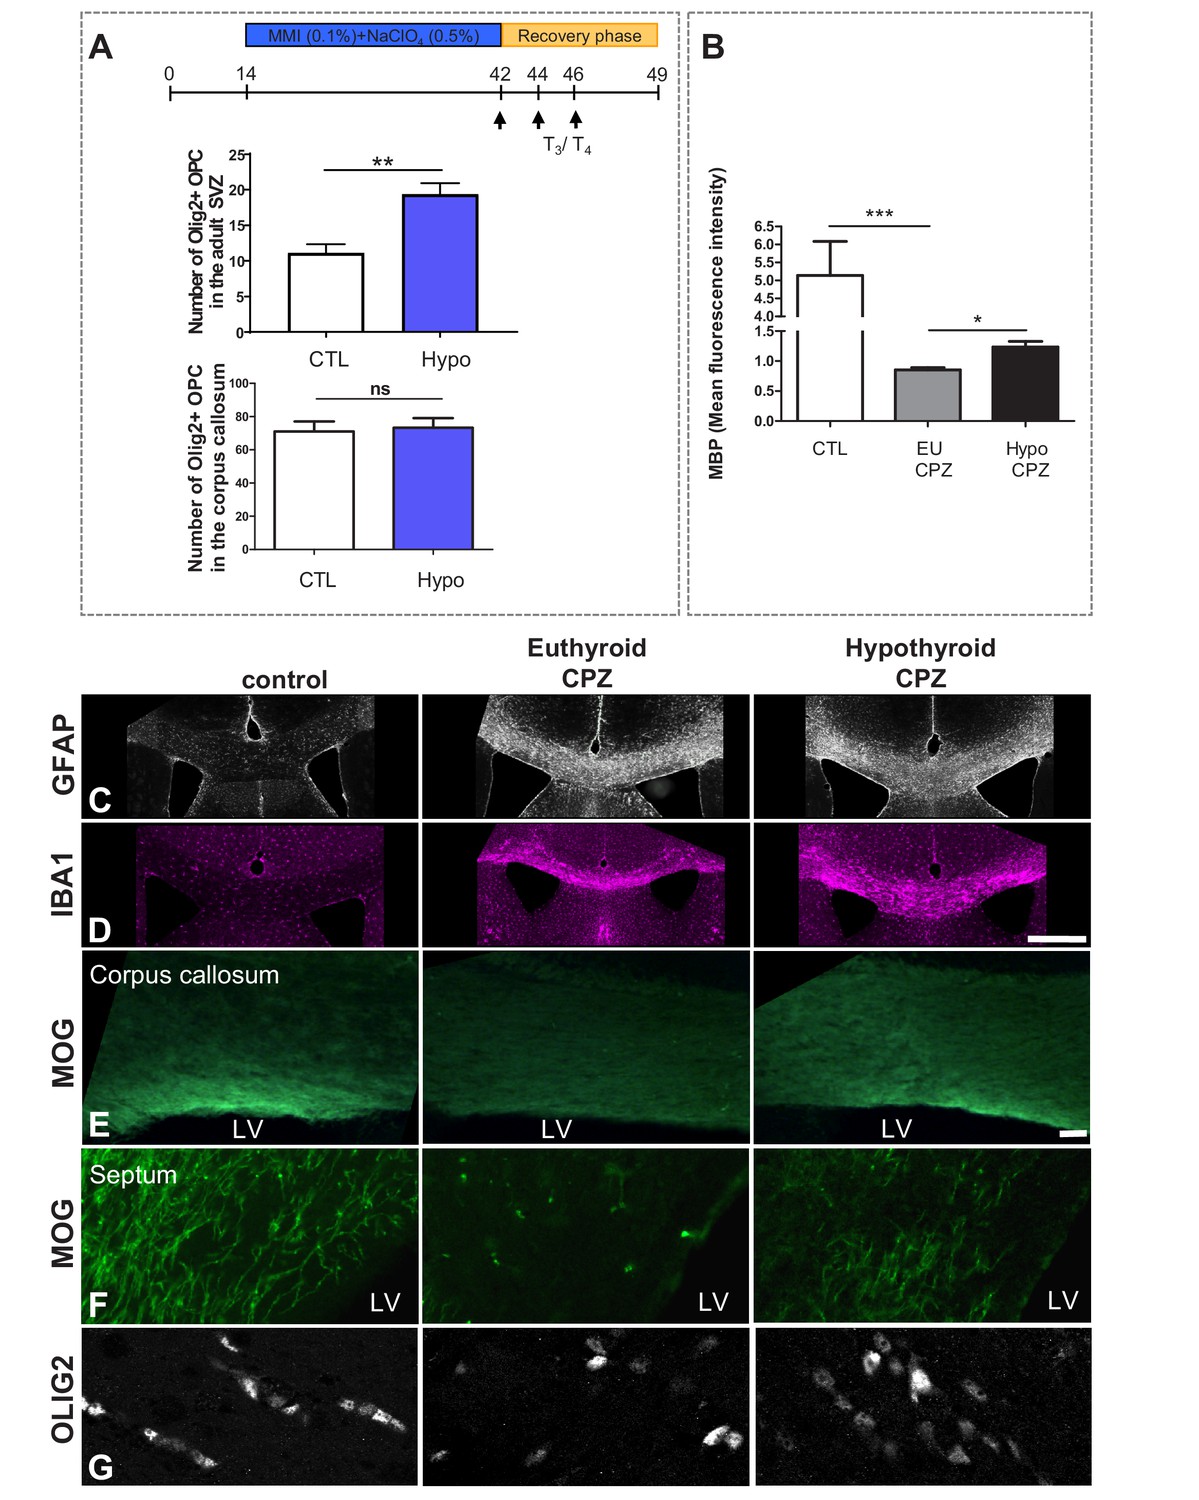
A T3-free window during CPZ demyelination increases remyelination.
(A) Quantification of OLIG2+ oligodendrocyte progenitors in the SVZ and in the corpus callosum following four weeks of hypothyroidism (without cuprizone). (B) Quantification of MBP mean fluorescence intensity in the corpus callosum in control, EuCPZ and HypoCPZ mice (C and D) Hypothyroidism does not affect astrocyte (GFAP, grey) or microglial (IBA1, pink) responses. Scale bar: 500 µm. (E and F) Extent of remyelination was evaluated by MOG immunostaining in the corpus callosum (E) and in the septum (F) one week after the end of CPZ treatment. The mild remyelination observed in euthyroid mice contrasts with the intense remyelination of hypothyroid mice both in corpus callosum (E) and in the septum (F). Scale bar: 100 µm. (G) Extent of remyelination was evaluated by OLIG2 immunostaining in the corpus callosum one week after the end of CPZ diet. Scale bar: 30 µm.
Figure 1—figure supplement 2
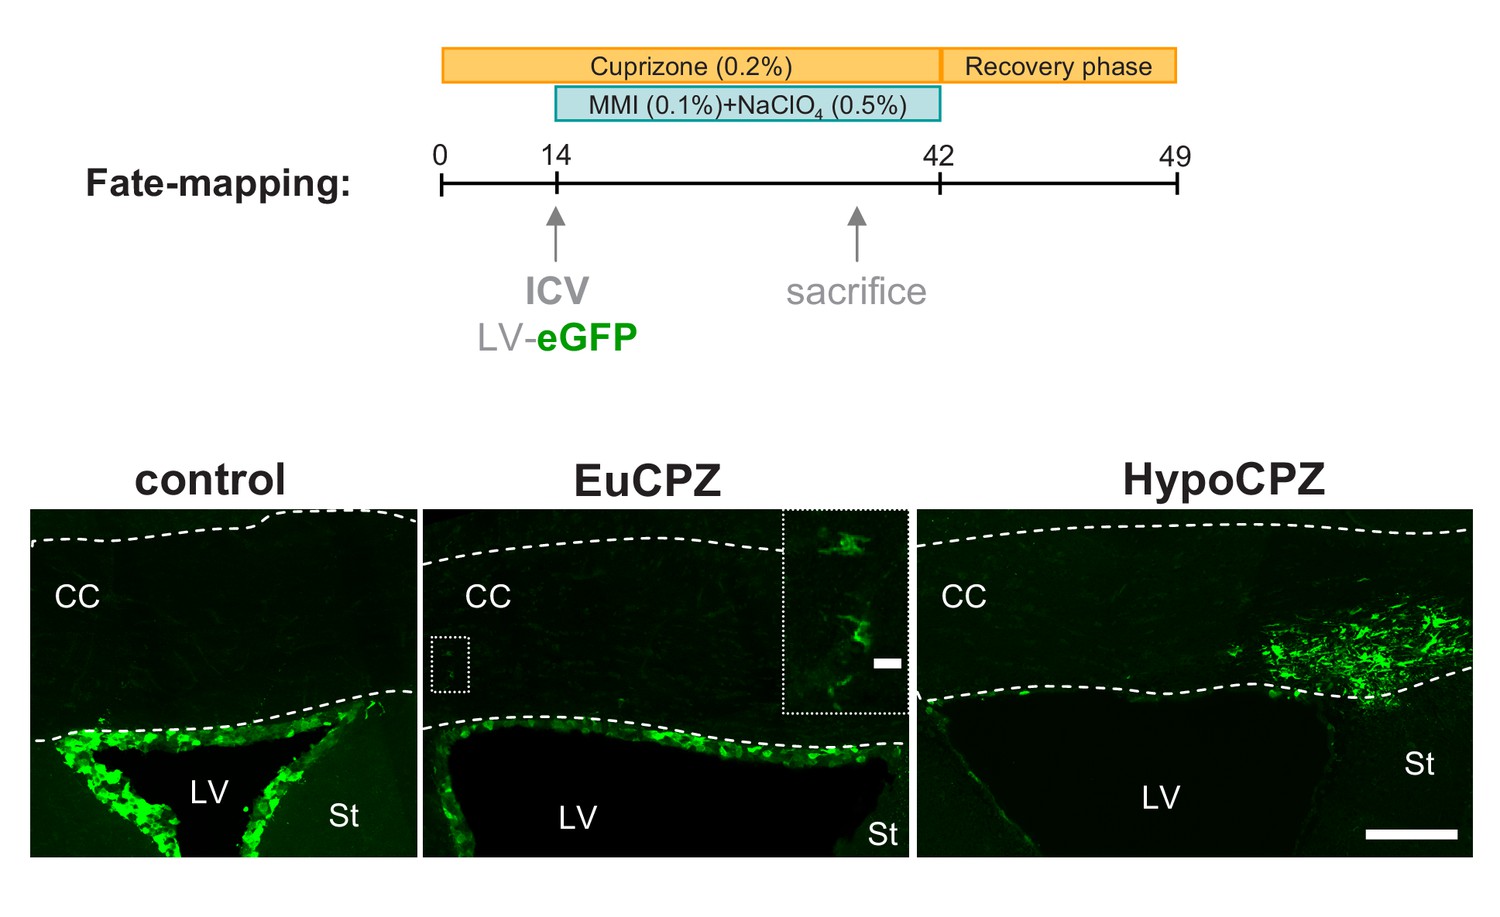
SVZ-OPCs are recruited to the corpus callosum following a demyelinating insult.
Coronal sections showing GFP + cells (green) 20d after injection of CMV-eGFP-expressing lentiviral particles into the adult SVZ. GFP + cells are mainly confined to the SVZ of CTL (n = 3) and EuCPZ (n = 3) mice. Few GFP+ cells displaying oligodendrocyte morphologies can be observed in the corpus callosum of EuCPZ mice (see highlight, scale bar 10 µm). In contrast, we observed large numbers of GFP + cells in the corpus callosum of HypoCPZ (n = 3) mice, just above the lateral ventricle. CC = corpus callosum, St = striatum, LV = lateral ventricle. Scale bar: 50µ.
Figure 1—figure supplement 3

(A–B) Mice received T3/T4 pulses during the recuperation phase.
(A) Quantification of the g-ratio in control (CTL), euthyroid-CPZ (EuCPZ) and hypothyroid-CPZ (HypoCPZ) (mean ± SEM, n > 100 per group. ***p<0.001, Kruskal-Wallis test followed by a Dunn’s post-hoc test). (B) Quantification of myelin thickness of the myelin sheath in hypothyroid-CPZ (HypoCPZ) conditions shows thickness is restored to control levels compared to euthyroid-CPZ condition (EuCPZ). (mean ± SEM, n > 100 per group. ***p<0.001, **p<0.001, Kruskal-Wallis test followed by a Dunn’s post-hoc test). (C–E) Mice received NaCl during the recuperation phase. (C) Density of remyelinated axons per area (µm2) in CTL, EuCPZ and HypoCPZ after CPZ-induced demyelination. (mean ± SEM, n = 10–12 sections from 2 CTL, 2 EuCPZ and 2 HypoCPZ mice, ***, p<0.0001, Kruskal-Wallis test) (D) Quantification of the g-ratio in CTL, Eu CPZ and HypoCPZ mice (mean ± SEM, n > 100 per group. ***p<0.001, Kruskal-Wallis test followed by a Dunn’s post-hoc test). (E) Quantification of the myelin sheaththickness in CTL, EuCPZ and HypoCPZ mice (mean ± SEM, n > 100 per group. ***p<0.001, **p<0.001, Kruskal-Wallis test followed by Dunn’s post-hoc test).
Figure 2 with 1 supplement
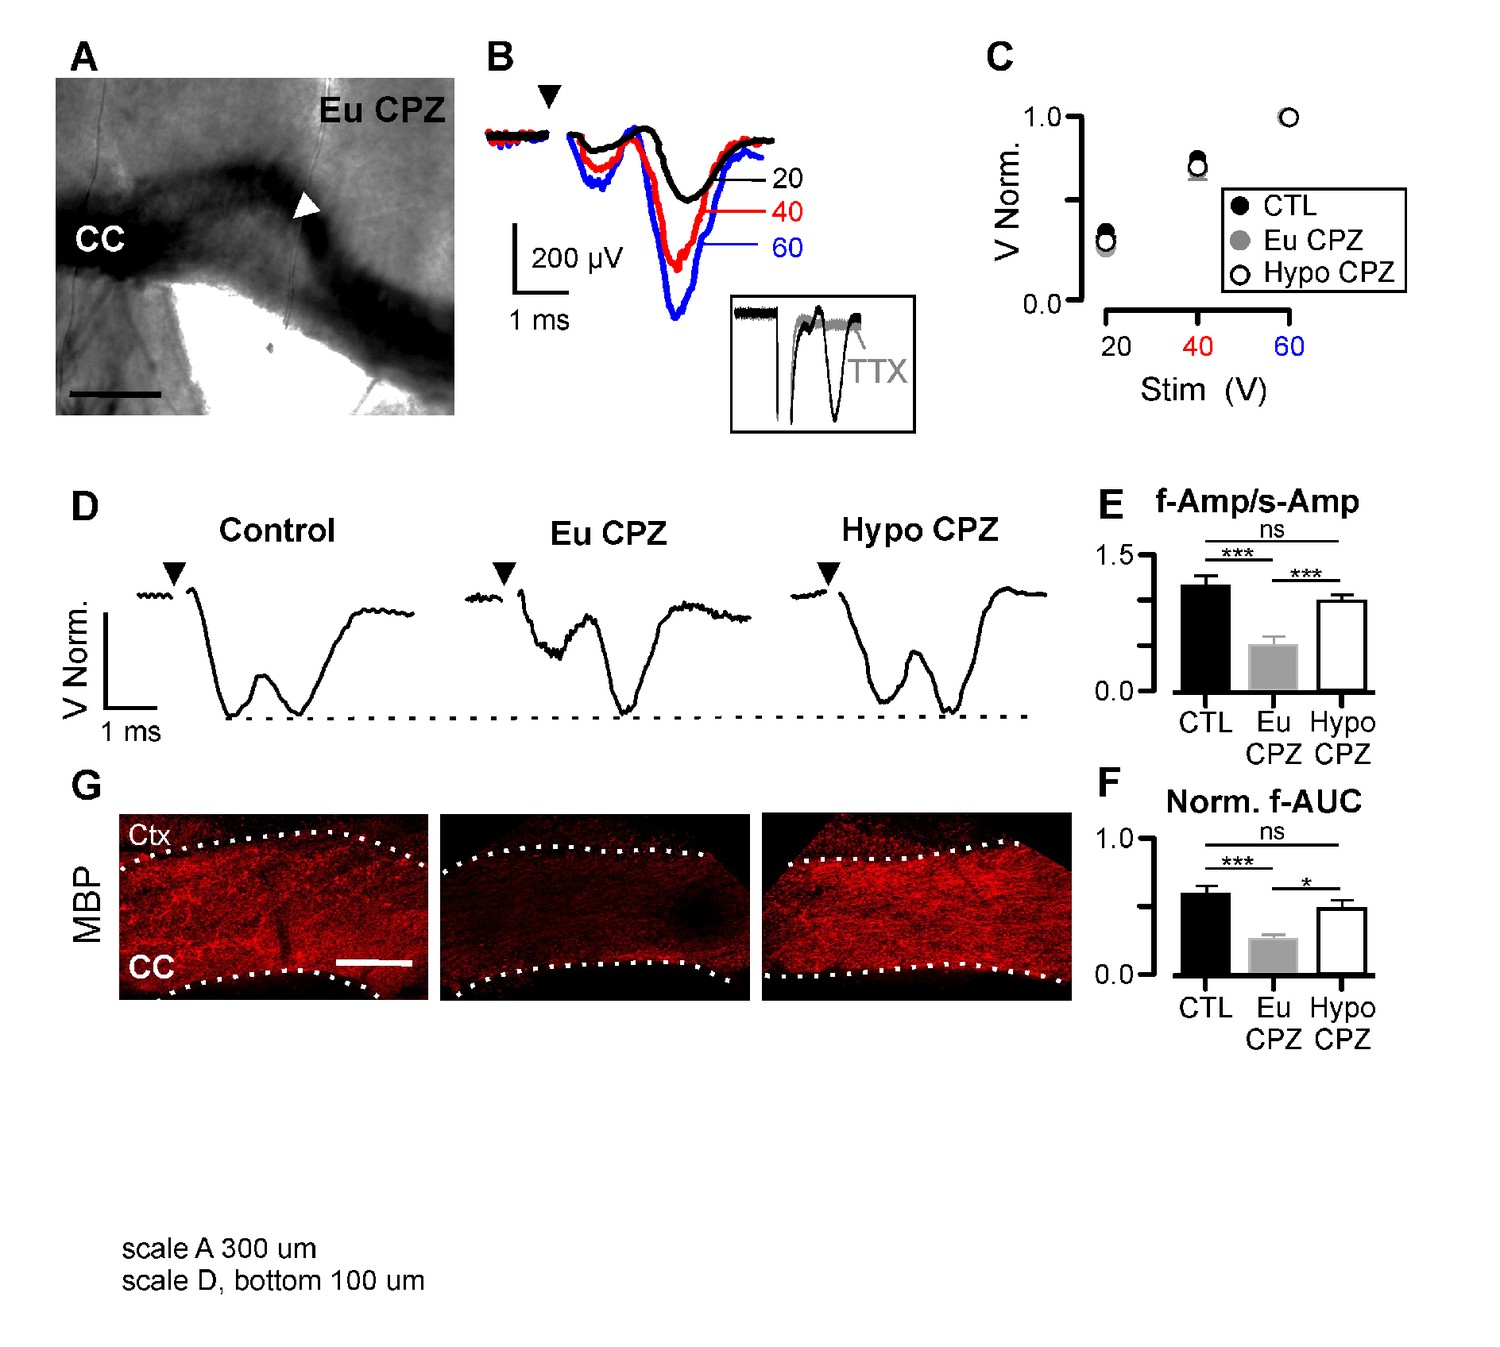
Hypothyroidism during demyelination induces functional recovery of myelinated axons.
(A) Differential interference contrast image showing a brain slice (coronal view) from the CPZ group. CC = corpus callosum, arrowhead indicates the demyelinated lesion. (B) CAPs obtained following three different stimulation strengths (20, 40 and 60 V) for the brain slice shown in (A). CAPs were obtained after substraction of the electrical artefact recorded in presence of TTX 1 µM (inset). (C) CAP amplitudes normalized by the response at 60V. No differences were found between groups at any stimulation strength (n = 10–14 per group per stimulation value, p>0.05; Two-way Anova test). (D) Representative examples of CAPs (upper panels) for the studied groups. (E) Amplitude ratio between fast and slow components of the CAP (f-Amp/s-Amp, n = 10–14 per group, ***p<0.001; Kruskal-Wallis test followed by a Dunn’s multiple comparison post-hoc test). (F) Normalized area under the curve for the fast component of the CAP (f-AUC, n = 10–14 per group, ***p<0.001, *p<0.05, Kruskal-Wallis test followed by a Dunn’s multiple comparison post-hoc test). (G) MBP expression was assessed by immunostaining after the recordings (bottom panels), CC = corpus callosum, Ctx = cortex. Scale bars: 300 µm in (A), 100 µm in (G).
-
Figure 2—source data 1
Hypothyroidism during demyelination induces functional recovery of myelinated axons.
- https://doi.org/10.7554/eLife.29996.009
Figure 2—figure supplement 1
Differential interference contrast image (coronal view) of recorded acute slices from control, EuCPZ and HypoCPZ groups.
CC = corpus callosum. Scale bar: 200 µm.
Figure 3 with 1 supplement
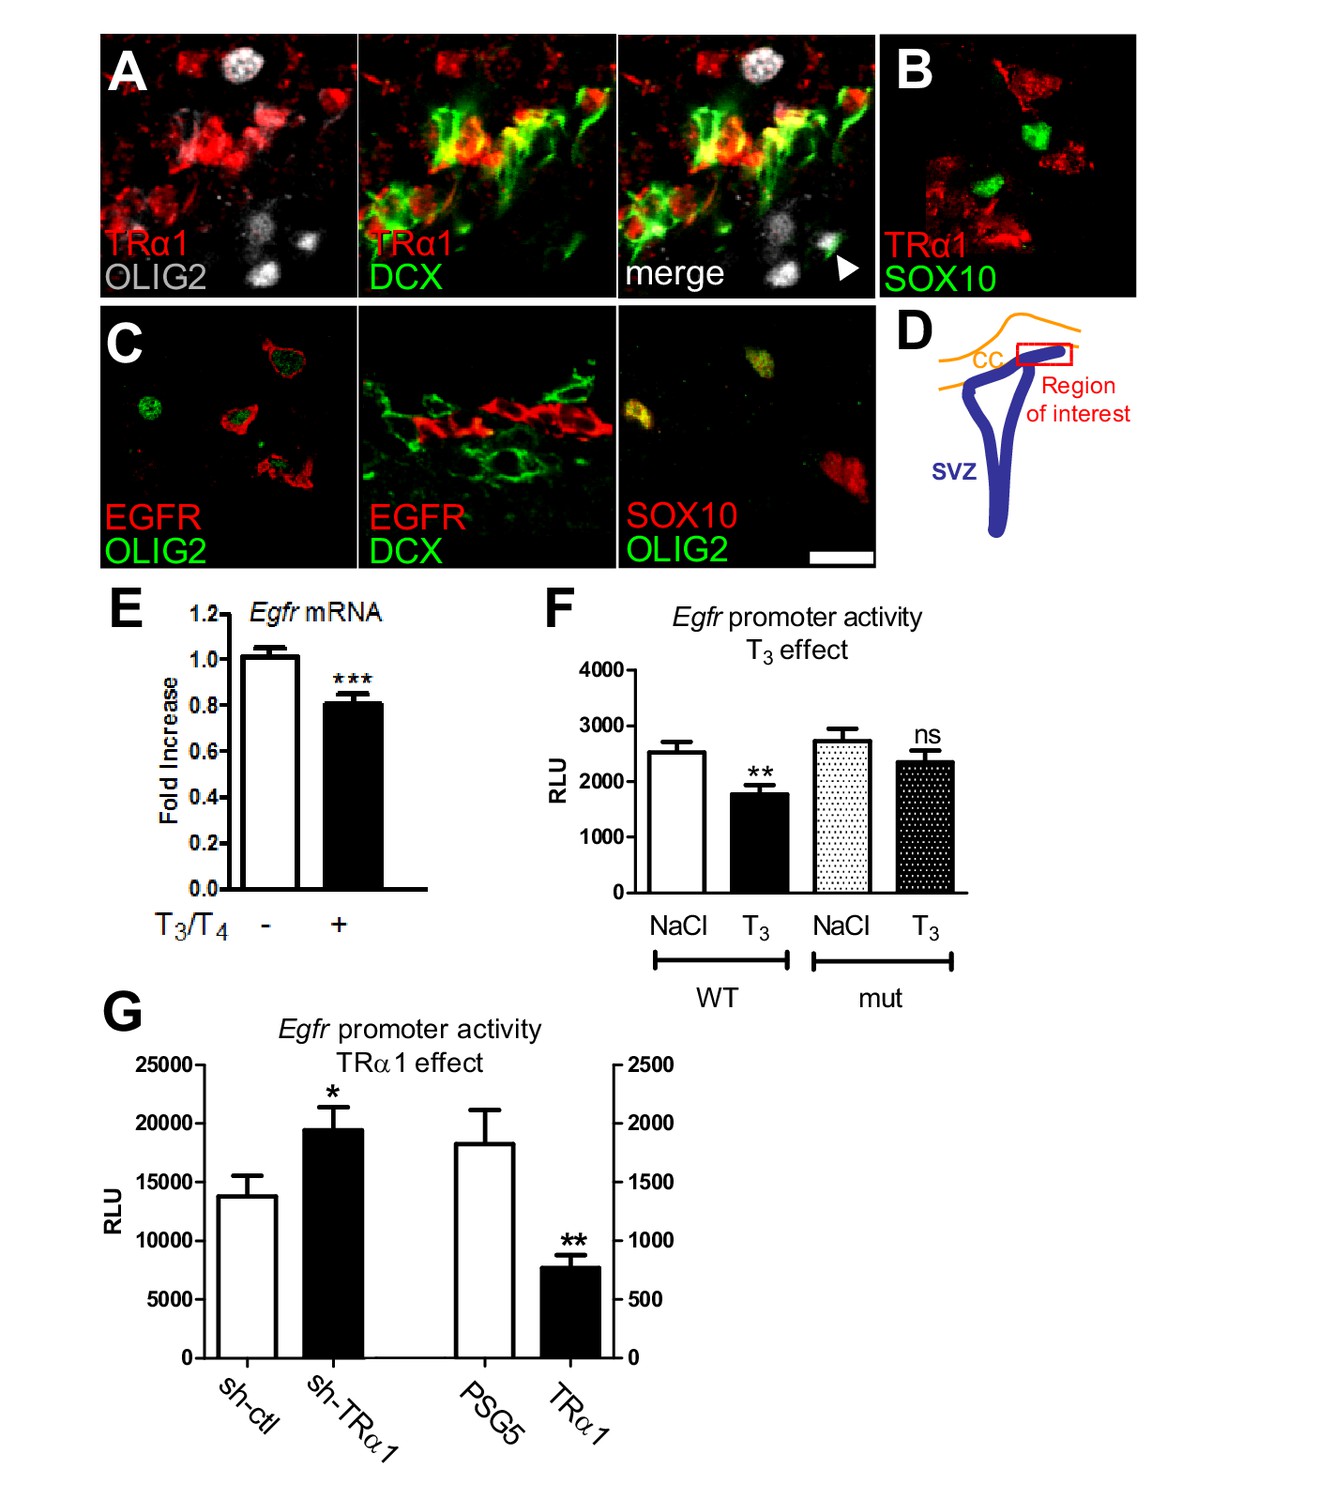
T3/TRα1 signaling is excluded from the oligodendroglial lineage and represses EGFR expression in adult SVZ.
(A–D) Coronal sections of adult SVZ treated for immunohistochemistry, TRα1 (red in A and B) is not expressed in OLIG2+ (grey) oligodendrocyte progenitors (A), nor SOX10+ (green) oligodendrocyte progenitors (B), but is expressed in DCX+(green) neuroblasts (A) in the adult mouse SVZ. EGFR (red) is expressed in OLIG2+ (green) oligodendrocyte progenitors (C) but not in DCX+ (red) neuroblasts (middle panel in C). OLIG2 (red) and SOX10 (green) are co-expressed in oligodendrocyte progenitors (right panel in C), but very few OLIG2+ cells express DCX (white arrowhead in A). (D) Schematic representation of the brain area investigated. Tagged TRα1 was detected in TRα+/° mutant mice using a β-Gal antibody (A). To examine TRα1 expression in WT mice (B) a TRα1 antibody verified on TRα+/° mutant mice (see materials and methods) was used. Scale bar: 10 µm. (E) T3 represses Egfr transcription in the adult SVZ. (means ± SEM, three experiments are pooled, n = 12 mice, **p=0.001, t = 3.64, df = 30; unpaired two-tailed Student’s t test) (F) In vivo, T3 repression of Egfr-luc requires an intact TRE. Transcription from wild-type (WT) and mutated (mut) constructs was compared following saline (NaCl) or T3 injection. (means ± SEM, three experiments were pooled, n = 21–24 mice per group, **p<0.01. Kruskal-Wallis test followed by a Dunn’s post-hoc test) (G) Transcription from pEgfr-Luc following loss (sh-TRα1 versus sh-ctl; means ± SEM, n = 16 mice, *p=0.039, t = 2.16, df = 27; Unpaired two-tailed Student’s t test) and gain (TRα1 over-expression versus control plasmid PSG5; means ± SEM, n = 12 mice, **p=0.043, t = 3.40, df = 14; Unpaired two-tailed Student’s t test with Welch’s correction) of TRα1 function.
-
Figure 3—source data 1
T3/TRα1 signaling is excluded from the oligodendroglial lineage and represses EGFR expression in adult SVZ.
- https://doi.org/10.7554/eLife.29996.012
Figure 3—figure supplement 1
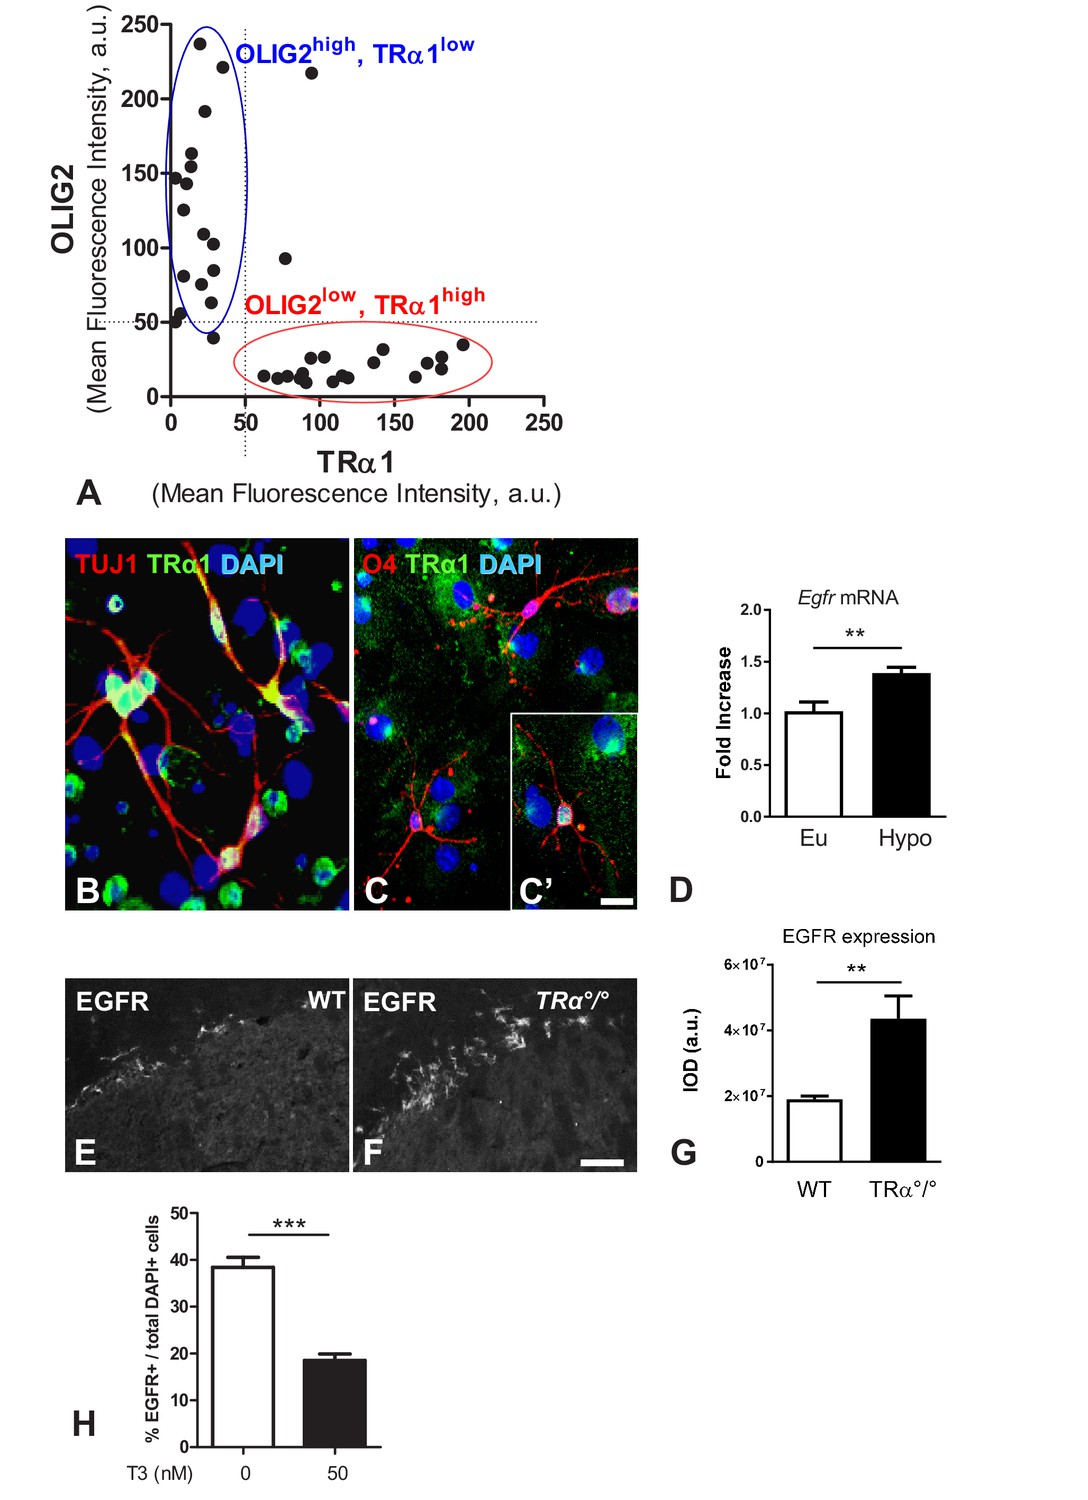
TRα1 signalling is associated with a neuronal fate in vitro and in vivo.
(A) Analysis of TRα1 (β-Gal) and OLIG2 fluorescent signals. Two distinct cell populations are discriminated: a population of OLIG2high/TRα1low (blue circle) is clustered as a separate population of OLIG2low/TRα1high (red circle). (B–C’) Neurospheres were generated from SVZ sampled from WT adult mice. Dissociated cells from neurospheres were induced to differentiate. Following 7 days differentiation, immunolabelling for TRα1 (green), the neuronal marker TUJ1 (red, B), the oligodendrocyte marker O4 (red, C and C’) were performed. Endogenous TRα1 is detected in all TUJ1+ neuronal cells (B) and can be found in more mature O4+ glial cells (C and C'). DAPI nuclear staining revealed all cells in the slides. Scale bar: 5 µm. (D) T3 represses Egfr expression in the adult SVZ. SVZ of long-term hypothyroid adult mouse brains (versus euthyroid) were dissected and Egfr mRNA quantified by qPCR and normalized against GAPDH using the DDCt method. Egfr levels are given as a function of control levels. (mean ± SEM, Pooled data from three experiments are given, n > 12 mice, **p=0.008, U = 4, Mann-Whitney test). (E and F) Immunodetection of EGFR in the dorsal part of the SVZ from WT (E) or TRα°/° (F) adult mice showing that TRα1 loss of function increases the EGFR+ population in the adult mouse SVZ. Scale bar: 50 µm. (G) Quantification of EGFR signal in the dorsal part of the adult SVZ of WT versus TRa°/° mice (Data are presented as mean IOD ± SEM, n = 8, 4 slices from 2 animals, **p=0.0022, U = 3, Mann Whitney test). IOD, Integrated Optical Density. (H) Quantified proportion of EGFR-positive cells after 7 days differentiation in presence or not of T3 (50 nM). (mean ±SEM, n = 16, ***p=0.0002, Mann-Whitney test).
Figure 4
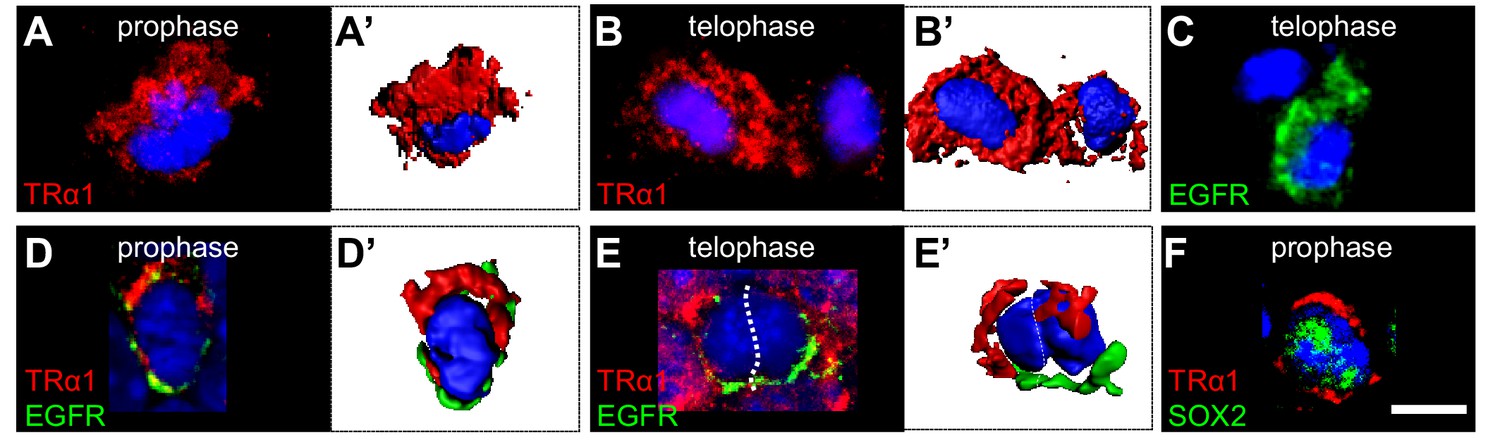
Asymmetric TRα1/EGFR segregation in the adult SVZ.
(A–F) TRα1 and EGFR segregate asymmetrically in the adult SVZ in vivo. Coronal sections of WT adult mouse brain across the lateral ventricles were immunostained with anti-TRα1 (red) and/or anti-EGFR (C-E’, green) or anti-SOX2 (F, green) antibodies. Mitotic figures in the SVZ were identified under confocal microscopy (A–F) and 3D reconstructions (A’, B’, D’, E’) performed. (A and A’) During prophase, TRα1 is preferentially localized at one pole of the dividing cell. (B and B’) In telophase, only one of the daughters (left cell) has inherited largely TRα1. The other (on the right) shows residual TRα1 expression. (C) During telophase, only one daughter cell (lower cell) inherited EGFR. (D and D’) Double labeling for TRα1 and EGFR shows opposite pole localizations during prophase. (E and E’) During telophase, the left daughter is enriched in TRα1 whereas the cell on the right received predominately EGFR. (F) Asymmetric distribution of TRα1 (upper pole) occurs in SOX2+ progenitors Scale bar: 5 µm.
Figure 5 with 2 supplements

Cell-specific Dio3 expression in the adult SVZ.
(A–C) The inactivating deiodinase, Dio3, is detected in SVZ-derived OPCs, but not in DCX+ neuroblasts. (A) Dio3 (grey) is detected in NSC identified by co-expression of SOX2 (red) and Nestin (green) markers. (B) EGFR+ progenitors (green) express high levels of Dio3 (grey). In contrast, Dio3 is hardly or not detected in DCX+ neuroblasts (blue). Dotted squares denote regions magnified in insets. Red asterisks denote EGFR+ progenitors expressing high levels of Dio3. (C) In the Pdgfrα-H2B:GFP transgenic adult mouse (nuclear GFP staining), Dio3 (grey) is highly expressed in SVZ-derived OPCs (GFP+ cells). (D) Immunostaining against PH3 (mitotic marker, red) and (E) OLIG2 (OPC marker, green) following stereotaxic injection into the SVZ of shDio3 or sh-control (shctl) plasmids. Dotted squares denote regions magnified in insets. Quantification of PH3+ (mean ± SEM, two experiments were pooled, n = 12 slides from 6 animals, **p=0.0097, U = 11, Mann Whitney test) and OLIG2+ (mean ± SEM, two experiments were pooled, n = 10 slides from 6 animals, *p=0.0325, t = 2.316, df = 18; Unpaired two-tailed Student’s t test) cells in the SVZ in the injected hemisphere. Scale bar in A-C: 10 µm, in D and E: 20 µm (inset, 50 µm).
-
Figure 5—source data 1
Cell-specific Dio3 expression in the adult SVZ.
- https://doi.org/10.7554/eLife.29996.017
Figure 5—figure supplement 1
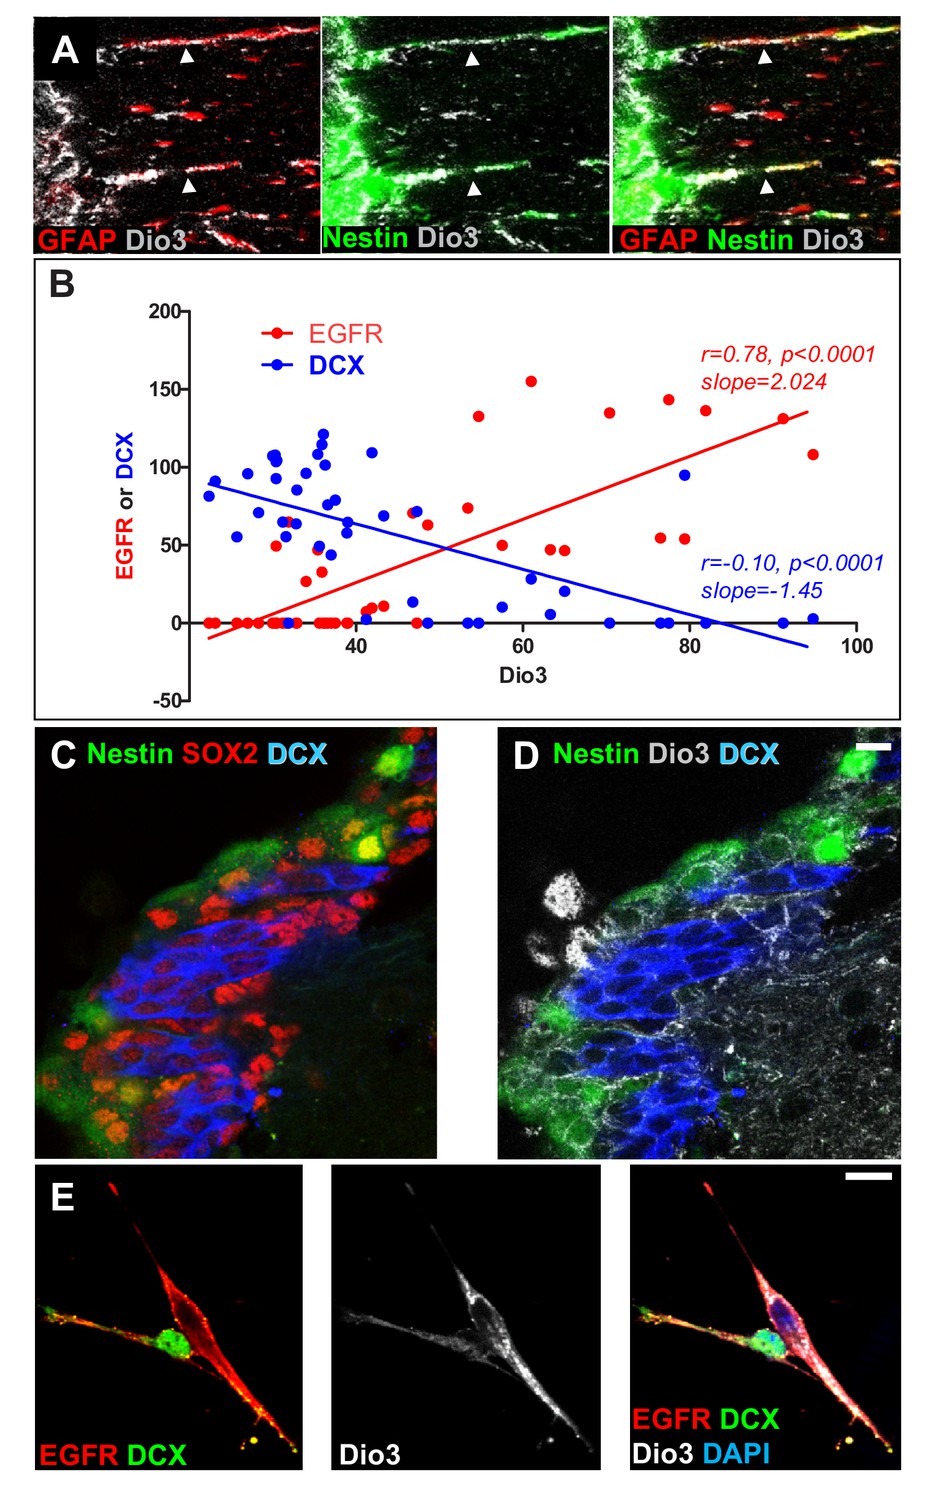
Expression of the inactivating deiodinase, Dio3, excludes TH signalling from NSC, progenitors and oligodendrocyte progenitors.
(A) The SVZ from nestin:GFP adult mice was double-stained with anti-GFAP (red) and anti-Dio3 (grey) antibodies. Note that Dio3 is highly expressed in the radial process of Nestin+ and GFAP+ NSC (arrowheads). (B) Correlations between the expression levels of Dio3 (black, y axis) and EGFR (red, x axis) versus DCX (blue, x axis) expression levels. (C and D) Coronal sections across the lateral ventricle of nestin:GFP adult mouse were stained with anti-SOX2 (red, C), anti-DCX (blue, C and D) and anti-Dio3 (grey, D). Note that Dio3 shows much lower expression in DCX+ neuroblasts but is highly expressed in Nestin (GFP+) and SOX2+ progenitors. (E) Immunolabelling for EGFR (red), DCX (green) and Dio3 (grey) was performed on cells dissociated from neurospheres. Dio3 is strongly expressed in EGFR+ progenitors and much lower expressed in DCX+ neuroblasts.
Figure 5—figure supplement 2

(A and B) SVZ tissues were sampled from WT adult mice for neurosphere culture.
After plating, dissociated cells from neurospheres were induced to differentiate in presence of a short pulse of T3 at four different concentrations (0, 1, 10 and 50 nM). One week after initial plating, cells were fixed and stained with antibodies against DCX (red) and OLIG2 (green). (A) Representative distributions of DCX+ and OLIG2+ cells are shown for each T3 dose. Scale bar: 50 µm (B) Quantification of the DCX/OLIG2 ratio is shown for each dose of T3. The ratio decreased in a dose-dependent manner. (mean ± SEM, n = 4 per group. *p<0.05, Kruskal-Wallis Test).
Figure 6
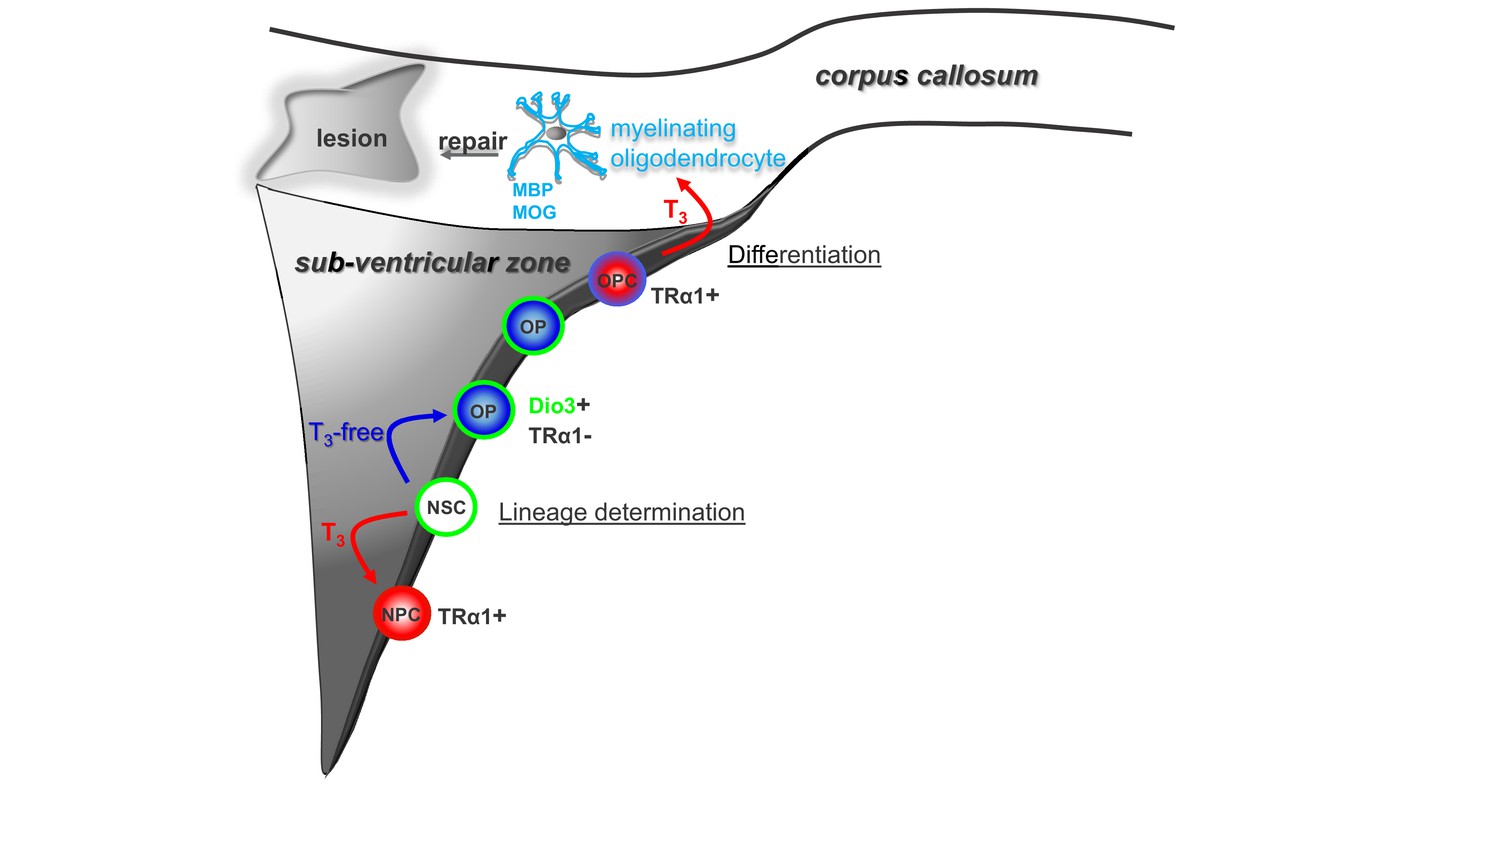
Modulation of timing of thyroid hormone (T3) availability in the adult brain modifies cell fate decisions (neuronal versus oligodendroglial fate choice) in the sub-ventricular zone (SVZ).
T3 through its nuclear receptor, TRα1, favours progenitor commitment toward a neuroblast phenotype. In contrast, a transient lack of T3 (T3-free window) increases numbers of oligodendrocyte progenitors (OPs) and thus SVZ-derived OPCs with the capacity to repair myelin within the corpus callosum (CC) and to restore nerve conduction after a demyelinating insult. Note that, following progenitor asymmetric division, the oligodendrocyte progenitor is protected from the neuralizing effects of T3 by (i) expression of the gliogenic factor EGFR and the T3-inactivating enzyme (Dio3) and by (ii) the exclusion of TRα1.
Additional files
-
Transparent reporting form
- https://doi.org/10.7554/eLife.29996.019
Download links
A two-part list of links to download the article, or parts of the article, in various formats.
Downloads (link to download the article as PDF)
Open citations (links to open the citations from this article in various online reference manager services)
Cite this article (links to download the citations from this article in formats compatible with various reference manager tools)
Transient hypothyroidism favors oligodendrocyte generation providing functional remyelination in the adult mouse brain
eLife 6:e29996.
https://doi.org/10.7554/eLife.29996


