Scc2/Nipbl hops between chromosomal cohesin rings after loading
- Oxford University, United Kingdom
- Centro di Imaging Sperimentale, Italy
- European Center for Nanomedicine, Italy
Figures
Figure 1 with 2 supplements
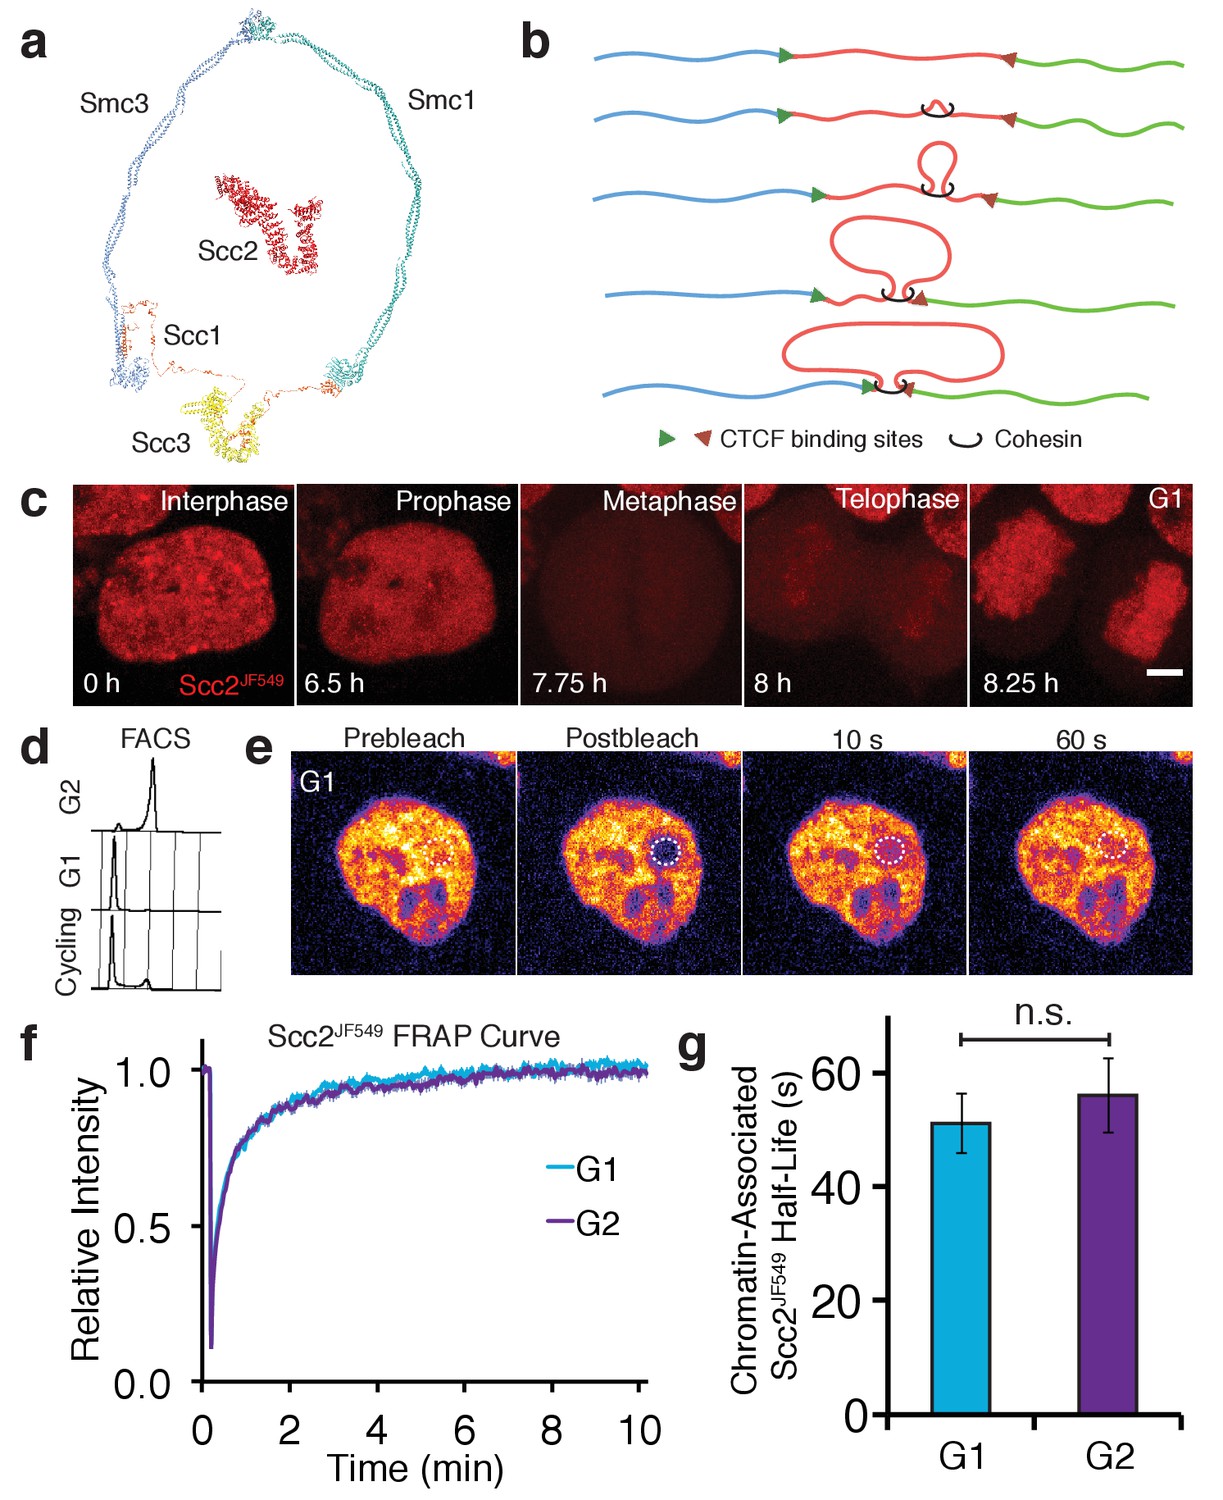
Scc2 interacts with chromatin independent of the cohesin loading reaction.
(a) Model of the cohesin complex and Scc2 based on crystal structures (Scc2 (PDB: 5T8V), Smc1-Scc1 interface (PDB: 1W1W), Smc3-Scc1 interface (PDB: 4U × 3), Smc3-Smc1 interface (PDB: 2WD5), Scc3 (PDB: 4PJU), coiled coil of Smc3 and Smc1 modelled on dynein (PDB: 3WUQ), Scc1 central domain modelled from Scc2 N terminus (PDB: 4XDN). (b) Illustration to demonstrate the formation of TADs by loop extrusion. Loops are progressively enlarged until they reach convergent CTCF sites. (c) Z-projected images from a time-lapse confocal microscopy recording of JF549-Halo-Scc2 (Scc2JF549) in HeLa cells. Time 0 hr = interphase, 6.5 hr = prophase, 7.75 hr = metaphase, 8 hr = telophase and 8.25 hr = G1. Scale bar = 5 µm. (d) FACS analysis of cells stained with propidium iodide either 6 hr (G2) or 15 hr (G1) after release from a double thymidine block, and cycling cells. (e) Still images from a fluorescence recovery after photobleaching (FRAP) experiment. Dashed circle represents bleached region. (f) FRAP curves of Scc2JF549 in G1 and G2. Error bars denote standard error of the mean (s.e.m.). (g) Mean half-life of chromatin bound Scc2JF549 derived from bi-exponential curve fitting of individual experiments from cells in G1 and G2. Error bars denote s.e.m. Unpaired t-test was used to compare conditions. n = 14 cells per condition.
Figure 1—figure supplement 1
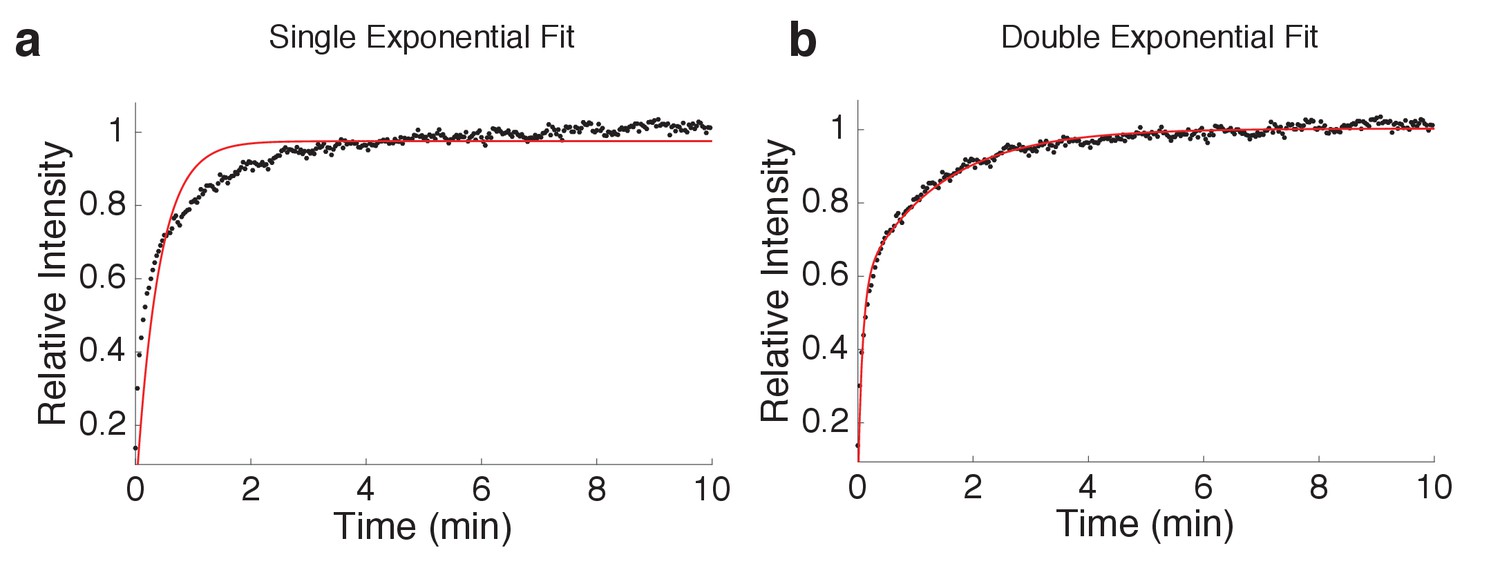
Curve fitting of FRAP experiments.
Single (R2 = 0.80) and bi-exponential (R2 = 0.98) fit of mean spot FRAP of Scc2JF549 in G1 (n = 14) HeLa cells.
Figure 1—figure supplement 2
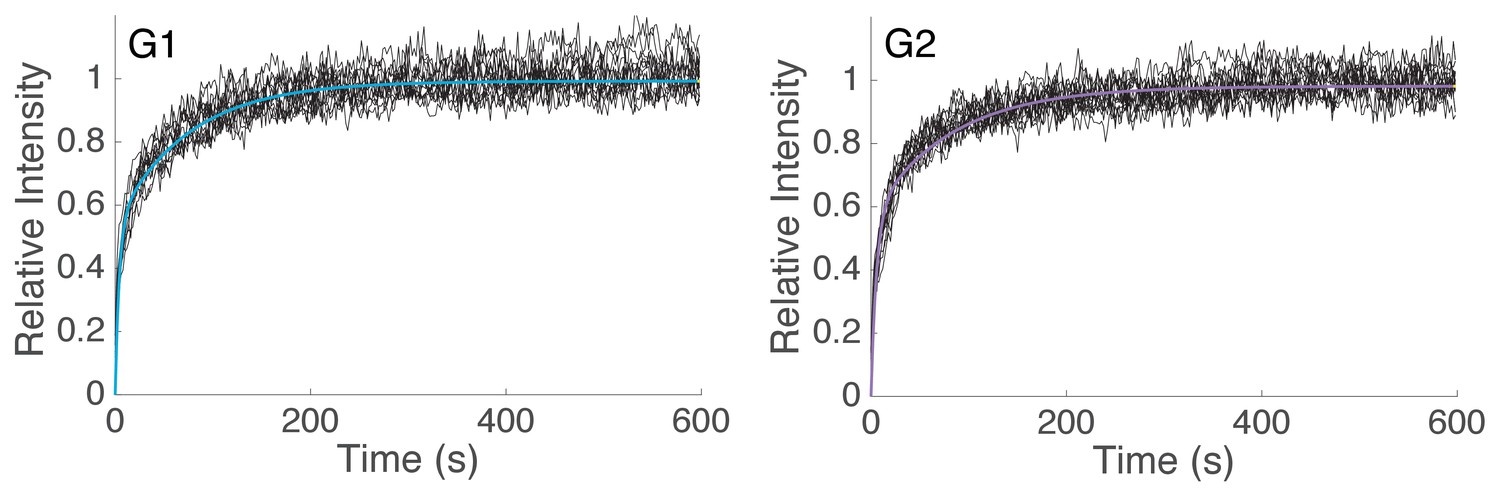
Curve fitting of FRAP experiments.
Bi-exponential fit of spot FRAP of Scc2JF549 in G1 (R2 = 0.981, n = 14) and G2 (R2 = 0.980, n = 14) HeLa cells. Raw fluorescence recovery curves from individual experiments are shown as black lines.
Figure 2 with 1 supplement
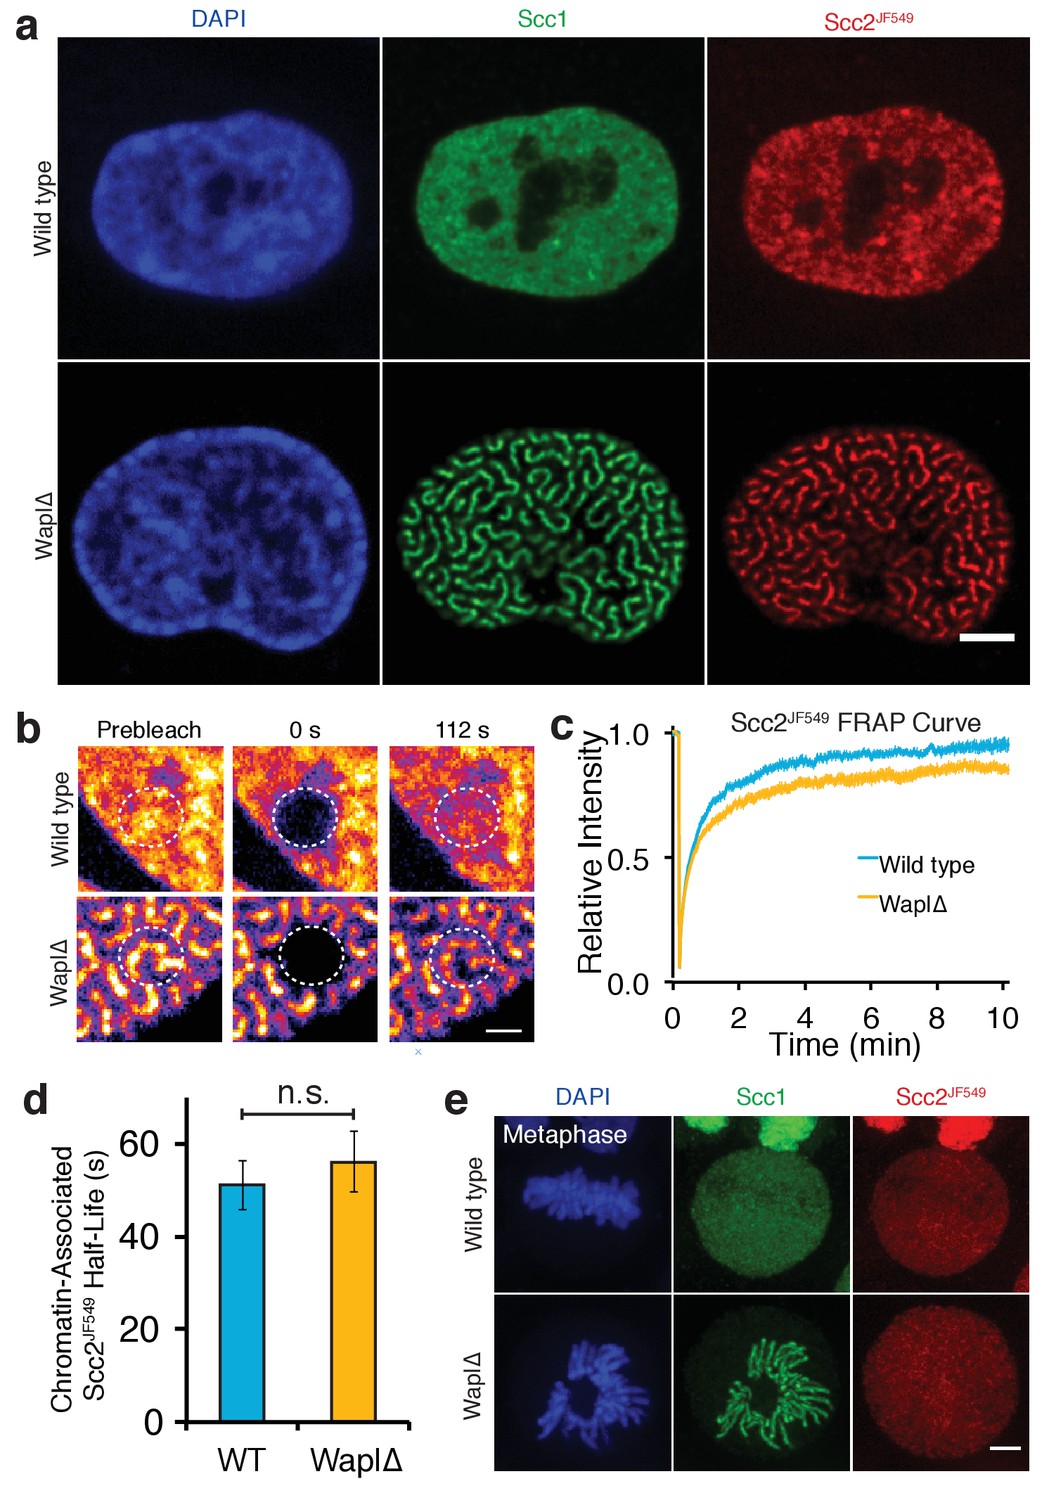
Scc2 binds to cohesin that is already loaded on DNA.
(a) Immunofluorescence microscopy images of wild type and Wapl∆ Halo-Scc2 HeLa cells. Cohesin was stained with an antibody against Scc1 and Halo-Scc2 with JF549. Scale bar = 5 µm. (b) Still images from spot FRAP experiments on Scc2JF549 in asynchronous wild type or Wapl∆ HeLa cells. Dashed circle represents bleached region. Scale bar = 1 µm. (c) FRAP recovery curves from wild type and Wapl∆ cells. Error bars denote s.e.m. n = 14 cells per condition. (d) Mean half-life of chromatin bound Scc2JF549 derived from bi-exponential curve fitting of individual experiments from wild type or Wapl∆ cells. Error bars denote s.e.m. Unpaired t-test was used to compare conditions. n = 14 cells per condition. (e) Immunofluorescence microscopy images of wild type or Wapl∆ Halo-Scc2 HeLa cells in metaphase. Cells were stained as in a. Scale bar = 5 µm.
Figure 2—figure supplement 1
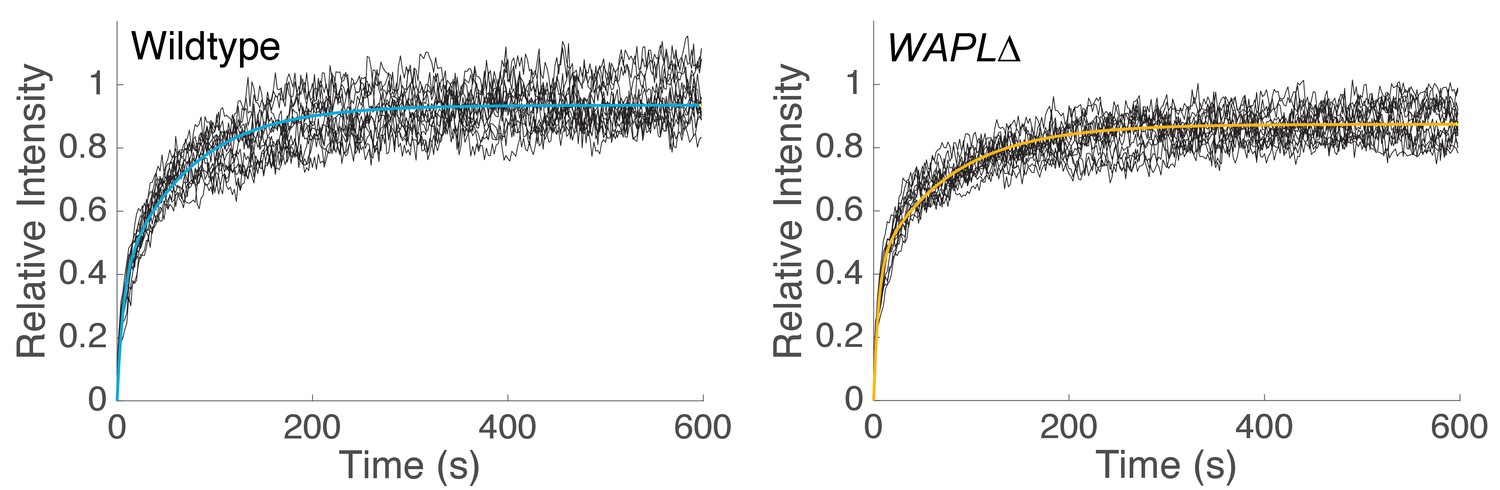
Curve fitting of FRAP experiments.
Bi-exponential fit of spot FRAP of Scc2JF549 in wild type (R2 = 0.989, n = 14) and WAPL∆ (R2 = 0.977, n = 14) HeLa cells. Raw fluorescence recovery curves from individual experiments are shown as black lines.
Figure 3 with 1 supplement
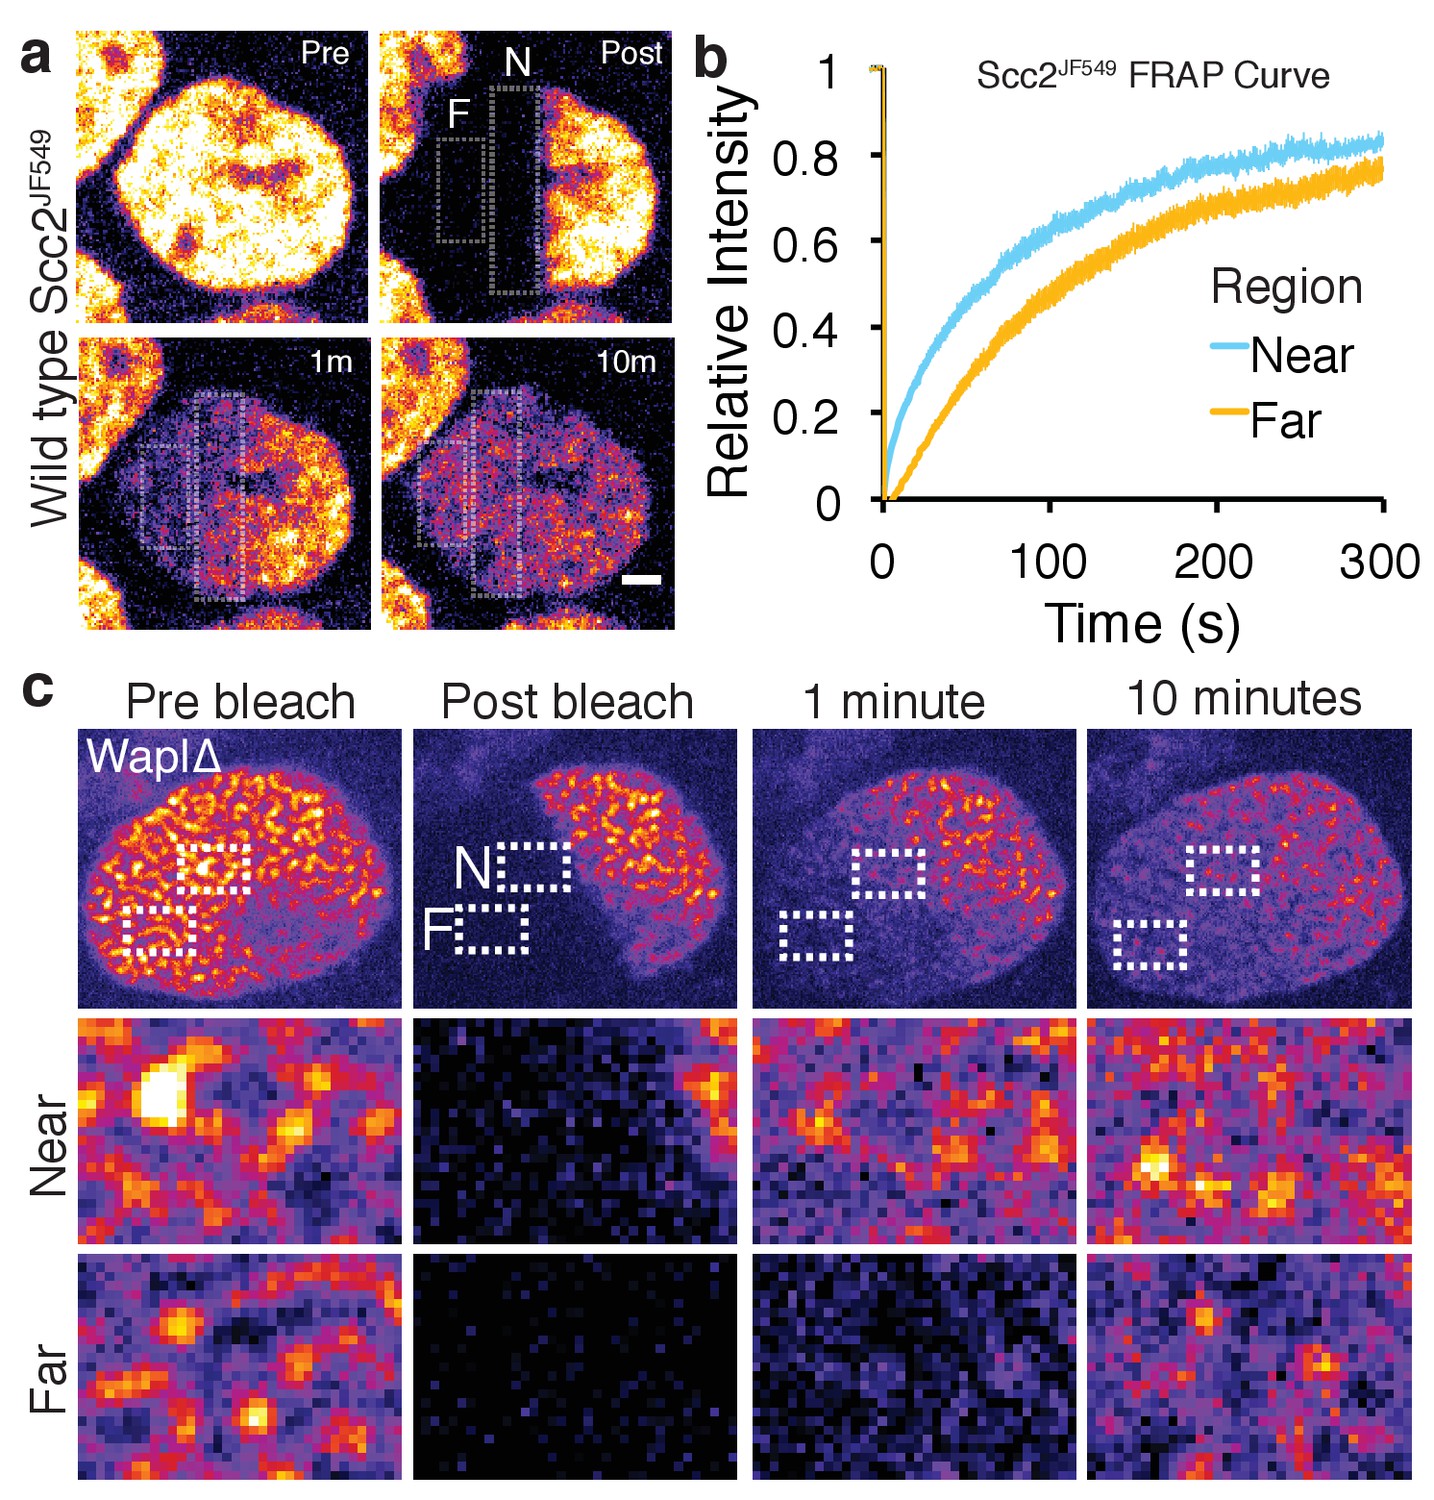
Scc2 hops on chromatin.
(a) Stills from half nuclear FRAP of Scc2JF549 in wild type HeLa cells. Dashed rectangle highlight a region Near (N) to and a region Far (F) from the unbleached half. Scale bar = 2.5 µm. (b) Half-nuclear FRAP curves of Scc2JF549 in wild type HeLa cells. Recovery curves are shown from two zones within the bleached region. One zone is Near to the unbleached zone and the other is Far from the unbleached zone. Error bars denote s.e.m. n = 14 cells per condition. (c) Still images from a half-nuclear FRAP experiment of Scc2JF549 in Wapl∆ HeLa cells. Dashed rectangle highlight a zone near (N) and a zone Far (F) from the unbleached region shown in insets. Scale bar = 1 µm in inset.
Figure 3—figure supplement 1

Scc2 hops on chromatin.
Still images from a stripe FRAP experiment of GFP-Scc2 in Wapl∆ HeLa cells. Dashed line marks the boundary between the bleached and unbleached regions. Scale bar = 5 µm.
Figure 4 with 1 supplement
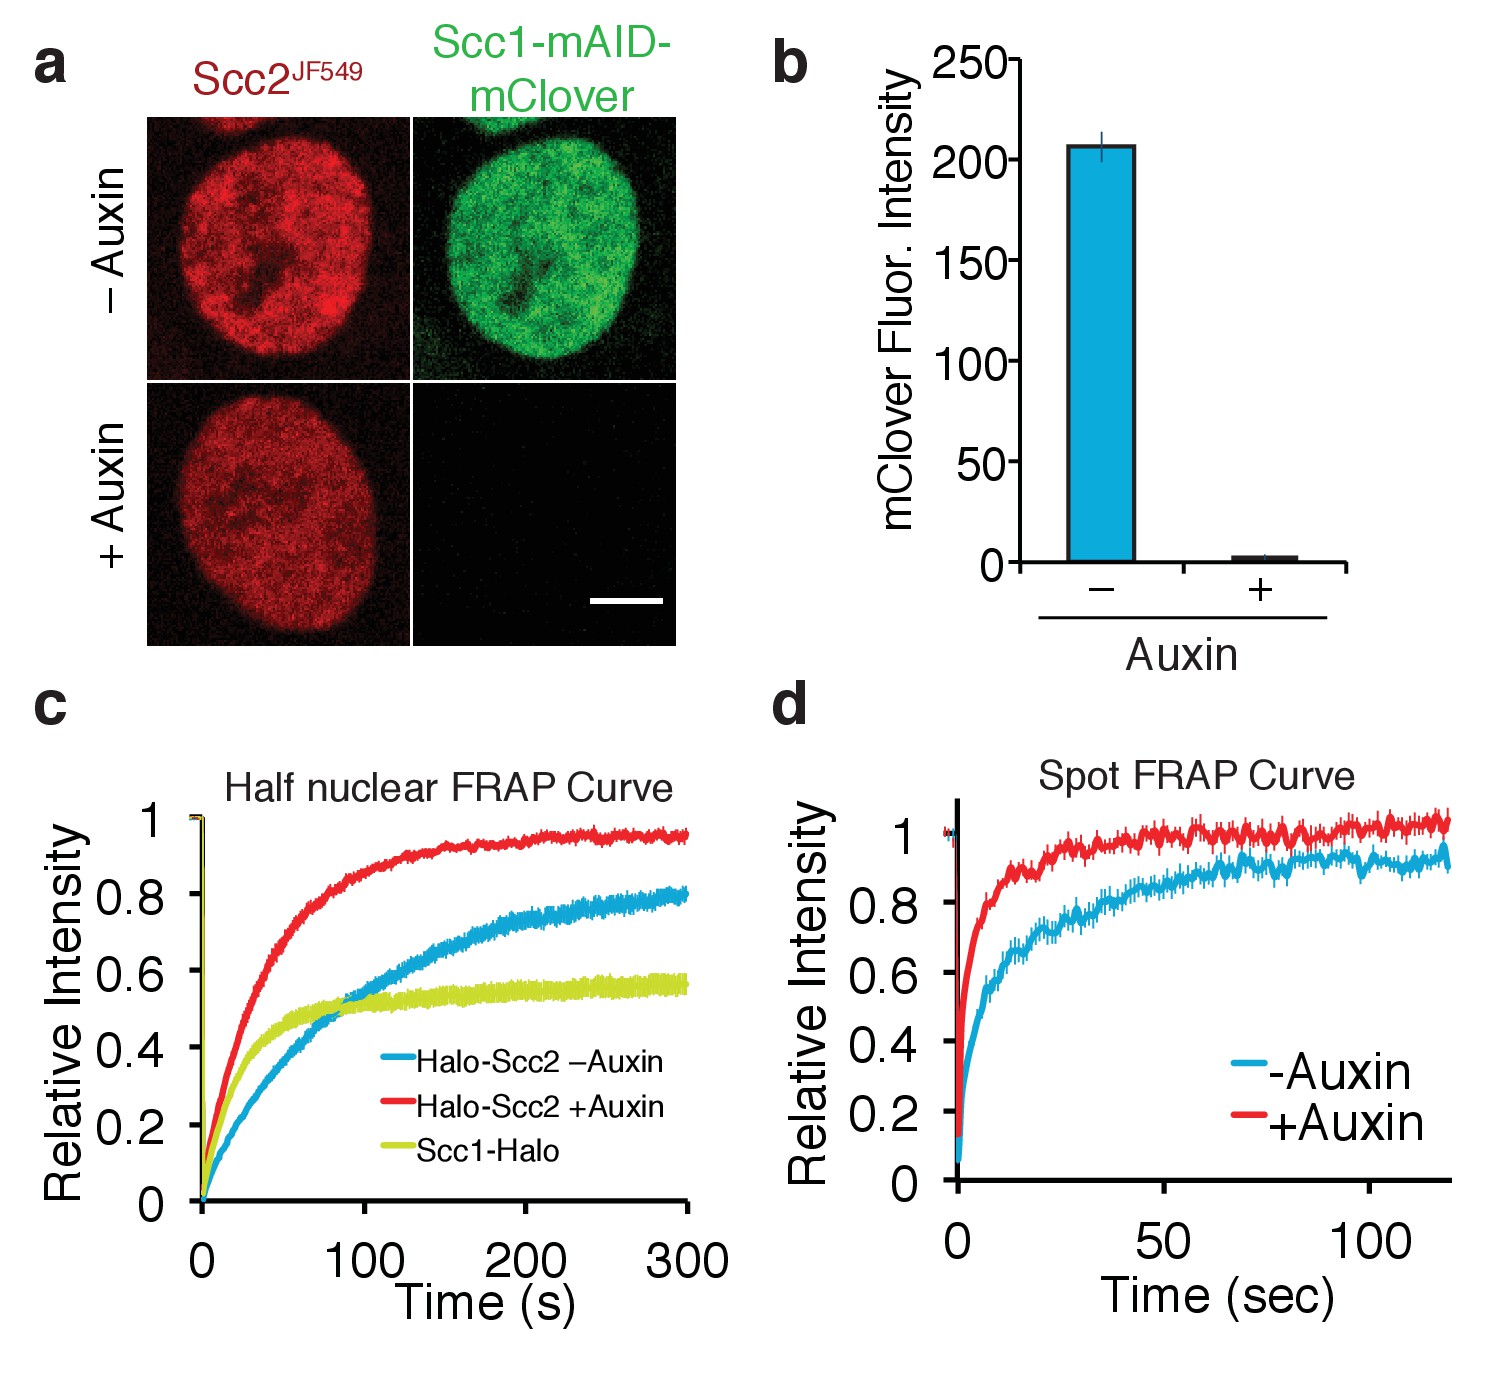
Depletion of core cohesin subunit Scc1 releases most, but not all, Scc2 from chromatin.
(a) Live cell microscopy images of Scc1-mClover-mAID cells ± auxin (500 µM, 1h30 incubation). Scale bar = 5 µm. (b) Graph of fluorescence intensity of Scc1-mClover-mAID ± auxin demonstrates Scc1 degradation. n = 14 cells per condition. (c) Half-nuclear FRAP recovery curves of asynchronous HCT116 cells ± auxin. Error bars denote s.e.m. n = 14 cells per condition. (d) Spot FRAP recovery curves from asynchronous HCT116 cells ± auxin. Error bars denote s.e.m. n = 13 cells per condition.
Figure 4—figure supplement 1
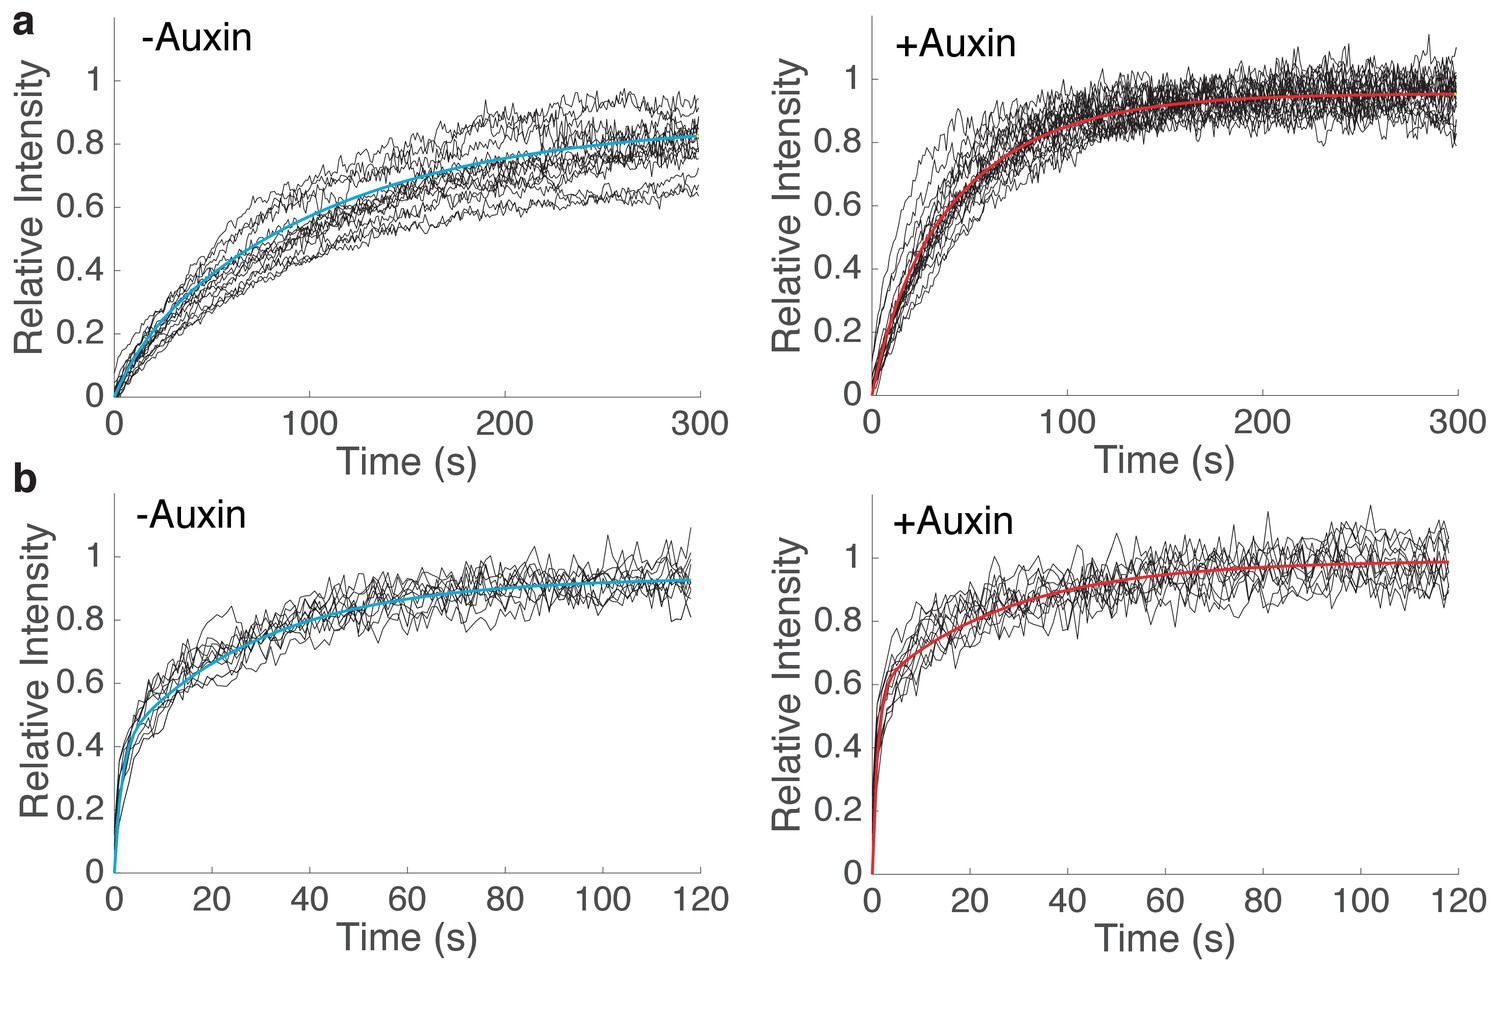
Curve fitting of FRAP experiments.
(a) Single exponential fit of Half-Nuclear FRAP of Scc2JF549 in Scc1-mAID-mClover Tir1 HCT116 cells before (R2 = 0.997, n = 14) or after (R2 = 0.996, n = 14) addition of auxin. (b) Bi-exponential fit of spot FRAP of spot FRAP of Scc2JF549 in Scc1-mAID-mClover Tir1 HCT116 cells before (R2 = 0.992, n = 13) or after (R2 = 0.971, n = 13) addition of auxin. Raw fluorescence recovery curves from individual experiments are shown as black lines.
Figure 5
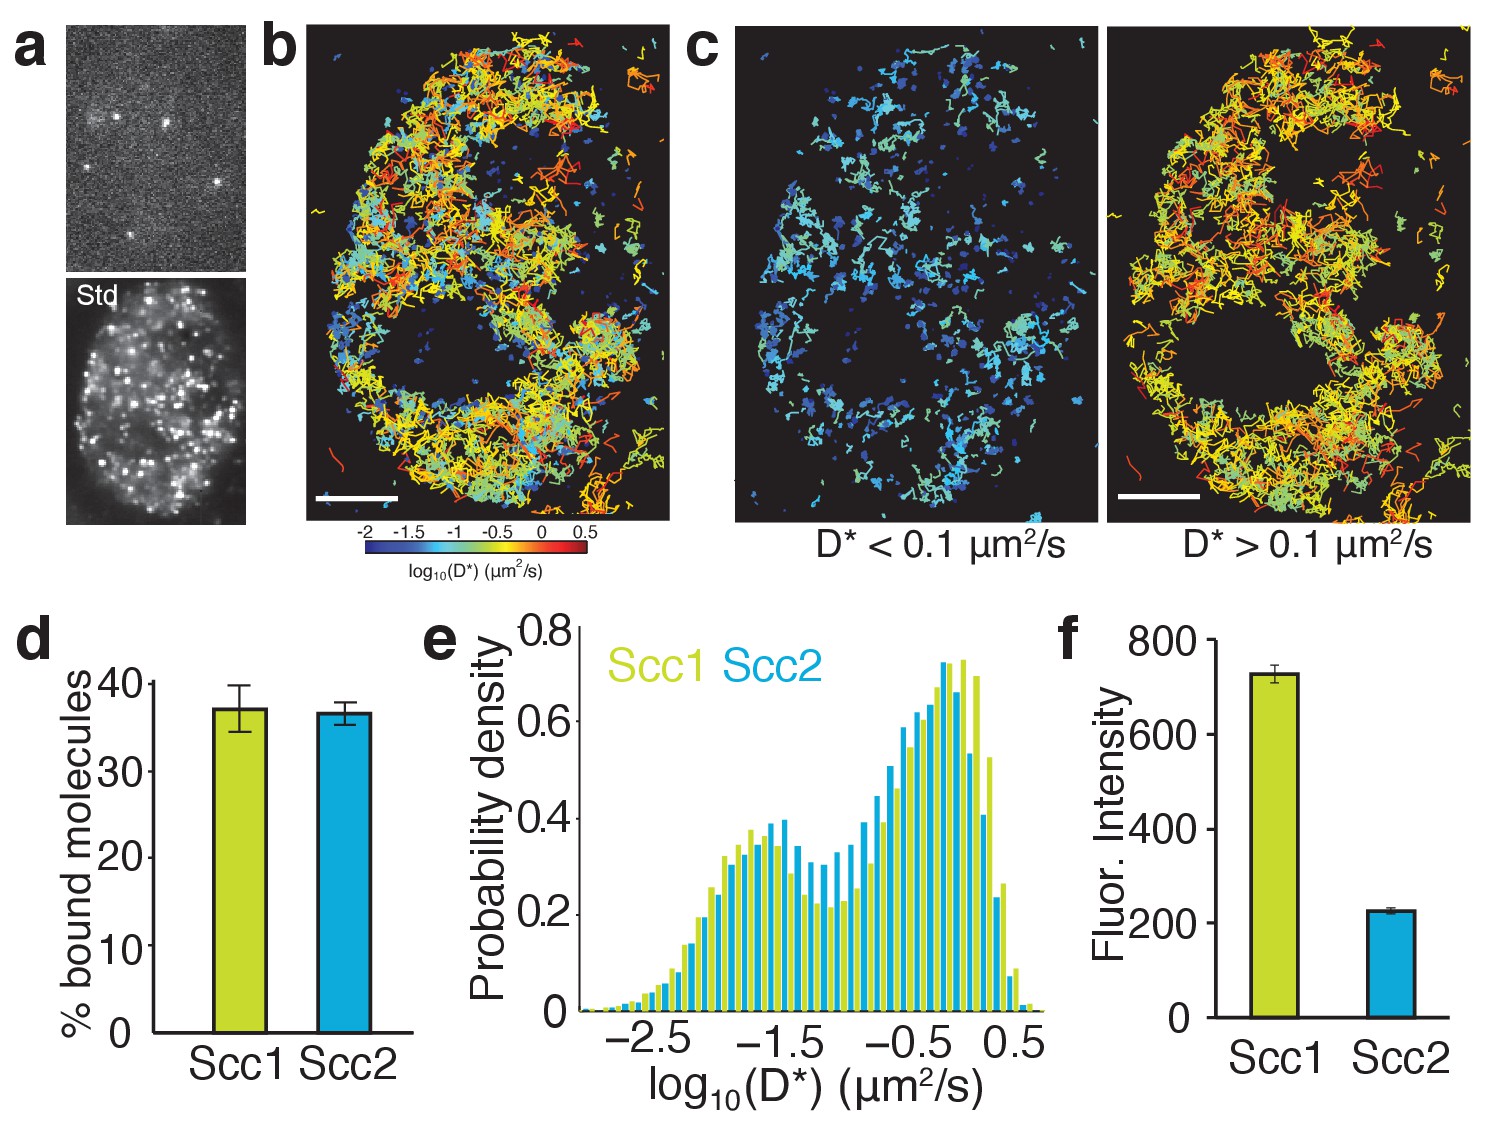
Single-molecule tracking of Scc2 and Scc1 in live cells.
(a) Example frame from a tracking movie showing fluorescent spots of single Scc2JF549 molecules. Standard deviation (Std) of pixel intensities from a movie shows the spatial distribution of Scc2JF549. (b) Map of Scc2JF549 tracks in an HCT116 cell. Each track shows the movement of a single molecule; colours represent the average diffusion coefficient per track. (c) Tracks of immobile (D*<0.1 µm2/s) and mobile (D*>0.1 µm2/s) Scc2JF549 molecules. (d) Percentage of molecules classified as immobile (D*<0.1 µm2/s) for Scc2 and Scc1. n > 10 cells. (e) Log-scale distribution of apparent diffusion coefficients D* for Scc2 (blue) and Scc1 (green). n > 10 cells. (f) Fluorescence intensity (a.u.) of Scc2JF549 and Scc1JF549. n > 10 cells.
Figure 6
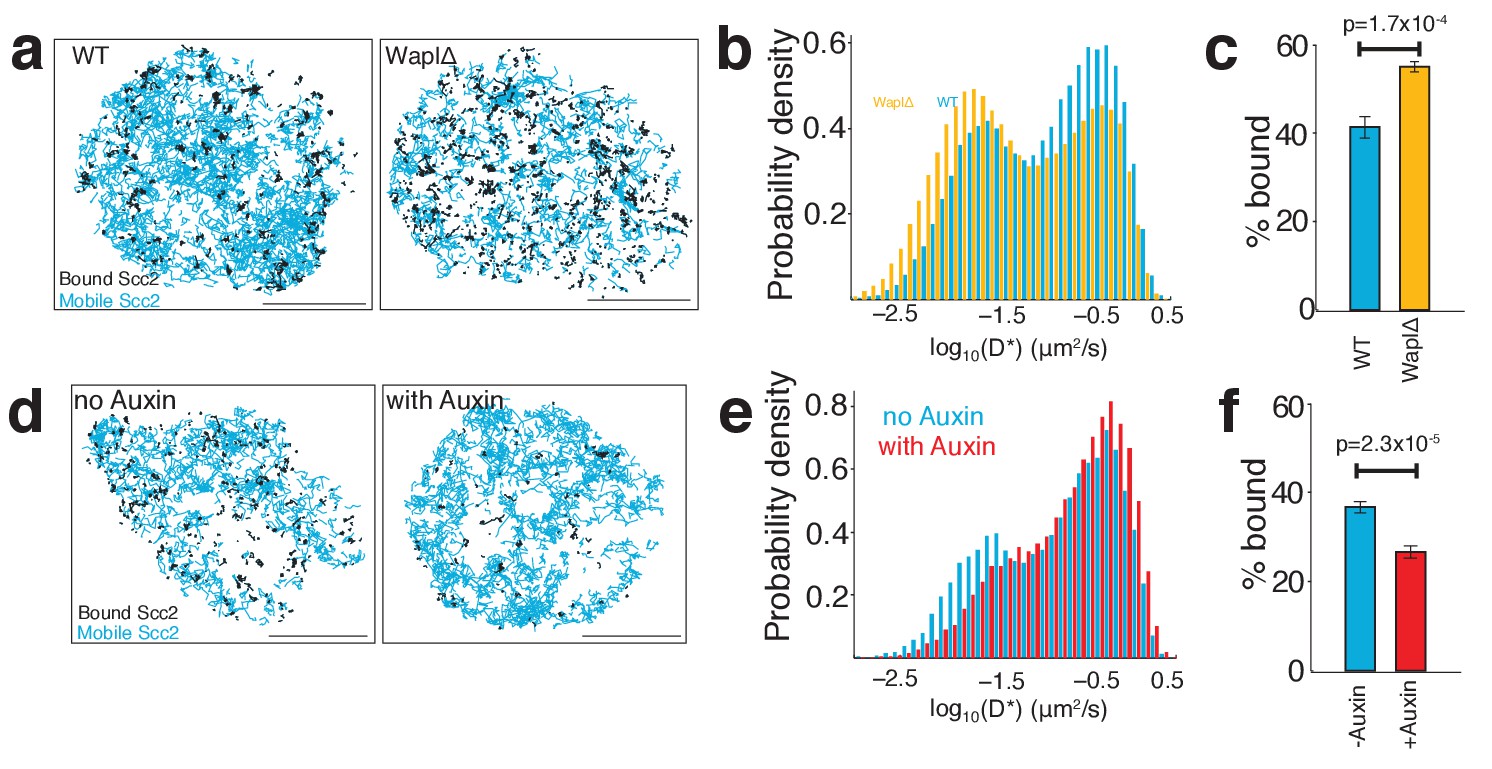
Scc2 binding is altered by the abundance of chromatin-associated cohesin.
(a) Maps of Scc2JF549 tracks in wild type and Wapl deficient HeLa cells with immobile molecules (D*<0.1 µm2/s) in black and mobile molecules (D*>0.1 µm2/s) in blue. Scale bars = 5 µm. (b) Log-scale distribution of apparent diffusion coefficients D* of Scc2 in wild type and Wapl deficient cells. n > 10 cells. (c) Percentage of immobile Scc2 molecules in wild type and Wapl deficient cells. Unpaired t-test was used to compare conditions. n > 10 cells. (d) Maps of Scc2JF549 tracks in HCT116 cells ± auxin-mediated degradation of Scc1. Immobile molecules (D*<0.1 µm2/s) shown in black and mobile molecules (D*>0.1 µm2/s) in blue. n > 10 cells. (e) Log-scale distribution of apparent diffusion coefficients D* of Scc2 ± degradation of Scc1 with auxin. n > 10 cells. (f) Percentage of immobile Scc2 molecules ± degradation of Scc1 with auxin. Unpaired t-test was used to compare conditions. n > 10 cells.
Figure 7
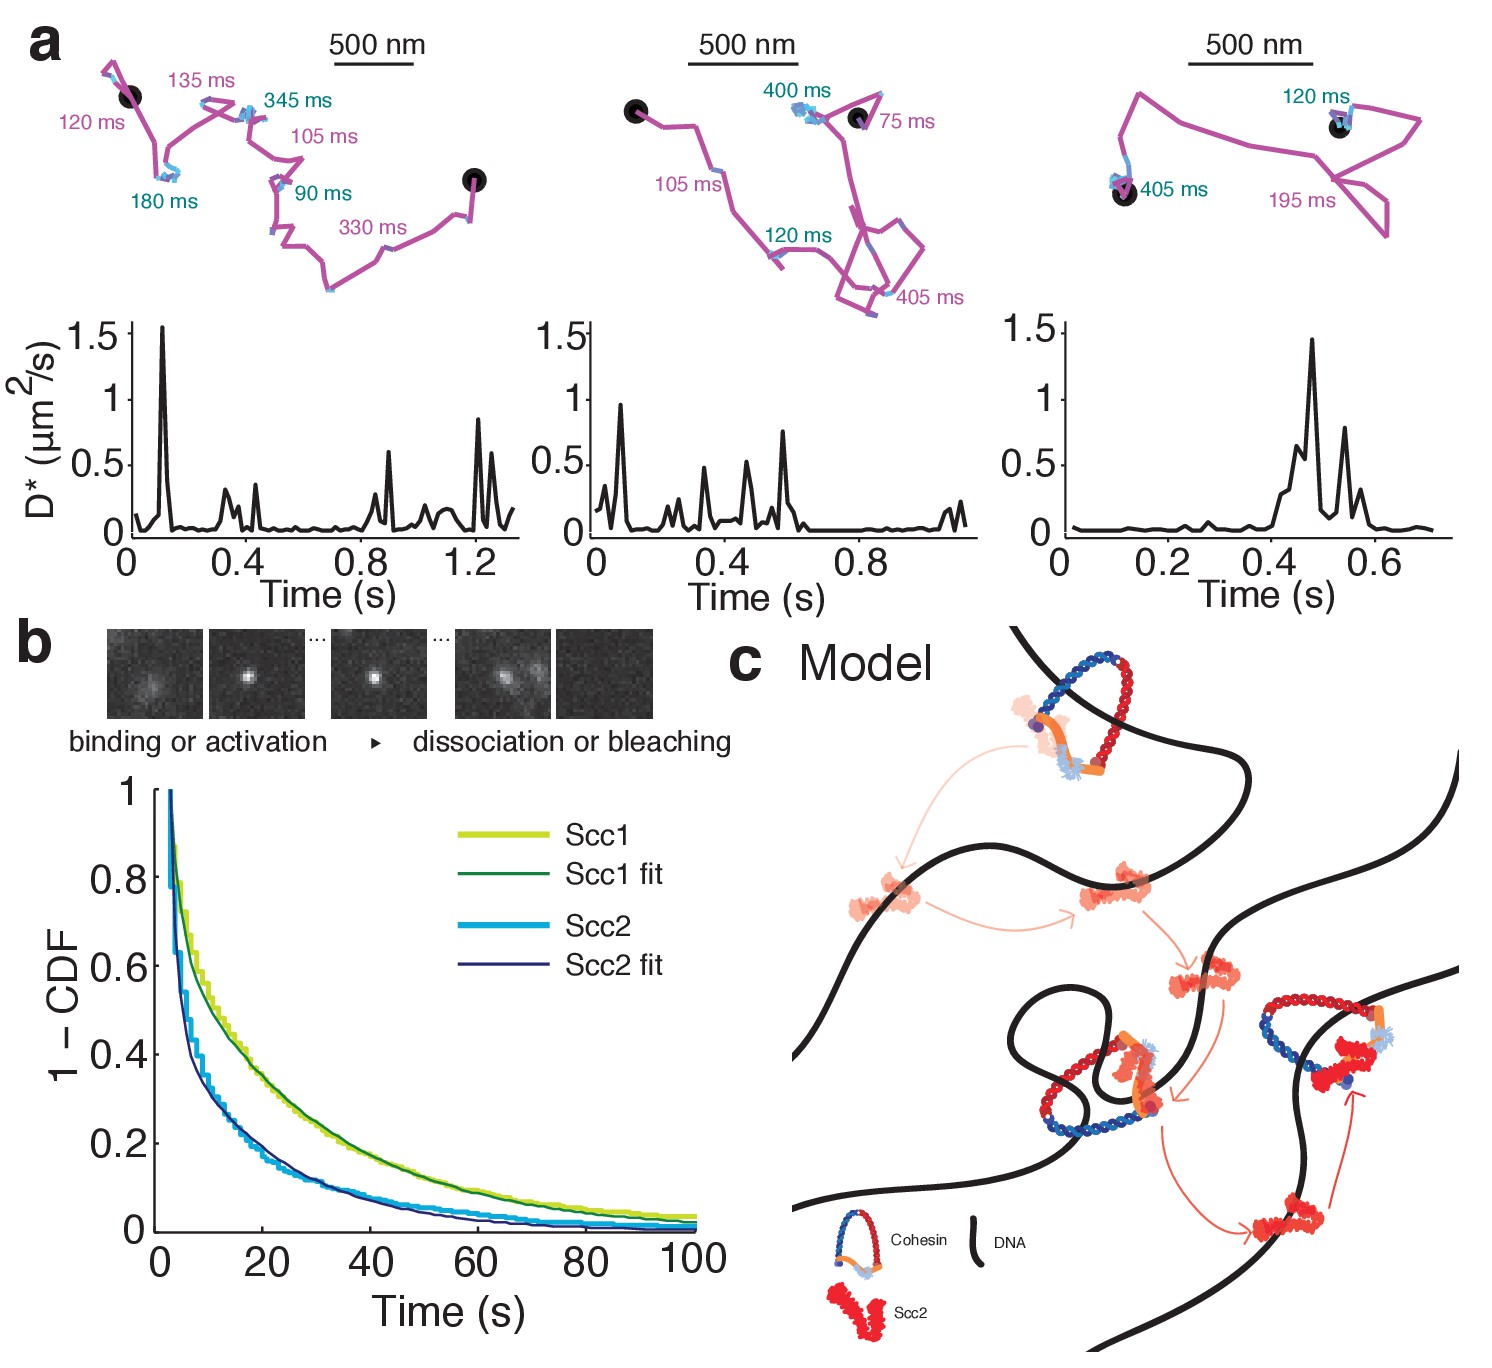
Scc2 hops between cohesin binding sites.
(a) Example tracks show dynamic binding and unbinding of Scc2JF549 on a sub-second time-scale. Intervals of diffusive motion (purple) are frequently interrupted by short binding events (cyan). The durations of the mobile or bound intervals are shown. Scale bars = 500 nm. Underneath: Time traces show the instantaneous apparent diffusion coefficient corresponding to each track. (b) Binding time of immobile Scc2JF549 molecules. Example frames at 1 s exposures showing a blurred diffusing molecule that produces a sharp spot upon binding until it unbinds or bleaches. Distributions (1 - cumulative distribution function) of measured dwell times of immobile Scc2 and Scc1 molecules and fitted curves. n > 10 cells. (c) Model of Scc2 dynamics: Scc2 hops between cohesin that is loaded on DNA. Between binding events with cohesin it interacts with chromatin in two binding modes. One is very transient and probably non-specific and the other lasts tens of seconds. The longer interaction may represent Scc2’s cohesin-independent role as a transcription regulator.
Videos
Video 1
Time-lapse live cell microscopy of Scc2JF549 in wild type HeLa cells.
Scale bar = 5 µm.
Video 2
Spot FRAP of Scc2JF549 in Wapl∆ HeLa cells.
Scale bar = 5 µm.
Video 3
Time-lapse live cell microscopy of Scc2JF549 in Wapl∆ HeLa cells.
Scale bar = 5 µm.
Video 4
Stripe FRAPof GFP-Scc2 in Wapl∆ HeLa cells.
Scale bar = 2 µm.
Additional files
-
Transparent reporting form
- https://doi.org/10.7554/eLife.30000.018
Download links
A two-part list of links to download the article, or parts of the article, in various formats.
Downloads (link to download the article as PDF)
Open citations (links to open the citations from this article in various online reference manager services)
Cite this article (links to download the citations from this article in formats compatible with various reference manager tools)
Scc2/Nipbl hops between chromosomal cohesin rings after loading
eLife 6:e30000.
https://doi.org/10.7554/eLife.30000


