Regulation of rice root development by a retrotransposon acting as a microRNA sponge
- The Sainsbury Laboratory, University of Cambridge, United Kingdom
Figures
Figure 1 with 1 supplement
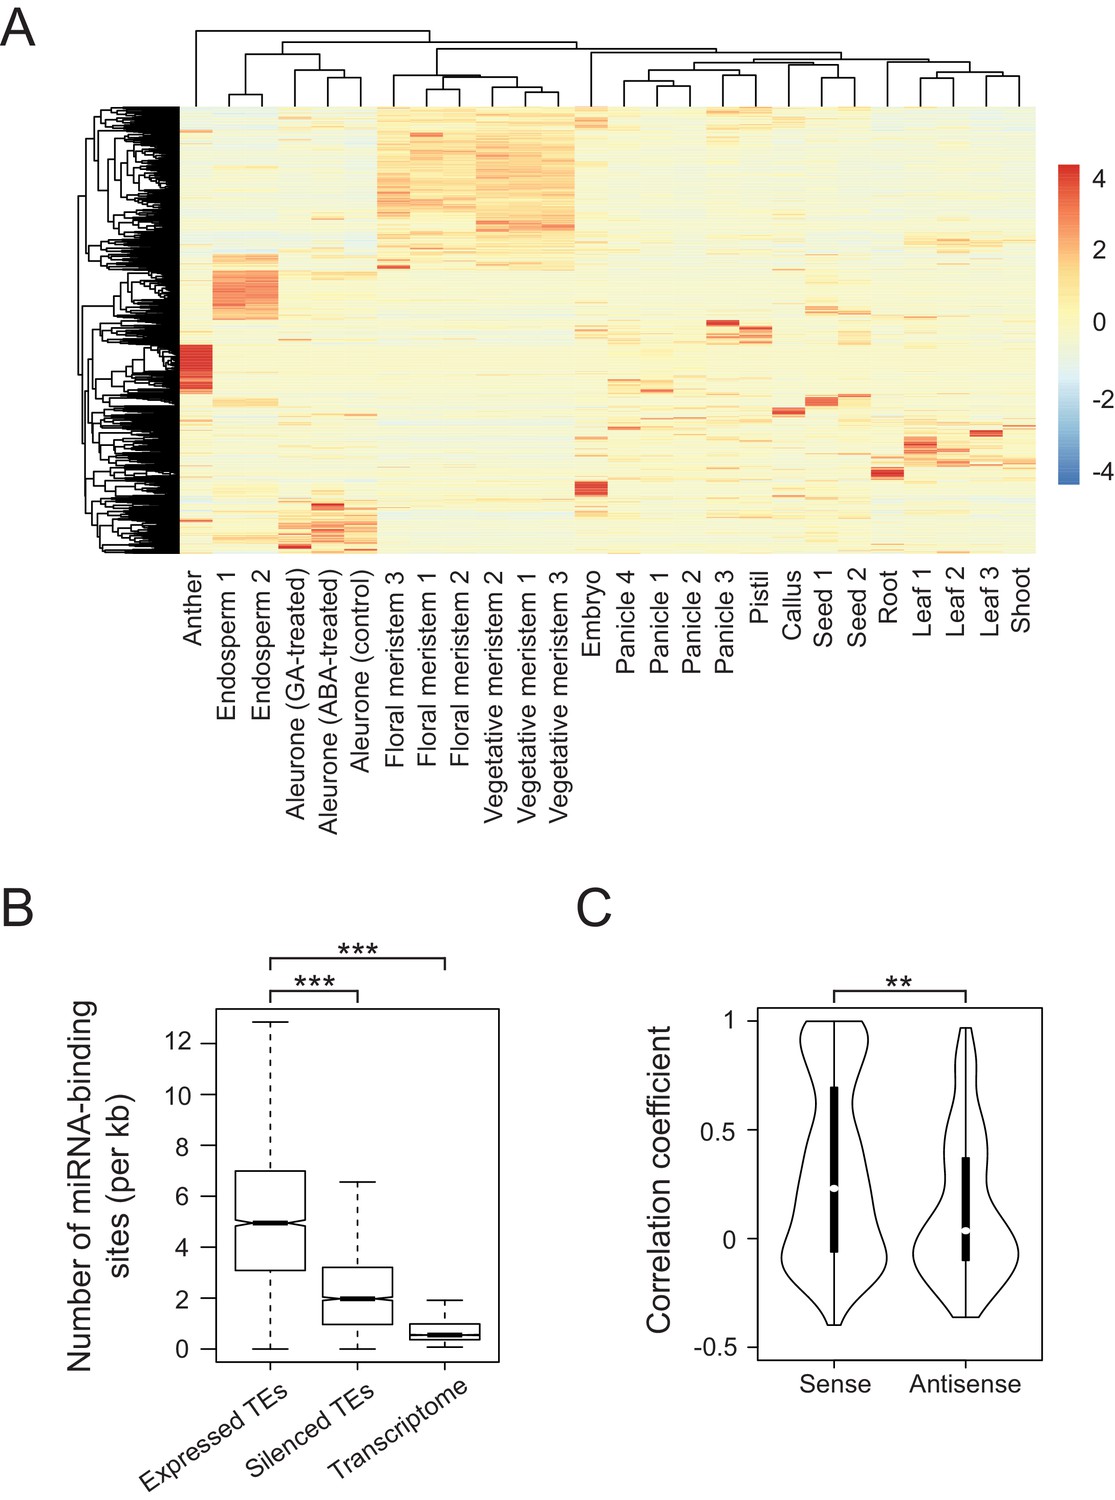
Developmental control and potential miRNA target mimicry of TEs in rice.
(A) TE expression patterns in various rice tissues. The numbers indicate biological replicates (for endosperm and meristem) or the independent datasets of the same tissues. (B) The number of predicted miRNA-binding sites corrected for the lengths of transcripts. miRNA target sites were predicted by psRNATarget with default settings (http://plantgrn.noble.org/psRNATarget/). The asterisks indicate statistical differences determined by the Wilcoxon rank sum test. ***p<e-10. (C) The violin plot for the Pearson’s correlation coefficient between TEs and matching gene expression patterns. TE-gene pairs sharing miRNA-binding sites are separated into sense and antisense matching. **p<e-05.
Figure 1—figure supplement 1

Tissue-specific expression patterns and sequence alignments of TEs in rice.
(A and B) Comparison of the tissue-specific expression patterns of rice and Arabidopsis TEs. In (A), Pearson’s correlation coefficients between all probe sets were calculated based on the expression patterns of each TE displayed in Figure 1A. The symmetric all-against-all correlation matrix was clustered using complete-linkage method. In (B), the tissues selected for Arabidopsis correspond to the rice samples and listed in Supplementary file 3 along with the sources of datasets. (C) Fractions of expressed and silenced TEs with sequence alignment to mature transcripts of genes including protein-coding exons and both UTRs. Local BLAST analysis was performed with default cut-off value of e-10. The enrichment of TEs with matching sequences was analysed by hypergeometric test and the P-value is shown. (D) Alignment lengths of TEs matching exonic and genic sequences of genes (left and right, respectively) and divided according to TE transcript orientation. Numbers in parentheses represent the number of TE-gene pairs. The asterisks indicate significant statistical differences determined by the Wilcoxon rank sum test. ***p<e-10; n.s., not significant. (E) -log10 P-values of the correlation coefficients of sense and antisense TE-gene pairs in the selected tissues.
Figure 2 with 2 supplements
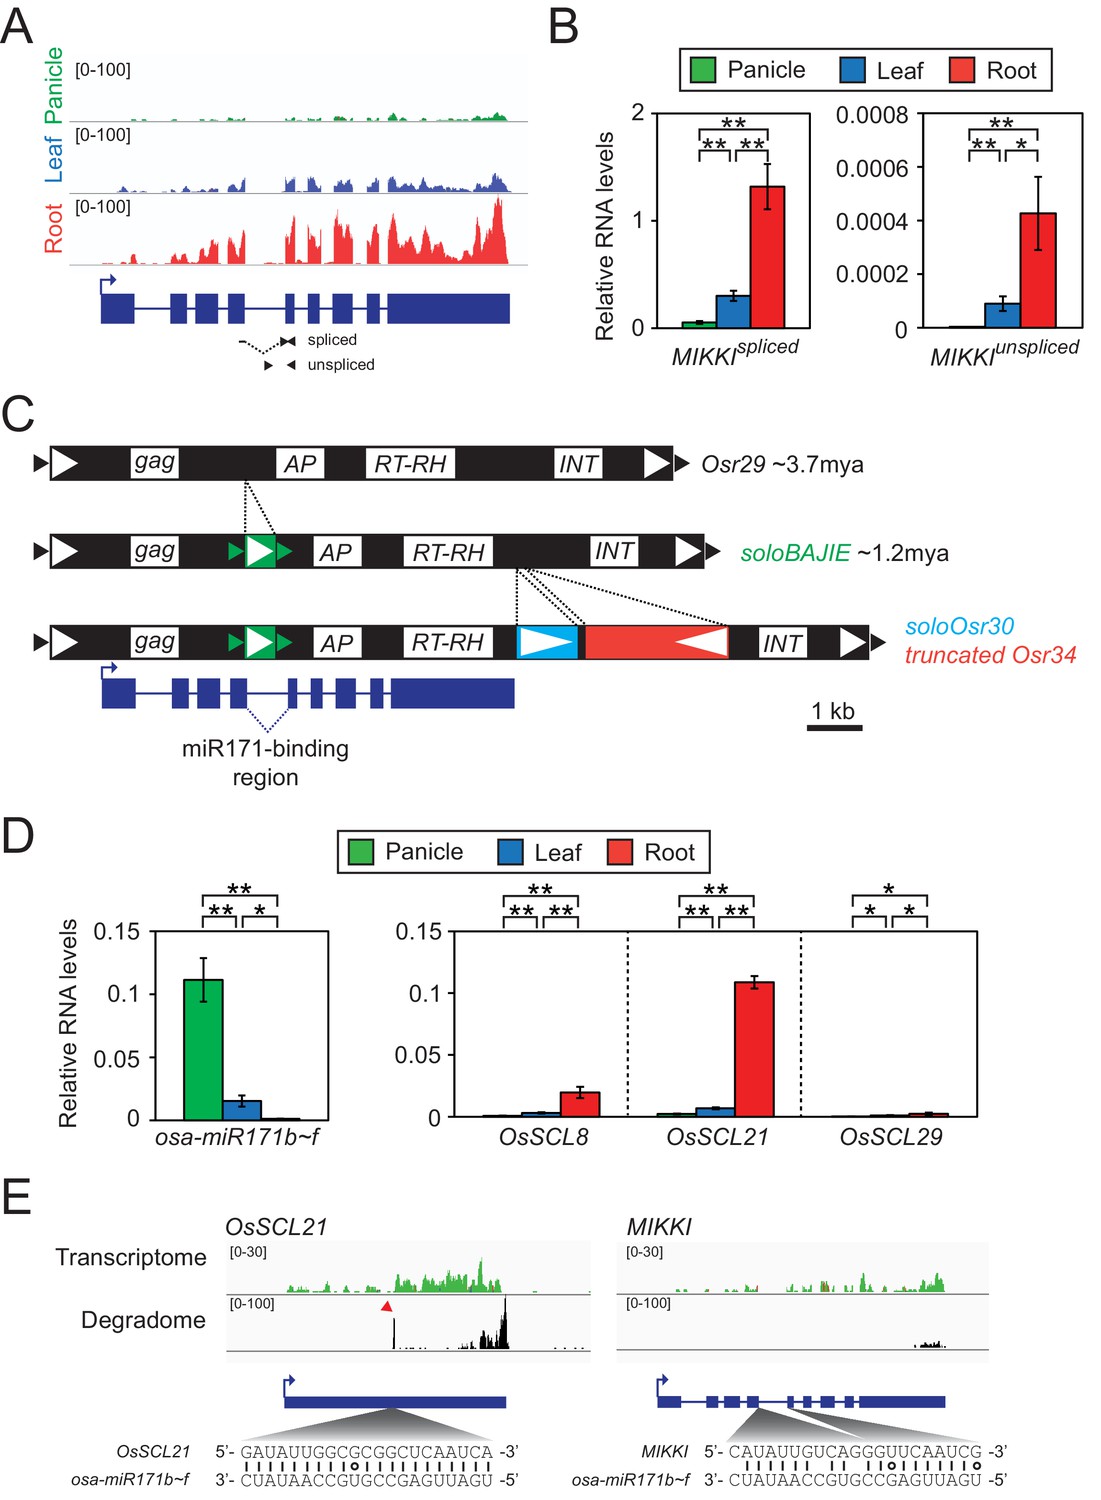
Root-specific MIKKI transcripts may act as target mimics for miR171.
(A) Top, the root-specific expression pattern of MIKKI shown as a snapshot of the RNA-seq genome browser. Bottom, structure of a MIKKI transcript; blue boxes and lines represent exons and introns, respectively. The arrow indicates the transcription start site and the primers used in (B) are indicated as arrowheads. The primer spanning splice junction is shown as a dashed line. (B) MIKKI expression pattern revealed by RT-qPCR. Relative levels of spliced and unspliced MIKKI mRNA in the left and right panels, respectively. Data are presented as mean ± standard deviation (sd) of three biological replicates performed in technical triplicate. The asterisks indicate statistical differences determined by Student’s t-test. **p<0.005; *p<0.05. (C) Schematic diagram of evolution of MIKKI locus. The open and closed arrowheads are the long terminal repeat (LTR) regions and target site duplications, respectively. Different families of retrotransposons are presented by the different colours marked on the right, together with their estimated ages. AP, aspartyl protease; RT-RH, reverse transcriptase-RNaseH; INT, integrase. Intron 4 is shown as a dashed line. (D) Levels of osa-miR171b ~ f and OsSCLs in different tissues as determined by RT-qPCR. Error bars represent mean ± sd of three biological replicates performed in technical triplicate. The asterisks indicate statistical differences determined by Student’s t-test. **p<0.005; *p<0.05. (E) Transcriptome and degradome data from rice panicles showing the OsSCL21 (left) and MIKKI (right) loci. The base pairing of osa-miR171 to OsSCL21 and MIKKI is shown below. The red arrowhead indicates the peak of cleaved end sequences of OsSCL21 mRNA. Watson-Crick and Wobble base-pairing between osa-miR171b ~ f and OsSCL21 or MIKKI are indicated as lines and circles, respectively.
Figure 2—figure supplement 1
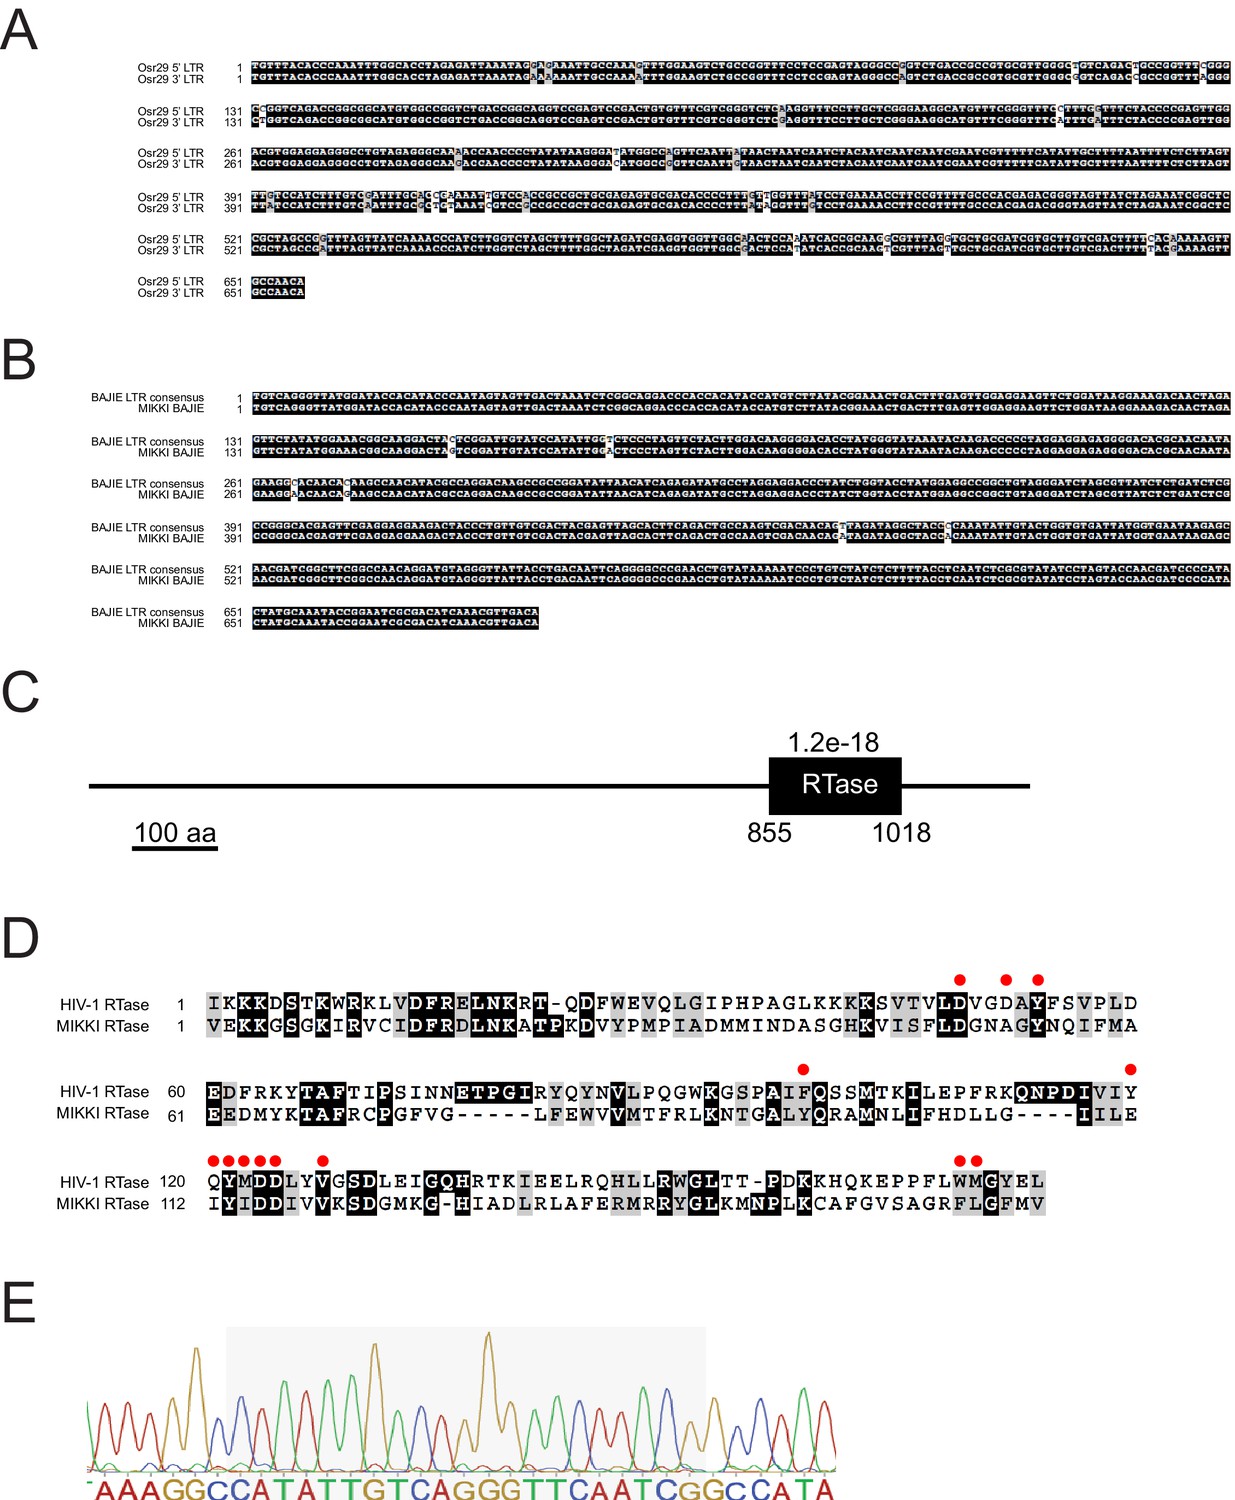
Sequence alignment of MIKKI-associated LTRs.
(A) Alignment between two LTRs of Osr29 in MIKKI. (B) Sequence alignment of BAJIE solo LTR and the consensus sequence deduced from all other BAJIE elements. (C) Protein domain prediction of MIKKI using SMART tool (http://smart.embl-heidelberg.de/). The black box is the predicted reverse-transcriptase (RTase) domain and the e-value is shown. Numbers are the start and the end of amino acid residues of RTase domain. (D) Protein sequence alignment of RTases of MIKKI and HIV-1. The amino acid residues constituting the active catalytic site are indicated as red circles (Rodgers et al., 1995). (E) Confirmation of miR171-binding sequence in the exon-exon junction of MIKKI transcript by Sanger sequencing. The shaded box is miRNA-binding region.
Figure 2—figure supplement 2
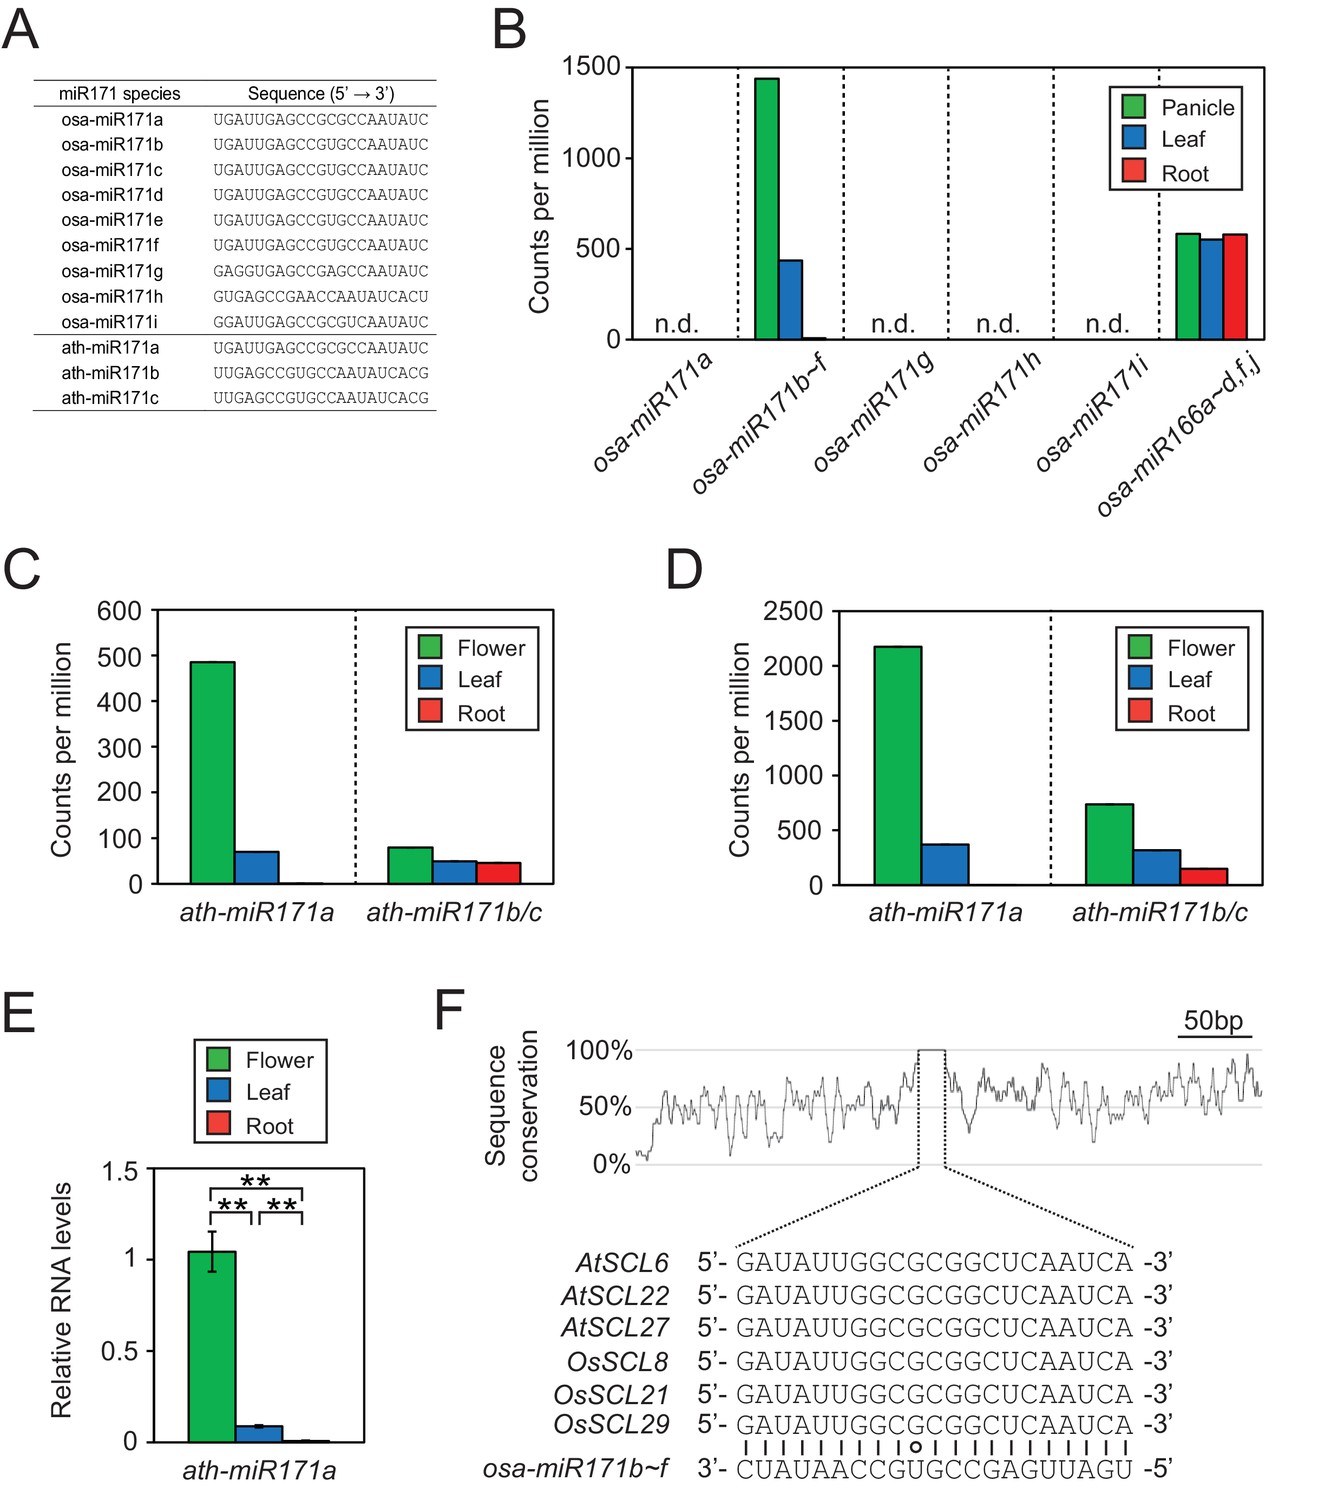
Conservation of expression patterns and target sequences of miR171.
(A) Sequences of miR171 species in rice and Arabidopsis obtained from miRBase (http://www.mirbase.org/). (B) Rice miR171 and miR166 levels in public small RNA sequencing data (GSE16350). Read counts are normalized to library size and presented as counts per million. n.d., not detected. (C and D) The abundance of ath-miR171 in public datasets for total (C) and AGO1-associated (D) small RNA (GSE28591). (E) The levels of ath-miR171a determined by RT-qPCR. Normalization was to ath-miR166 levels and data are presented as mean ± sd of three biological replicates performed in technical triplicate. The asterisks indicate statistical differences determined by Student’s t-test. **p<0.005. (F) The region around miR171 binding site in SCL transcripts of Arabidopsis and rice. The conservation plot above the alignment was constructed with the twine package (Pearson and Crews, 2013).
Figure 3 with 3 supplements
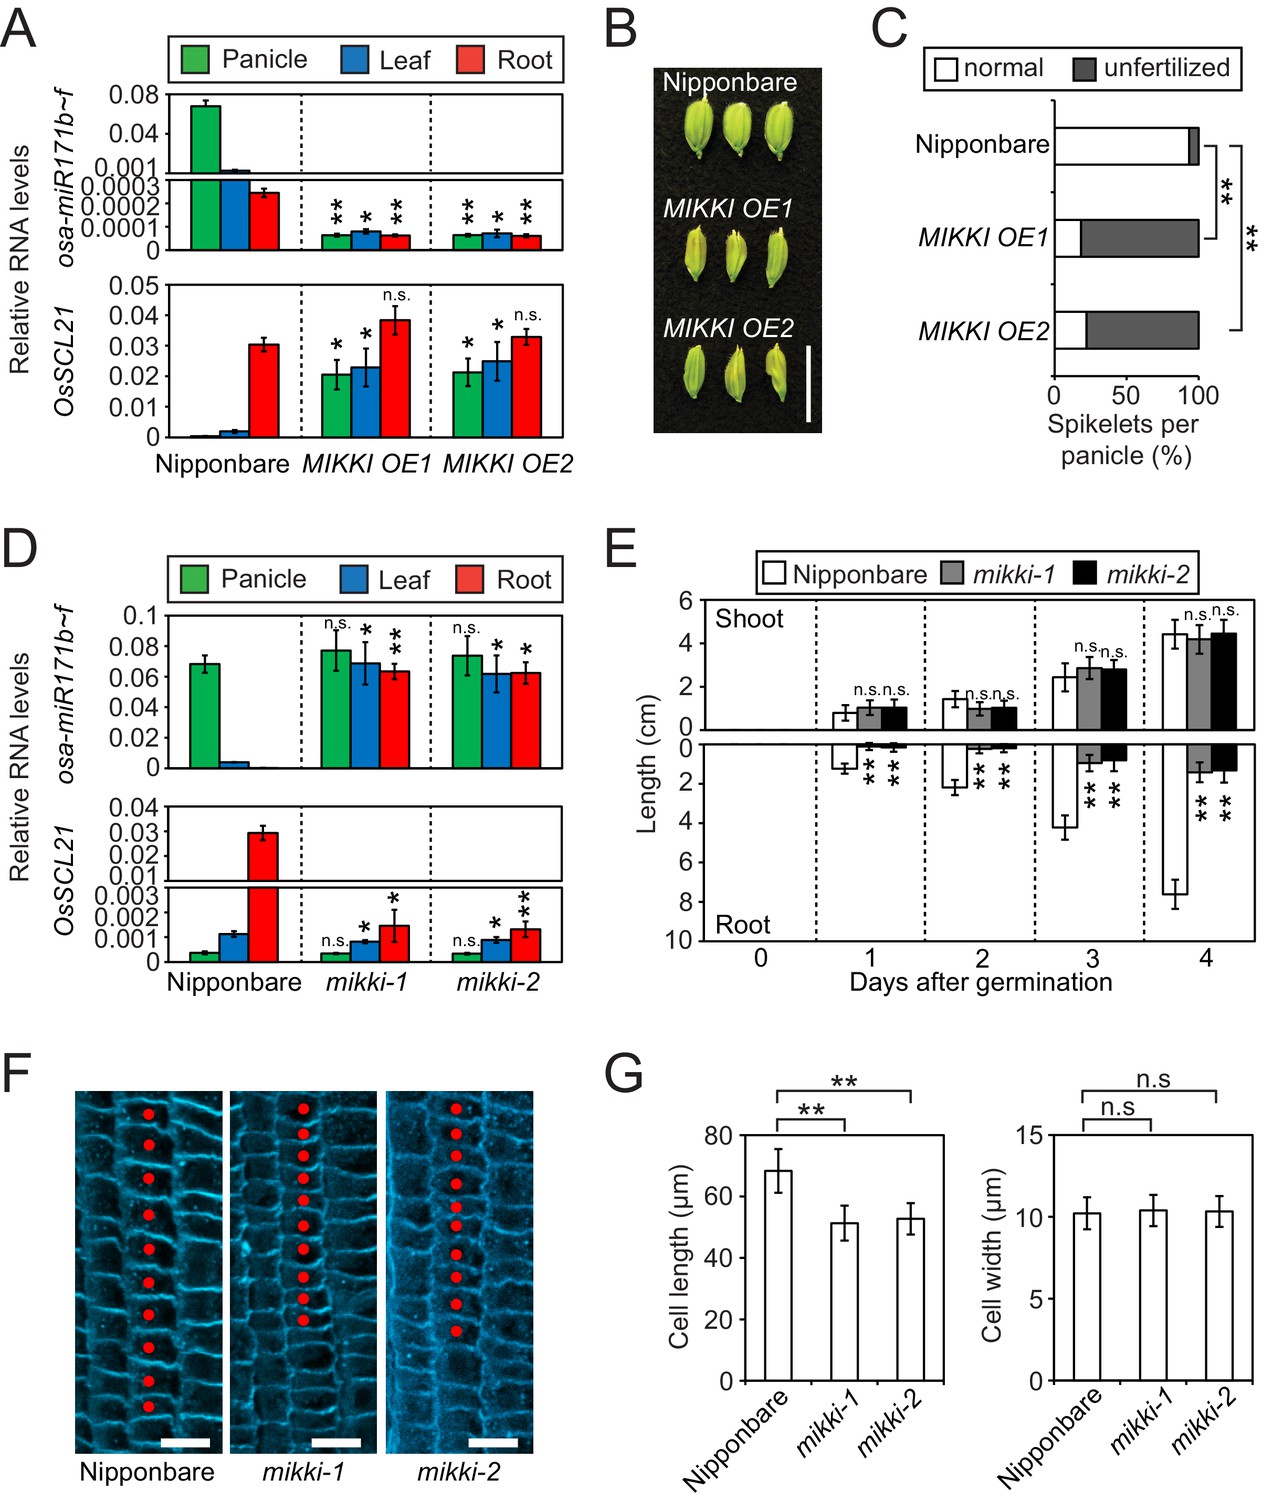
MIKKI negatively regulates the level of miR171.
(A) Repression of osa-miR171b ~ f (top) and derepression of its target gene (bottom) in MIKKI overexpression lines. RNA was extracted from panicles, leaves and roots. Error bars represent mean ± sd of three biological replicates performed in technical triplicate. The asterisks indicate statistical differences in comparison to the same tissues of wildtype (wt) determined by Student’s t-test. **p<e-10; *p<e-05; n.s., not significant. Wt Nipponbare was segregated from hemizygous overexpressor lines. (B) Abnormal spikelet development in MIKKI-overexpressing lines. Bar = 1 cm. (C) Percentage of unfertilized spikelets in overexpression lines. Data are mean of 10 panicles for each genotype. The asterisks indicate statistical differences determined by Student’s t-test. **p<e-10. (D) Derepression of osa-miR171b ~ f (top) and repression of the target gene (bottom) in mikki mutant plants. RNA was extracted from panicles, leaves and roots. Error bars represent mean ± sd of three biological replicates performed in technical triplicate. Wt Nipponbare was segregated from heterozygous mutant plants. The asterisks indicate statistical differences in comparison to the same tissues of wt determined by Student’s t-test. **p<e-10; *p<e-05; n.s., not significant. (E) Shoot and root length of wt and the mutants. Data are presented as mean ± sd; n = 15. The asterisks indicate statistical differences in comparison to the same tissues of wt determined by Student’s t-test. **p<e-10; n.s., not significant. (F) Confocal microscopy images of meristematic regions of wt and the mutants. fifth cortical layer was chosen for comparison. 10 consecutive cells below transition point of meristematic to elongation zone are indicated as red dots. Bar indicates 10 µm. (G) Comparison of cell length (left) and width (right) between wt and the mutants. Data are presented as mean ± sd; n = 15. The asterisks indicate significant statistical differences as determined by Student’s t-test. **p<e-10; n.s., not significant.
Figure 3—figure supplement 1
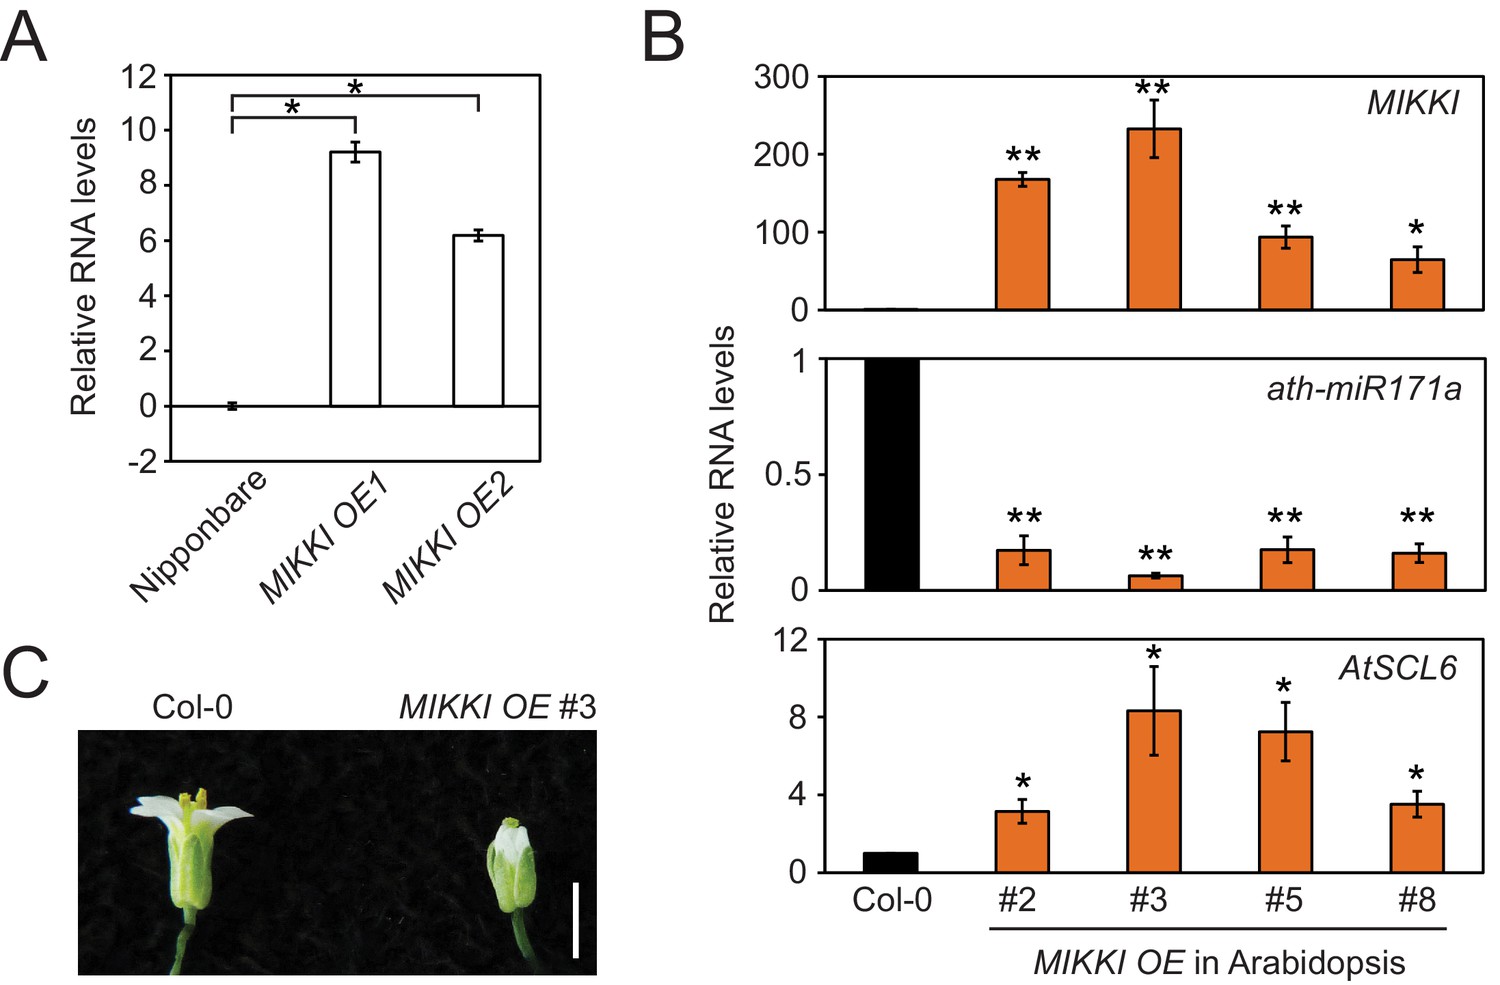
MIKKI overexpression.
(A) The levels of MIKKI mRNA in overexpressing lines of rice determined by RT-qPCR. Error bars are mean ± sd of three biological replicates performed in technical triplicate and the values are log2 converted. The asterisks indicate statistical differences determined by Student’s t-test. *p<e-05. (B) Overexpression of MIKKI in Arabidopsis. From the top panel down: levels of MIKKI, ath-miR171a and AtSCL6 RNA. The levels of MIKKI and AtSCL6 RNA were normalized to UBQ10 and ath-miR171a was related to ath-miR166. Data are presented as mean ± sd of three biological replicates performed in technical triplicate. The asterisks indicate statistical differences to Col-0 wt determined by Student’s t-test. **p<0.005; *p<0.05. (C) Typical phenotype of Arabidopsis flowers from plants overexpressing MIKKI. Bar indicates 1 cm.
Figure 3—figure supplement 2
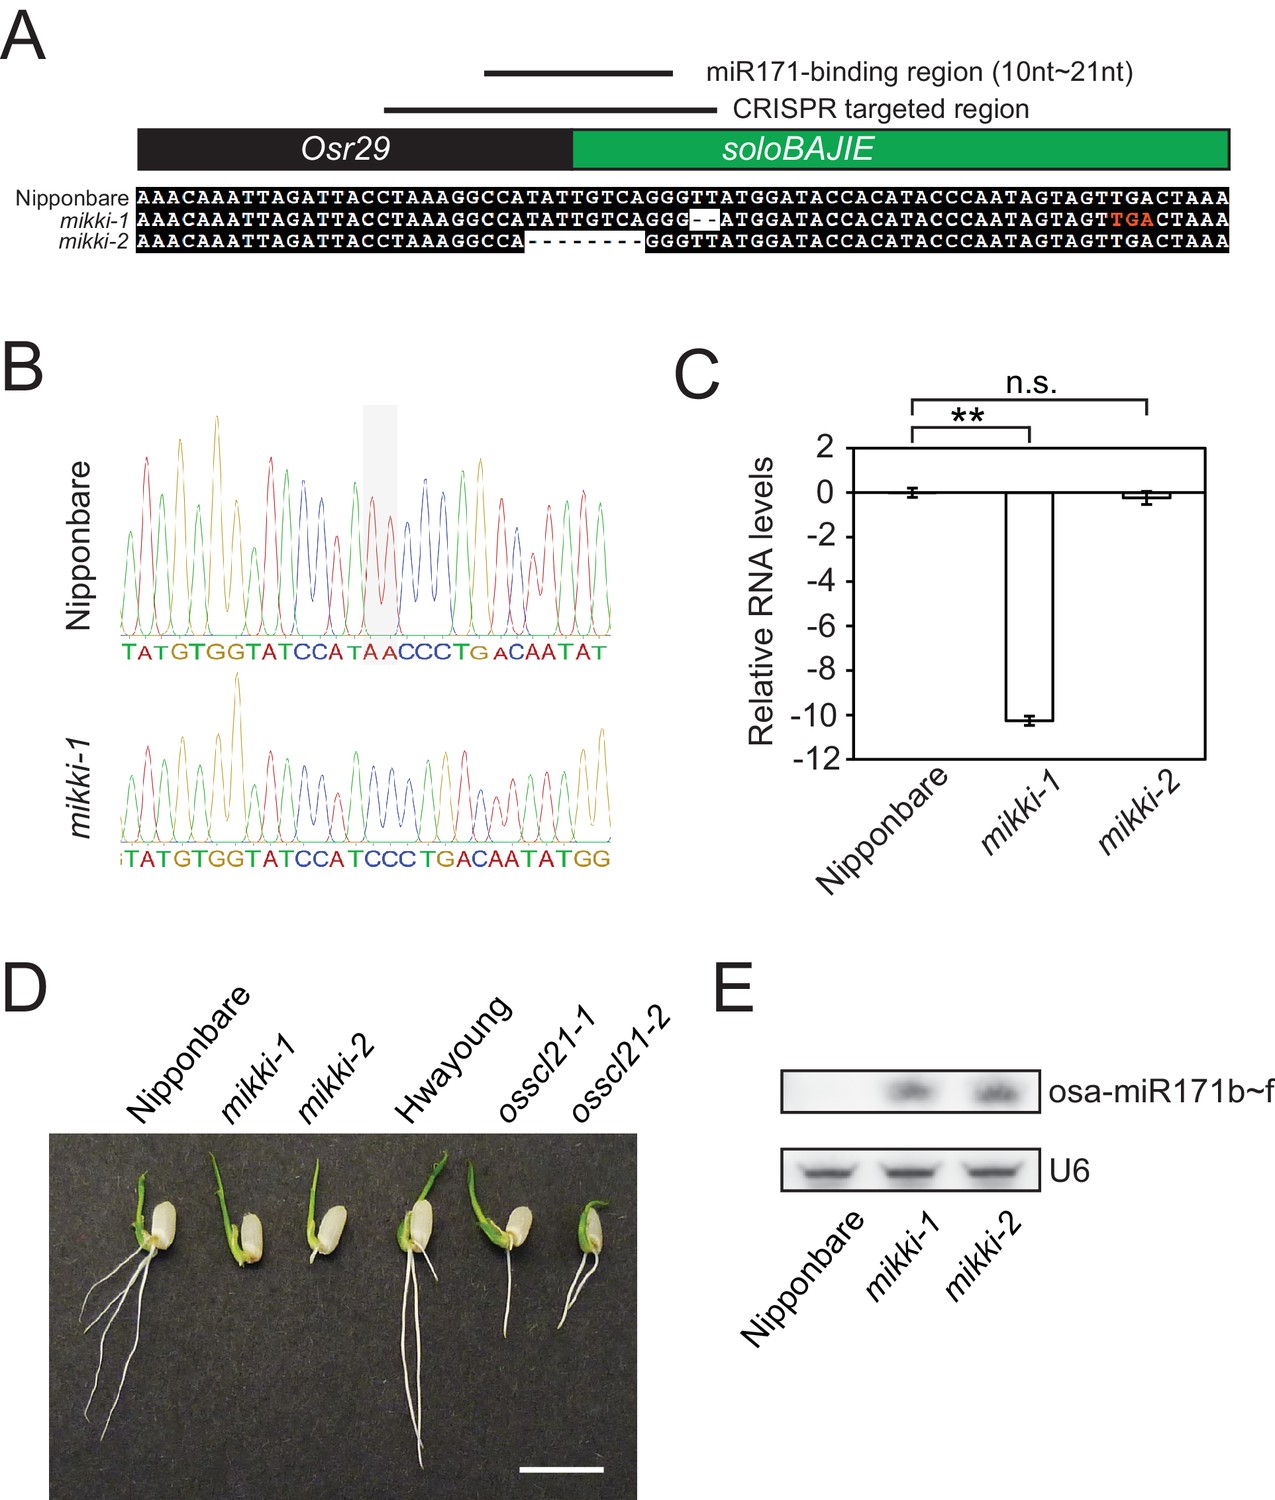
MIKKI mutation.
(A) The sequence alignment of the wt and two independent mikki mutant alleles around the targeted region. The regions corresponding to different families of retrotransposons are coloured indicated as in Figure 2C. The lines above show the CRISPR-Cas9 targeted region and the miR171-binding region. One premature stop codon generated in the mikki-1 mutant is highlighted as red letters. (B) Sanger sequencing trace images of the regions around targeted site. Sequences were read in reverse orientation. Shaded box indicates the deleted nucleotides in mikki-1 mutant. (C) MIKKI transcript levels in wt and the two mutant lines. Primers used for the analysis were MIKKI_genotype-F and MIKKI_RT-R. Error bars are mean ± sd of three biological replicates performed in technical triplicate and the values are log2 converted. The asterisks indicate statistical differences determined by Student’s t-test. **p<0.005; n.s., not significant. (D) Short root phenotype of mikki and osscl21 mutant plants grown side-by-side. The image was taken at day two after germination. Bar indicates 1 cm. (E) small RNA blot analyses of wt and the mikki mutants. RNA was extracted from roots. Wt Nipponbare was segregated from heterozygous mutant plants.
Figure 3—figure supplement 3
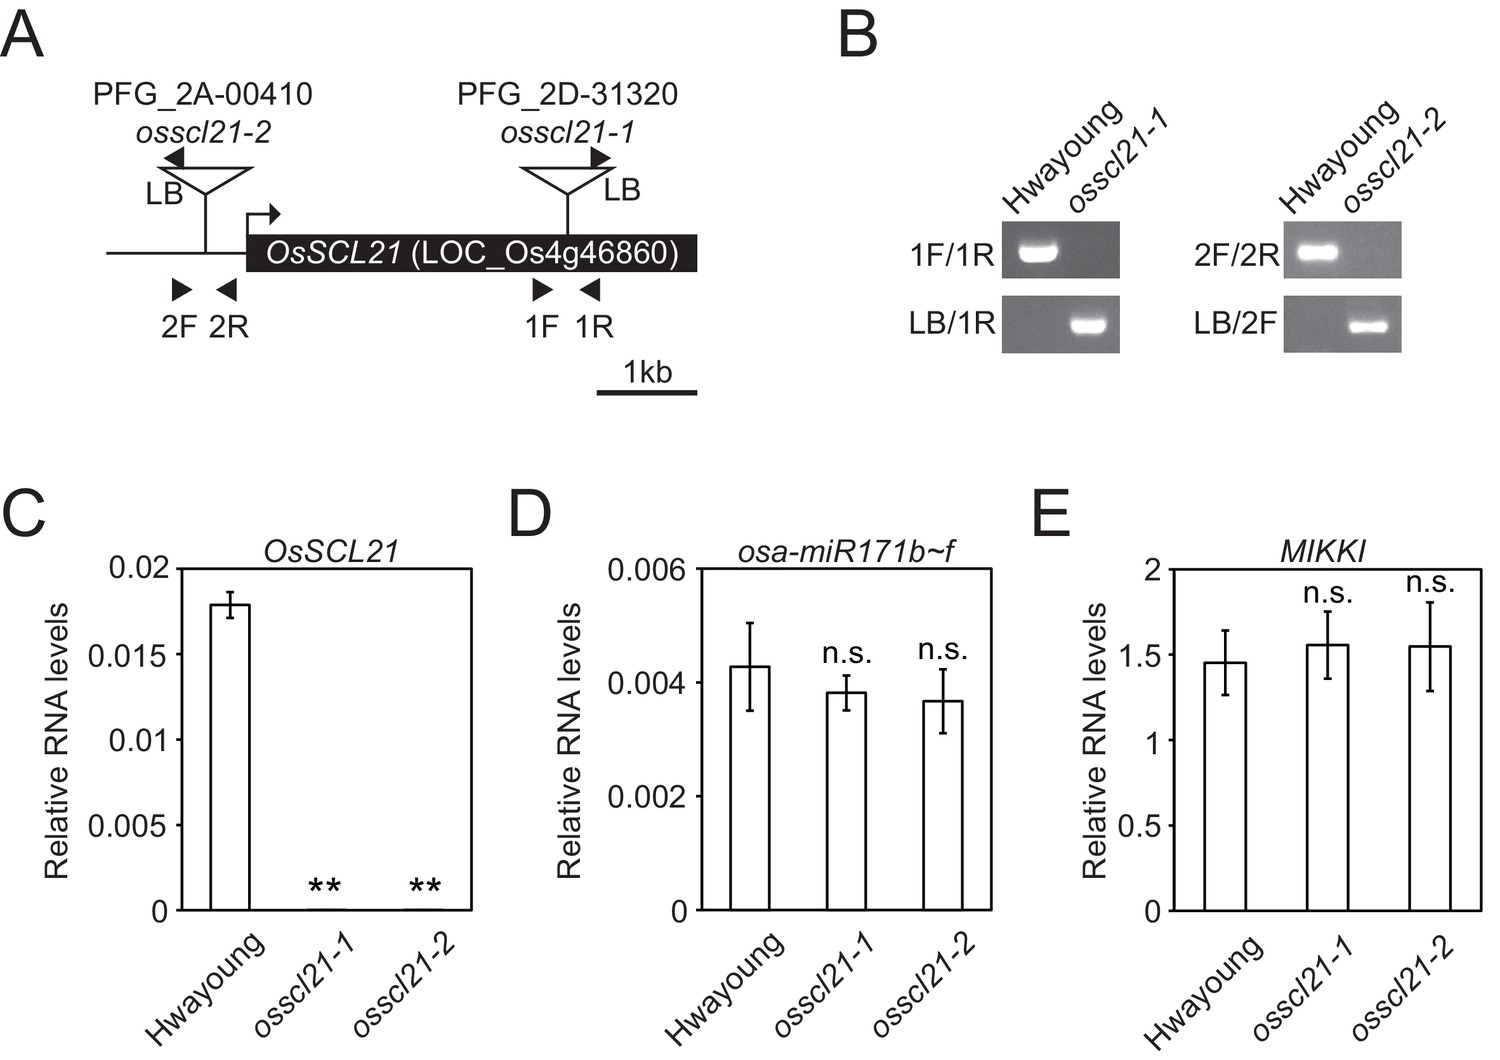
Identification of osscl21 mutant plants.
(A) Schematic diagram of OsSCL21 gene and T-DNA insertion sites. Box represents exon and line is intergenic region. Arrow indicates transcriptional start site and T-DNA insertion sites are shown as triangles. Primers used in Figure 3—figure supplement 3B are indicated as arrowheads. (B) Genotyping of osscl21-1 and osscl21-2 mutants. (C–E) RT-qPCR analyses on wt and osscl21 mutants. Validation of OsSCL21 (C), osa-miR171b ~ f (D) and MIKKI (E) RNA levels. The levels were normalized to eEF1α (C and E) and osa-miR166 (D), respectively. Error bars are mean ± sd of three biological replicates performed in technical triplicate. The asterisks indicate statistical differences determined by Student’s t-test. **p<0.005; n.s., not significant.
Figure 4 with 3 supplements
Differences in the regulation of miR171 levels in rice and Arabidopsis.
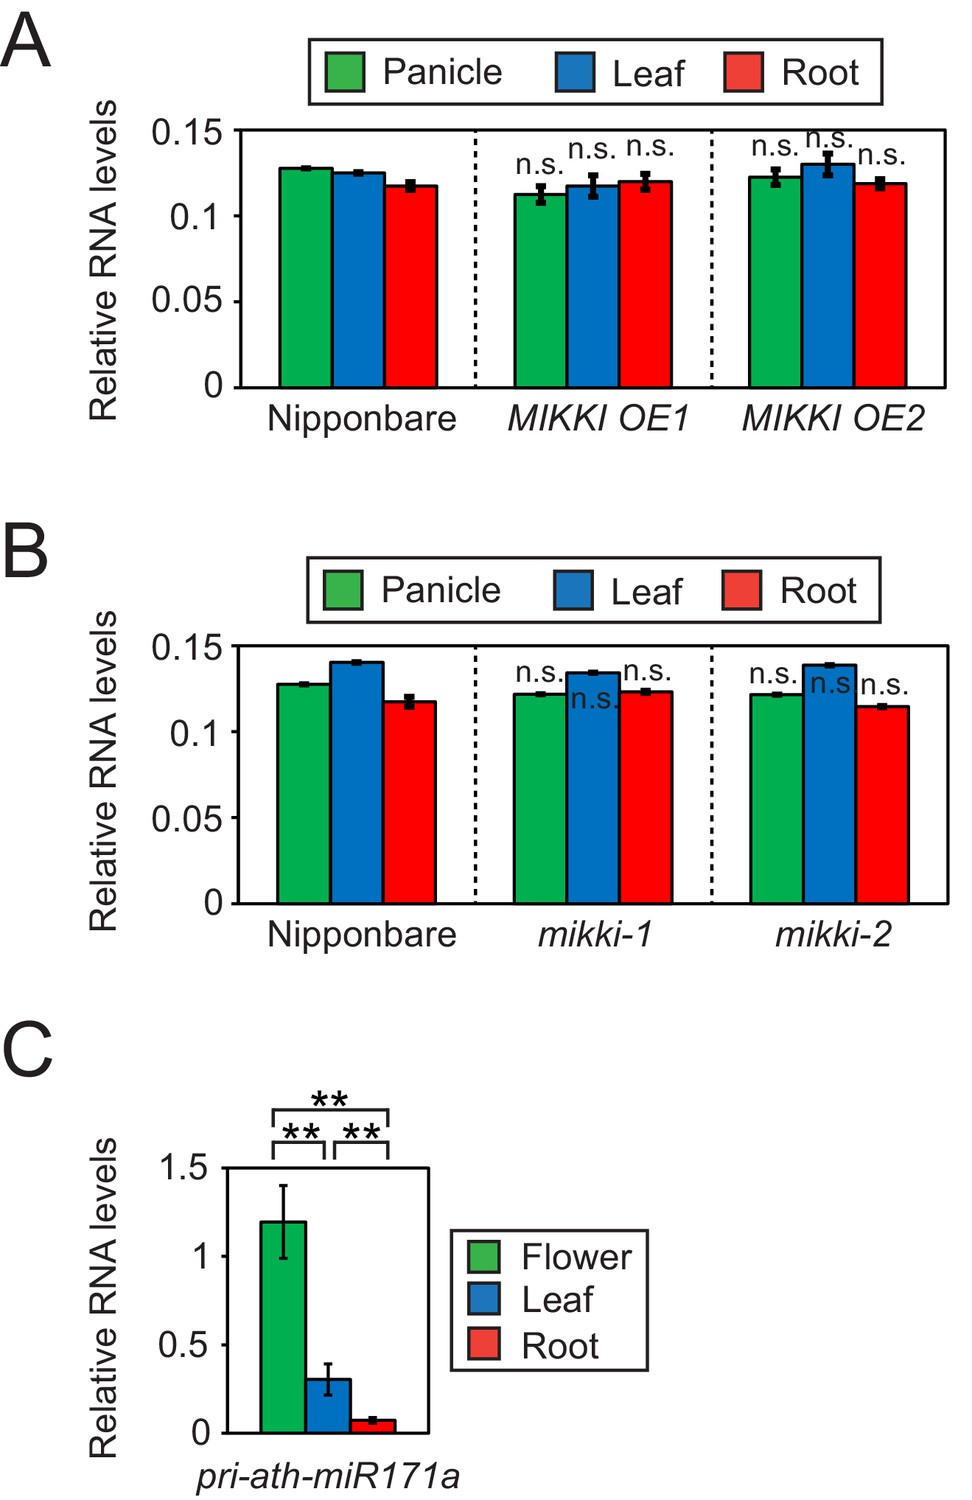
(A and B) RT-qPCR of the primary precursor of miR171 in wt, overexpressor (A) and mutant (B) of MIKKI. The transcripts levels were normalized to eEF1α. Error bars represent mean ± sd of three biological replicates performed in technical triplicate. The asterisks indicate statistical differences in comparison to the same tissues of wt determined by Student’s t-test. n.s., not significant. (C) RT-qPCR of the primary precursor of miR171a in Col-0 arabidopsis plants. The levels were normalized to UBQ10 and error bars represent mean ± sd of three biological replicates performed in technical triplicate. The asterisks indicate statistical differences determined by Student’s t-test. **p<0.005.
Figure 4—figure supplement 1
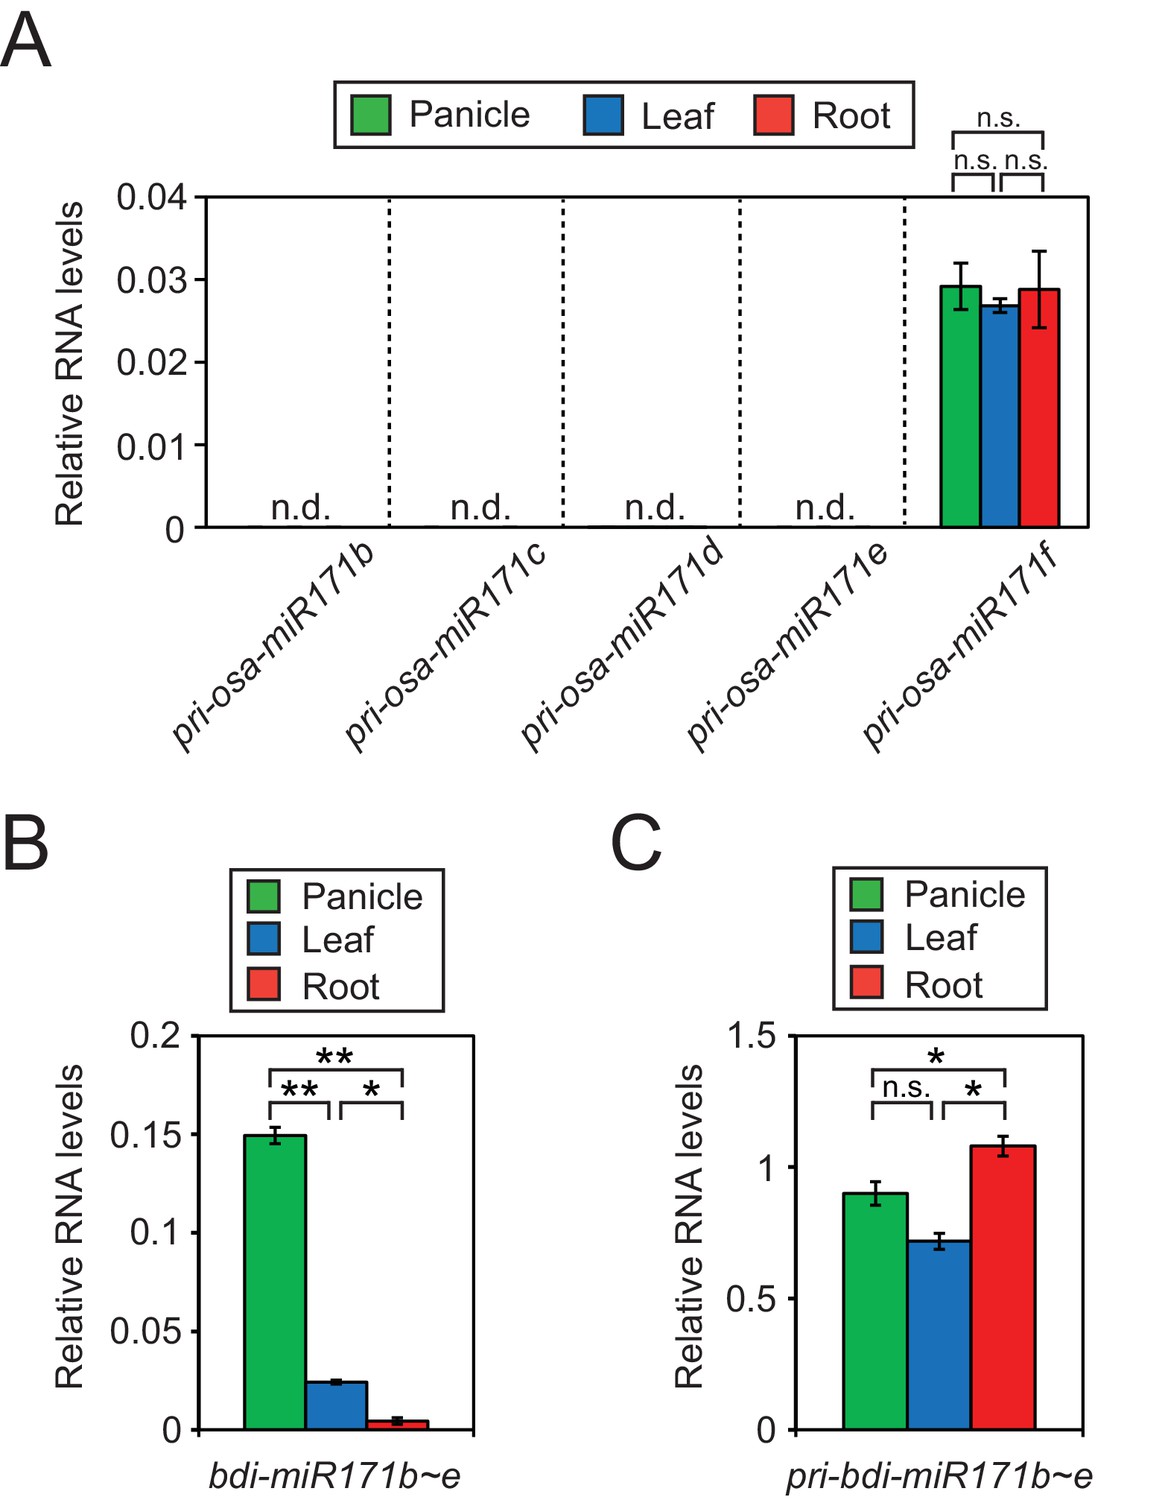
(A) RT-qPCR of primary transcript levels of different miR171 loci in rice.
The asterisks indicate statistical differences determined by Student’s t-test. n.s., not significant. (B and C) Relative RNA levels of mature (B) and primary (C) miR171b ~ e levels in brachypodium as revealed by RT-qPCR. Data were normalized to miR166 (B) and eEF1α (C) and are presented as mean ± sd of three biological replicates performed in technical triplicate. The asterisks indicate statistical differences determined by Student’s t-test. **p<0.005; *p<0.05; n.s., not significant.
Figure 4—figure supplement 2
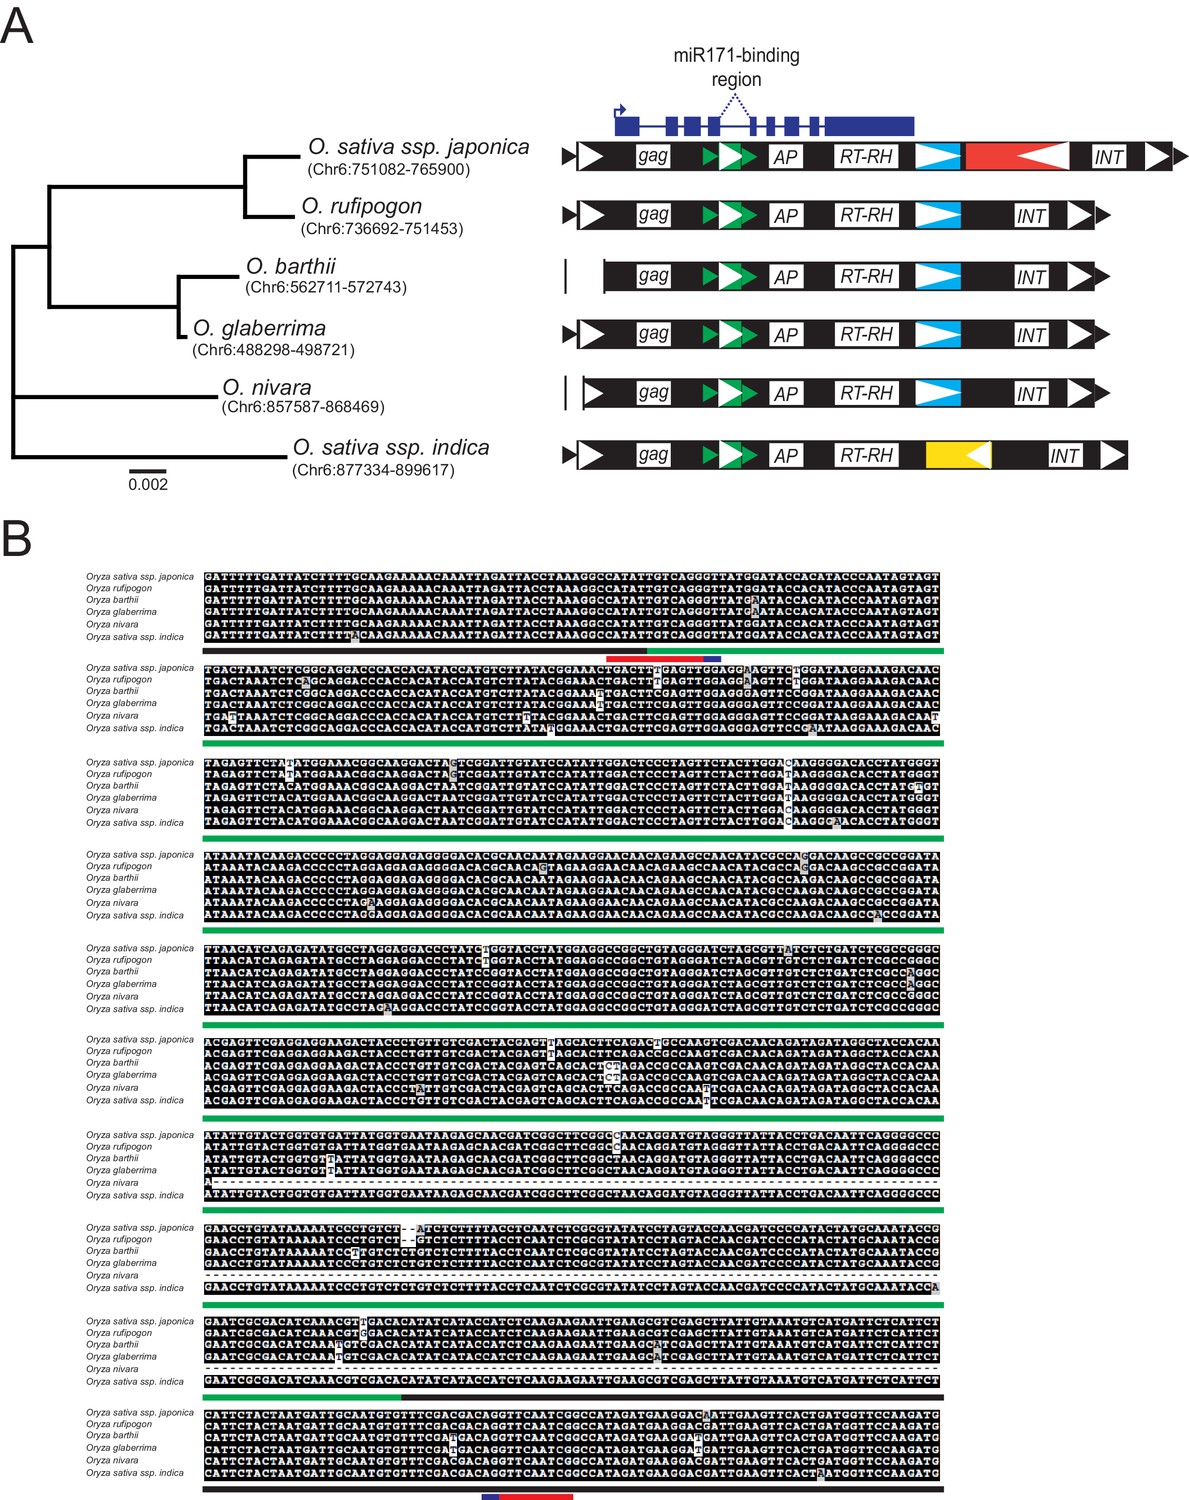
Conservation of MIKKI within the Oryza genus.
(A) Left panel, phylogenetic tree of the selected AA-genome Oryza species. The scale bar shows the nucleotide substitution rate per site. The coordinates of MIKKI homologs are shown in parentheses. Right panel, schematic diagram of MIKKI structures. Vertical bars represent deletions. The yellow box within MIKKI of Oryza sativa ssp. indica is a RIRE2-related retrotransposon that became truncated. The colour code is as in Figure 2C. (B) Multiple sequence alignment of MIKKI homologs around intron 4 in different rice species. The regions corresponding to different retrotransposons are underlined in colour. The miR171-binding region and the splice donor/acceptor sites are shown in red and blue, respectively.
Figure 4—figure supplement 3
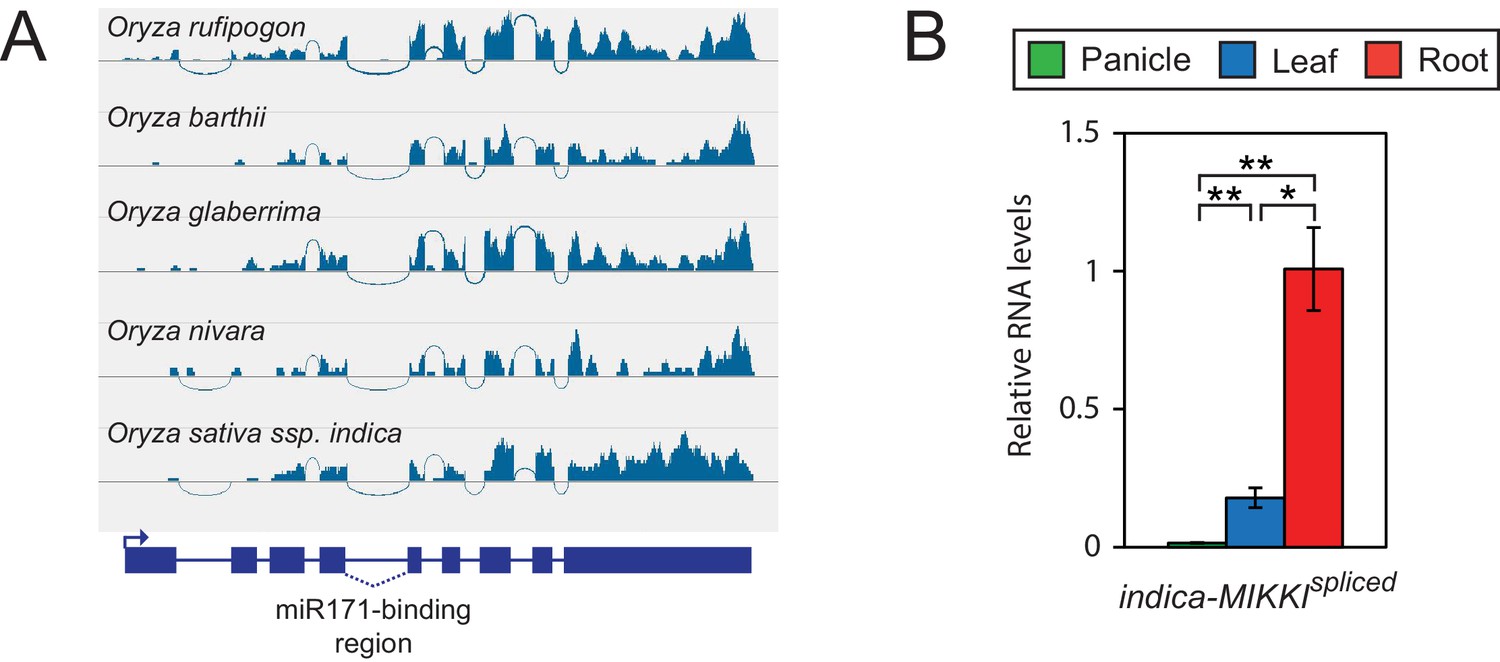
Conserved pattern of MIKKI expression in the Oryza genus.
(A) Analyses of RNA-seq data generated from roots of different Oryza species showing conserved splicing of intron 4. (B) Tissue-specific distribution of MIKKI mRNA in Indica rice (Oryza sativa ssp. indica cv. IR64). Data are presented as mean ± sd of three biological replicates performed in technical triplicate. The asterisks indicate statistical differences determined by Student’s t-test. **p<0.005; *p<0.05.
Figure 5 with 1 supplement
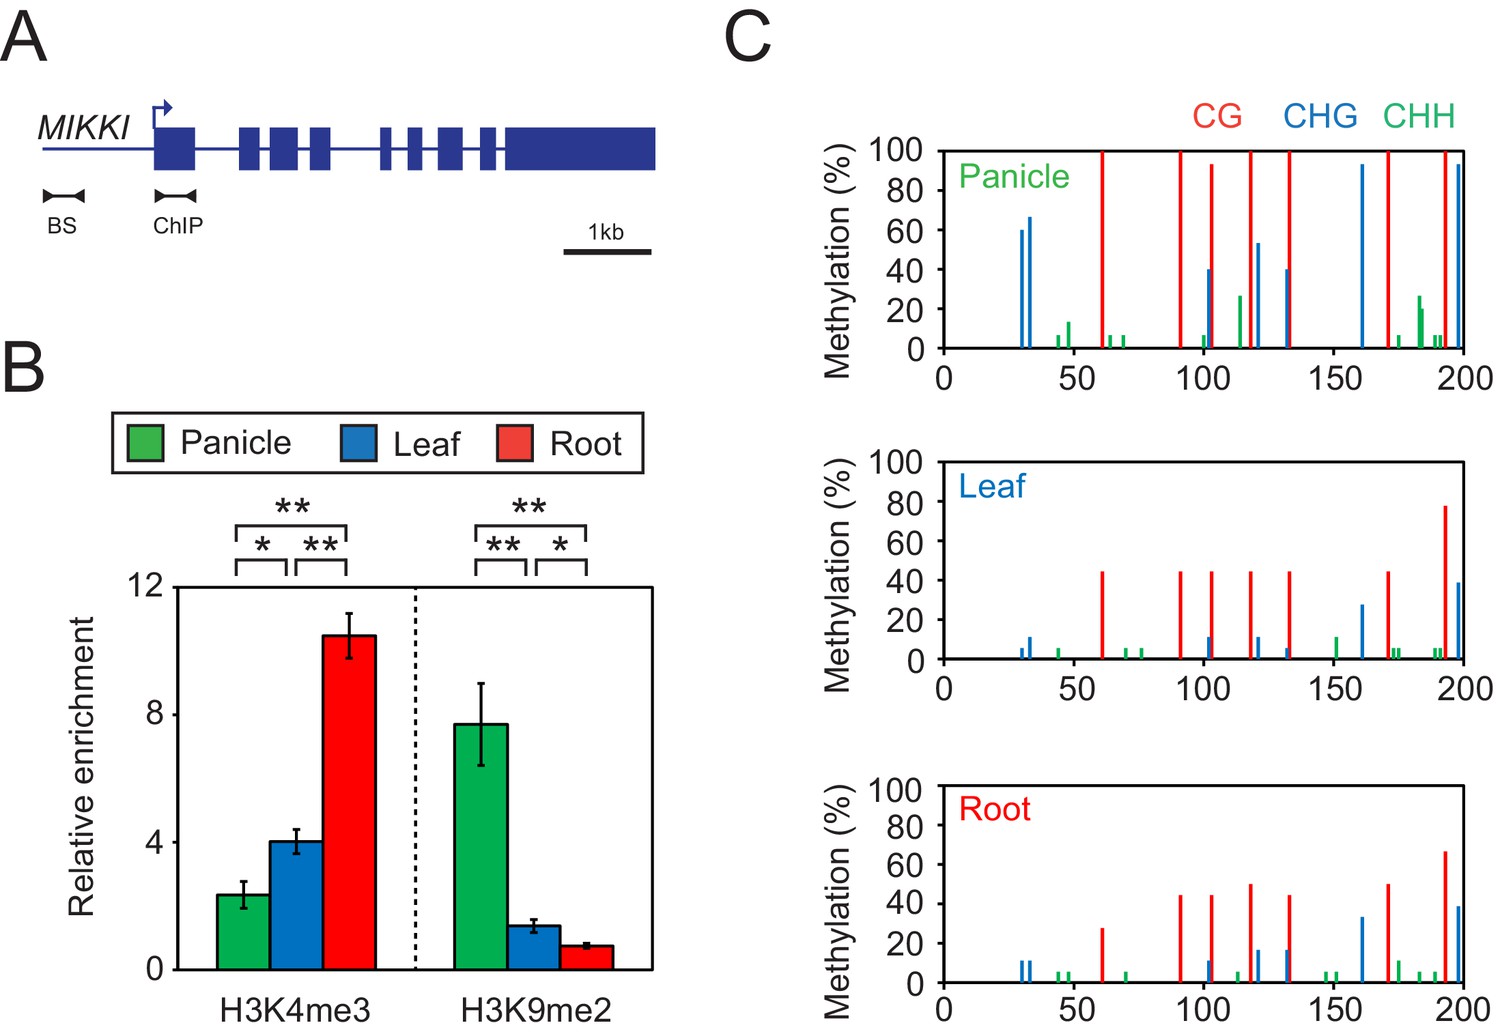
Tissue-specific epigenetic signatures of the MIKKI locus.
(A) MIKKI structure showing primer positions. BS, bisulfite sequencing; ChIP, chromatin immunoprecipitation. (B) H3K4me3 and H3K9me2 levels determined by ChIP-qPCR assay. The amount of immunoprecipitated DNA was normalized to the input levels with eEF1α as the internal control region. Error bars represent mean ± sd of three biological replicates performed in technical triplicate. The asterisks indicate significant statistical differences determined by Student’s t-test. **p<0.005; *p<0.05. (C) DNA methylation levels shown as percent methylation in three different sequence contexts.
Figure 5—figure supplement 1

MIKKI RNA levels in osdcl3a RNAi knock-down lines.
RNA-seq data was obtained from GSE50778 and the transcript levels are presented as RPKM (reads per kilobase per million reads).
Figure 6
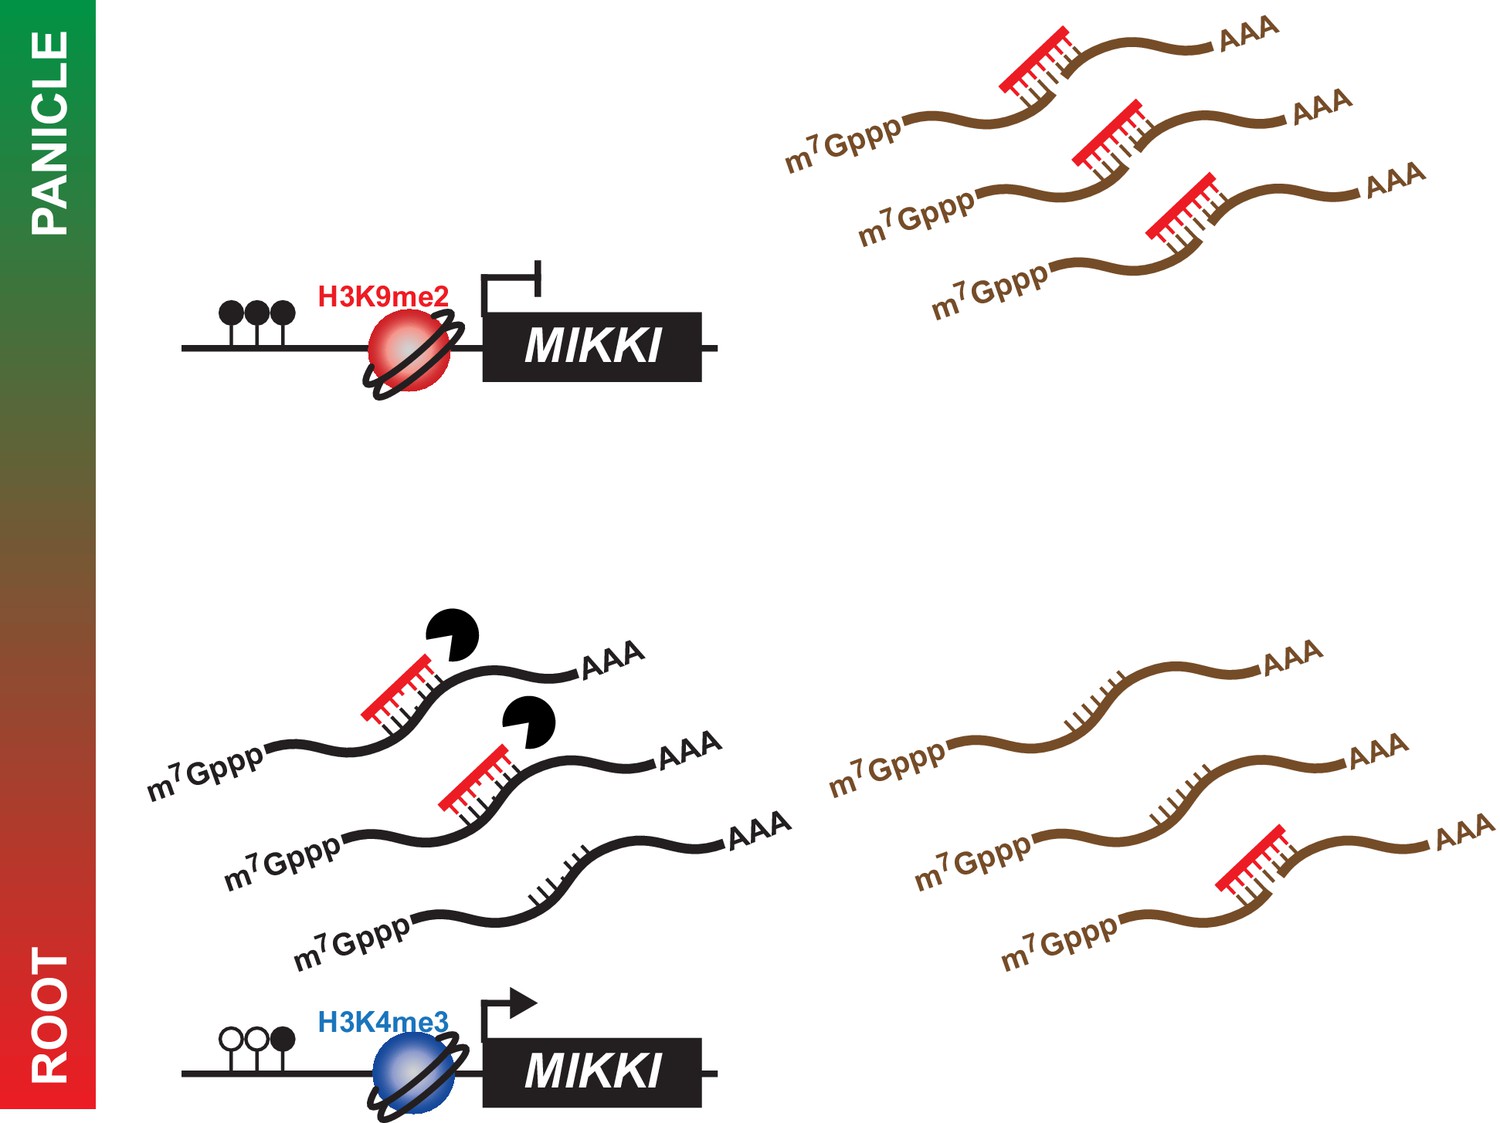
A proposed model for the role of MIKKI in osa-miR171 control.
In rice panicles, MIKKI is epigenetically silenced by DNA methylation and repressive histone modifications (shown as closed circles and red sphere, respectively). In roots, MIKKI transcripts interact with osa-miR171b ~ f leading to its turnover and stabilization of OsSCL mRNAs.
Additional files
-
Supplementary file 1
List of putative TE target mimics in rice.
TE-gene pairs with potential miRNA competition were selected based on the following criteria: (1) TEs with significant expression levels (RPKM >1); (2) Sequence matching in sense orientation; (3) miRNA-binding sites within the matching regions; (4) Correlated expression patterns.
- https://doi.org/10.7554/eLife.30038.019
-
Supplementary file 2
Sequences of primers used in this study.
- https://doi.org/10.7554/eLife.30038.020
-
Supplementary file 3
Tissues selected for Arabidopsis TE coexpression analysis.
- https://doi.org/10.7554/eLife.30038.021
-
Transparent reporting form
- https://doi.org/10.7554/eLife.30038.022
Download links
A two-part list of links to download the article, or parts of the article, in various formats.
Downloads (link to download the article as PDF)
Open citations (links to open the citations from this article in various online reference manager services)
Cite this article (links to download the citations from this article in formats compatible with various reference manager tools)
Regulation of rice root development by a retrotransposon acting as a microRNA sponge
eLife 6:e30038.
https://doi.org/10.7554/eLife.30038


