Inducible and reversible phenotypes in a novel mouse model of Friedreich’s Ataxia
- University of California, Los Angeles, United States
Figures
Figure 1 with 2 supplements
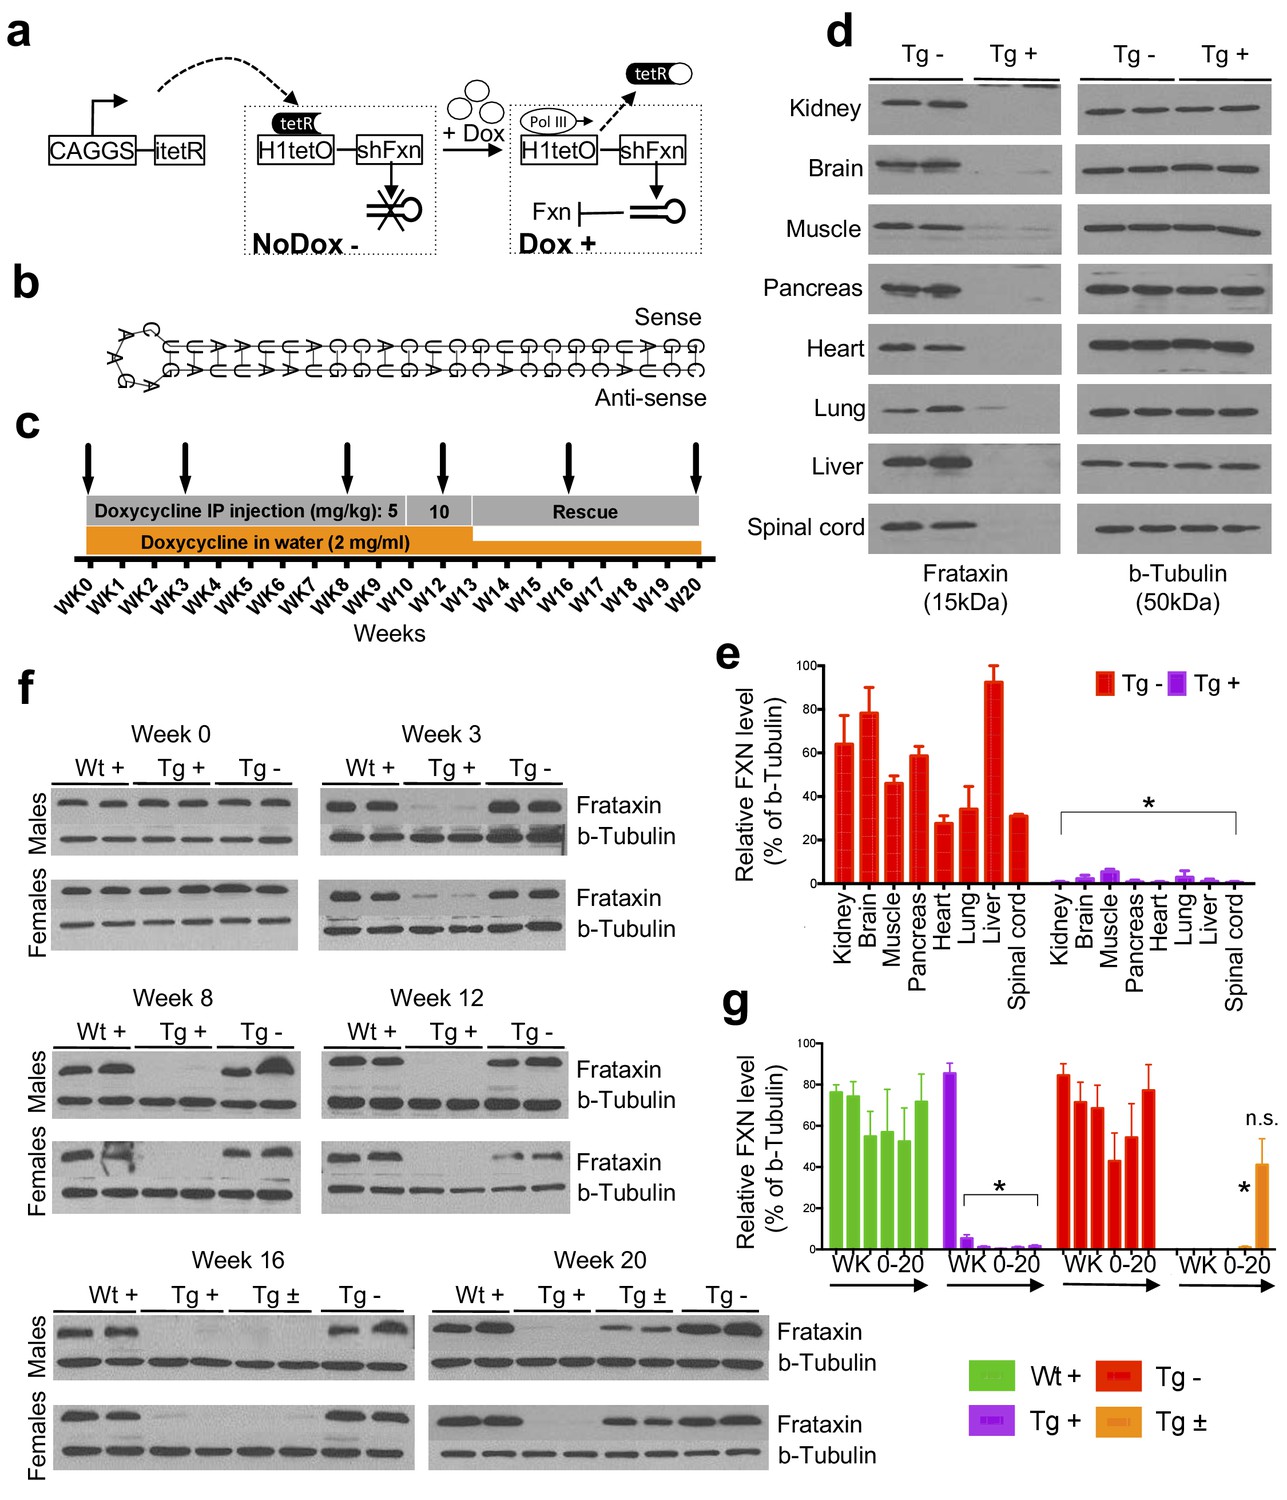
Efficient temporal in vivo frataxin knockdown and rescue.
(a) Schematic representation of the inducible expression vector system delivering shRNA against frataxin. The vector contains an shRNA sequence against the frataxin (Fxn) gene regulated by the H1 promoter with tet-operator sequences (tetO) and tet repressor (tetR) under the control of the CAGGS promoter. Transcription of the Fxn shRNA is blocked in cells expressing tetR. Upon induction by doxycycline (dox), tetR is removed from the tetO sequences inserted into the promoter, allowing transcription of shRNA against Fxn. shRNA expression leads to RNAi-mediated knockdown of the Fxn gene. (b) Predicted minimum free energy secondary structure of expressed shRNA targeting the Fxn is shown with the sequence (sense strand) and its complement sequence (antisense strand) in the duplex form along with hairpin loop. (c) Timeline for doxycycline treatment of mice with a double IP injection (5 and 10 mg/kg) of dox per week and in drinking water (2 mg/ml). IP injections and dox in water were withdrawn for rescue animals. Arrow signs indicated different time intervals considered for downstream analyses. (d) Transgenic mice without (Tg -) or with (Tg +) doxycycline treatment (see c) for 20 weeks were analyzed by Western blot for protein levels of FXN in various organs. (e) For quantification, FXN values were normalized to the level of b-tubulin in each lane. (f) Time series FXN knockdown and rescue in liver. Wild-type mice with (Wt +), transgenic mice with (Tg +) and without (Tg -) dox, and transgenic mice with (Tg ±) dox removal (rescue) samples were analyzed for weeks 0,3,8,12,16, and 20. Rescue animals (Tg ±) were given dox for 12 weeks and doxycycline was withdrawn for additional 4 and 8 weeks. (g) For quantification, FXN values were normalized to the level of b-tubulin in each lane. N = 4 animals per group, *p<0.01; two-way ANOVA test; n.s., not significant. Error bars represent mean ±SEM for panels e and g.
-
Figure 1—source data 1
This spreadsheet contains the Western blot quantification data after frataxin knockdown in various organs and time points in FRDAkd and control animals which was used to generate the bar plots shown in Figure 1e and g.
- https://doi.org/10.7554/eLife.30054.005
Figure 1—figure supplement 1
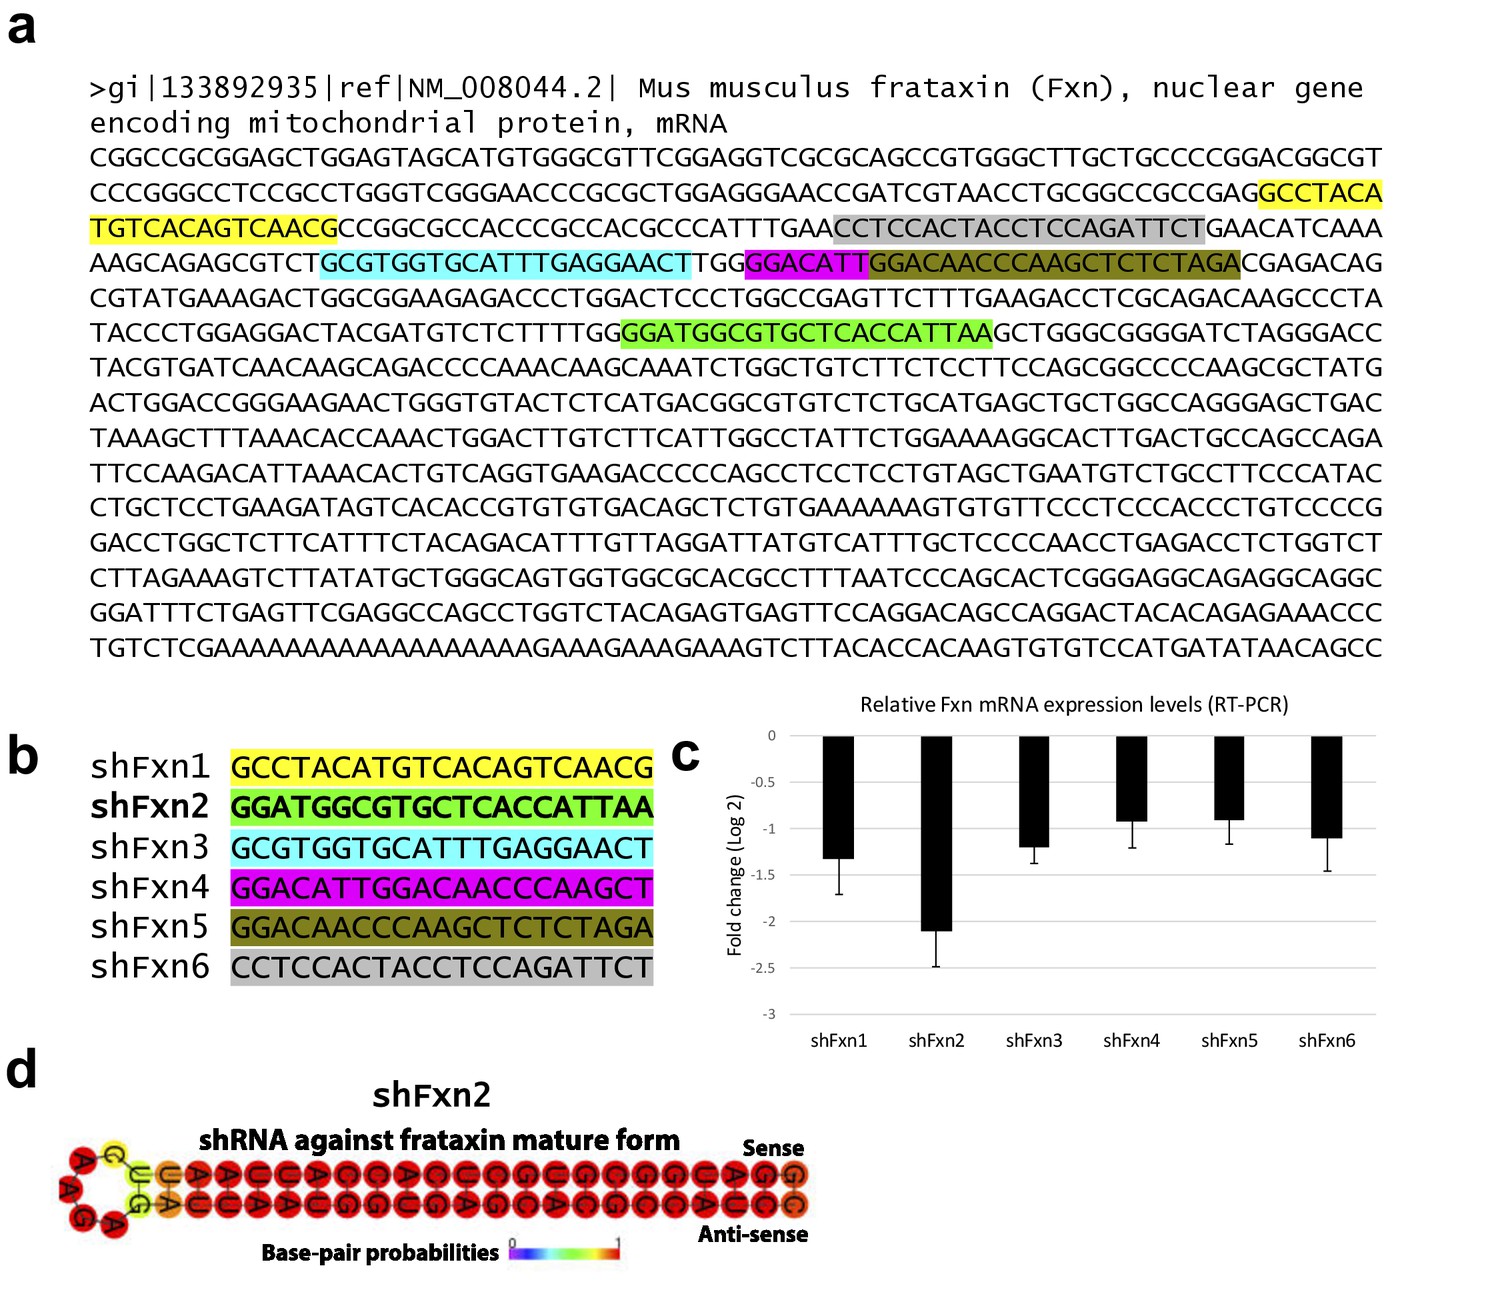
In vitro knockdown validation of Fxn-specific shRNAs.
(a) Mouse Fxn sequence and the shRNA targeting sites are color coded. (b) Fxn-specific shRNA sequences utilized for screening. (c) Quantitative RT-PCR was performed to determine the knockdown of Fxn in N2A cells that had been transfected with the indicated shRNA vectors. Expression levels are shown as relative fold change when compared to the shRNA control vector. Three independent experiments were performed. (d) Predicted minimum free energy secondary structure of selected shRNA targeting the Fxn is shown with the sequence (sense strand) and its complement sequence (antisense strand) in the duplex form along with hairpin loop.
Figure 1—figure supplement 2
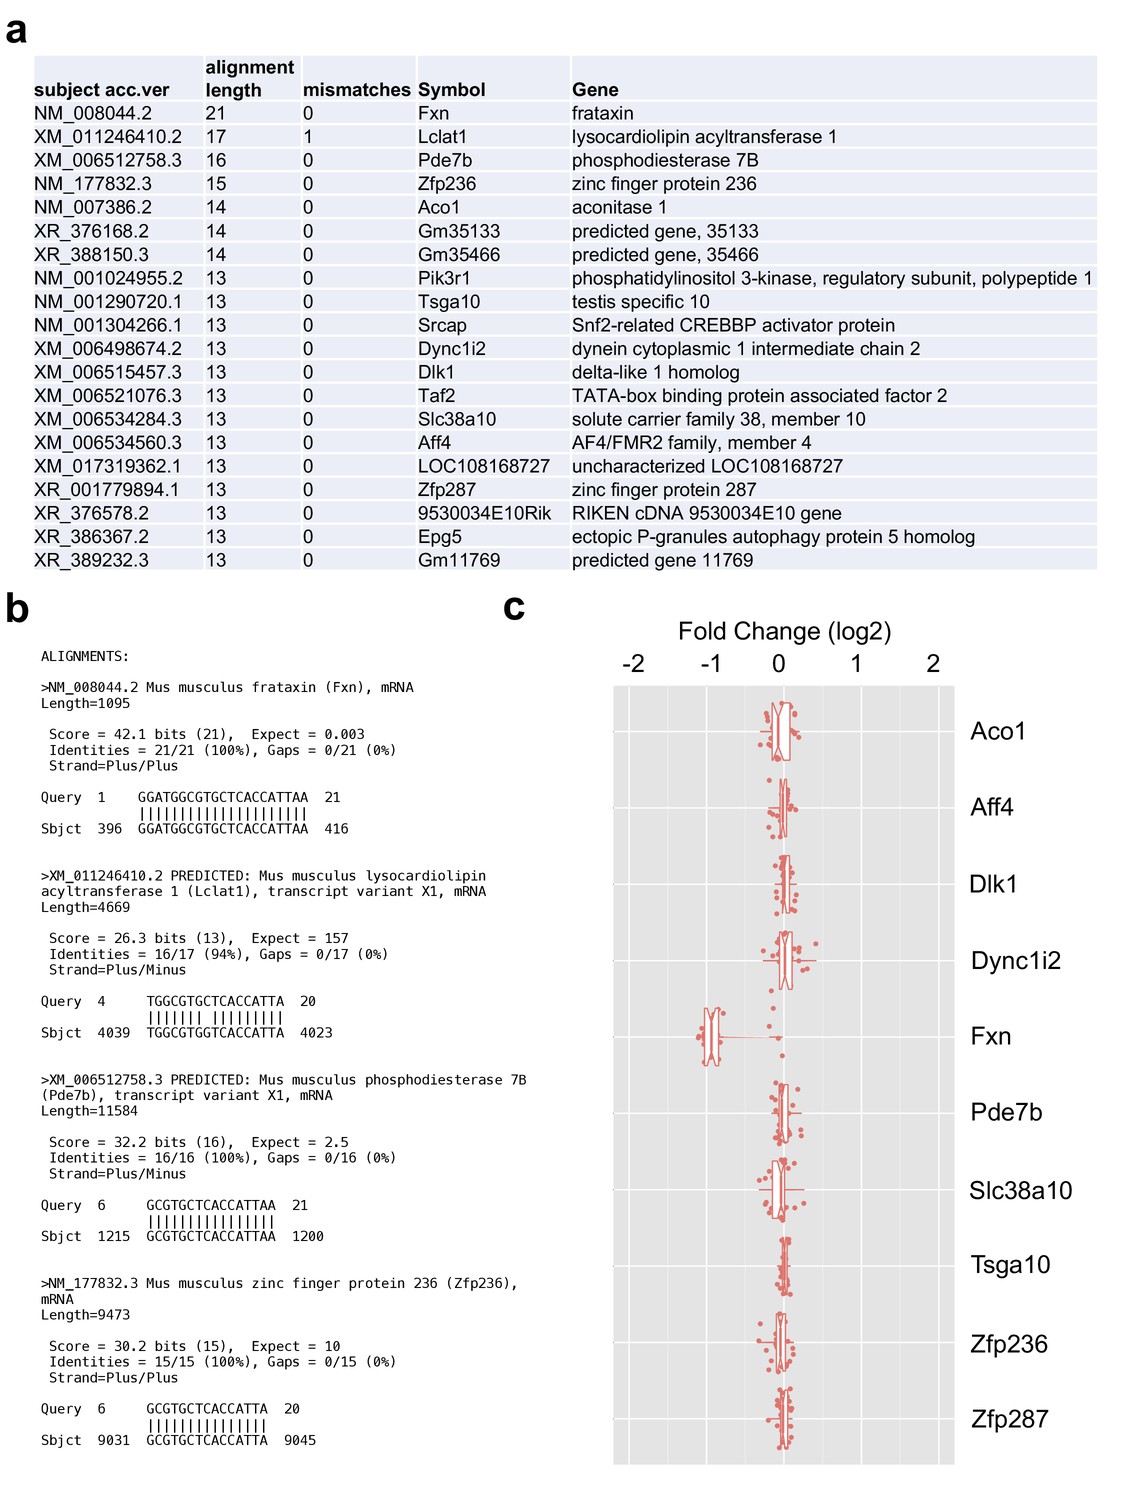
Validation of shRNA off-target effects.
(a) Potential putative targets of the shRNA sequence (GGATGGCGTGCTCACCATTAA) in the whole mouse genome transcripts identified utilizing the BLASTN program. (b) Example alignments of top four hits showing Fxn gene as top hit with all 21 base pair matched as expected along with other potential targets having 16 to 13 base pair matches. (c) Box plots showing gene expression levels of all the potential target genes present in our microarray data (see Figure 7) after induction of the shRNA. It is important to know that not all the potential targets genes had a probe on the Illumina array, hence the plot only shows ten genes. Fxn was the only gene showing significant down-regulation when compared to all other potential targets genes, suggesting the absence of significant off-target effects.
Figure 2 with 2 supplements
Neurological deficits due to frataxin knockdown.
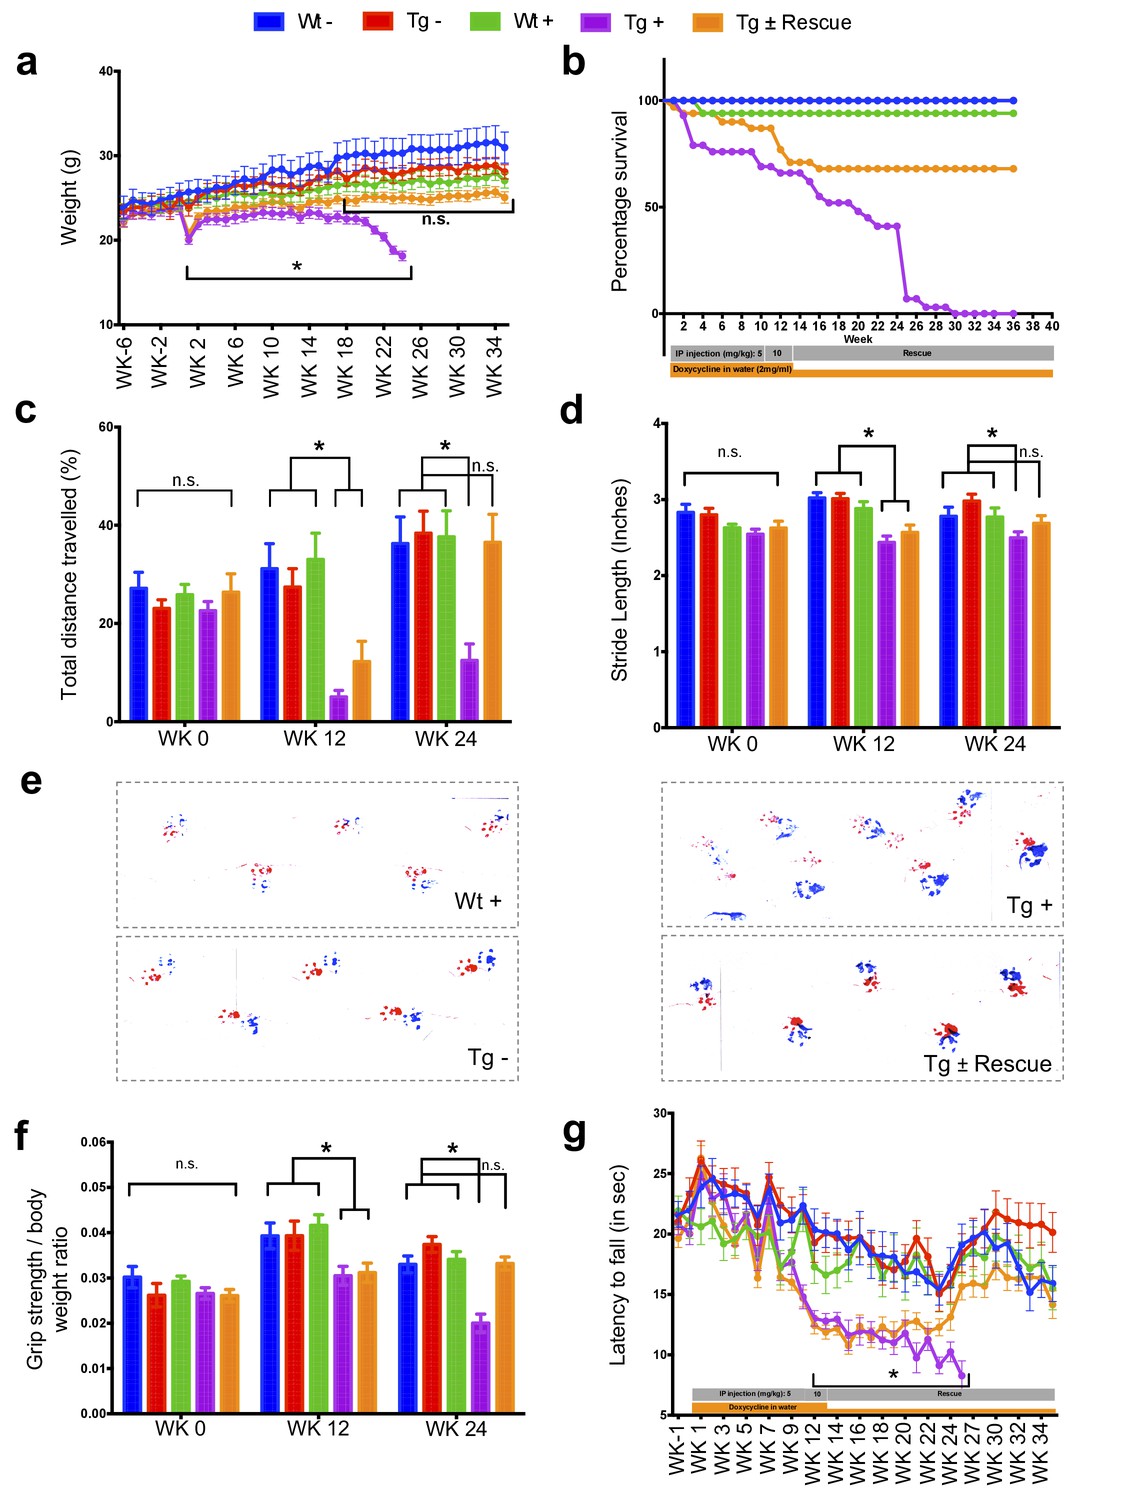
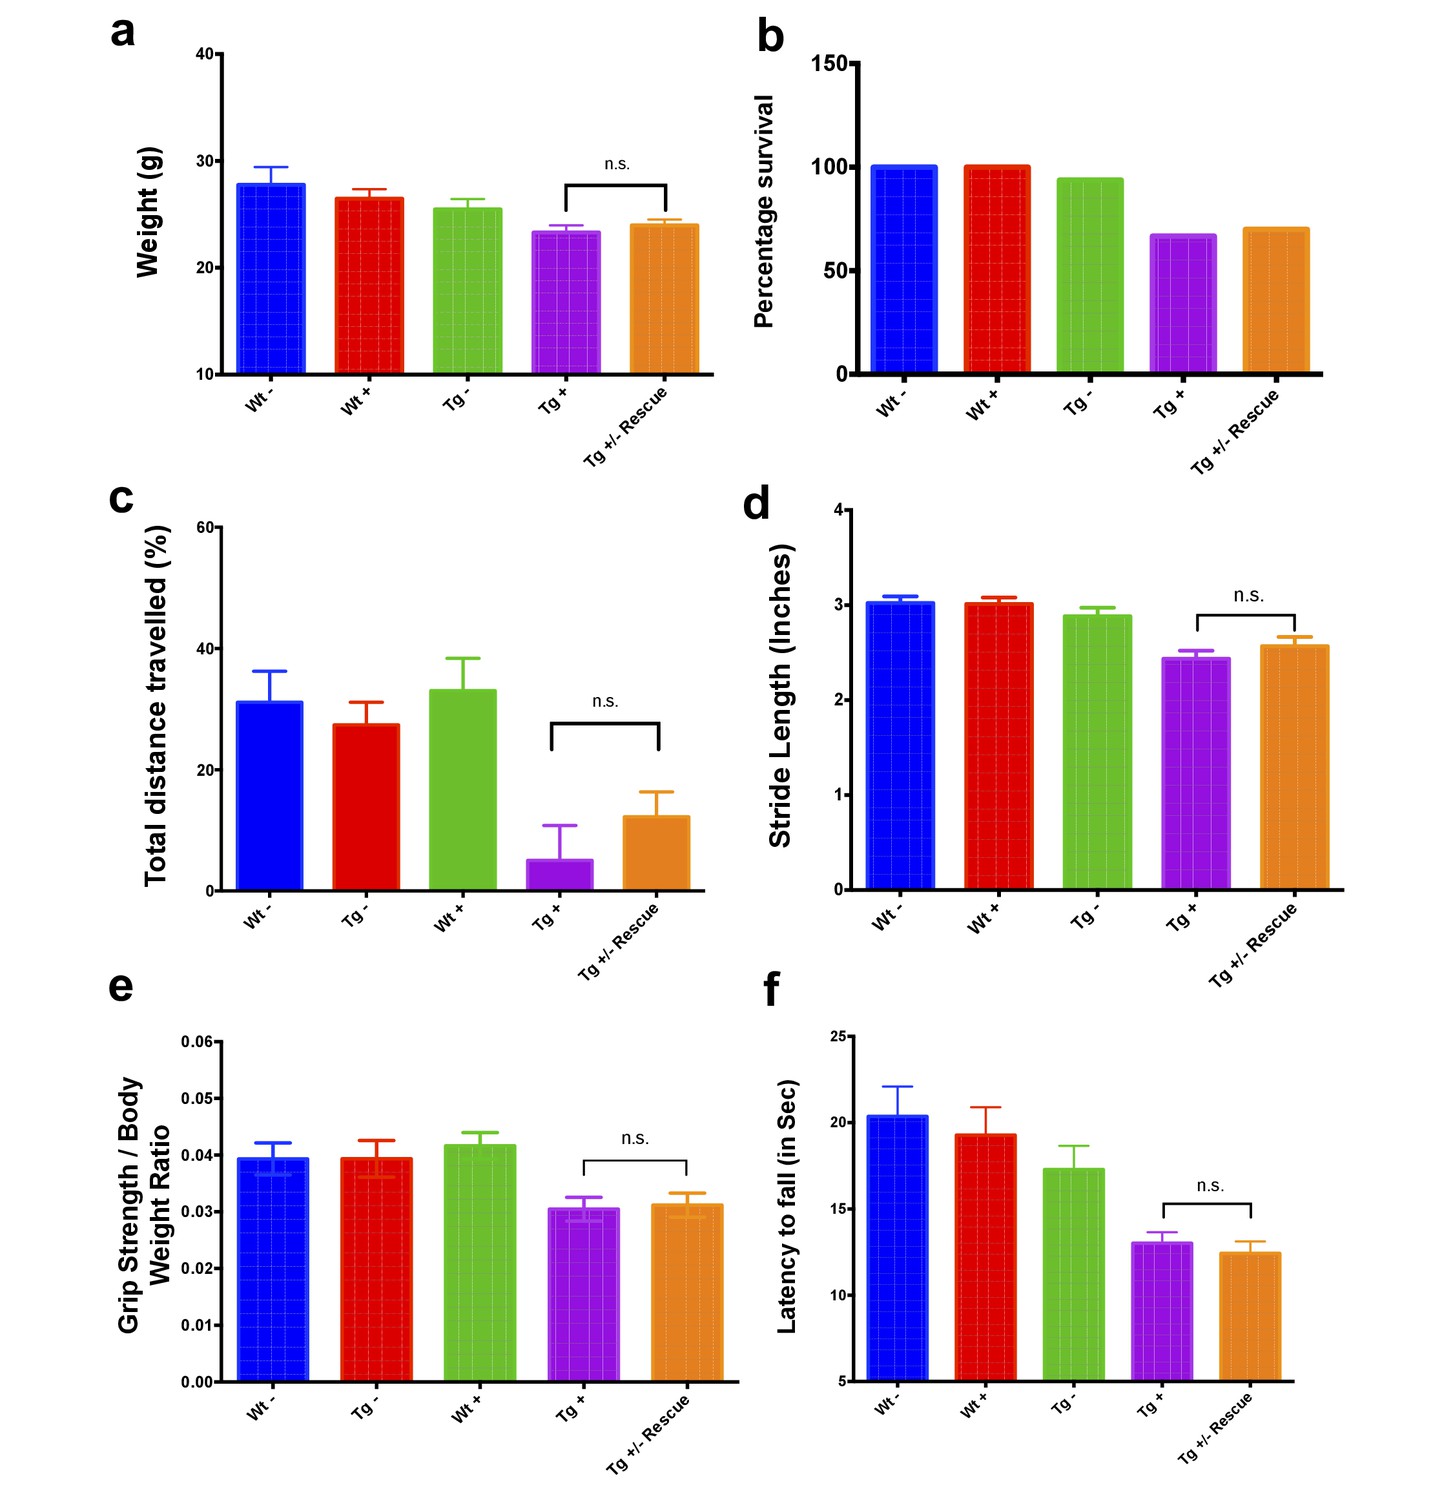
Body weight, survival, open field, gait analysis, grip strength and Rotarod in five groups of animals; wild-type mice with dox (Wt +, n = 16 (WK 0), n = 16 (WK 12), n = 16 (WK 24)) and without dox (Wt -, n = 16 (WK 0), n = 16 (WK 12), n = 16 (WK 24)), transgenic mice with dox (Tg +, n = 30 (WK 0), n = 21 (WK 12), n = 15 (WK 24)) and without dox (Tg -, n = 16 (WK 0), n = 15 (WK 12), n = 15 (WK 24)), and transgenic mice with dox removal (Tg ± Rescue, n = 30 (WK 0), n = 21 (WK 12), n = 20 (WK 24)). (a) Body weight from before 6 weeks and upto 34 weeks after dox treatment. (b) Survival was significantly diminished in dox treated Tg + animals, no mortality was observed after dox withdrawal (Tg ± Rescue). (c) Open field test showing significant decline in total distance traveled by the dox treatment transgenic animals (Tg +) at 12 and 24 weeks when compared across all other groups. After dox withdrawal, there were no differences between the rescue group (Tg ± Rescue) and the three control groups at week 24. (d) Gait footprint analysis of all five groups of mice at 0, 12, and 24 weeks was evaluated for stride length. Dox treated transgenic (Tg +) animals revealed abnormalities in walking patterns displaying significantly reduced stride length; however, the rescue group (Tg ± Rescue) displayed normal stride length when compared to other groups. (e) Representative walking footprint patterns. (f) Grip-strength test, dox treated transgenic (Tg +) mice had reduced forelimb grip strength at 12 and 24 weeks when compared across all other groups. After dox withdrawal, there were no significant differences between the rescue group (Tg ± Rescue) and the three control groups at week 24. (g) Rotarod test in mice upto 34 weeks after dox treatment. Dox treated transgenic (Tg +) animals stayed less time on the Rotarod than the control groups, although after dox withdrawal, there was no significant difference between the rescue group (Tg ± Rescue) and the three control groups. Values between all five groups are shown as mean ±SME. Two-way ANOVA test *p≤0.001; n.s., not significant.
-
Figure 2—source data 1
This spreadsheet contains the raw data which was used to generate the graphs shown in Figure 2 after frataxin knockdown during various behavioral tests in FRDAkd and control animals.
- https://doi.org/10.7554/eLife.30054.009
Figure 2—figure supplement 1
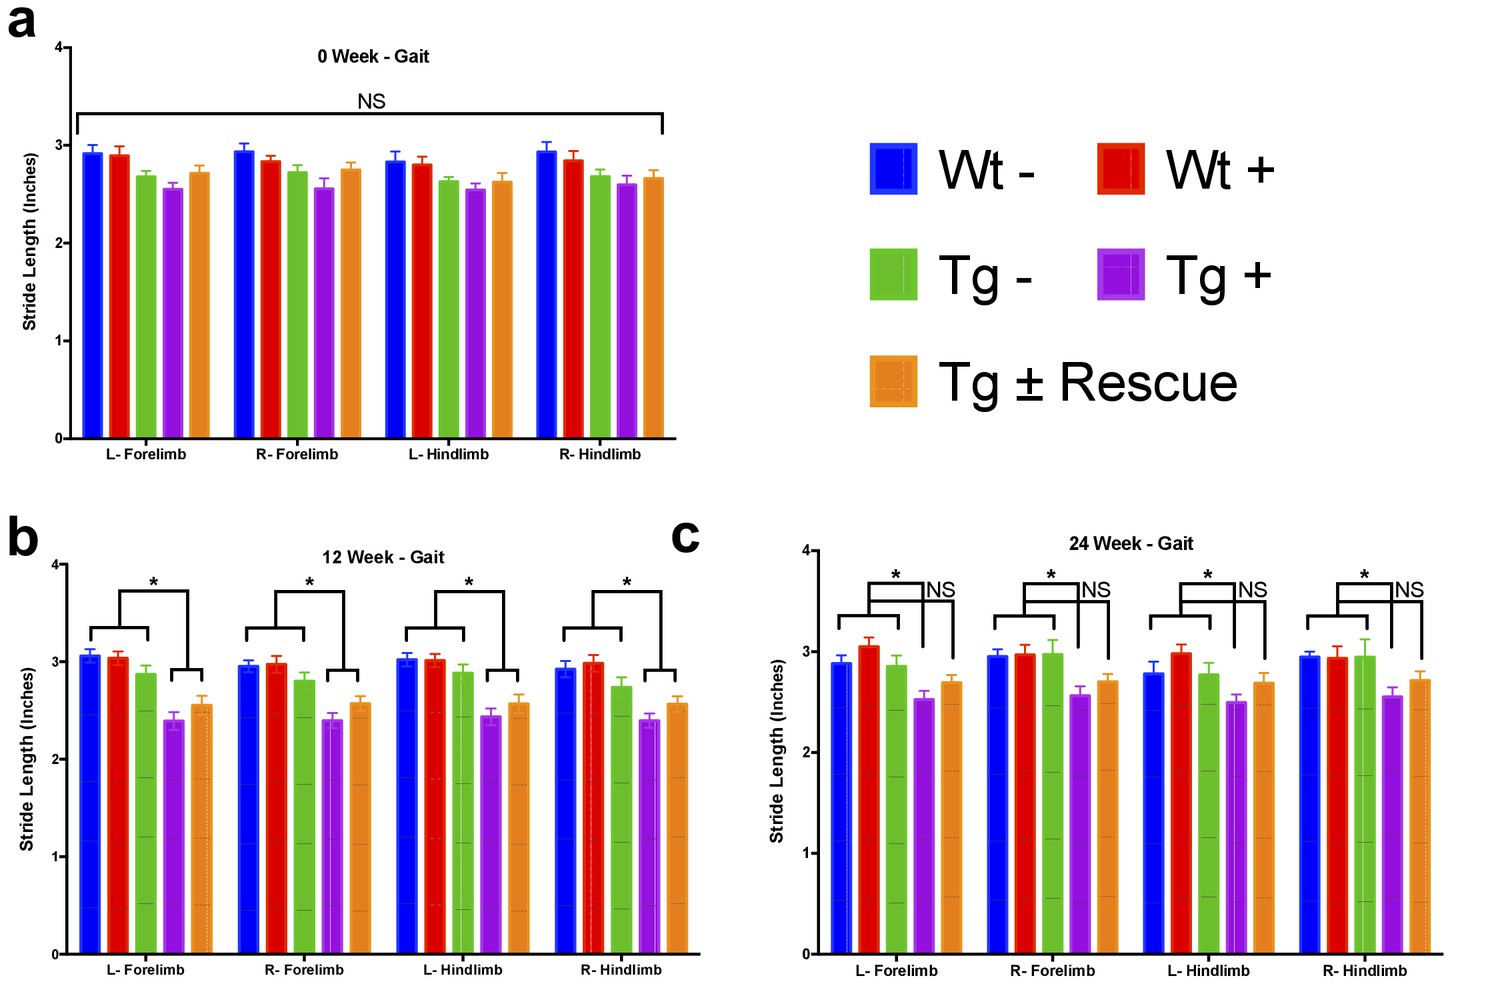
Gait analysis measurements reveals decreased stride length in Fxn knockdown animals.
Stride length, which was defined as the distance between successive placements of the same paw at maximum contact, for left hind (L-Hindlimb), right hind (R-Hindlimb), left front (L-Forelimb) and right front (R-Forelimb) limbs from five groups of animals; wild-type mice with dox (Wt +, n = 16(WK 0), n = 16(WK 12), n = 16(WK 24)) and without dox (Wt -, n = 16(WK 0), n = 16(WK 12), n = 16(WK 24)), transgenic mice with dox (Tg +, n = 30(WK 0), n = 21(WK 12), n = 15(WK 24)) and without dox (Tg -, n = 16(WK 0), n = 15(WK 12), n = 15(WK 24)), and transgenic mice with dox removal (Tg ± Rescue, n = 30(WK 0), n = 21(WK 12), n = 20(WK 24)) at 0, 12 and 24 weeks. Values between all five groups are shown as mean ±SME. Two-way ANOVA test *= P ≤ 0.001; n.s., not significant.
Figure 2—figure supplement 2
Behavioral changes at twelve weeks in FRDAkd mice.
(a) Body weight, (b) survival, (c) open field, (d) gait analysis, (e) grip strength and (f) Rotarod in five groups of animals; wild-type mice with dox (Wt +, n = 16 (WK 0), n = 16 (WK 12), n = 16 (WK 24)) and without dox (Wt -, n = 16 (WK 0), n = 16 (WK 12), n = 16 (WK 24)), transgenic mice with dox (Tg +, n = 30 (WK 0), n = 21 (WK 12), n = 15 (WK 24)) and without dox (Tg -, n = 16 (WK 0), n = 15 (WK 12), n = 15 (WK 24)), and transgenic mice with dox removal (Tg ± Rescue, n = 30 (WK 0), n = 21 (WK 12), n = 20 (WK 24)). At 12 weeks after dox treatment, Tg + and Tg ± Rescue animals (before dox removal) did not show any significant difference in these tests.
Figure 3

Frataxin knockdown mice exhibit signs of cardiomyopathy.
(a) Representative traces of ECG recording in a wild-type and transgenic animal after dox treatment for 20 weeks, showing long QT intervals in Tg + animal. (b) ECG recording of a same dox treated transgenic (Tg +) animal at 12 and after dox withdrawal for additional 12 weeks (Tg ± Rescue), showing normal QT interval. (c) ECG recording of the same dox treated transgenic (Tg +) animal at 12 and 24 weeks, showing absence of P-wave only at 24 weeks. (d) Representative echocardiograms from the left ventricle of a wild-type and transgenic mouse at 24 weeks after dox treatment. (e–f) Quantification of observed QT interval (e), ventricular septal wall thickness (f) and posterior wall thickness (g) are shown for weeks 12 and 24. N = 6–8 animals per group, *=p < 0.05; Student's t test. Error bars represent mean ±SEM.
-
Figure 3—source data 1
This spreadsheet contains the electrocardiogram and echocardiogram quantification data after frataxin knockdown during week 12 and 24 in FRDAkd and control animals which was used to generate the bar plots shown in Figure 3e–g.
- https://doi.org/10.7554/eLife.30054.011
Figure 4 with 1 supplement
Cardiopathology of frataxin knockdown mice.
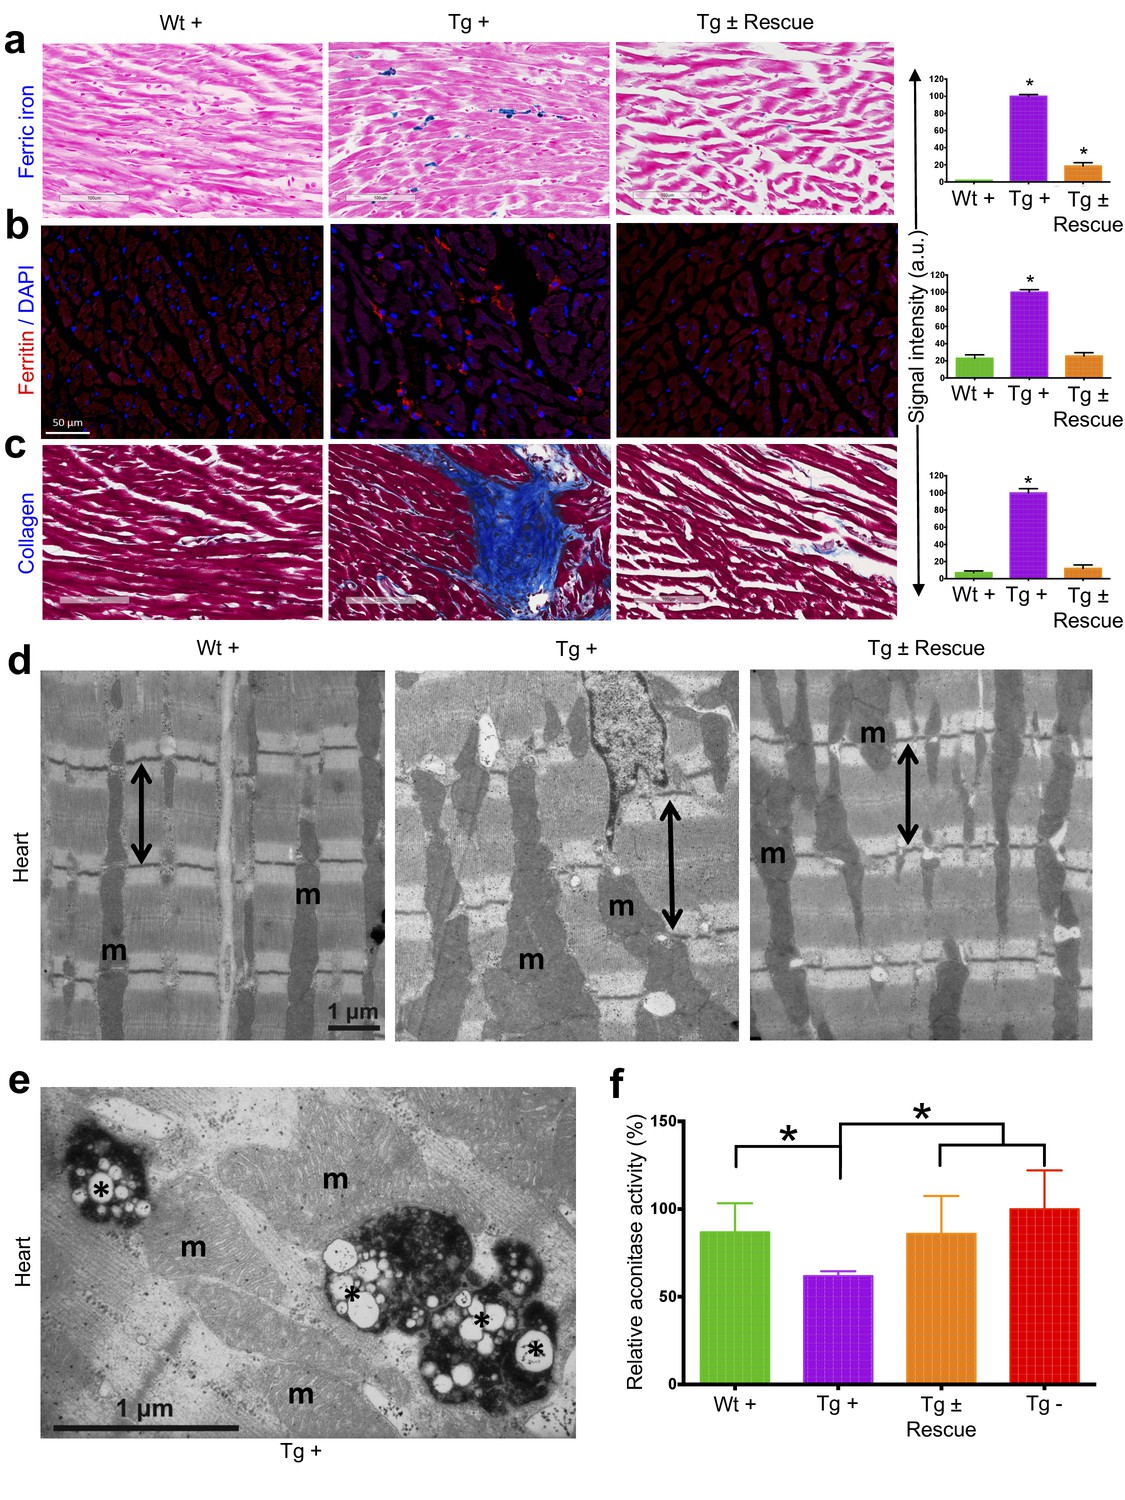
(a) Gomori’s iron staining and quantification of iron deposition in dox treated transgenic (Tg +), wild-type (Wt +) and dox withdrawn transgenic (Tg ± Rescue) animals. Dox treated transgenic (Tg +) mice showing myocardial iron-overload (a) also displayed altered expression of ferritin protein (b) which is involved in iron storage. Both iron-overload and ferritin protein levels were significantly lower in Tg ± Rescue animals (a–b). (c) Masson's trichrome staining and quantification showing increased fibrosis in Tg + mice when compared to Wt + and Tg ± Rescue animals. (d) Electron micrographs of cardiac muscle from Wt +, Tg + and Tg ± Rescue animals at 20 week after dox treatment. Double arrow lines indicate sarcomere. m = mitochondria. Scale bars, 1 μm. Data are representative of three biological replicates per group. (e) Higher magnification of electron micrographs of cardiac muscle from Tg + mice, showing normal (m) and degenerating mitochondria (asterisks). (f) Aconitase activity was assayed in triplicate in tissues removed from three hearts in each group. Values represent mean ±SME. One-way ANOVA test *p≤0.05.
-
Figure 4—source data 1
This spreadsheet contains the raw signal intensity quantification data of ferric iron, ferritin and collagen staining which was used to generate the graphs shown in Figure 4a–c and the aconitase and citrate synthase enzymatic activity measurements are provided (Figure 4f).
- https://doi.org/10.7554/eLife.30054.014
Figure 4—figure supplement 1
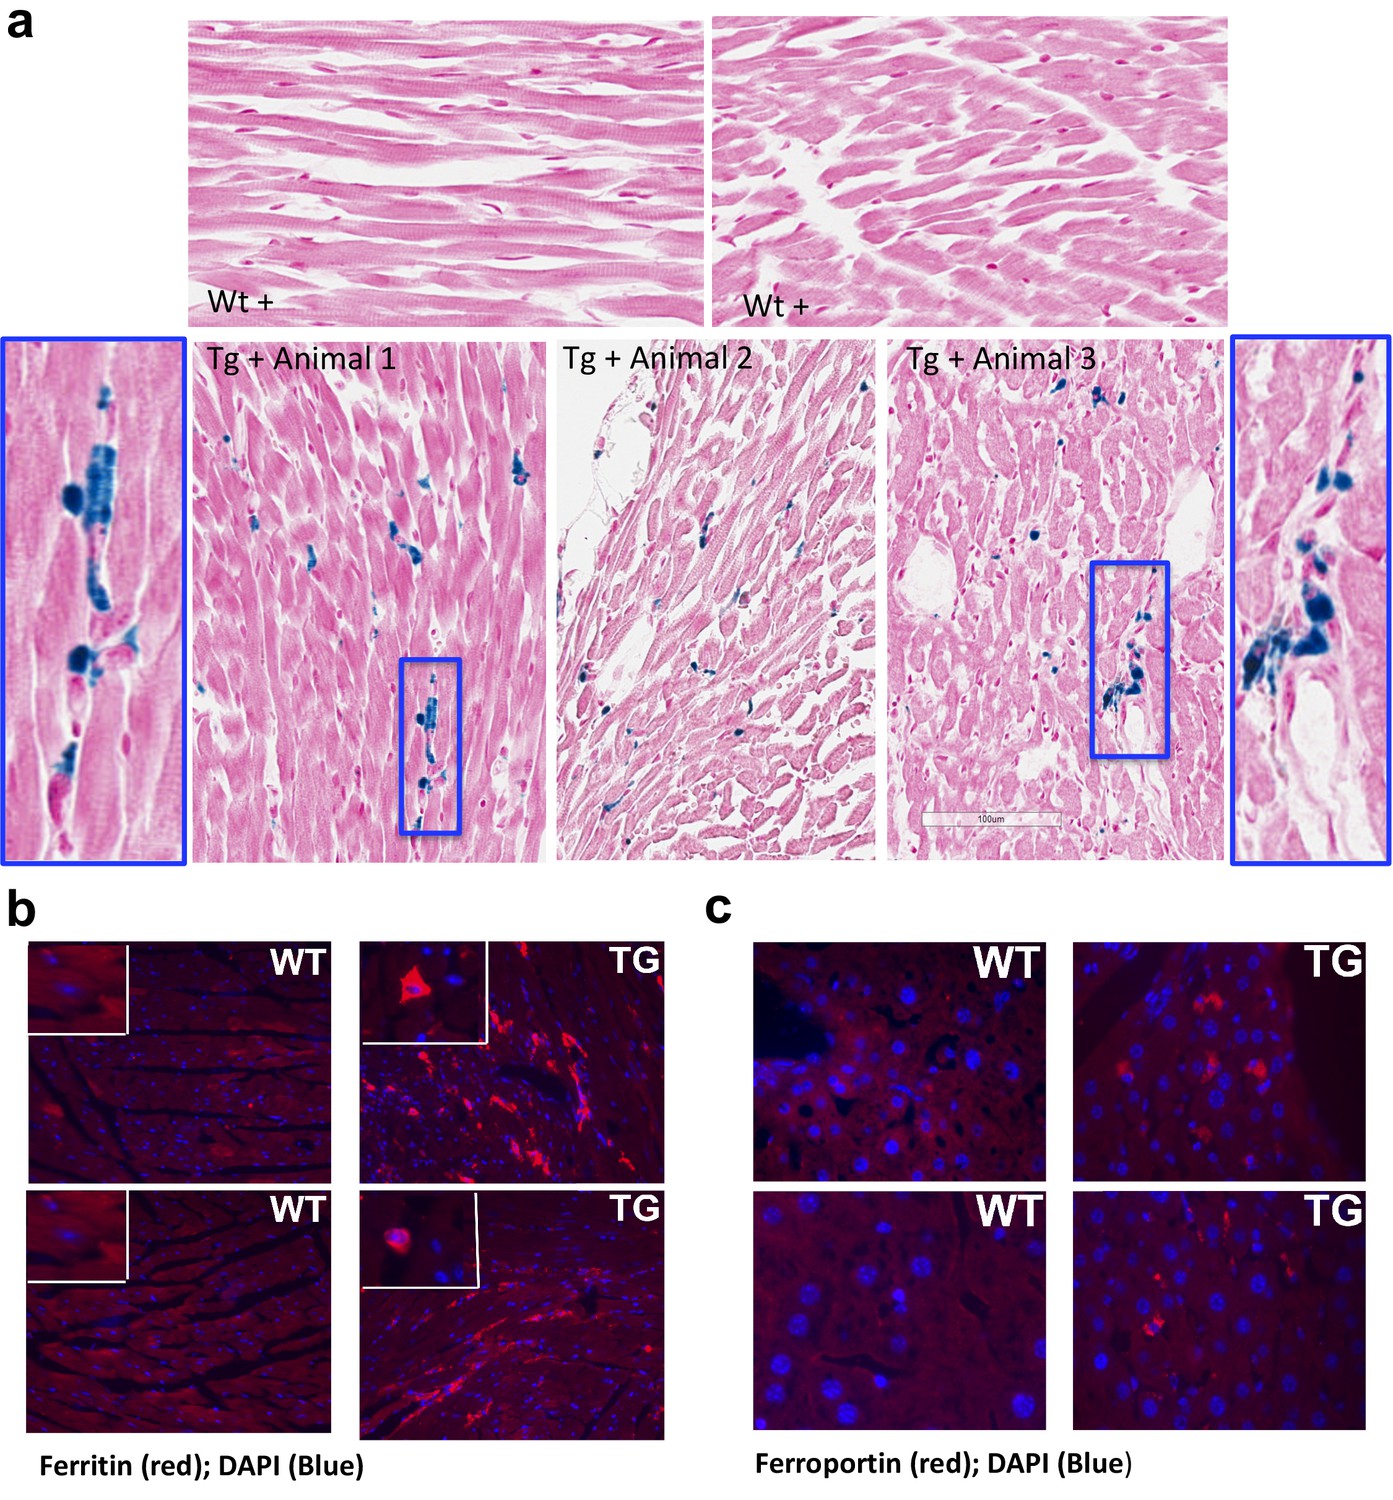
Frataxin deficiency in mouse heart results in iron accumulation and increased levels of ferritin and ferroportin.
(a) Gomori’s iron staining in sections of heart from Frataxin knockdown mice (Tg +) shows iron accumulation (insert) but not in wild type mice (Wt +). Scale bar represents 100 μm. (b–c) Immunohistochemical staining of heart from doxycycline treated wild type (WT) and Fxn knockdown (TG) mice using anti-rabbit ferritin (b) and ferroportin (c) antibodies. Original magnification: 20x.
Figure 5 with 1 supplement
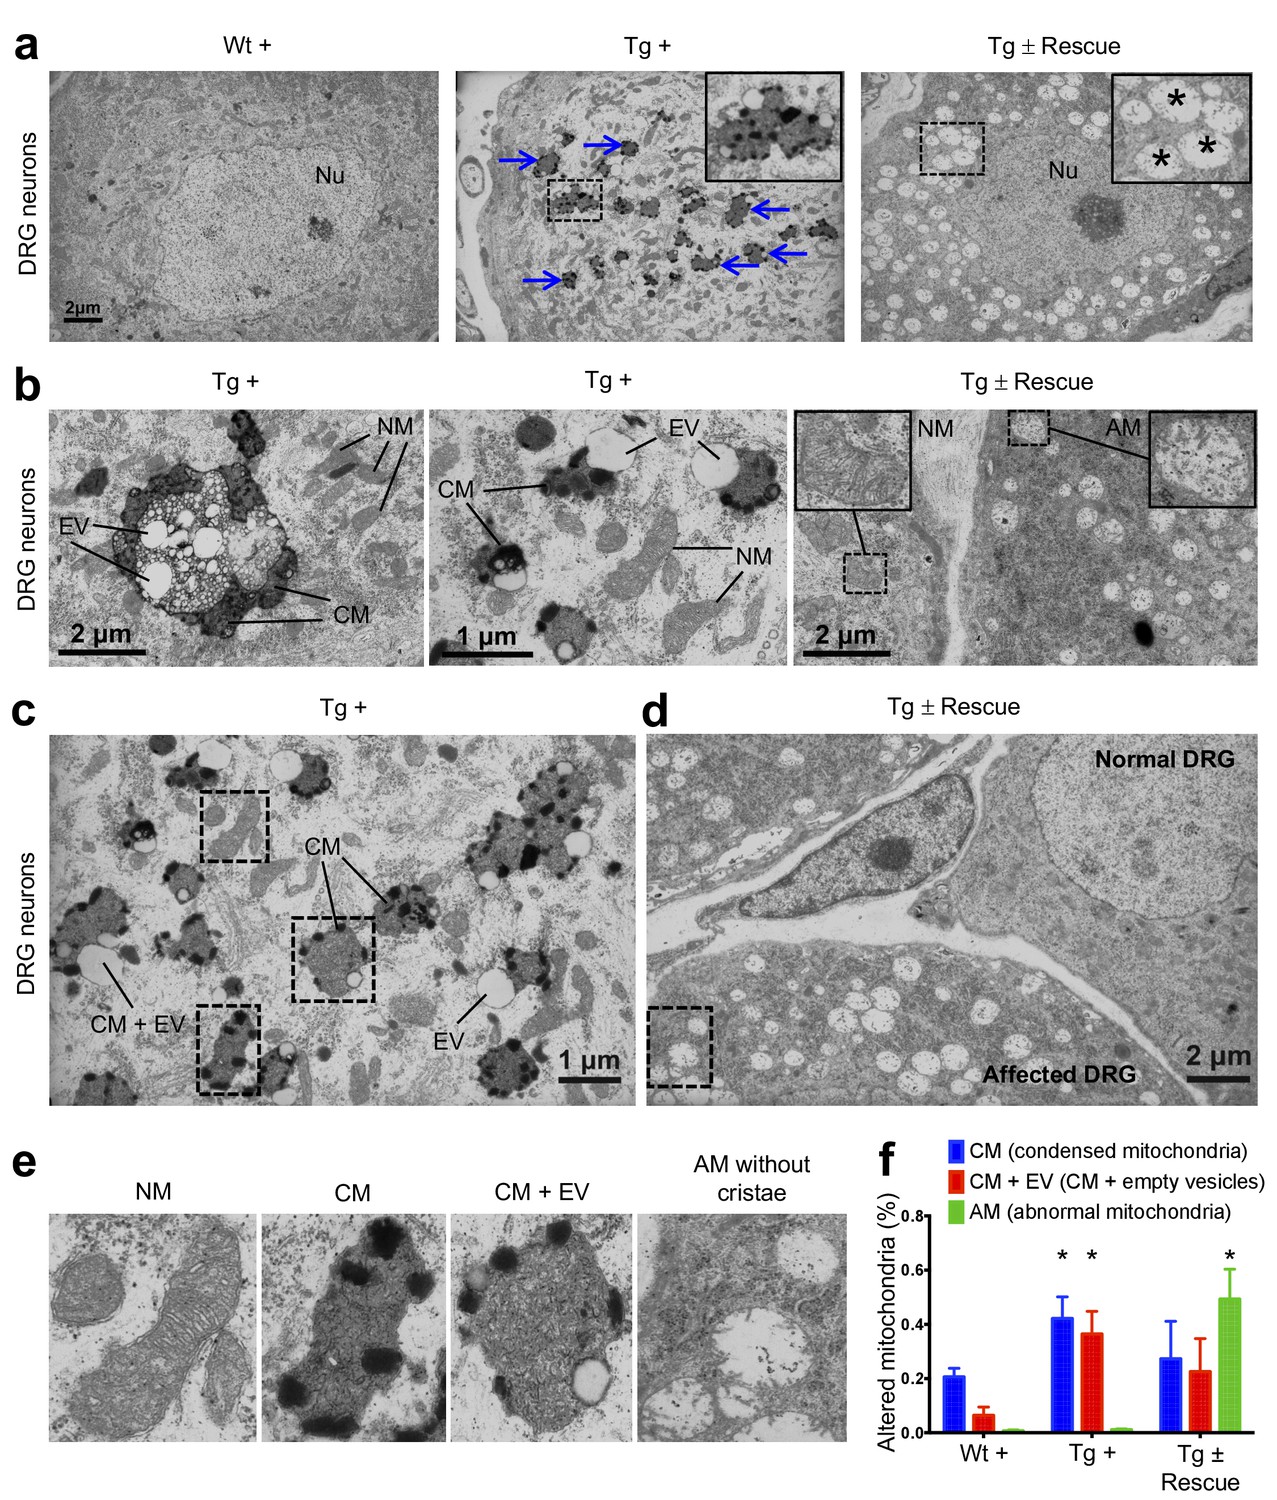
Frataxin knockdown mice exhibit neuronal degeneration.
(a) Electron microscopic analysis of Wt +, Tg + and Tg ± rescue animal DRG neurons at 20 week after dox treatment. Arrows indicate condensed mitochondria with empty vesicles. Insert in Tg + panel shows higher magnification of electron micrographs of condensed mitochondria with empty vesicles in DRG neurons. Insert in Tg ± Rescue panel shows higher magnification of abnormal mitochondria without cristae (asterisks). Nu = nucleus. (b) Higher magnification of electron micrographs of Tg + and Tg ± Rescue animal DRG neurons at 20 week after dox treatment. Tg + panel shows degenerating mitochondria and condensed mitochondria with empty vesicles in DRG neurons. Tg ± Rescue panel shows two DRG neurons, one consisting of normal mitochondria (insert) and the other neuron with abnormal mitochondria without cristae (insert). (c) Higher magnification of Tg + animals showing condensed mitochondria with empty vesicles in DRG neurons. (d) Higher magnification of Tg ± rescue animals showing two DRG neurons, one consisting of normal mitochondria (normal DRG) and the other neuron with abnormal mitochondria without cristae (affected DRG). (e) Insert images from c and d panels shows higher magnification of normal mitochondria (NM), condensed mitochondria (CM), condensed mitochondria along with empty vesicles (CM + EV), and abnormal mitochondria without cristae (AM). (f) Quantification of altered mitochondria in DRG neurons. Data are from multiple images from three biological replicates per group. Values represent mean ± SME. Two-way ANOVA test *=P ≤ 0.05.
-
Figure 5—source data 1
This spreadsheet contains the manual mitochondrial counting data from electron microscopy images of the DRG neurons which was used to generate the graph shown in Figure 5f after frataxin knockdown in FRDAkd and control animals.
- https://doi.org/10.7554/eLife.30054.017
Figure 5—figure supplement 1
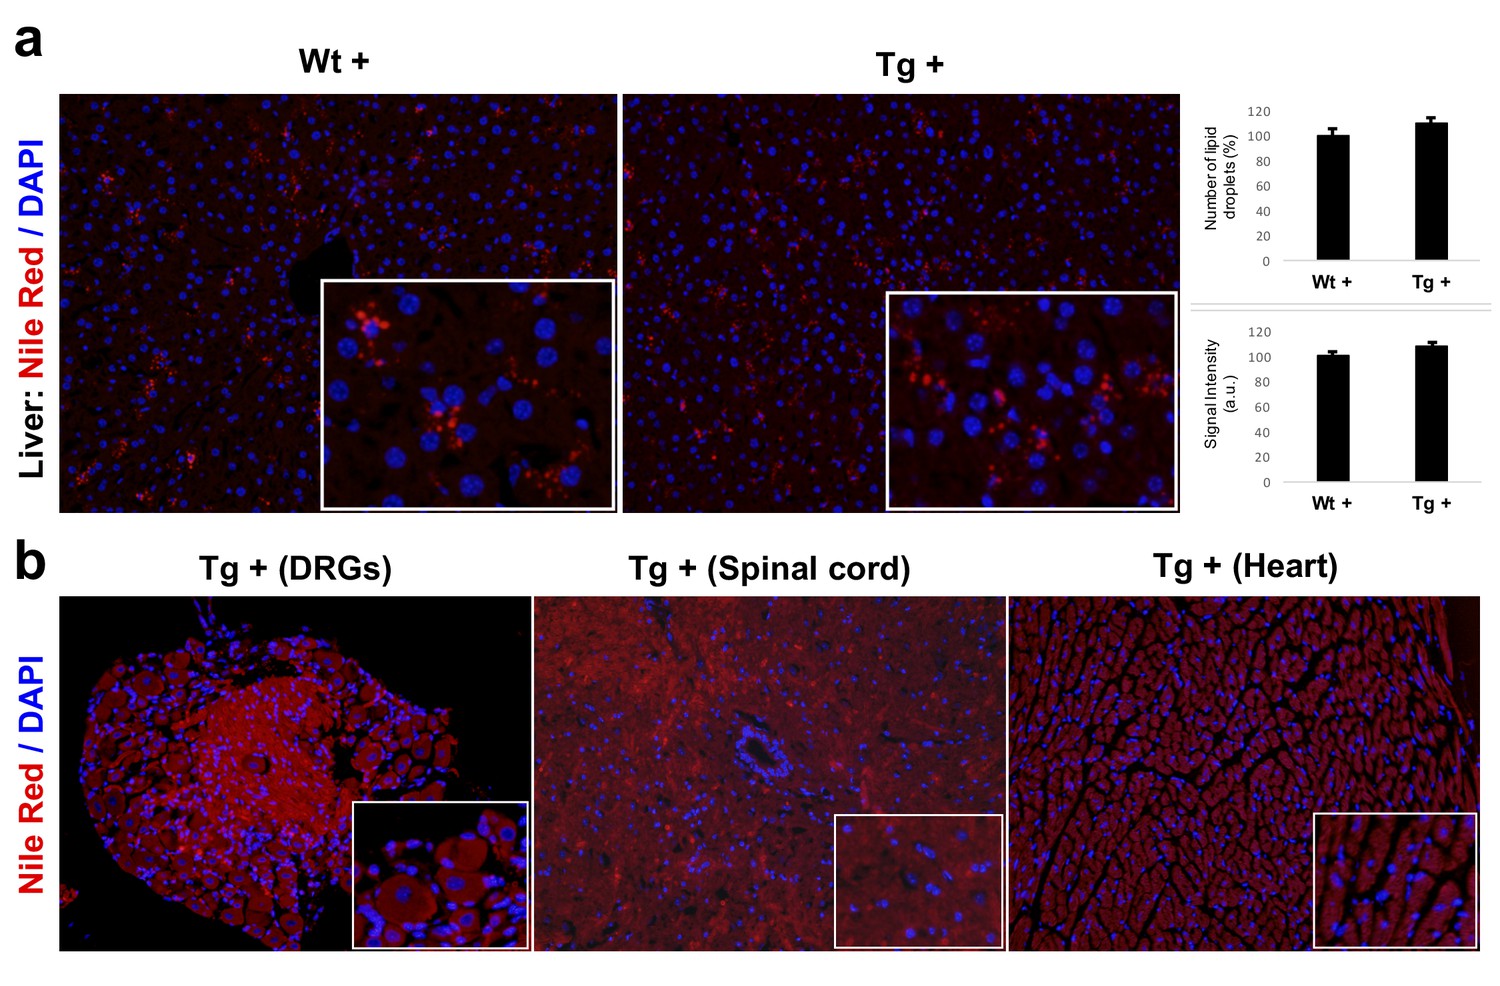
Nile Red staining labeling lipid droplets.
(a) Nile Red staining and quantification of lipid droplets in the liver samples of 20 weeks dox treated wild-type (Wt +) and transgenic (Tg +) animals. (b) Fluorescent micrograph of DRGs, spinal cord and heart samples obtained from Tg + animals showing very weak or no staining for lipid droplets using Nile Red stain.
Figure 6 with 3 supplements
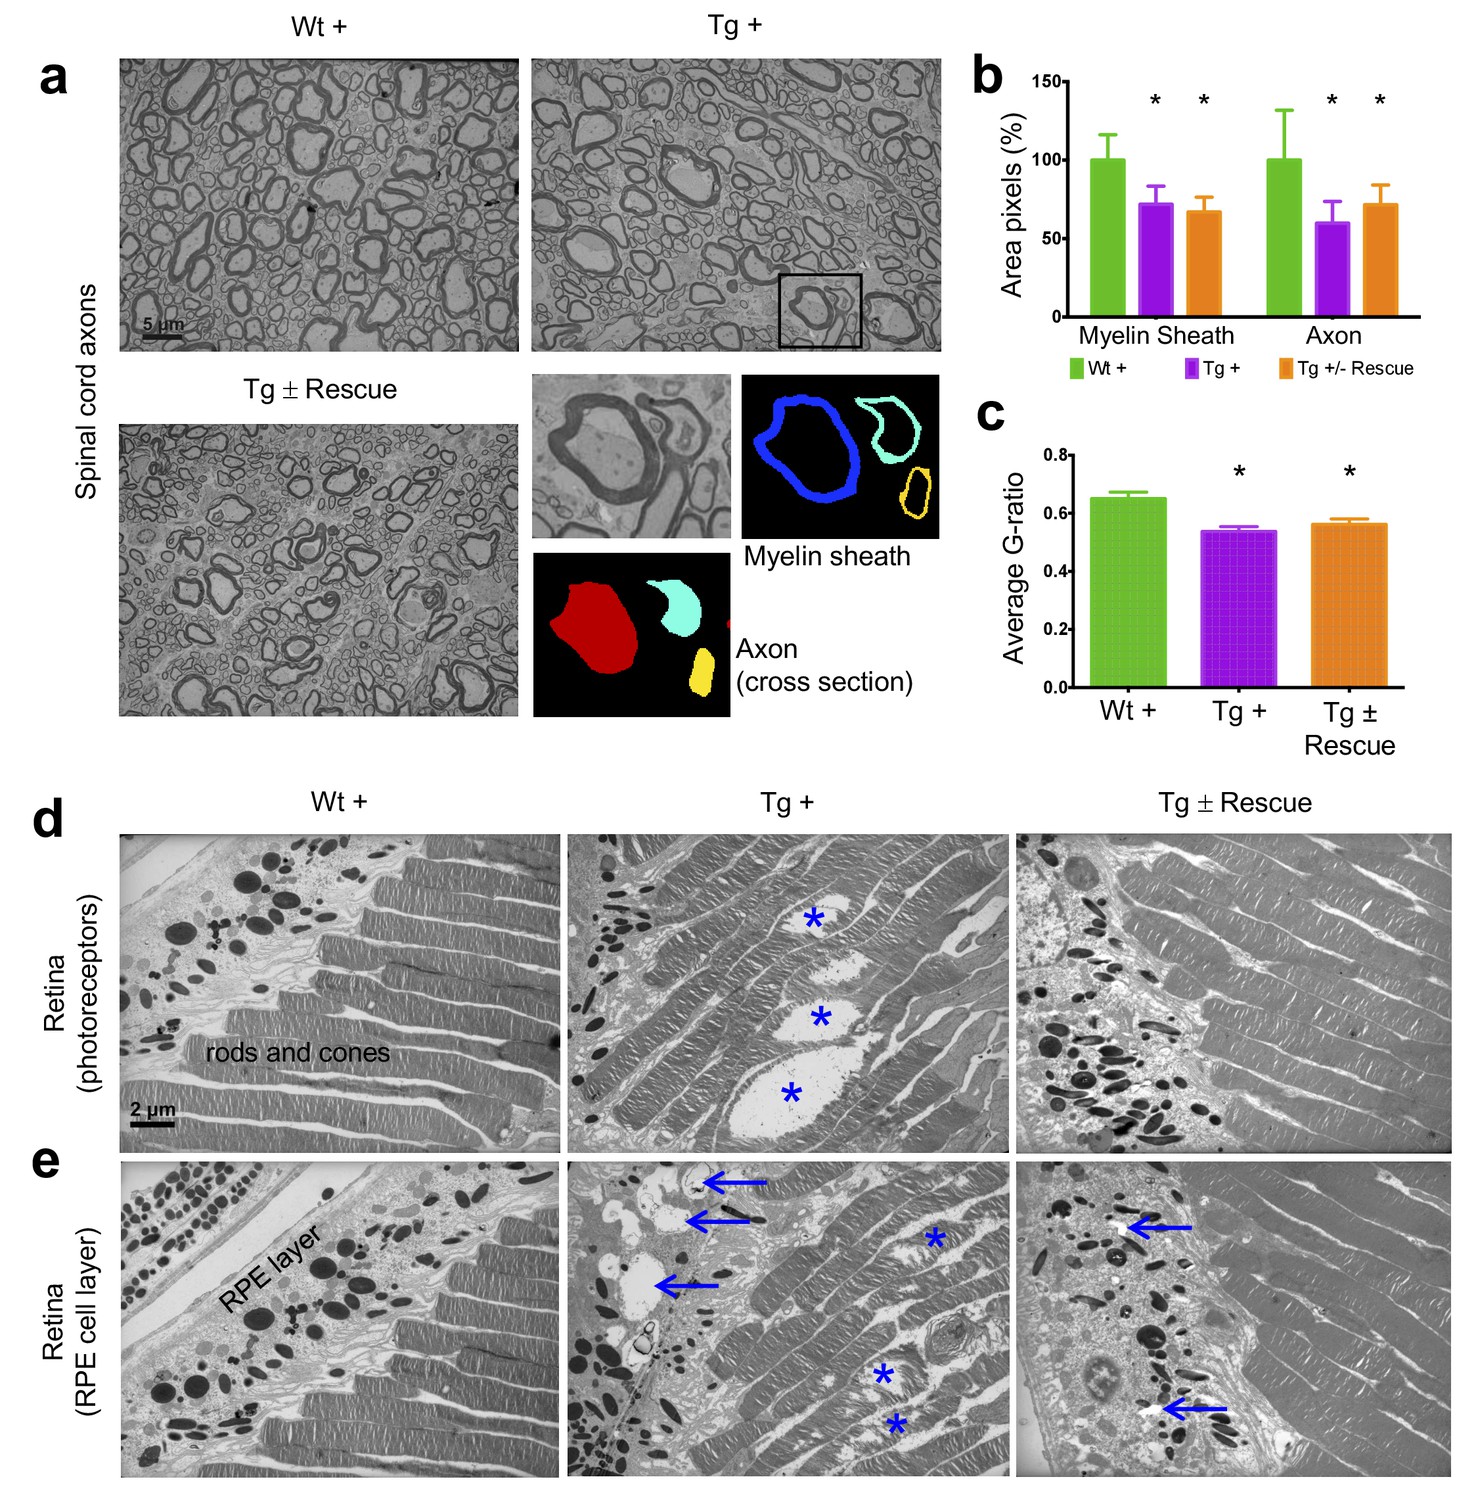
Frataxin knockdown mice exhibit neuronal degeneration in the spinal cord and retina.
Electron microscopic analysis of Wt +, Tg + and Tg ± rescue animal at 20 week after dox treatment. (a) Electron micrographs of spinal cord axon cross-section, displaying reduced myelin sheath thickness and axonal cross-section area in Tg + and Tg ± Rescue animals. Bottom panel shows representative area utilized for quantification. (b–c) Quantification of myelin sheath thickness and axonal cross-section area in the spinal cord. Data are from 2000 or more axons per group in the lumbar spinal cord cross-section of high-resolution electron micrographs from three biological replicates per group. Values represent mean ±SME. One-way ANOVA test *=P ≤ 0.05. (d) Electron micrographs of rod and cone photoreceptor cells, showing their disruption in Tg + animals (asterisks). (e) Retinal pigment epithelium cell layer showing the presences of large vacuoles (arrows) in Tg + animals along with disruption in their photoreceptor cells (asterisks).
-
Figure 6—source data 1
This spreadsheet contains the image analyses quantification data from electron microscopy images of the spinal cord axons which was used to generate the graph shown in Figure 6b and c after frataxin knockdown in FRDAkd and control animals.
- https://doi.org/10.7554/eLife.30054.022
Figure 6—figure supplement 1
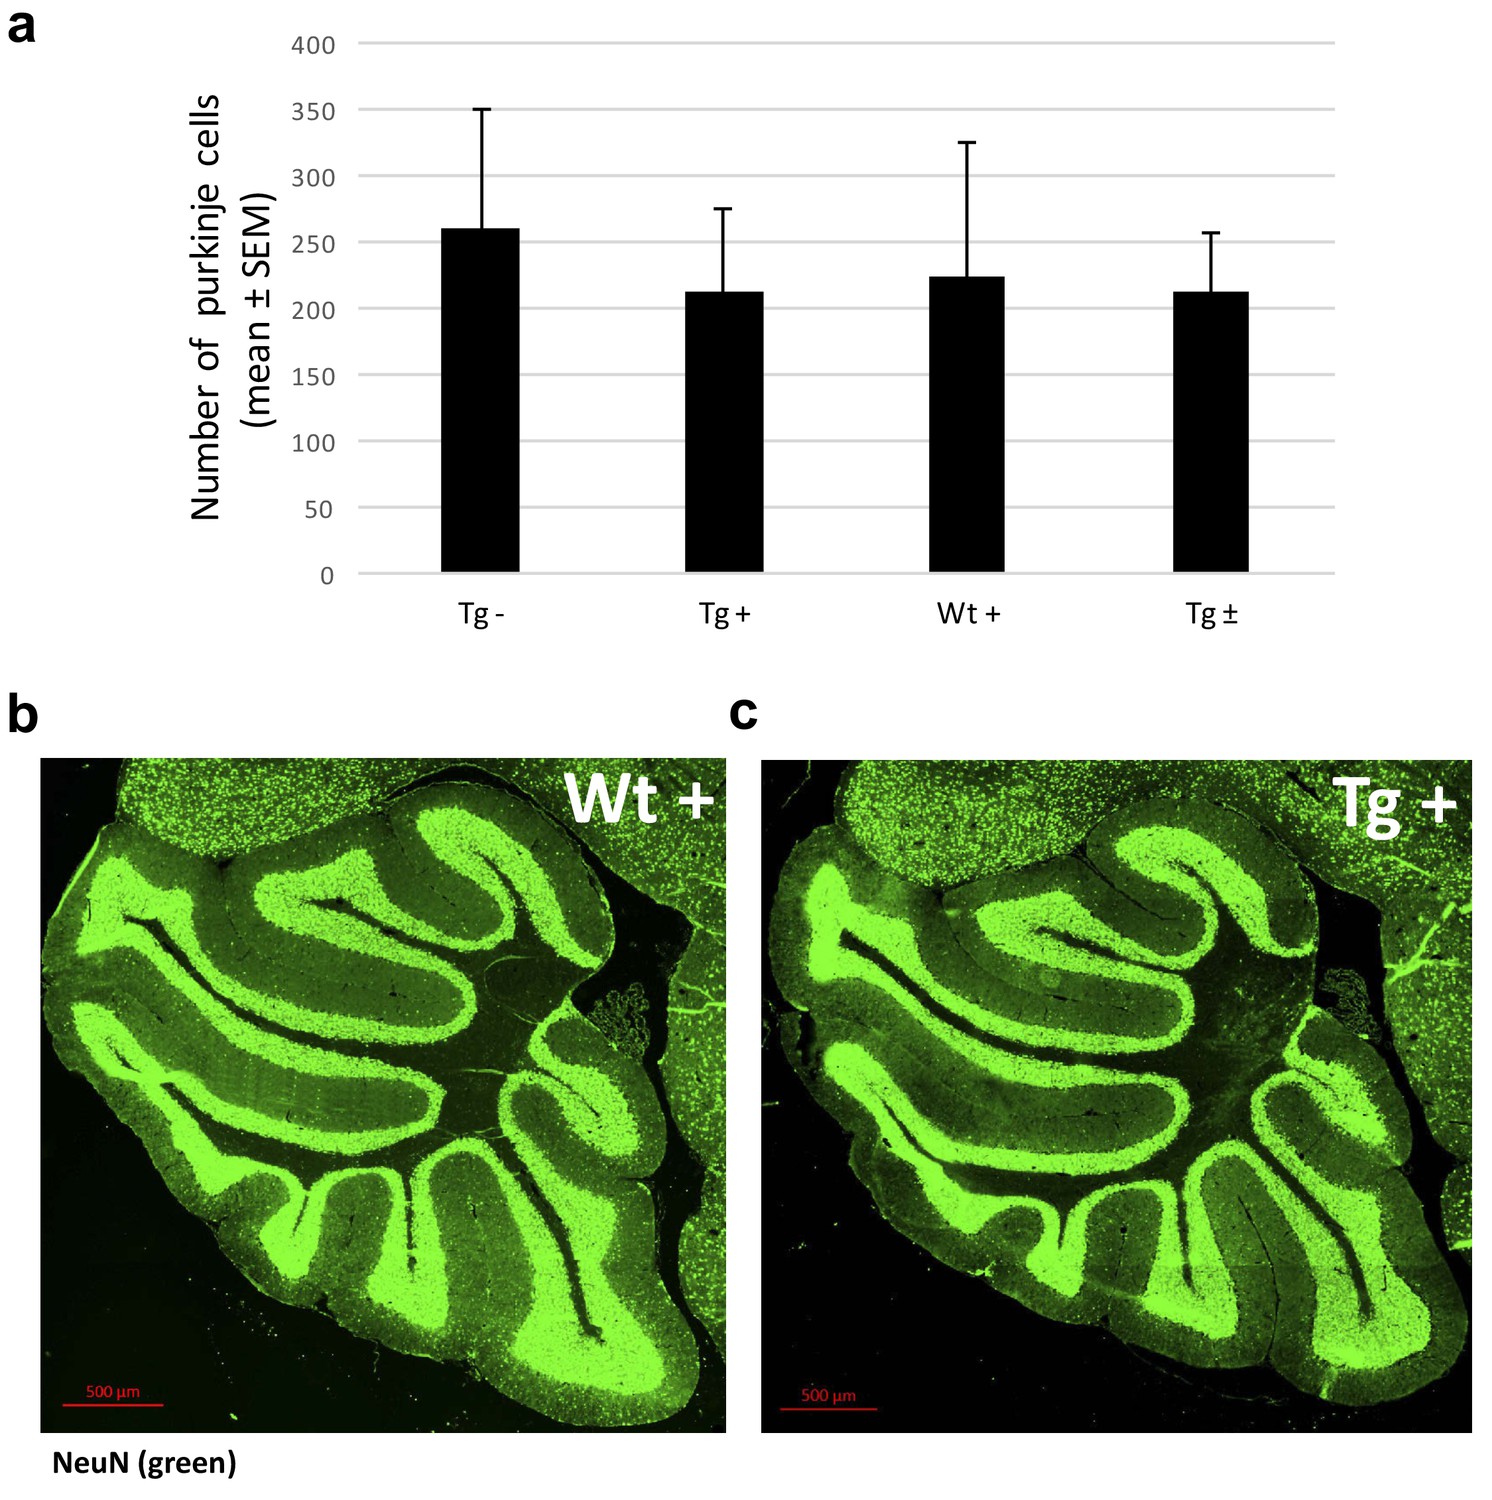
Frataxin knockdown in adult mice does not change the numbers of Purkinje cells and thickness of granular layer of the cerebellum.
(a) Quantification of Purkinje cells in each sagittal section from four groups of animals; transgenic mice with dox and without dox, wild-type mice with dox and transgenic mice with dox removal at 20 weeks showing no significant difference in number of purkinje cells. Statistics (mean ±s.e.m.) were obtained from independent measurements of three mice for each genotype. (b) NeuN-stained sagittal sections of the cerebellum showing normal thickness of cerebellar layers. Quantitative analysis showed that there was no difference in the thickness of granular layer in the cerebellum among all the genotypes.
Figure 6—figure supplement 2
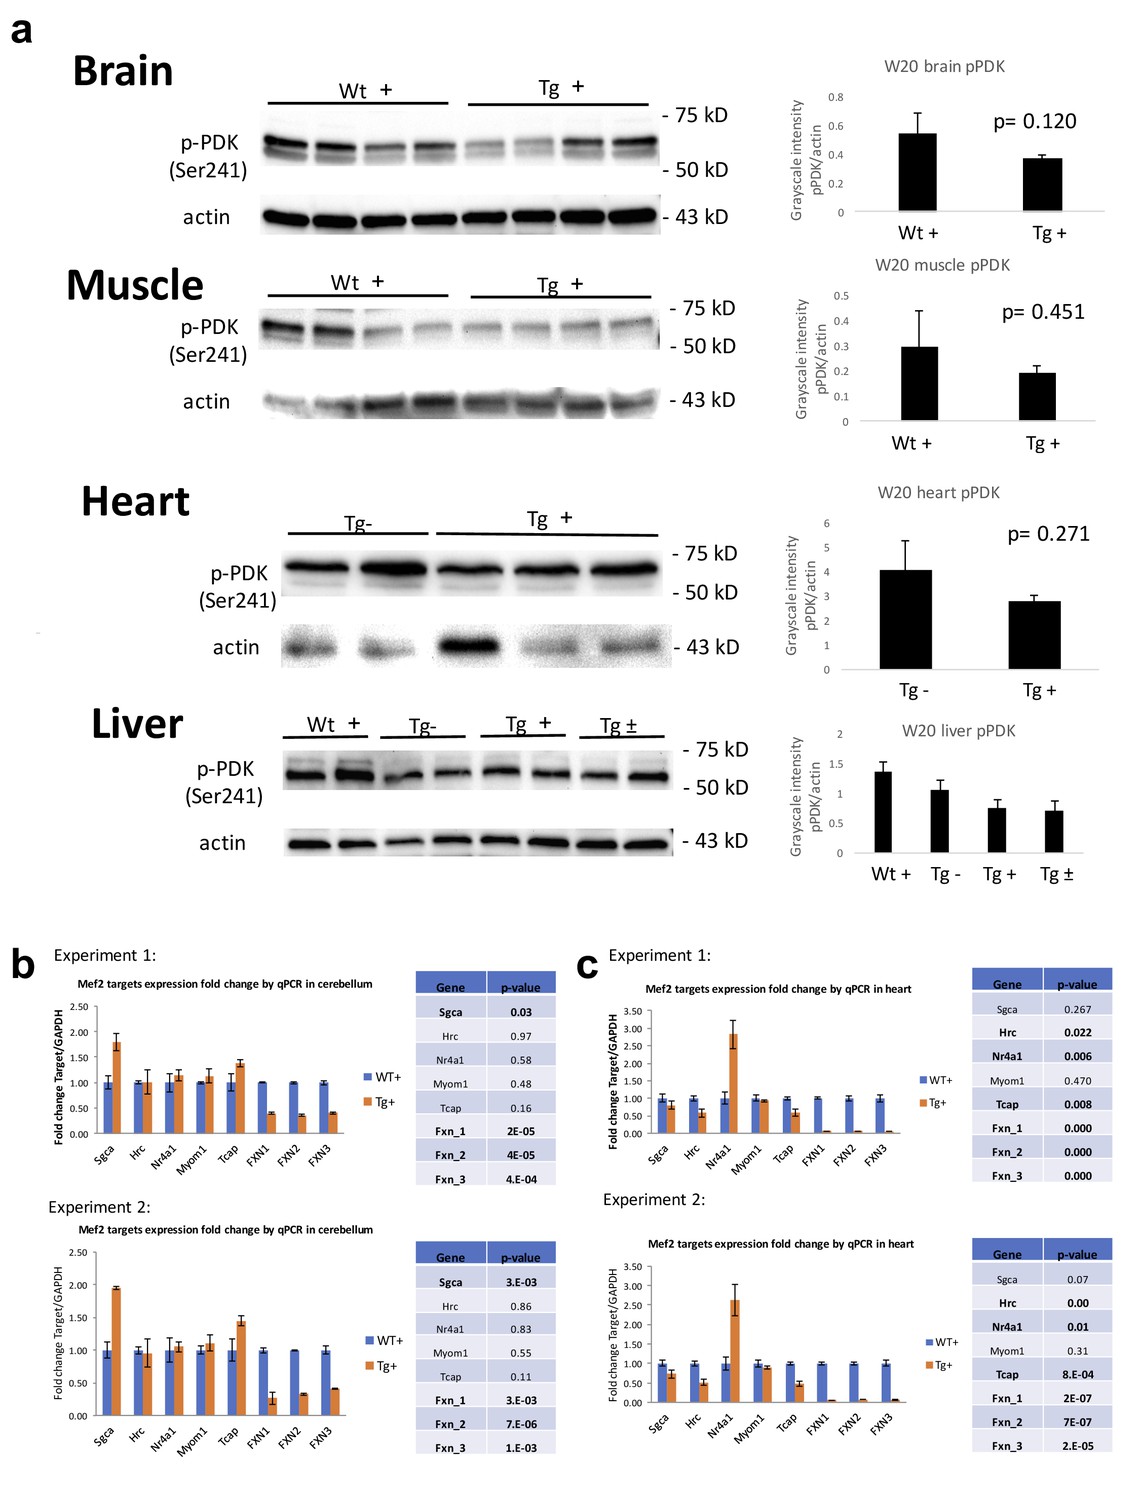
PDK1 and Mef3 pathway is not activated in Fxn knockdown mice.
(a) Immunoblot and quantification of PDK1 phosphorylation levels in brain, muscle, heart and liver of dox treated wild-type (Wt +) and transgenic (Tg +) animals at week 20. (b) mRNA levels of Mef2 downstream targets in cerebellum and heart from 20 weeks post dox treated Wt + and Tg + animals. The results were obtained from two independent experiments utilizing four biological replicates. Error bars represent mean ±SEM.
Figure 6—figure supplement 3
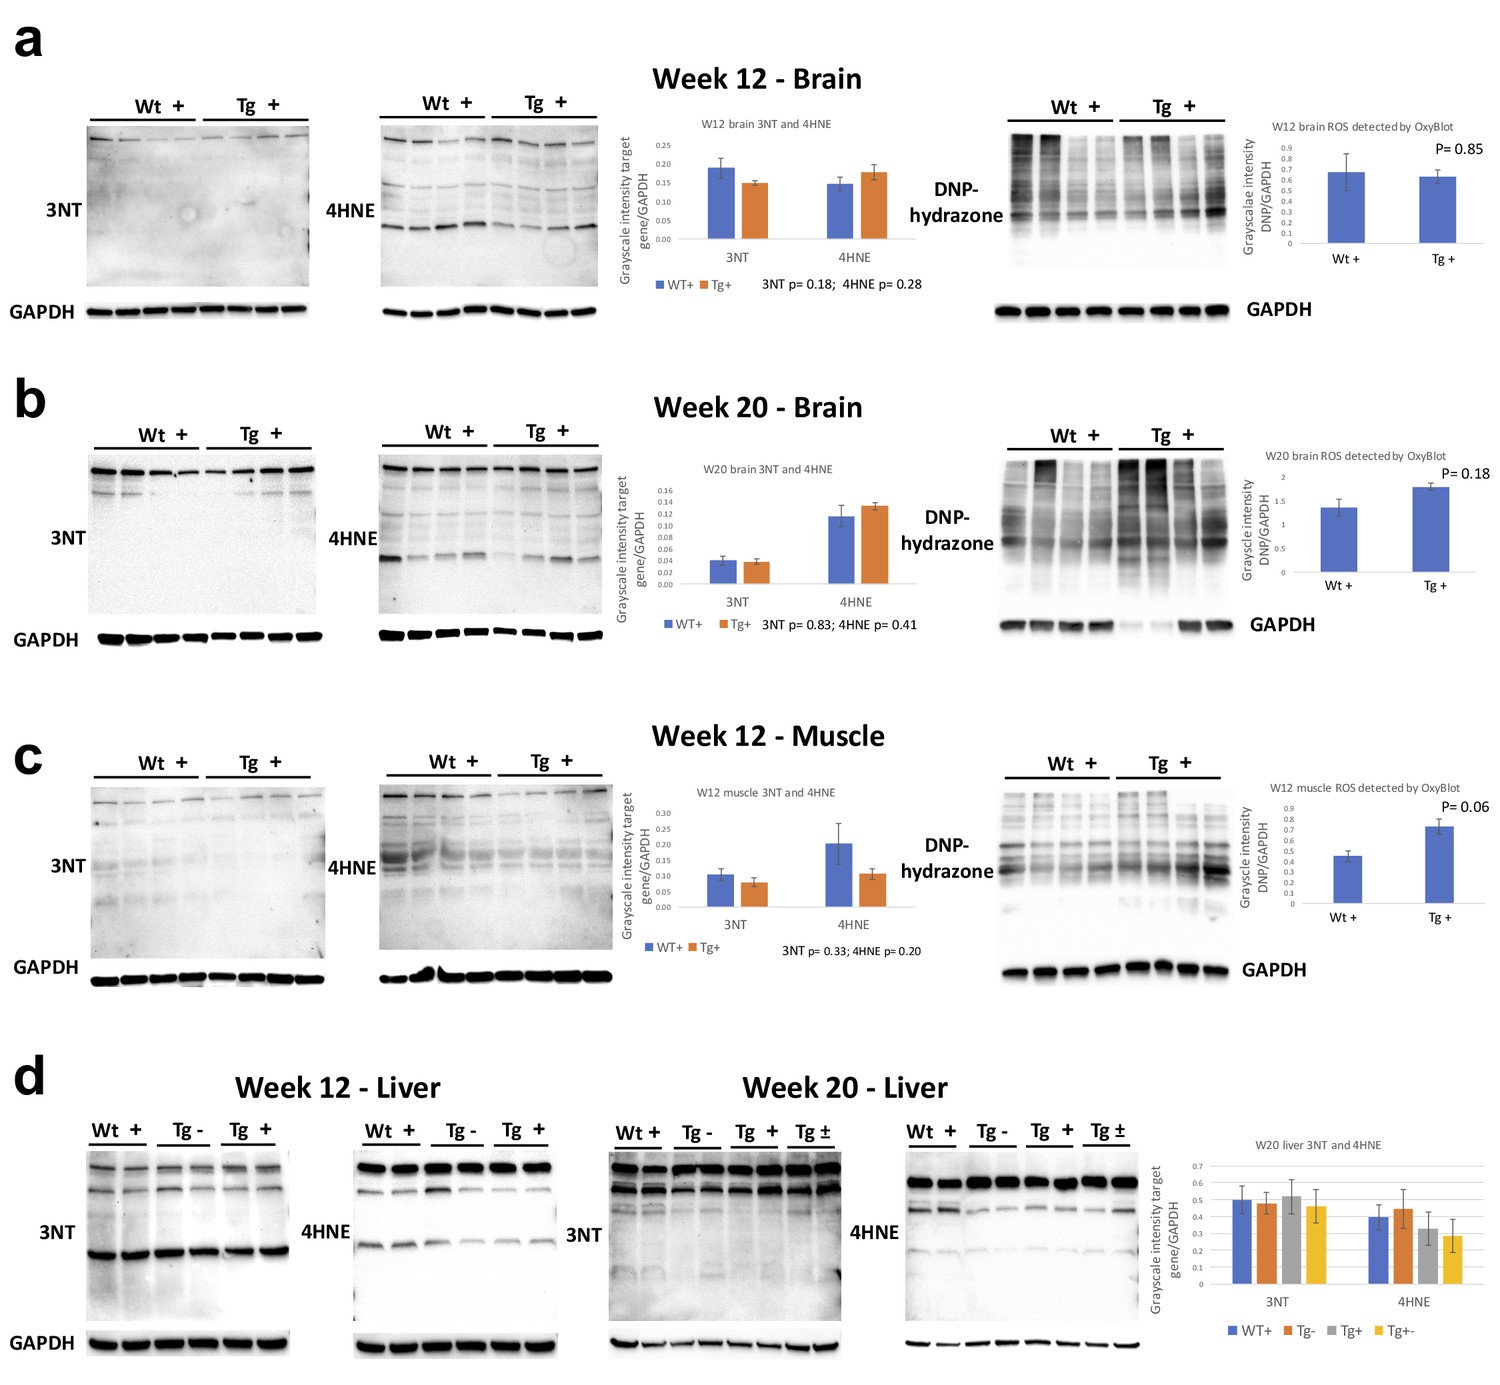
Quantification of reactive oxygen species (ROS) levels in Fxn knockdown animals.
Relative levels of 3-nitrotyrosine (3NT) or 4-hydroxy-2-nonenal (4-HNE) or 2,4-dinitrophenylhydrazone (DNP hydrazone) in transgenic (Tg +) and control (Wt +) animals treated with doxycycline. DNP-hydrazone was measured using Oxyblot protein oxidation detection kit. Western blot analyses of eight animals (4 Tg+ and 4 Wt+) from brain lysates after Fxn knockdown for (a) 12 weeks and (b) 20 weeks are shown. (c) Muscle samples at 12 weeks post Fxn knockdown showing levels of 3NT, 4-HNE and DNP-hydrazone. (d) Western blot (3NT, 4-HNE) of liver samples after 12 weeks and 20 weeks post Fxn knockdown. For quantification, marker values were normalized to the level of GAPDH in each lane. Error bars represent mean ±SEM.
Figure 7 with 6 supplements
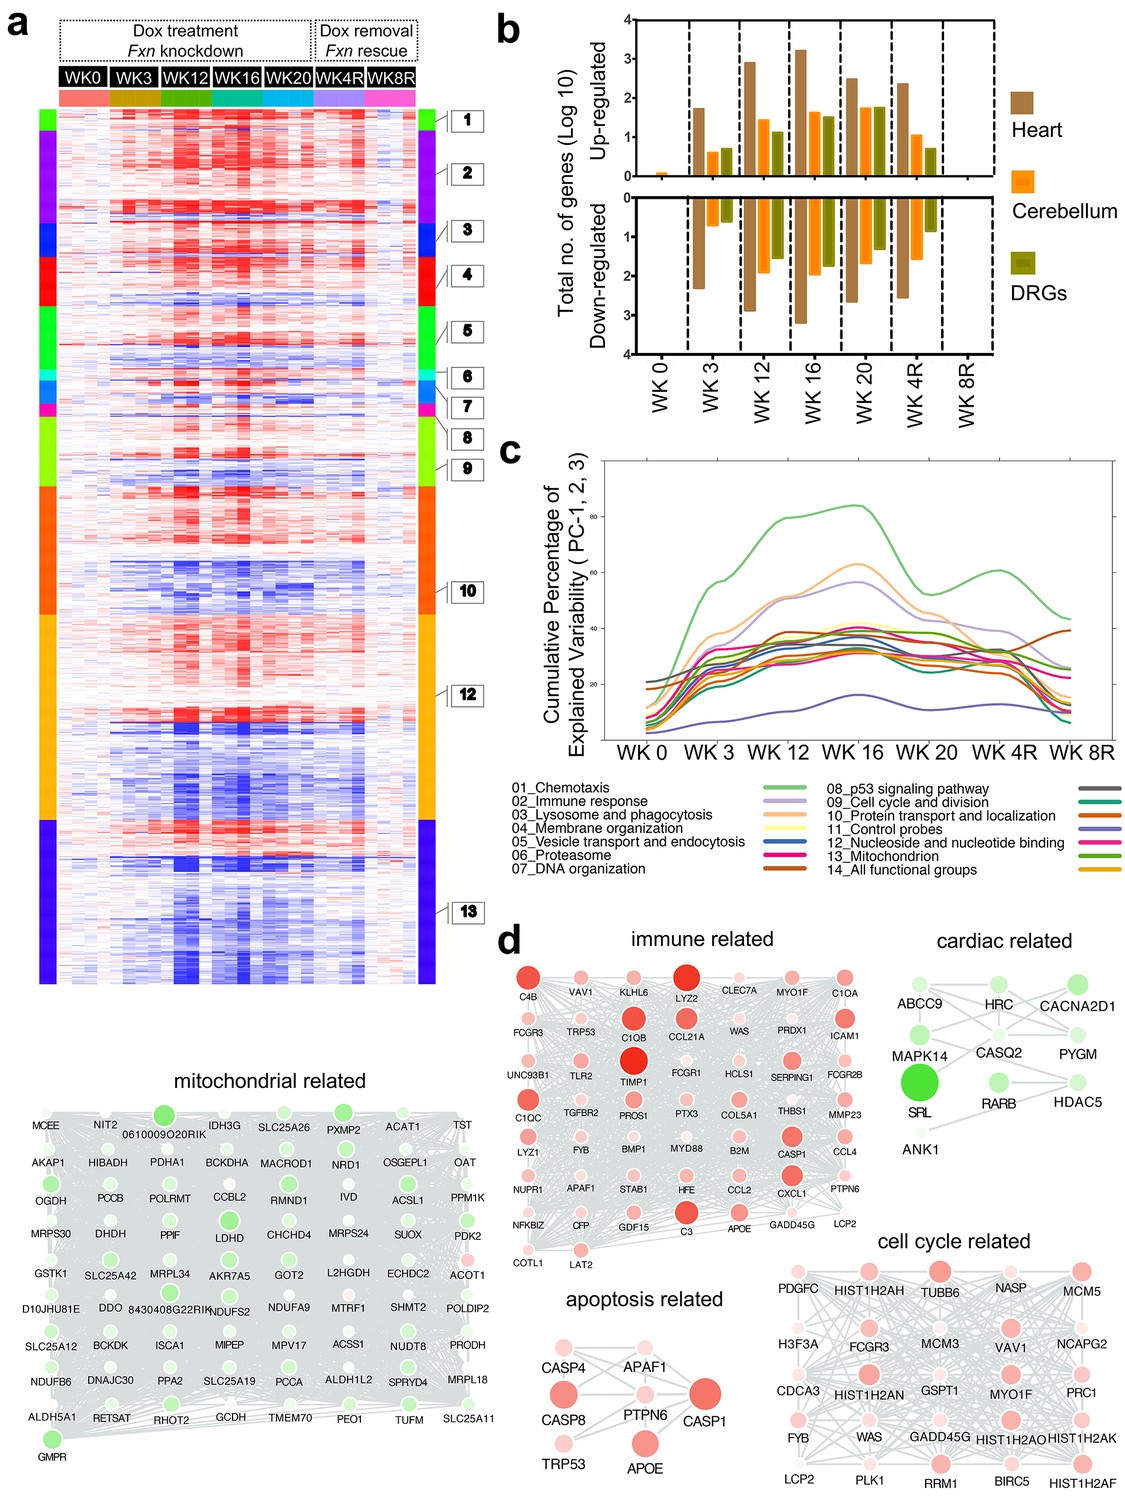
Gene expression analysis of frataxin knockdown mice.
(a) Heat map of significantly up- and down-regulated genes (rows) in heart tissue of Tg + mice from 0, 3, 12, 16, 20 and plus 4, 8 weeks post dox treatment relative to controls are grouped into 13 functional categories. (b) Summary of differentially expressed genes during Fxn knockdown and rescue in heart, cerebellum and DRG tissues from four biological replicates. (c) Cumulative percent of variability in Tg + gene expression data explained by the first three principal component for each functional category. (d) Networks highlighting differentially expressed genes due to Fxn knockdown in Tg + mice for selected functional categories. Nodes represents genes and edges are present between nodes when their gene expression correlation is greater than 0.5. Mouse gene names are displayed in upper case for clarity purpose. Node size and color (red = up regulation and green = down regulation) denotes extent of differential expression.
-
Figure 7—source data 1
This spreadsheet contains the number of genes differentially expressed in the microarray data from heart, cerebellum and DRGs after frataxin knockdown in FRDAkd and control animals (Figure 7b) and the cumulative percent of variability data from PCA analyses is also provided which was used to generate the graph shown in Figure 7c.
- https://doi.org/10.7554/eLife.30054.030
Figure 7—figure supplement 1

Chemokine signaling pathway is altered in frataxin knockdown mice.
Gene expression differences in chemokine signaling pathway from mice with frataxin knockdown and rescue is shown. Heatmap showing differentially expressed genes (relative log two fold change) in chemokine signaling pathway (KEGG: mmu04062) from heart, cerebellum and DRGs tissue of Tg + mice at 0, 3, 12, 16, 20 and plus 4, 8 weeks post dox treatment relative to controls.
Figure 7—figure supplement 2
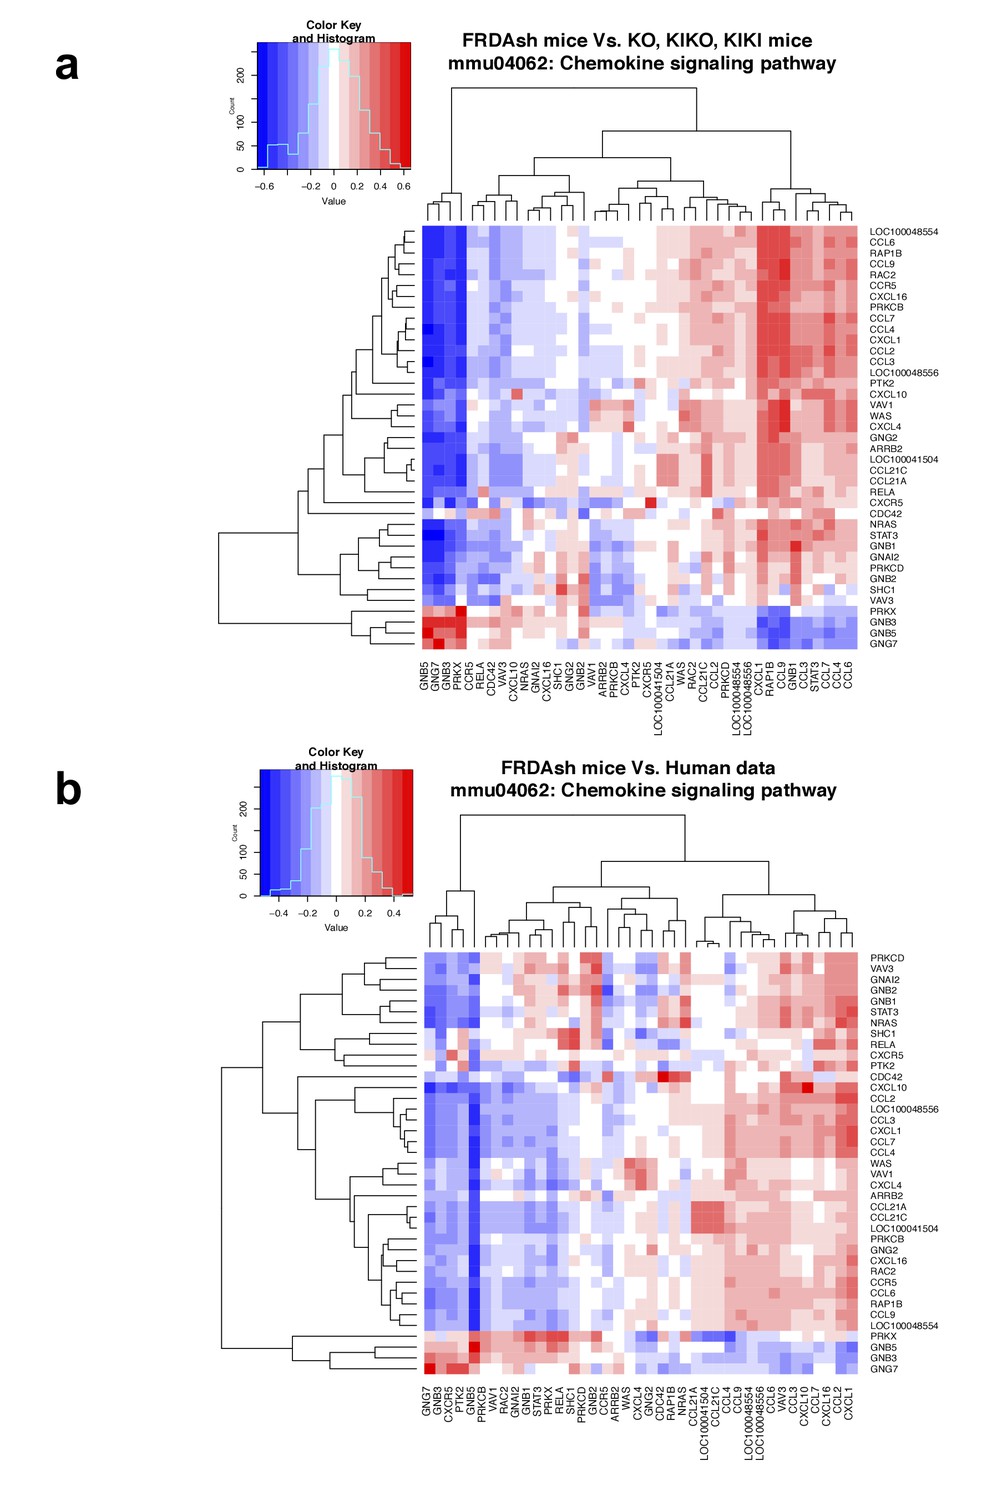
Chemokine signaling pathway is altered in FRDA patients and mouse models.
(a–b) Correlation heatmap between gene expression levels (in fold induction over controls) of FRDA knockdown mice and other mouse models (a) and FRDA patients (b) in chemokine signaling pathway genes. Positive correlations are marked in red and negative ones in blue (see legend).
Figure 7—figure supplement 3
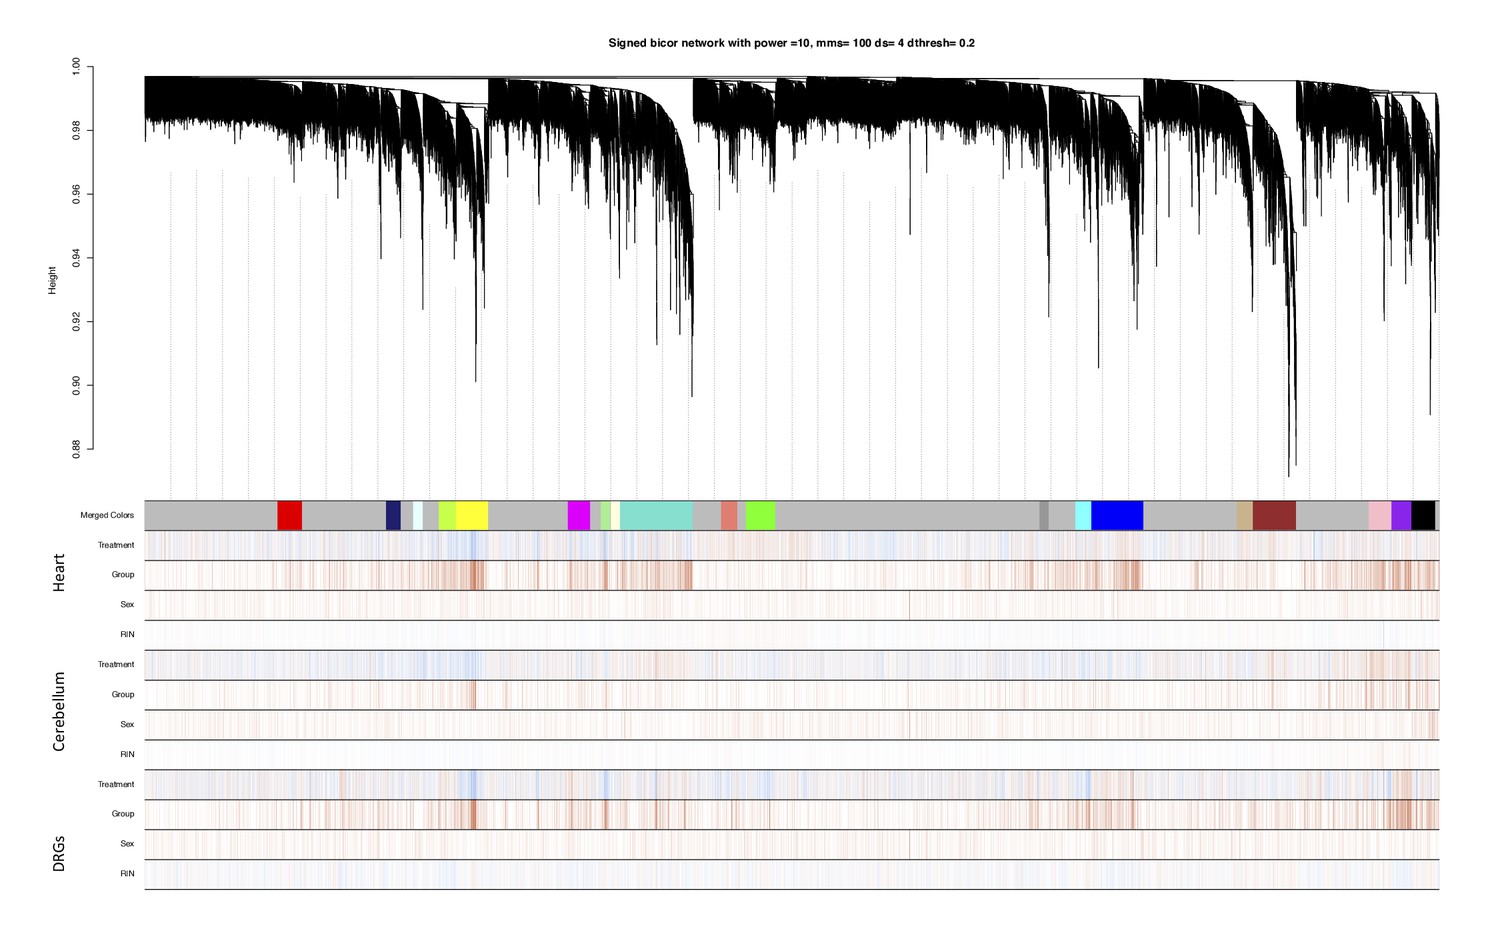
Identification of frataxin knockdown specific modules using WGCNA.
In the hierarchical dendrogram, lower branches correspond to higher co-expression. The y-axis corresponds to distance determined by the extent of topological overlap. Dynamic tree cutting identified highly consensus modules across all three tissue, generally dividing them at significant branch points in the dendrogram. The 19 identified modules were coded by the colors indicated below the dendrogram. Genes not assigned to a module are labeled gray. Below, red and blue lines indicate positive or negative correlations, respectively, with treatment type (dox or no-dox), group (time points after dox), sex (male or female) and RNA Integrity Number (RIN) number.
Figure 7—figure supplement 4
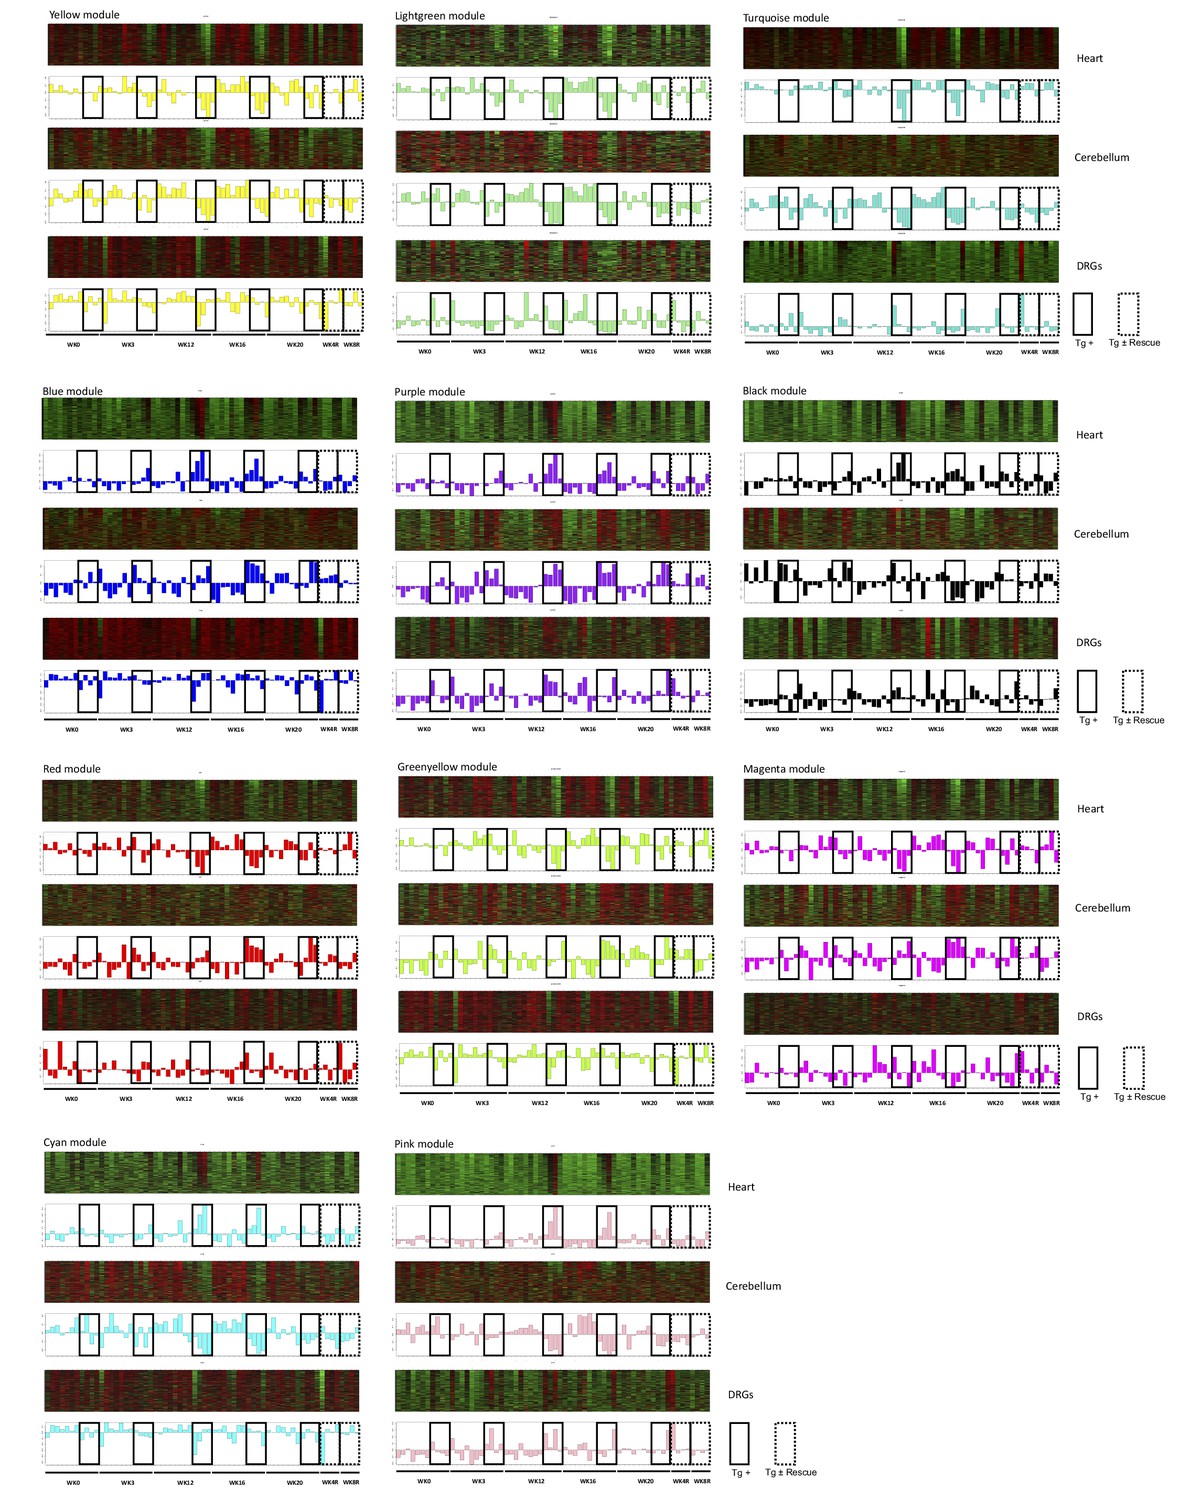
WGCNA identifies consensus co-expression modules associated with frataxin knockdown and rescue.
Heatmaps depicting expression of genes (rows) across samples (columns) for 11 modules (red corresponds to gene up-regulation and green to down- regulation) in three tissues (heart, cerebellum and DRGs). First principal component of gene expression is shown as a bar-plot. Samples are ordered by time points: 0, 3, 12, 16, 20 and plus 4, 8 weeks post doxycycline treatment for all genotype tested. In bar-plots, Tg + samples and rescue samples are highlighted for all time points.
Figure 7—figure supplement 5
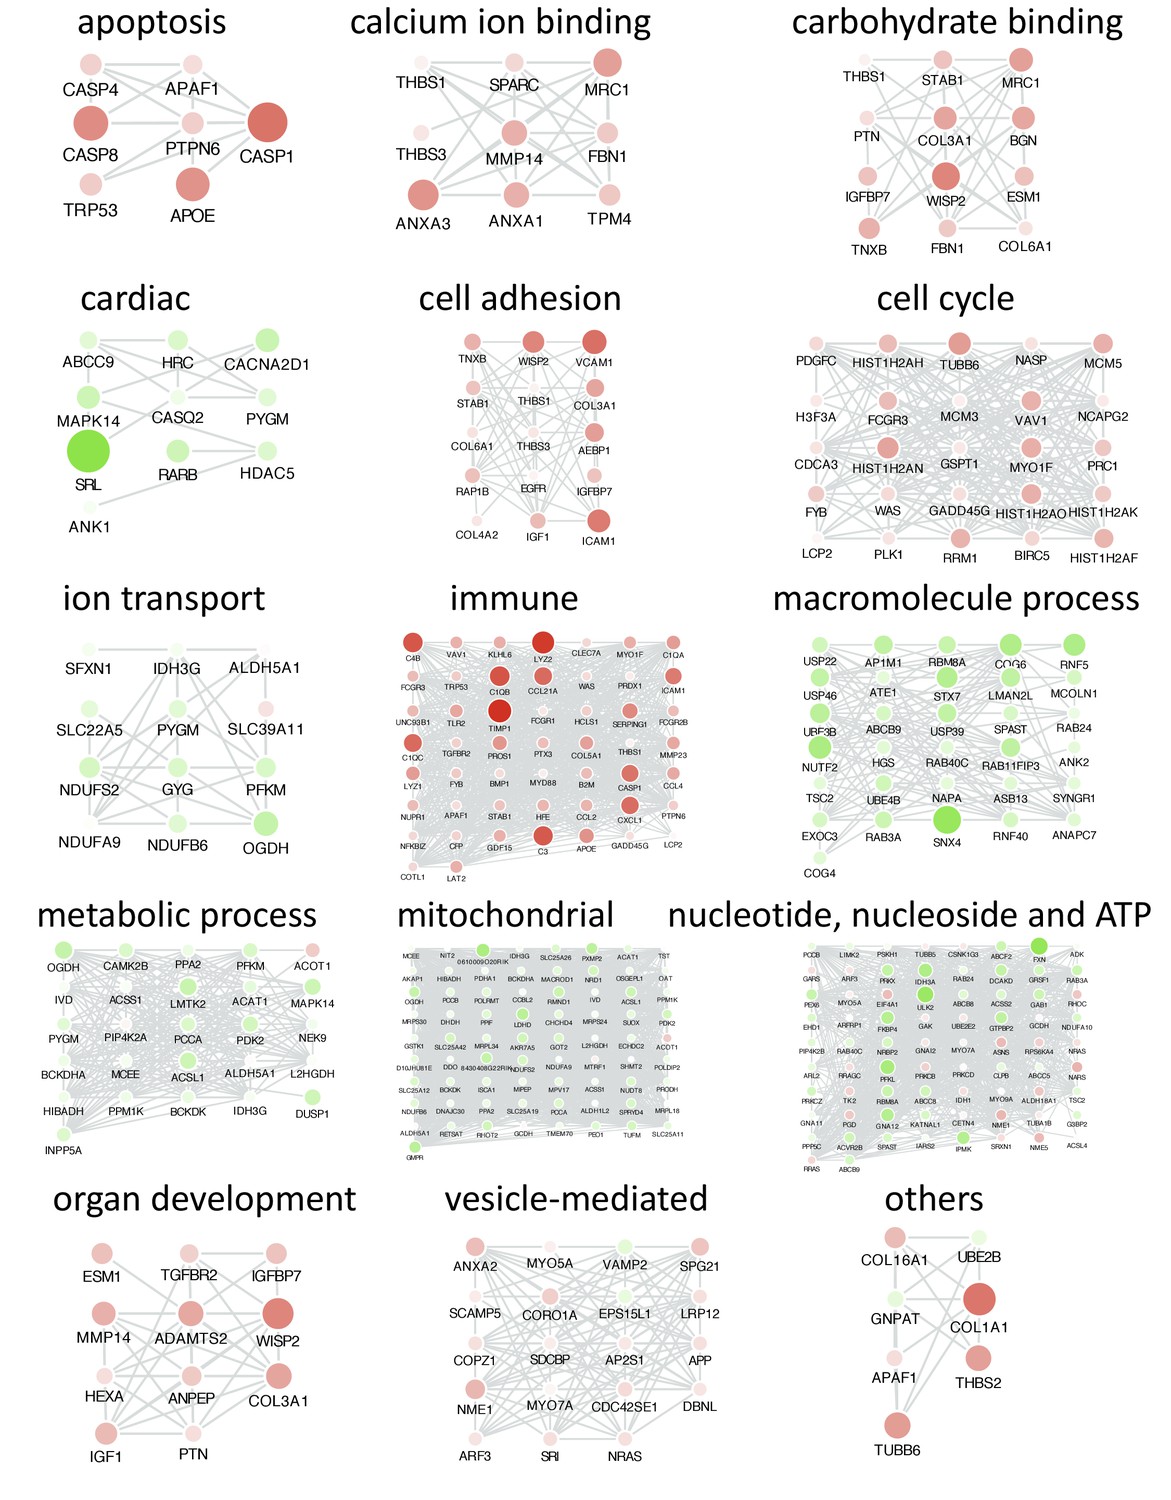
Co-expression analyses reveals functional categories associated with frataxin knockdown and rescue.
Networks highlighting differentially expressed genes due to Fxn knockdown in Tg + mice for selected functional categories. Differentially expressed genes that are co-expressed within each functional category are shown. Nodes represents genes and edges are present between nodes when their gene expression correlation is greater than 0.5. Gene names are displayed in upper case for clarity purpose. Node size and color (red = up regulation and green = down regulation) denotes extent of differential expression.
Figure 7—figure supplement 6
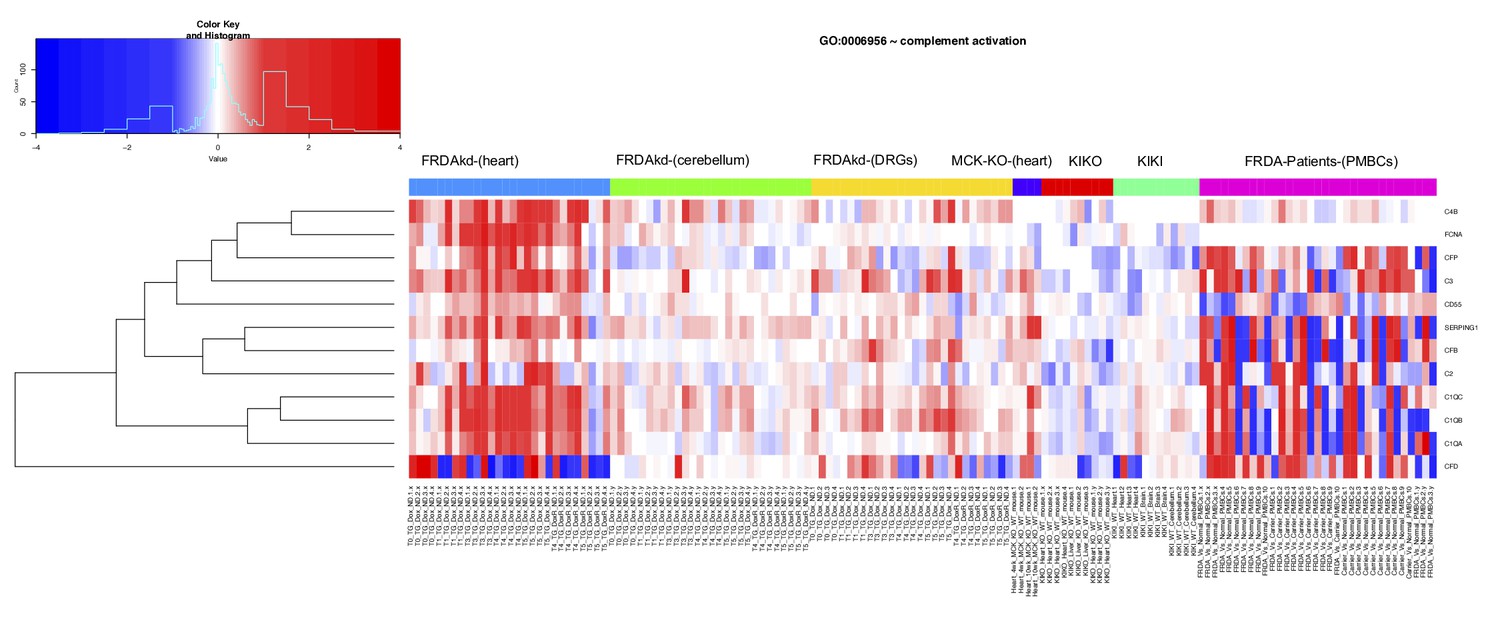
Frataxin knockdown alters complement activation pathway genes in adult mice.
Heat map depicting expression of complement activation pathway (GO: 0006956) genes (rows) across seven independent datasets (columns) obtained from, FRDAsh mice, cardiac specific knockout mice, knock-in knockout mice, knock-in mice and patient peripheral blood mononuclear cells (red corresponds to gene up-regulation and blue to down- regulation).
Figure 8 with 1 supplement
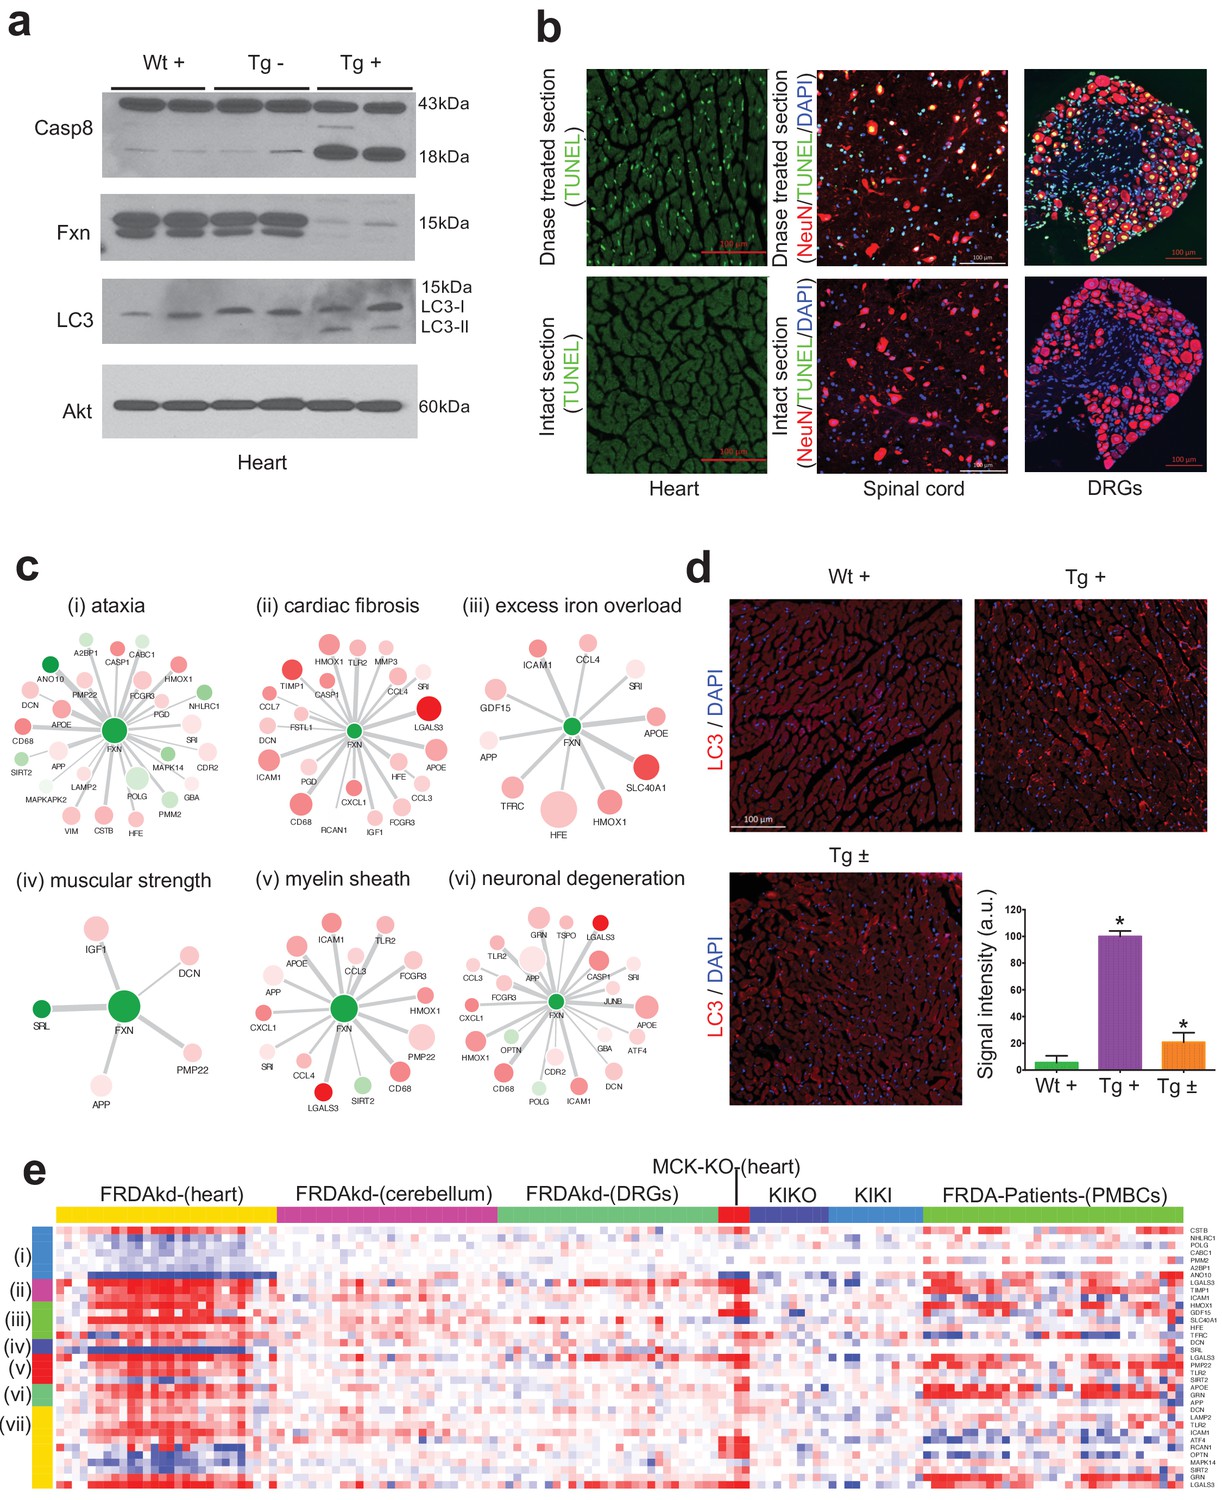
Gene expression candidate biomarkers in frataxin knockdown mice.
(a) Western blot analyses of Caspase 8, FXN and LC3 following 20 weeks with or without dox treatment in heart. (b) TUNEL assay of heart, spinal cord and DRG neurons at 20 weeks after dox treatment in Tg + mice. (c) Literature associated gene networks highlighting differentially expressed genes due to Fxn knockdown in Tg + mice for selected key-terms. Nodes represents genes which has pairwise correlation greater than 0.5 with Fxn gene and edge size represents strength of their gene expression correlation. Node size correspond to number of PubMed hits with co-occurrence of gene and its corresponding key-term. Node color represents up-regulated (red) and down-regulated (green). Gene names are displayed in upper case for clarity purpose. (d) Representative images and quantification of LC3 staining in heart tissue at 20 weeks after dox treatment. Values represent mean from three biological replicates per group ±SME. One-way ANOVA test *=P ≤ 0.05. (e) Heat map depicting expression of key genes (rows) across samples (columns) for seven groups (red corresponds to gene up-regulation and blue to down-regulation). The seven groups represents: (i) ataxia, (ii) cardiac fibrosis, (iii) excess iron overload, (iv) muscular strength, (v) myelin sheath, (vi) neuronal degeneration and (vii) autophagy related genes. The column represents seven independent datasets obtained from, FRDAsh mice, cardiac specific knockout mice (Puccio et al., 2001), knock-in knockout mice (Miranda et al., 2002), knock-in mice (Miranda et al., 2002) and patient peripheral blood mononuclear cells (Coppola et al., 2011).
-
Figure 8—source data 1
This spreadsheet contains the raw signal intensity quantification data of LC3 staining which was used to generate the graph shown in Figure 8d.
- https://doi.org/10.7554/eLife.30054.033
Figure 8—figure supplement 1
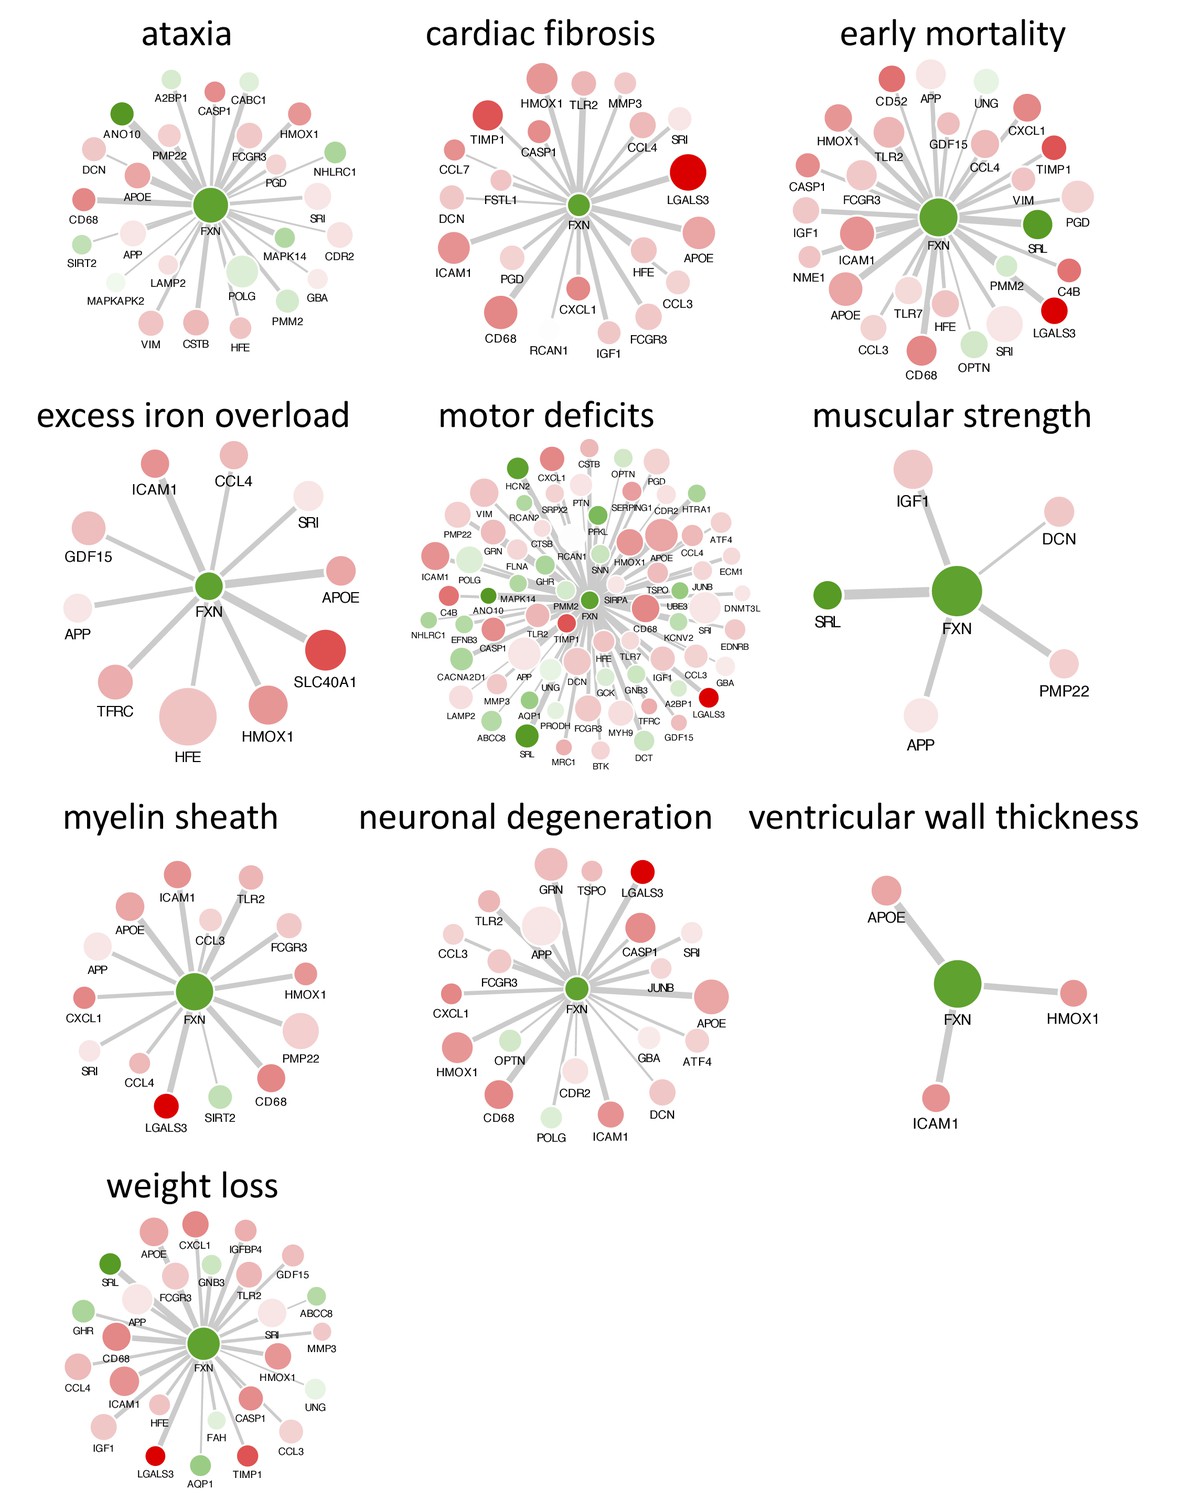
Literature mining identifies genes associated with frataxin knockdown and observed phenotype in FRDAkd mice.
Networks highlighting differentially expressed genes due to Fxn knockdown in Tg + mice which are associated with corresponding keywords in the PubMed database based on co-occurrence-based text-mining are shown. Differentially expressed genes that are associated with each keywords within each category are shown. Nodes correspond to genes and edges to significant correlation with Fxn gene. Gene names are displayed in upper case for clarity purpose. Thicker edges represent stronger correlation with Fxn gene expression levels in FRDAkd mice samples. Node color (red = up regulation and green = down regulation) denotes extent of differential expression. Larger nodes correspond to number of PubMed hits with co-occurrence of gene and keyword.
Tables
Key resources table
| Reagent type (species) or resource | Designation | Source or reference | Identifiers | Additional information |
|---|---|---|---|---|
| strain, strain background (M. musculus) | FRDAkd mice (in C57BL/6 background) | this paper | Frataxin knockdown mice | |
| strain, strain background (M. musculus) | C57BL/6J | The Jackson Lab | RRID:IMSR_JAX:000664 | |
| cell line (M. musculus) | Neuro-2a cell lines (ATCC CCL-131) | ATCC | ATCC CCL-131; RRID:CVCL_0470 | |
| cell line (M. musculus) | LW-4 (129SvEv) embryonic stem cells | UCLA Transgenic Core facility | ES cell generated at UCLA from 129SvEv mice | |
| chemical compound, drug | Doxycycline (Dox) | Sigma | D9891-100G | Doxycycline hyclate |
| commercial assay or kit | Bradford assay | Bio-Rad | 500–0006 | Bio-Rad Protein Assay Dye Reagent Concentrate |
| commercial assay or kit | Aconitase assay kit | Cayman Chemical | 705502 | |
| commercial assay or kit | Citrate synthase assay kit | Sigma | CS0720 | |
| commercial assay or kit | RNA extraction kit | Qiagen | 217004 | miRNeasy mini kit |
| commercial assay or kit | RNA reverse transcription kit | ThermoFisher Scientific | 18091050 | SuperScript IV First-Strand Synthesis System |
| commercial assay or kit | TUNEL assay | Roche | 11767291910 | in Situ Cell Death Detection Kit, Fluorescein |
| commercial assay or kit | OxyBlot assay | Millipore | S7150 | OxyBlot Protein Oxidation Detection Kit |
| antibody | anti-ferroportin-1 | LifeSpan BioSciences | LS-B1836 RRID:AB_2254938 | Rabbit, 1:200 |
| antibody | anti-ferritin | Abcam | ab69090 RRID:AB_1523609 | Rabbit, 1:500 |
| antibody | anti-LC3 | Abgent | AM1800a RRID:AB_2137696 | Mouse, 1:200 |
| antibody | anti-NeuN | EMD Millipore | ABN91 RRID:AB_11205760 | Chicken, 1:500 |
| antibody | anti-NeuN | EMD Millipore | ABN78 RRID:AB_10807945 | Rabbit, 1:500 |
| antibody | Alexa Fluor 488 | ThermoFisher Scientific | A-11008 RRID:AB_143165 | Goat anti-rabbit IgG, 1:500 |
| antibody | Alexa Fluor 594 | ThermoFisher Scientific | A-11039 RRID:AB_142924 | Goat anti-chicken IgG, 1:500 |
| antibody | Alexa Fluor 488 | ThermoFisher Scientific | A-11029 RRID:AB_138404 | Goat anti-mouse IgG, 1:500) |
| antibody | anti-Frataxin | Santa Cruz biotechnology | sc-25820 RRID:AB_2110677 | Rabbit, 1:200 |
| antibody | anti-Akt | Cell Signaling Technology | 4691 RRID:AB_915783 | Rabbit, 1:500 |
| antibody | anti-Caspase 8 | Cell Signaling Technology | 8592S RRID:AB_10891784 | Rabbit, 1:200 |
| antibody | Anti-b-Actin | Sigma-Aldrich | A1978 RRID:AB_476692 | Mouse, 1:1000 |
| antibody | Anti-4-Hydroxynonenal | Abcam | ab46545 RRID:AB_722490 | Rabbit, 1:3000 |
| antibody | Anti-4-Nitrotyrosine | Abcam | ab61392 RRID:AB_942087 | Mouse, 1:3000 |
| antibody | Anti-phospho-PDK1 | Cell Signaling Technology | 3438S RRID:AB_2161134 | Rabbit, 1:1000 |
| antibody | Goat-anti-rabbit HRP-conjugated secondary antibody | ThermoFisher Scientific | 31460 RRID:AB_228341 | 1:5000 |
| antibody | Goat-anti-mouse HRP-conjugated secondary antibody | ThermoFisher Scientific | 32230 RRID:AB_1965958 | 1:5000 |
| software, algorithm | ImageJ | https://imagej.nih.gov/ij/ | RRID:SCR_003070 | |
| software, algorithm | BLASTN | https://blast.ncbi.nlm.nih.go | RRID:SCR_001598 | |
| software, algorithm | TopScan | http://cleversysinc.com/?csi_products=topscan-lite | RRID:SCR_014494 | |
| software, algorithm | ImageScope | http://www.aperio.com/ | RRID:SCR_014311 | |
| software, algorithm | CellProfiler Analyst | http://cellprofiler.org | RRID:SCR_010649 | |
| software, algorithm | LIMMA | http://bioinf.wehi.edu.au/limma/ | RRID:SCR_010943 | |
| software, algorithm | WGCNA | http://www.genetics.ucla.edu/labs/horvath/CoexpressionNetwork/ | RRID:SCR_003302 | Weighted Gene Co-expression Network Analysis |
| software, algorithm | DAVID tools | http://david.abcc.ncifcrf.gov/ | RRID:SCR_003033 | Database for Annotation Visualization and Integrated Discovery |
| software, algorithm | PubMatrix | http://pubmatrix.grc.nia.nih.gov/ | RRID:SCR_008236 | |
| software, algorithm | AccessPoint | http://freelandsystems.com/accesspoint-suite/accesspoint/ | RRID:SCR_015792 | |
| software, algorithm | NOTOCORD-hem | http://www.notocord.com/software/notocord_hem | RRID:SCR_015793 |
Additional files
-
Supplementary file 1
Differentially expressed genes after frataxin knockdown and rescue.
Genes with a significant differential expression in frataxin knockdown mice versus control in heart, cerebellum and DRG tissues are provided.
- https://doi.org/10.7554/eLife.30054.034
-
Supplementary file 2
Gene ontology analysis of the genes that are differentially regulated in frataxin knockdown mice.
DAVID analysis software was used to find the Gene Ontology (GO) terms that were significantly enriched (Benjamini corrected p-value<0.05) in differentially regulated genes from FRDAkd mice when compared to the controls.
- https://doi.org/10.7554/eLife.30054.035
-
Supplementary file 3
Gene-module membership association based on WGCNA co-expression networks.
Twenty consensus modules shared between the three tissues (heart, cerebellum and DRGs) obtained from FRDAkd mice expression data are denoted along with genes in these modules and kME values (Intramodular connectivity).
- https://doi.org/10.7554/eLife.30054.036
-
Supplementary file 4
Gene ontology analysis of frataxin knockdown and rescue associated modules.
For categorization and clustering of GO terms, we considered GO terms with Benjamini-corrected P-values less than 0.05. Enriched GO terms are provided for each module in separate tabs.
- https://doi.org/10.7554/eLife.30054.037
-
Supplementary file 5
Broad functional categories of combined GO ontology terms associated with frataxin knockdown and rescue.
The GO ontology terms (Supplementary file 4) which are enriched in the 11 modules were combined into 26 broad functional categories based on GO slim hierarchy are provided.
- https://doi.org/10.7554/eLife.30054.038
-
Supplementary file 6
Literature annotation of genes associated with the observed phenotype in FRDAkd mice.
Table providing differentially expressed gene’s association with observed phenotype in FRDAkd mice based on the published literature by testing association with the key-words: ataxia, cardiac fibrosis, early mortality, enlarged mitochondria, excess iron overload, motor deficits, muscular strength, myelin sheath, neuronal degeneration, sarcomeres, ventricular wall thickness, and weight loss in the PubMed database for every gene. The total number of hits (publications) for each gene are represented.
- https://doi.org/10.7554/eLife.30054.039
-
Transparent reporting form
- https://doi.org/10.7554/eLife.30054.040
Download links
A two-part list of links to download the article, or parts of the article, in various formats.
Downloads (link to download the article as PDF)
Open citations (links to open the citations from this article in various online reference manager services)
Cite this article (links to download the citations from this article in formats compatible with various reference manager tools)
Inducible and reversible phenotypes in a novel mouse model of Friedreich’s Ataxia
eLife 6:e30054.
https://doi.org/10.7554/eLife.30054


