LINE-1 protein localization and functional dynamics during the cell cycle
- NYU Langone Health, United States
- The Rockefeller University, United States
Figures
Figure 1 with 4 supplements

L1 protein expression and localization (A) Representative pictures of immunostained HeLa M2 cells expressing a recoded L1 (ORFeus) or a non-recoded L1 (L1rp).
Antibody target names are reported atop the corresponding pictures and colored according to the colors used in the merged pictures. Scale bar = 100 μm. (B) Quantification of ORF1p and ORF2p expression in the cytoplasm and nucleus of HeLa cells expressing the indicated L1 element (error = S.E.M.) of at least 10 20X fields with about 100 cells each. The inset shows quantification of ORF2p stained using an anti-FLAG mouse antibody (SIGMA-M2 F1804). (C) Proximity analysis of cells with (purple) or without (yellow) nuclear ORF1p is reported. HeLa cells expressing Flag tagged ORFeus for 24 hr, were stained with anti-ORF1p JH74 Ab and DAPI. Pictures were collected using an Arrayscan microscope and analysis was performed as described in the Materials and Methods. ***p<0.001 (p=4.351e−13) (D) Immunostaining of ORF1p and ORF2p using, respectively, rabbit monoclonal Ab JH74 and mouse monoclonal antibody M2 against FLAG. Scale bar = 20 μm. White arrowheads indicate cells with nuclear ORF1p.
Figure 1—figure supplement 1
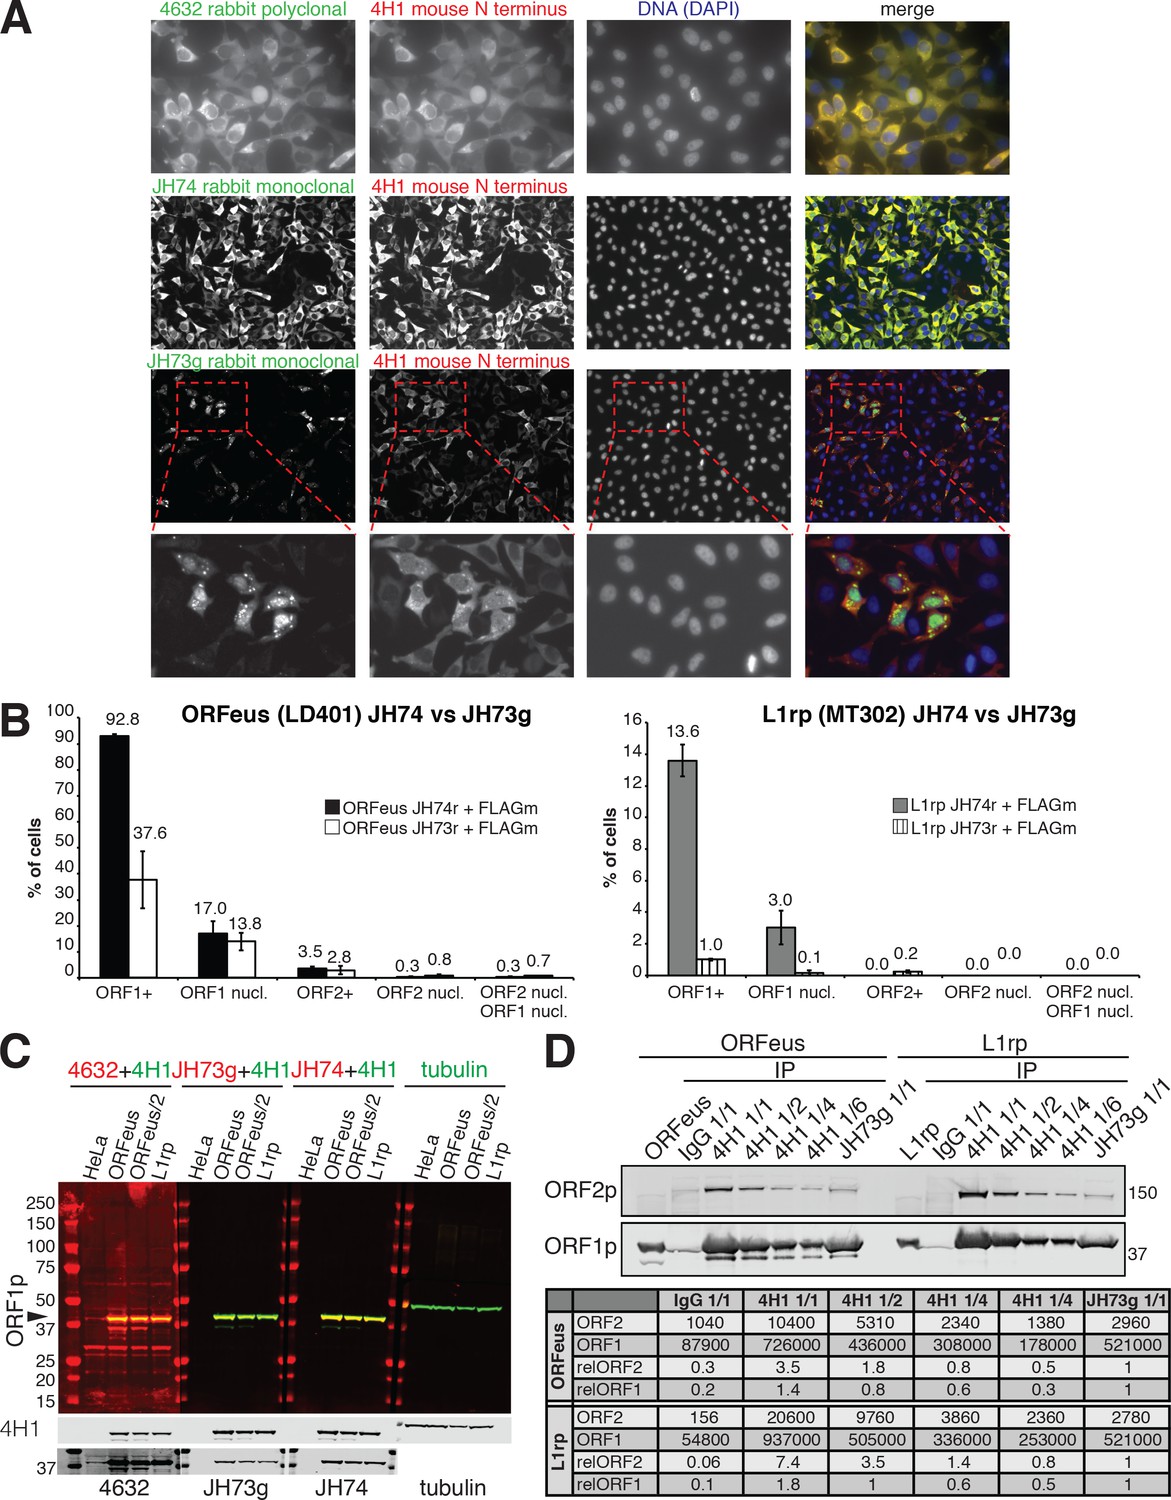
ORF1p antibody comparison.
(A) Comparison of immunofluorescence stainings using several antibodies against ORF1p and HeLa M2 cells expressing a recoded L1. 4H1 mouse antibody (red) was compared against co-staining of rabbit 4632, rabbit JH74, rabbit JH73g antibodies (all shown in green). DAPI staining (blue) was used to label the nucleus. The lower row of pictures shows a magnification of clustered cells expressing nuclear ORF1p and stained with 4H1 and JH73g antibody. (B) Quantification of nuclear and cytoplasmic ORF1p and ORF2p in HeLa cells expressing a recoded L1 (ORFeus) or a native L1 (L1rp) and stained with JH74 or JH73g antibodies in combination with mouse anti-FLAG M2 antibody. The error is expressed as S.E.M. calculated from at least 10 different fields (20X) containing at least 100 cells. (C) Western blot of HeLa M2 cells expressing ORFeus, L1rp or no L1 (HeLa) blotted with the indicated antibodies in combination with 4H1 always in green. The same blotting is presented in colors to better show the overlap of red (from rabbit Abs) and green (from mouse Abs) signal, and in gray scale to better show the single bands. Tubulin was used as loading control. 50 μg of protein were loaded in HeLa, ORFeus and L1rp lanes and 25 μg protein in the ORFeus/2 lanes. (D) Western blotting of ORF1p and ORF2p immunoprecipitated (IP) form lysates of HeLa cells expressing recoded (ORFeus/LD401) or native (L1rp/MT302) L1. Immunoprecipitation was conducted using IgG control, 4H1 or JH73g conjugated dynabeads. For IPs performed with 4H1 Ab several amounts of immunocomplexes were loaded on the gel: 1/1 = same amount loaded for IgG, 4H1 and JH73g IPs; ½=half of the 1/1 amount; ¼=one fourth of the 1/1 amount; 1/6 = one sixth of the 1/1 amount. Quantification of each band is reported as well as the relative quantification setting the intensity of JH73g IP band as 1.
Figure 1—figure supplement 2
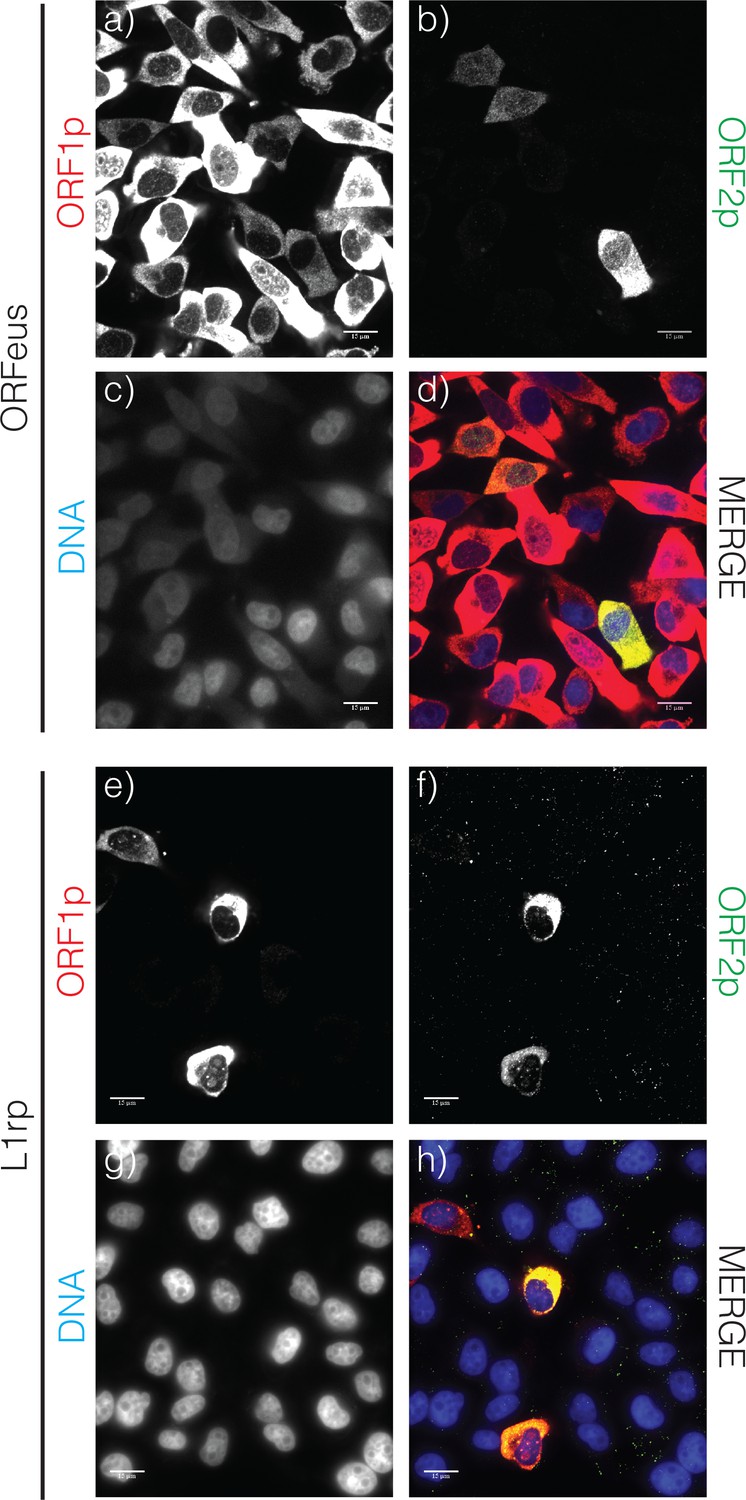
Confocal images of LINE-1 ORF1p and ORF2p.
HeLa-M2 cells expressing recoded L1/ORFeus (A–D) or L1rp (E–H) cultured for 24 hr in the presence of doxycycline 0.1 μg/ml. Cells expressing ORFeus are fixed with formalin and stained with 4H1 mouse anti-ORF1p (red) and rabbit anti-FLAG antibodies (green). Cells expressing L1rp are fixed and stained with JH74 rabbit anti-ORF1p (red) and mouse anti-FLAG-M2 (green). DNA is stained with Hoechst 33258. Complete Z-stack for the ORF1p and ORF2p images presented in this picture are shown in Supplemental item S4 (ORFeus) and S5 (L1rp).
Figure 1—figure supplement 3

Role of L1 5'UTR in ORF1p and ORF2p localization.
Quantification of nuclear and cytoplasmic ORF1p and ORF2p in HeLa M2 cells expressing the indicated recoded or non-recoded L1s with or without the 5’UTR. The percentage of cells is reported over each column bar. The error (standard error of the mean = s.e.m.) was calculated from at least 10 different fields (20X) containing at least 100 cells.
Figure 1—figure supplement 4
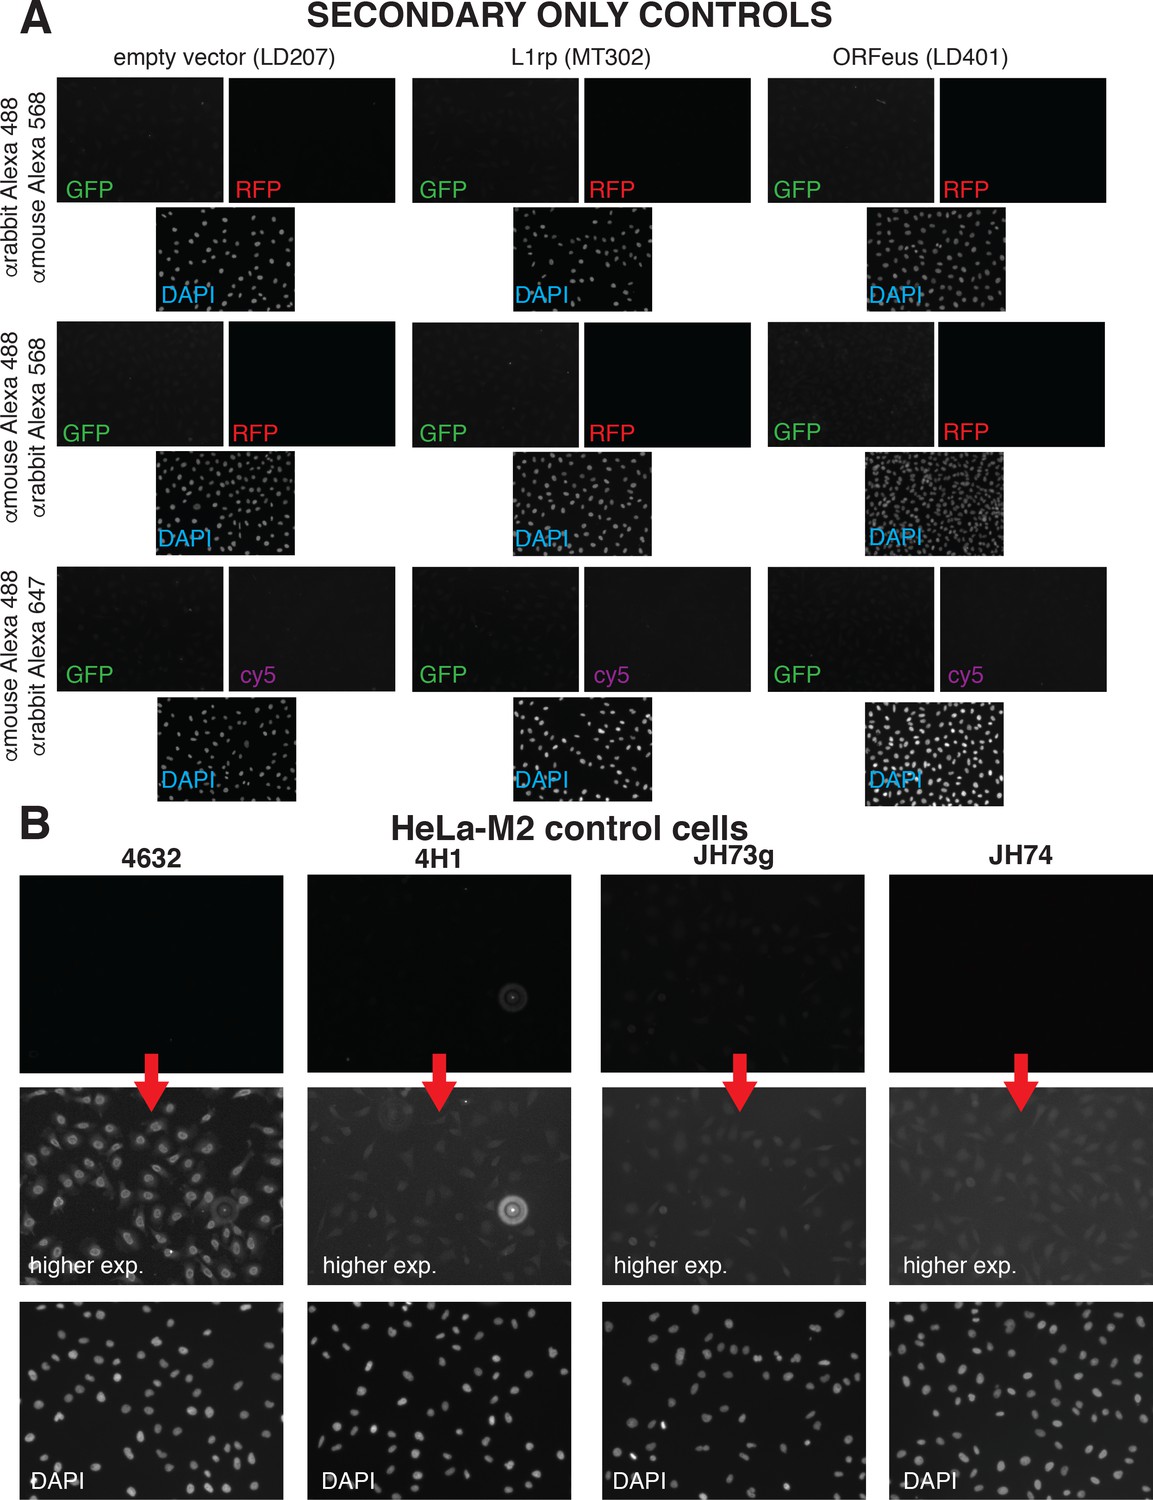
Negative controls for IF staining.
(A) HeLa-M2 cells transfected with empty pCEP-puro vector (LD207), L1rp (MT302) and ORFeus (LD401) were stained with secondary antibodies without incubation with primary antibodies. The secondary antibodies used are reported on the right end side of pane A. The EVOS-FL detection cubes used (GFP, RFP, DAPI) are reported in color on each corresponding picture. Pictures were taken using the same parameters (light, exposure, gain, brightness and contrast) used for the collection of pictures presented throughout the manuscript. (B) HeLa-M2 (not expressing L1) were used as negative control to observe the background signal of the antibodies against ORF1p used in this manuscript. The antibody used is reported on top of the pictures. A secondary antibody (anti-mouse or anti-rabbit depending on the primary antibody used) conjugated to Alexa 568 fluorophore were used. Images presented on the second row of the panel represent higher exposures of the top row (collected with the same parameters used throughout the manuscript) to show the higher nuclear background staining of the 4632 polyclonal rabbit antibody anti ORF1p. DAPI pictures are presented on the last row.
Figure 2 with 2 supplements
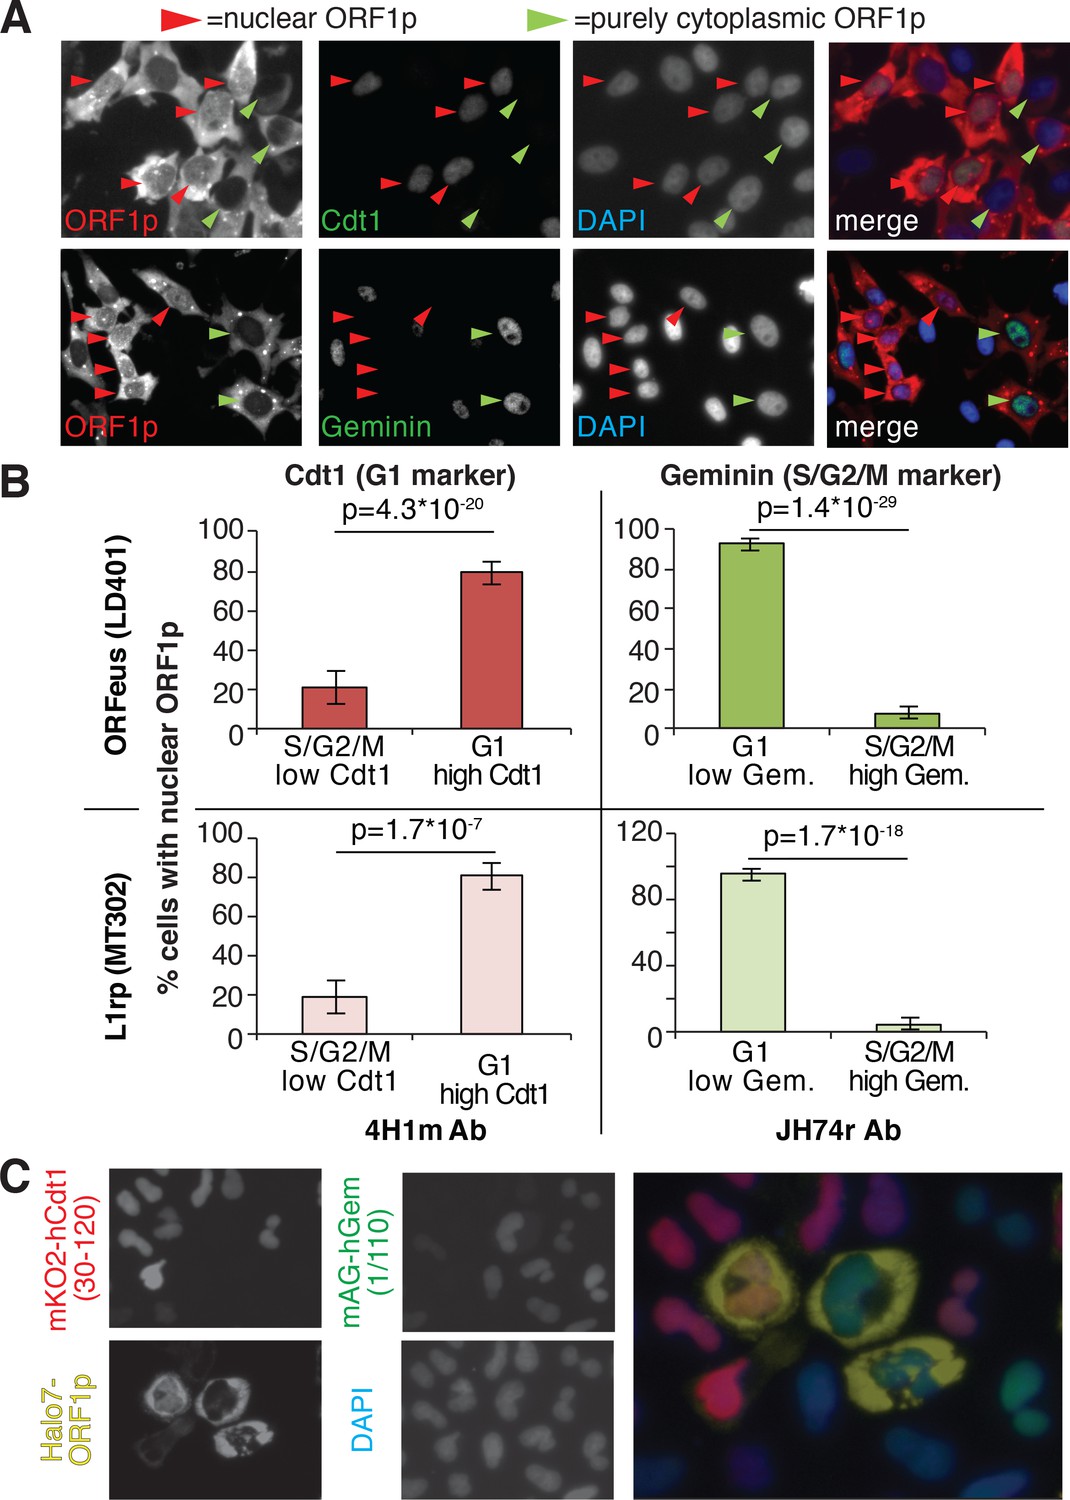
ORF1p localizes inside the nucleus immediately after mitosis.
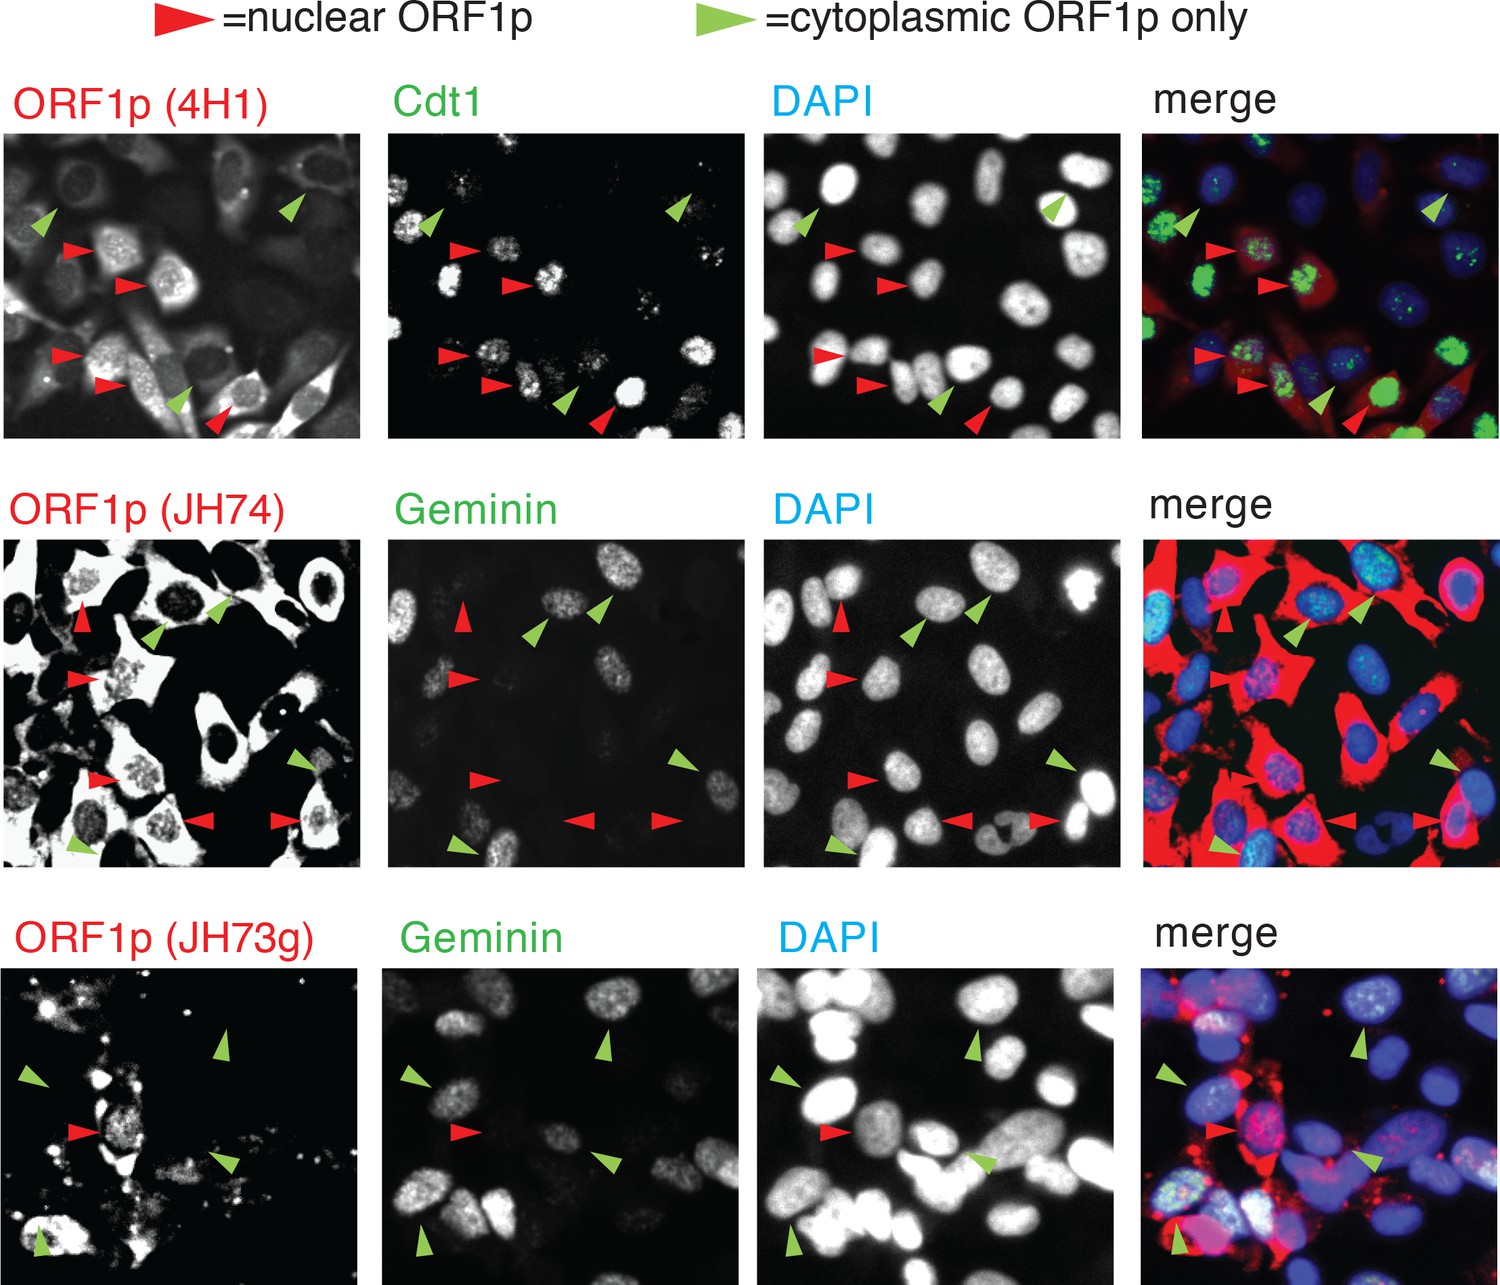
(A) Representative pictures of co-immunostaining of ORF1p with Cdt1 (marker of G1 phase) or geminin (marker of S/G2/M phase). DNA was stained with DAPI. Red arrowheads = cells with nuclear ORF1p, green arrowheads = cells without nuclear ORF1p. (B) Quantification of cells expressing nuclear ORF1p and Cdt1 (red, left top and bottom) or Geminin (green, right top or bottom). HeLa M2 cells expressing ORFeus (plasmid LD401) or L1rp (plasmid MT302) are shown in the two top or bottom panels respectively. The antibodies used for staining and quantification are indicated at the bottom of the graphs. (error = S.E.M.). (C) Representative pictures of live HeLa.S-FUCCI cell lines expressing rtTA and an inducible recoded L1 with ORF1p C-terminally tagged with an Halotag7 (Ohana et al., 2009). JF646 ligand (Grimm et al., 2015) was used to visualize ORF1-Halotag7. The proteins visualized are reported to left of images in colors used in the merged picture (right panel).
Figure 2—figure supplement 1
Confocal images of ORF1p, Cdt1/geneticin co-staining.
Similarly toFigure 2A, confocal images of HeLa cells expressing ORFeus were co-stained for ORF1p and Cdt1 or geminin markers. Three different antibodies were used to detect ORF1p (4H1, JH74 and JH73g). Green arrowheads indicate cells positive for geminin (cells in S/G2/M phase and with cytoplasmic ORF1p) and red arrowheads indicate cells positive for Cdt1 (cells in G1 phase and with clear nuclear ORF1p).
Figure 2—figure supplement 2
Expression and localization of Halo7-ORF2p in HeLa.S-FUCCI cells.
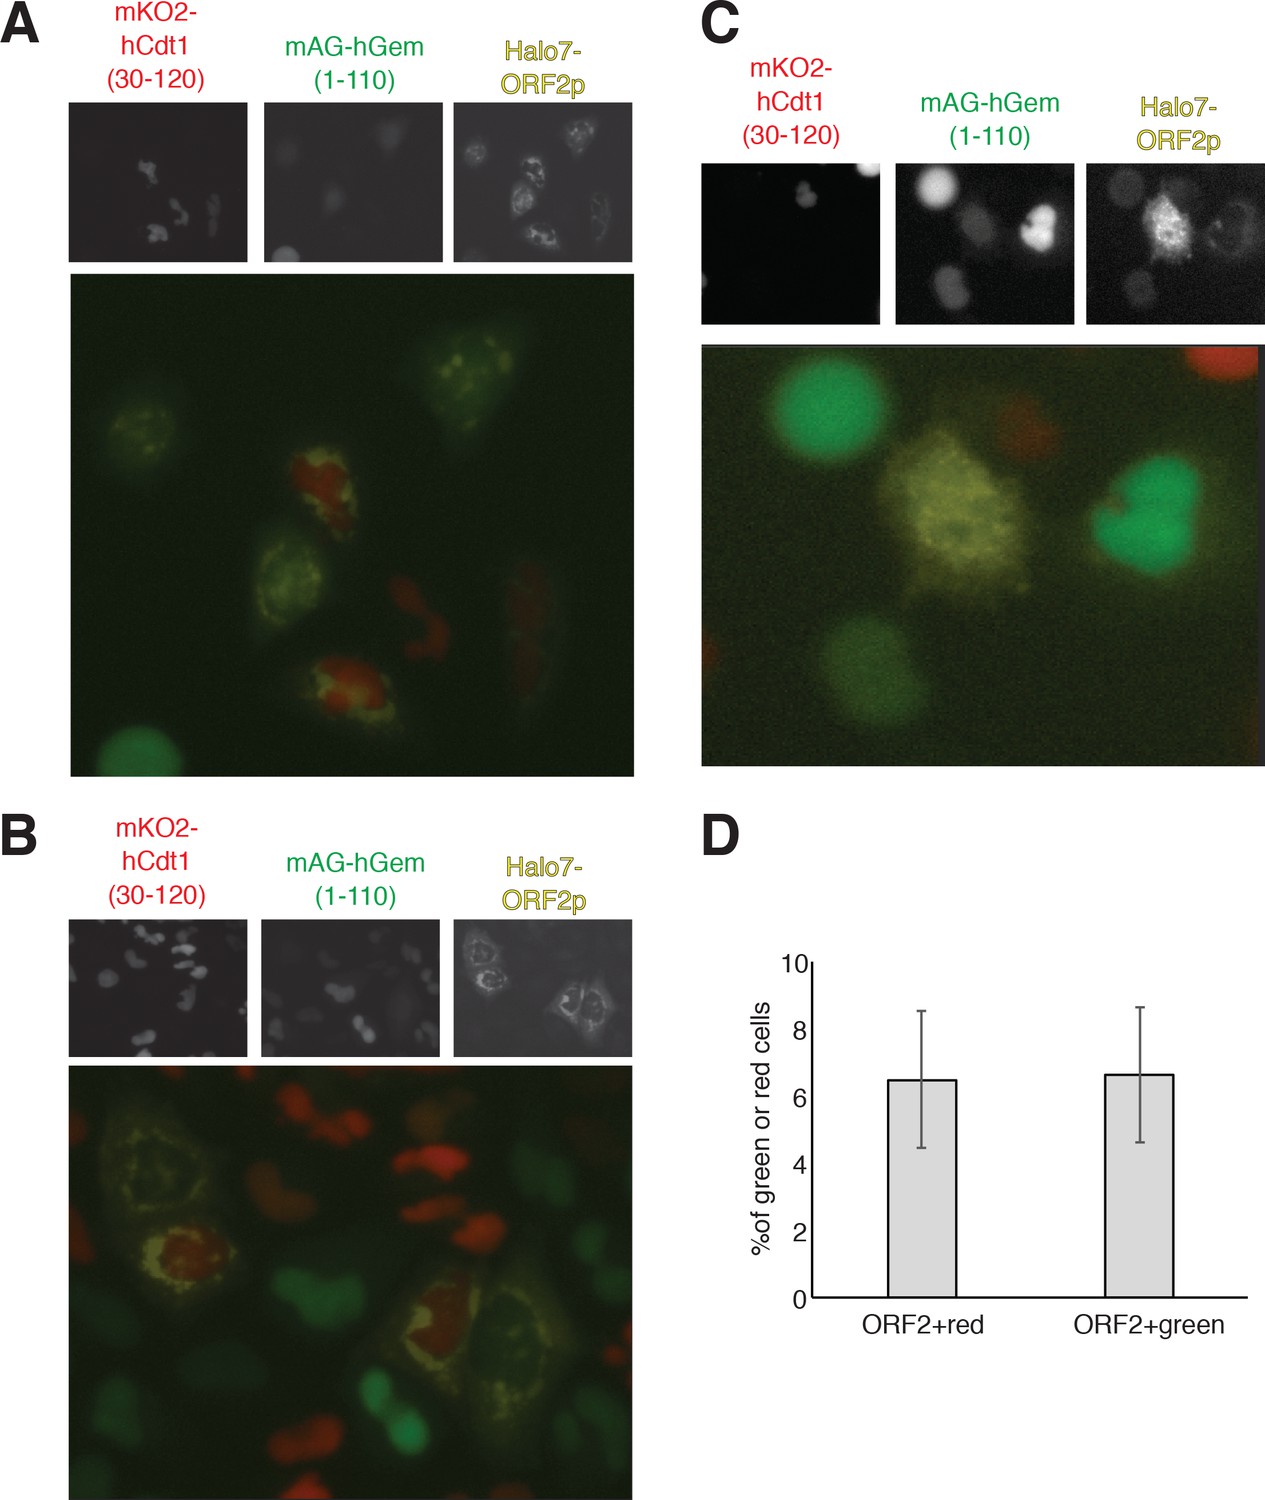
(A–B) Representative pictures of HeLa.S-Fucci expressing rtTA and recoded L1 with a Halotag7 on the C-terminus of ORF2p. The human Cdt1 fragment (30-120) conjugated to mKO2 (monomeric Kusabira orange 2), human geminin fragment (1-110) conjugated to mAG (monomeric mutant of the green fluorescent protein Azami-Green) and the Halotag7-ORF2 were visualized using GFP (green), RFP (red) and cy5 (yellow) filters. Halotag7 was visualized using JH646 dye. The single emissions and the merged color pictures are shown. An example of the cells with clear nuclear ORF2p is reported in (C). (D) quantification of cells expressing ORF2p (cytoplasmic or nuclear; ORF2+) and mKO2-hCdt1(30-120) (red) or mAG-hGem (1-110) (green) is reported. (error = S.D., n = 3).
Figure 3 with 2 supplements
Analysis of L1mRNA nuclear/cytoplasmic localization.
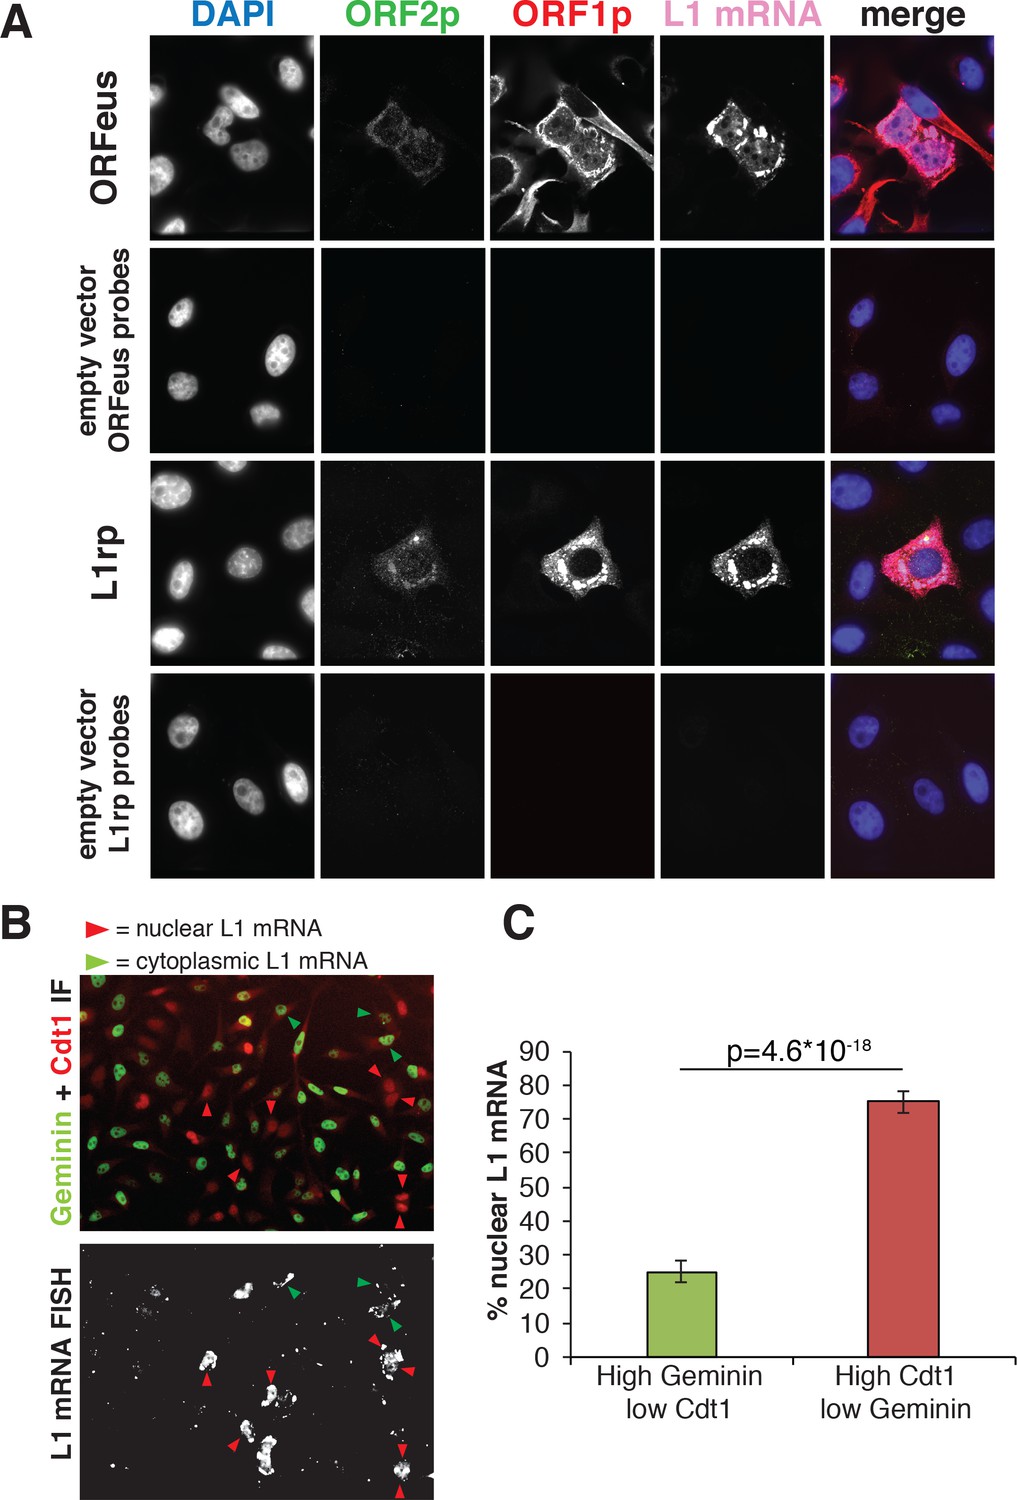
(A) HeLa-M2 cells expressing ORFeus (row 1), L1rp (row3) or not expressing L1 (row 2 and 4, controls) were stained for L1mRNA using cy5 conjugated probes against ORFeus or L1rp. IF of ORF1p using rabbit JH74 Ab and ORF2p using mouse FLAG-M2 Ab was performed right after RNA-FISH labelling. Z-stack images were collected using a spinning disk confocal microscope. The max intensity projection images of each fluorescence channel are shown in grayscale together with the merge image in pseudocolors. (B) L1 mRNA was stained using RNA-FISH together with IF staining of Cdt1 and geminin, makers of G1 and S/G2/M respectively. HeLa-M2 cells expressing recoded L1 (pCEP-puro plasmid LD401) were used. A merged image of Cdt1 (red) and geminin (green) IF is shown in the top image while L1 RNA-FISH is presented in grey-scale in the bottom image. Red arrowheads indicate cells that show strong nuclear L1 mRNA signal and are in G1 phase (low Geminin, high Cdt1). Green arrowheads indicate cells that show only cytoplasmic L1 mRNA signal and that are in S/G2/M phase (high Geminin, low Cdt1). Magnified pictures of some representative cells pointed by red and green arrows are presented in Figure 3—figure supplement 2. (C) Quantification of the distribution of nuclear L1 mRNA among G1 or S/G2/M cells. (error bar = S.D., n = 4). Two tail T-test p value is reported.
Figure 3—figure supplement 1
Additional confocal images of L1 mRNA detected by RNA-FISH.
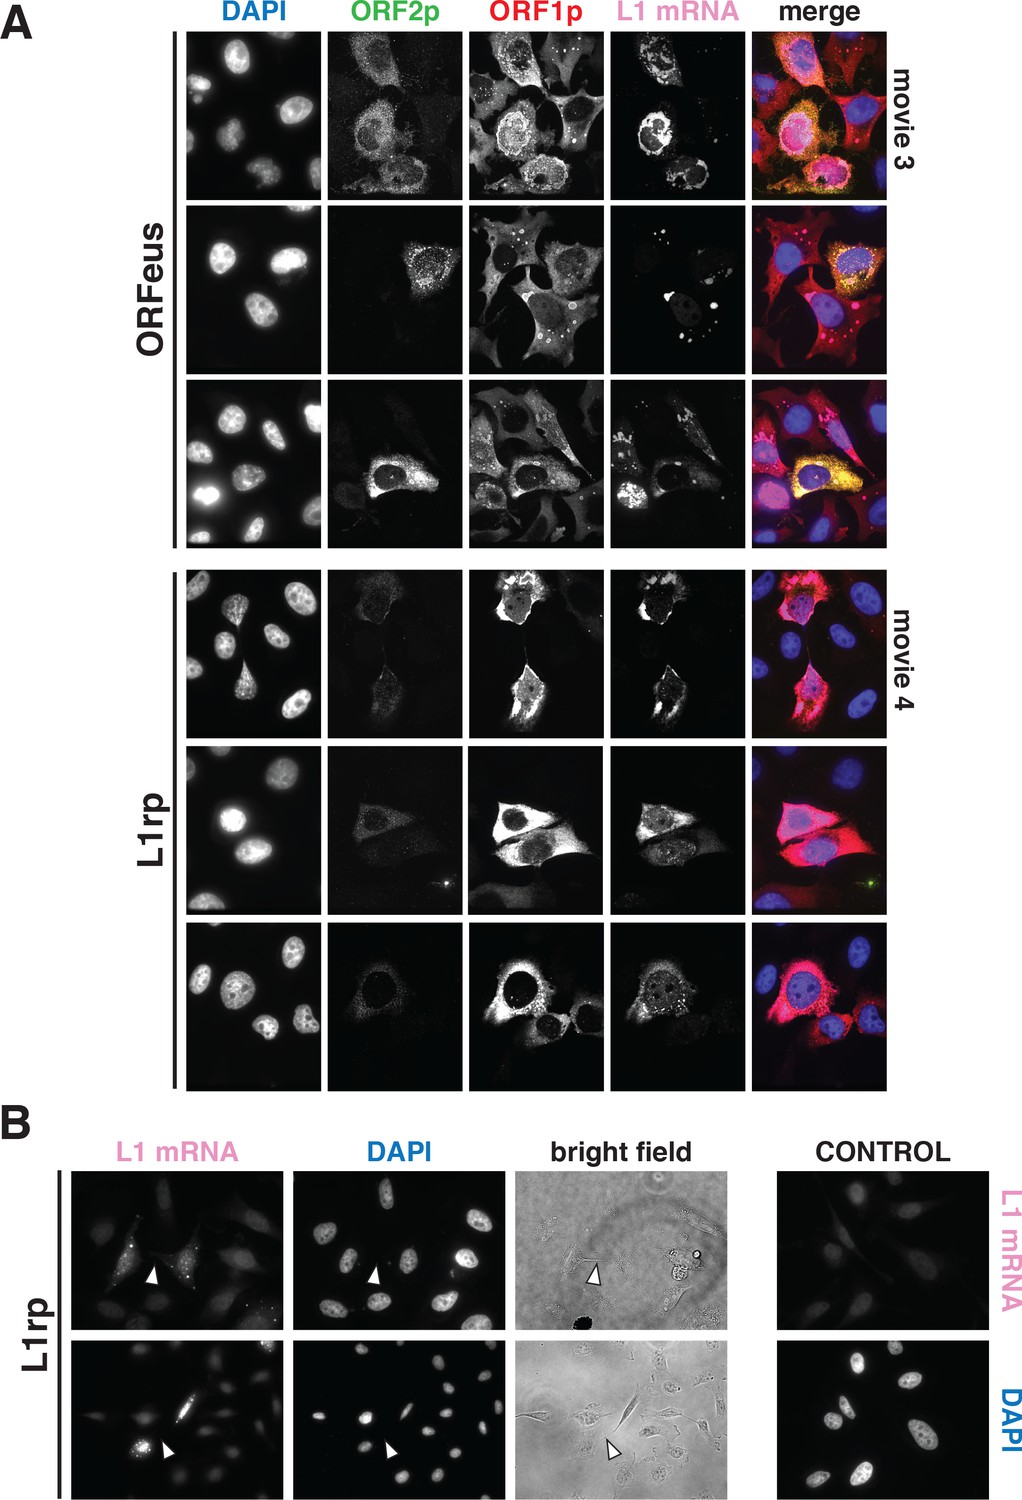
(A) L1 mRNA FISH and ORF1p and ORF2p IF of HeLa-M2 cells expressing recoded L1/ORFeus (top three rows) or non-recoded L1/L1rp (bottom three rows) are presented. The max intensity projection images of each fluorescence channel are shown in grayscale together with the merge image in pseudocolors. Z-stack movies of the cells presented in row 1 and row 4 are also shown in Video 3 and Video 4 respectively. (B) RNA-FISH of L1rp in HeLa cells expressing non-recoded L1. Chromatin (DAPI) and cy5 (L1mRNA) signals are presented together with a bright field image showing cytoplasmic bridges between dividing cells (white arrowheads).
Figure 3—figure supplement 2
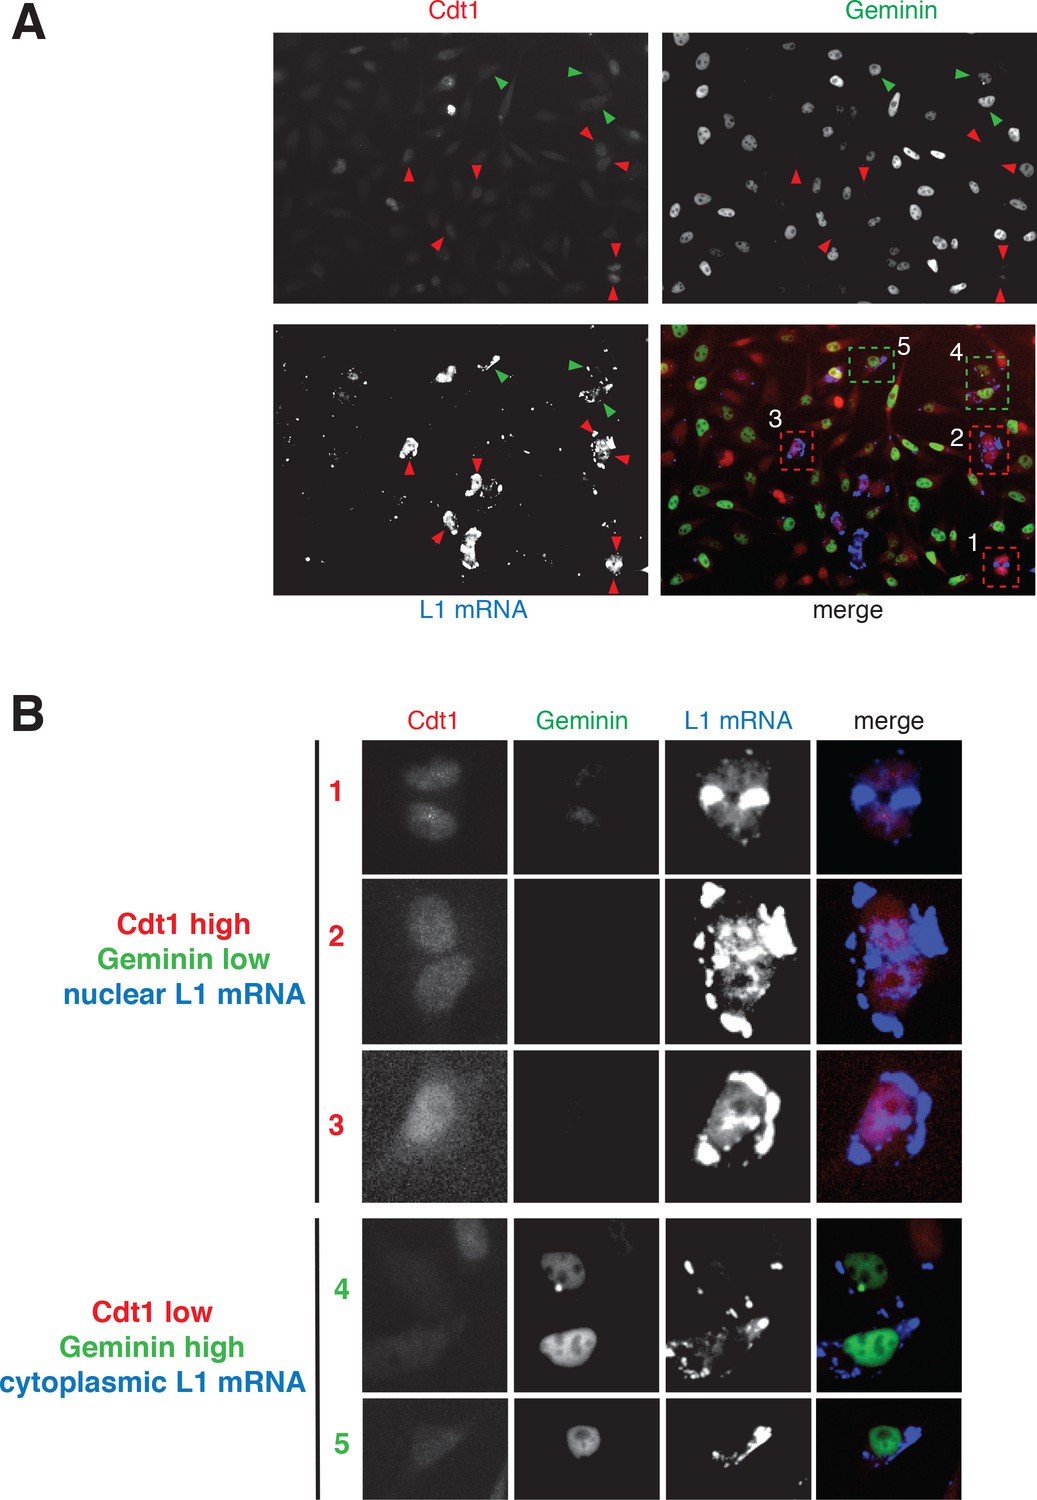
Details of Figure 3B.
(A) Single channel and merge pictures of Figure 3B are here presented with insets of magnified areas presented in (B) and showing representative examples of cells in G1 phase with nuclear L1 mRNA (inset 1-2-3) and cells in S/G2/M phase with cytoplasmic L1 mRNA (inset 4 and 5).
Figure 4 with 2 supplements
ORF1p nuclear localization upon leptomycin treatment.
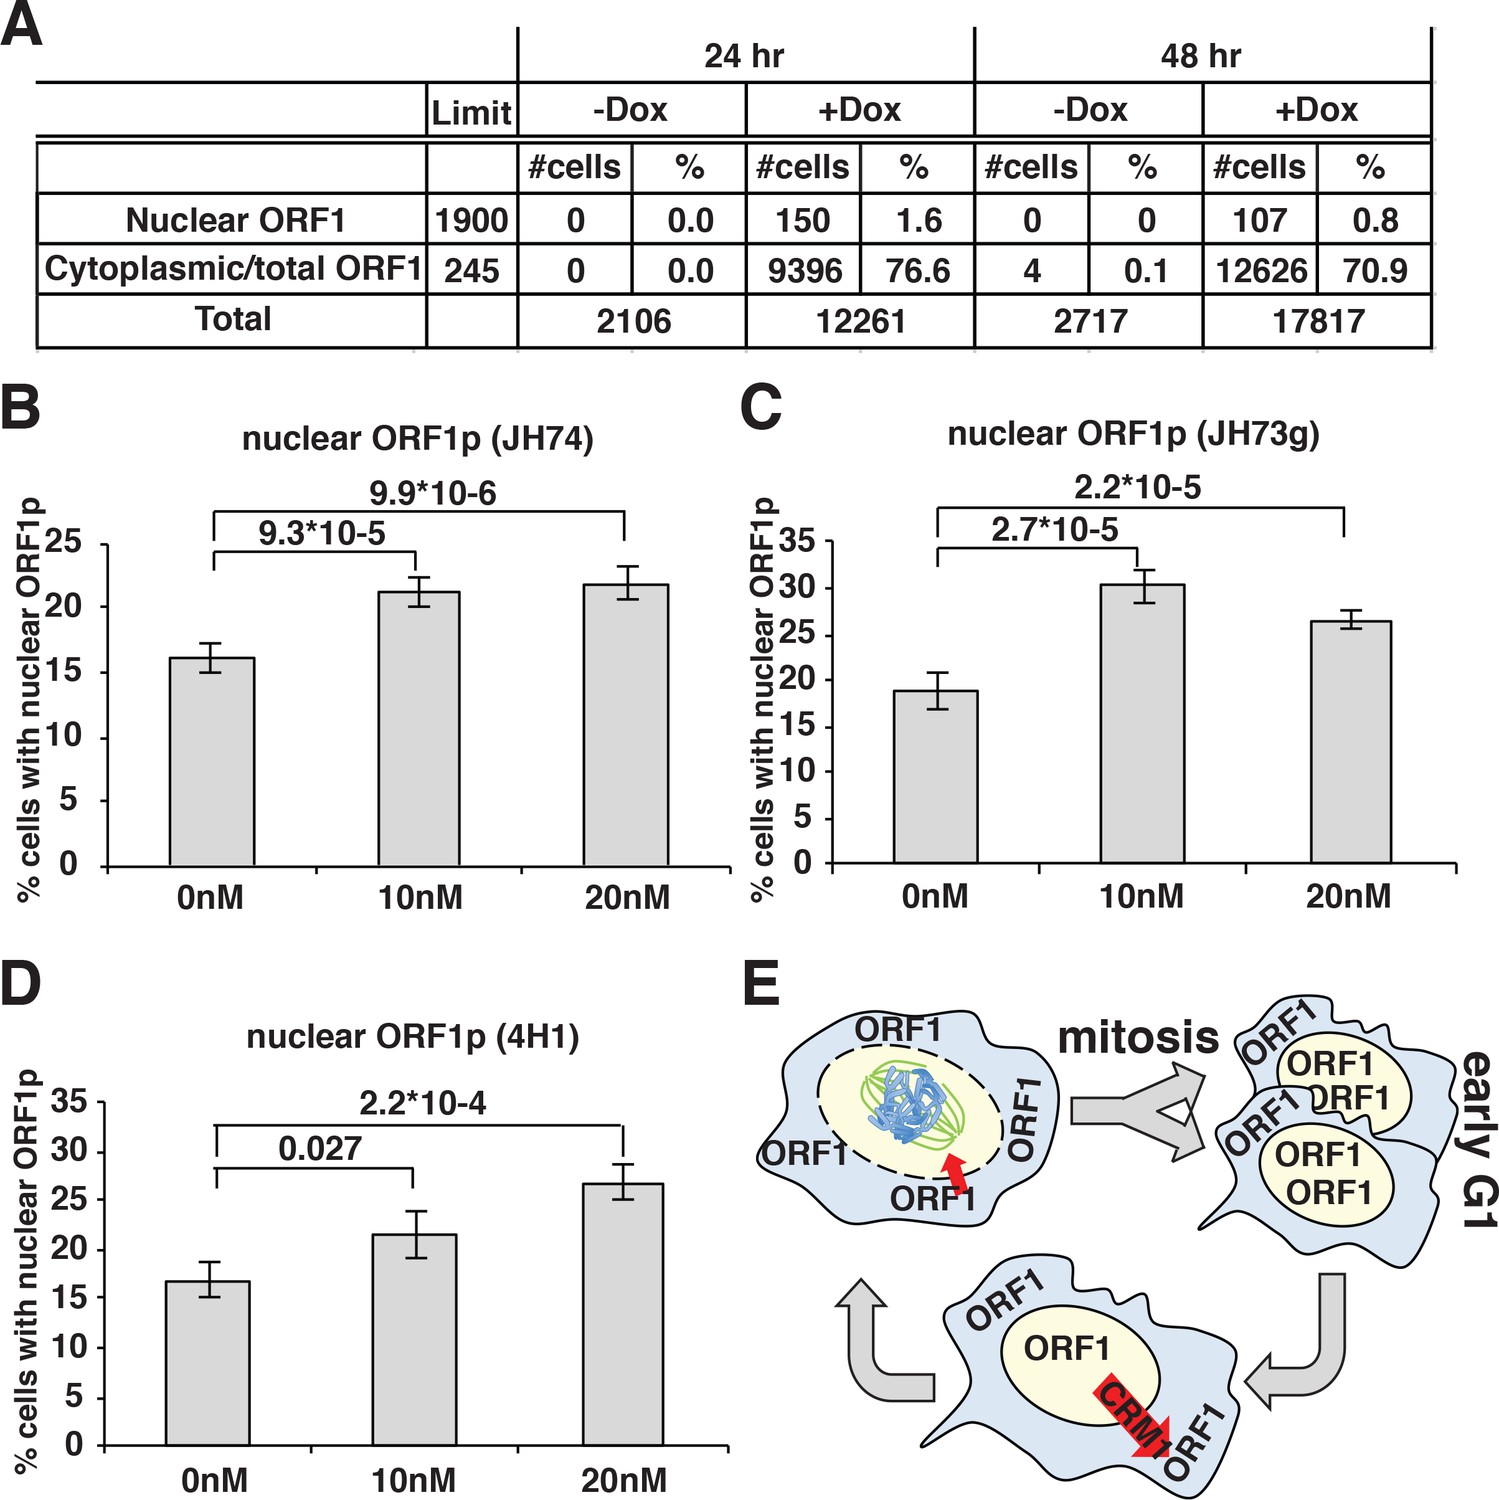
(A) HeLa M2 cells expressing a recoded L1 (ORFeus) with Flag tagged ORF2p were treated for 24 or 48 hr with or without 0.1 μg/ml doxycycline on chamber slides. After treatment, cells were fixed in formalin and stained with JH74 primary antibody, Alexa 647 labeled secondary antibody and DAPI. Slides were scanned with Arrayscan and analyzed using Image Studio HCS software. The number of cells with cytoplasmic ORF1p (also considered as the total number of ORF1p expressing cells) and nuclear ORF1p are reported as well as total amount of cells calculated from DAPI staining. (B–D) quantification of cells expressing nuclear ORF1p in HeLa M2 cells treated with or without leptomycin 10 or 20 nM for 15 hr. After treatment cells were fixed and ORF1p stained using the indicated antibodies. Two tailed T-test p-values are reported for significant differences (error = S.E.M.) (E) Schematic of ORF1p nuclear/cytoplasmic dynamics during the cell cycle.
Figure 4—figure supplement 1
Comparison between JH73 and JH73g antibodies.
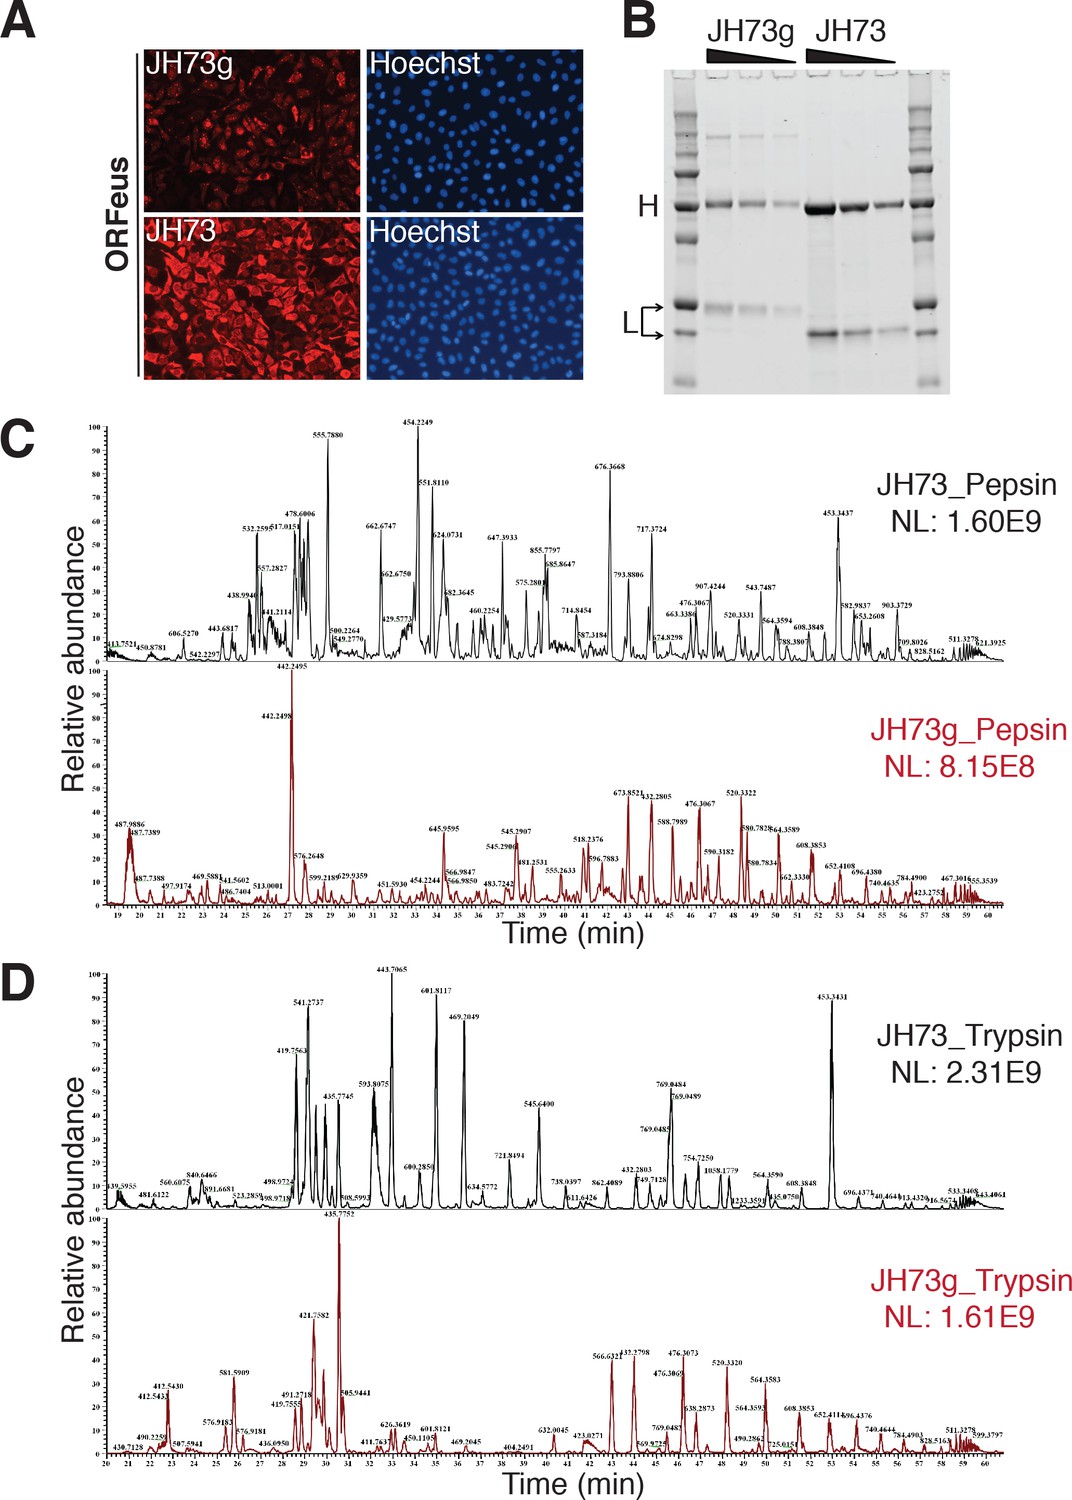
(A) HeLa-M2 cells expressing recoded L1 (0.1 μg/ml doxycycline for 24 hr) stained with JH73g (top) or JH73 (bottom) and Hoechst 33258 (right panels). (B) SDS-PAGE of decreasing amount of JH73g and JH73 Abs. Overlay of base peak chromatogram of JH73 and JH73g antibodies digested using (C) pepsin and (D) trypsin. The base peak chromatogram plots the m/z value of the most abundant peptide ion eluting at a given time. NL represents the normalized ion intensity. For identical samples the major peptide ions in the chromatogram are similar. Here, there is little overlap between the major peptides in JH73 and JH73g, implying that the protein sequence and or the glycosylation pattern is different between the two antibodies.
Figure 4—figure supplement 2
Leptomycin treatments of MEK1 expressing cells.
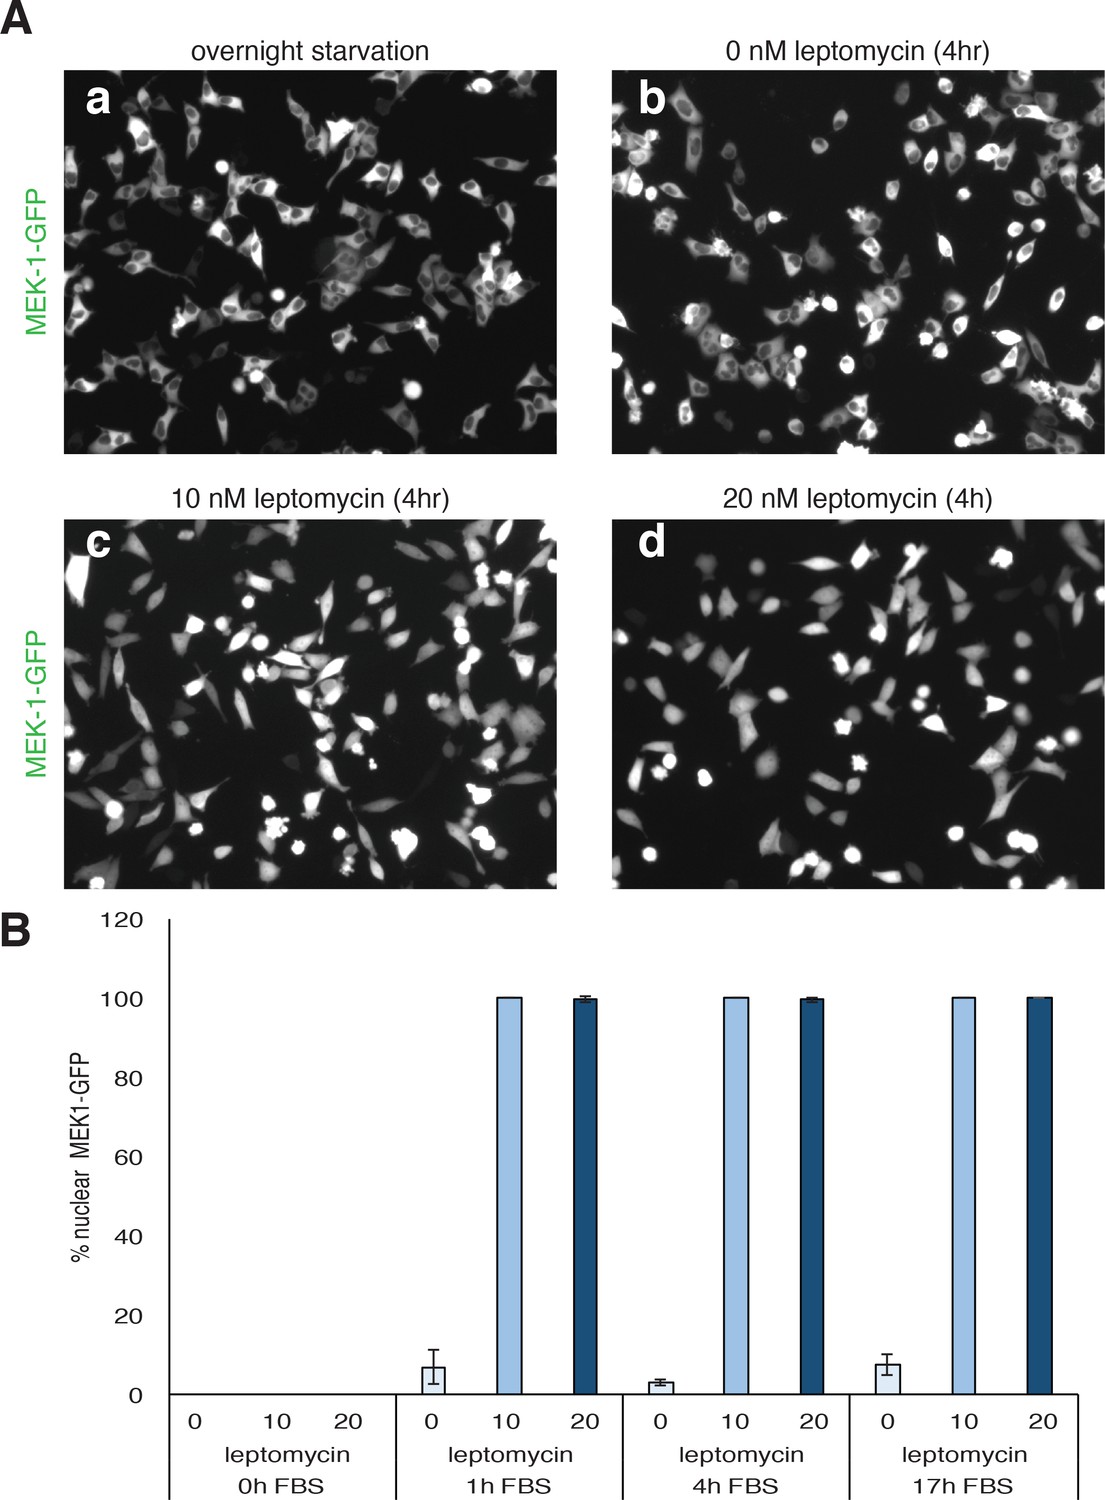
HeLa-M2 cells expressing MEK1-GFP were serum starved for 14 hr in 0.1% FBS media. Upon starvation, cells were treated with 0, 10 and 20 nM letpomycin in complete media (10% FBS) for 0, 1, 4 and 17 hr. Representative pictures of MEK-1 GFP after 4 hr treatment are presented in (A) and quantification of nuclear MEK-1-GFP for each treatment is reported in (B).
Figure 5 with 1 supplement
Retrotransposition in cells blocked in M and G1 phases.
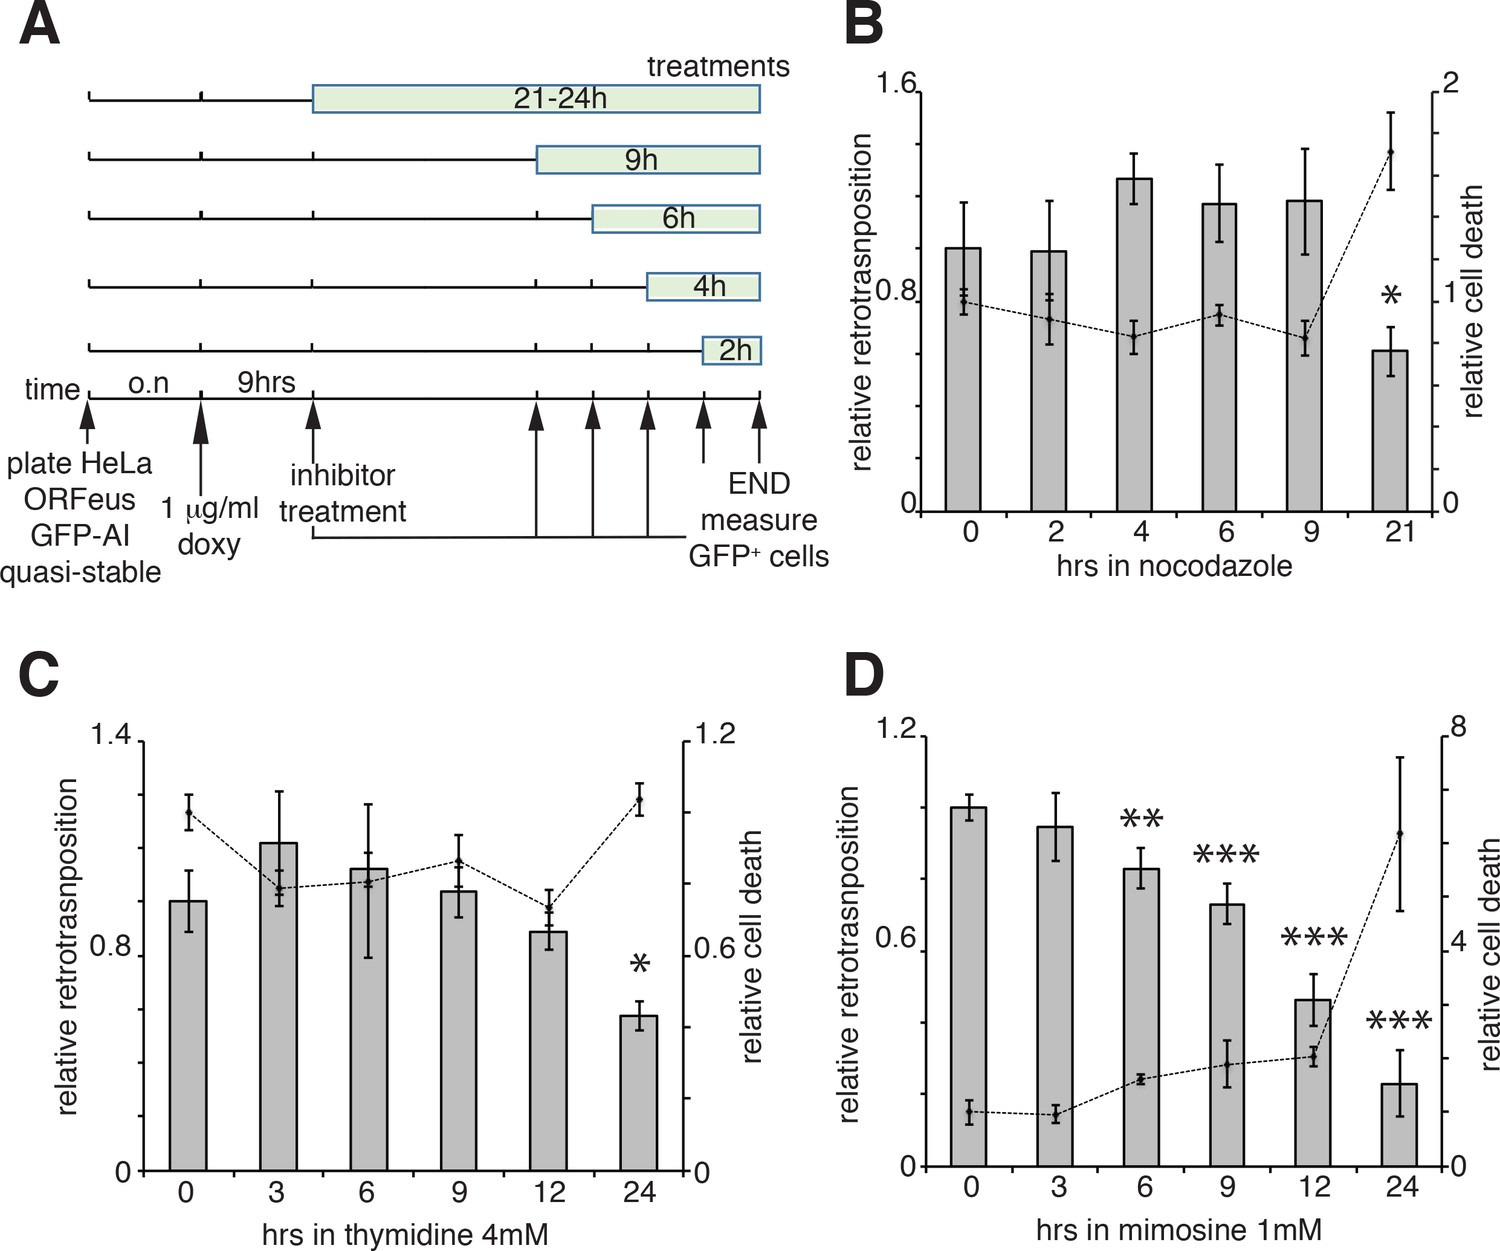
(A) Scheme of the experimental timeline followed for experiments presented in b-d). HeLa M2 cells stably expressing episomal ORFeus-GFP-AI reporter (EA79 plasmid) were plated in 10 cm tissue culture treated plates (3 cm wells in c and d). After overnight incubation, expression of L1 was induced with 1 μg/ml doxycycline. After 9 hr induction, nocodazole, thymidine or mimosine were directly added to the media at various times in different plates to a final concentration of 60 ng/ml nocodazole, 4 mM thymidine and 1 mM mimosine. After 30 hr from the beginning of doxycycline treatment M phase cells were collected by shake-off (all cells were collected by trypsinization for c and d) and the percentage of GFP+ cells measured using a flow cytometer as described in the method section. (B–D) Histogram boxes (left Y axes) represent relative % of GFP+ cells measured by cytofluorometry after treatments with nocodazole (B), 4 mM thymidine (C) or 1 mM mimosine (D) as described in A). The dots connected by a dotted line (right Y axes) represent the relative % of PI+ cells (dead cells). Retrotransposition and PI percentages of cells not treated with nocodazole, thymidine or mimosine (time 0) were set as 1. (error = S.D., *p<0.05; **p<0.01; ***p<0.001).
Figure 5—figure supplement 1
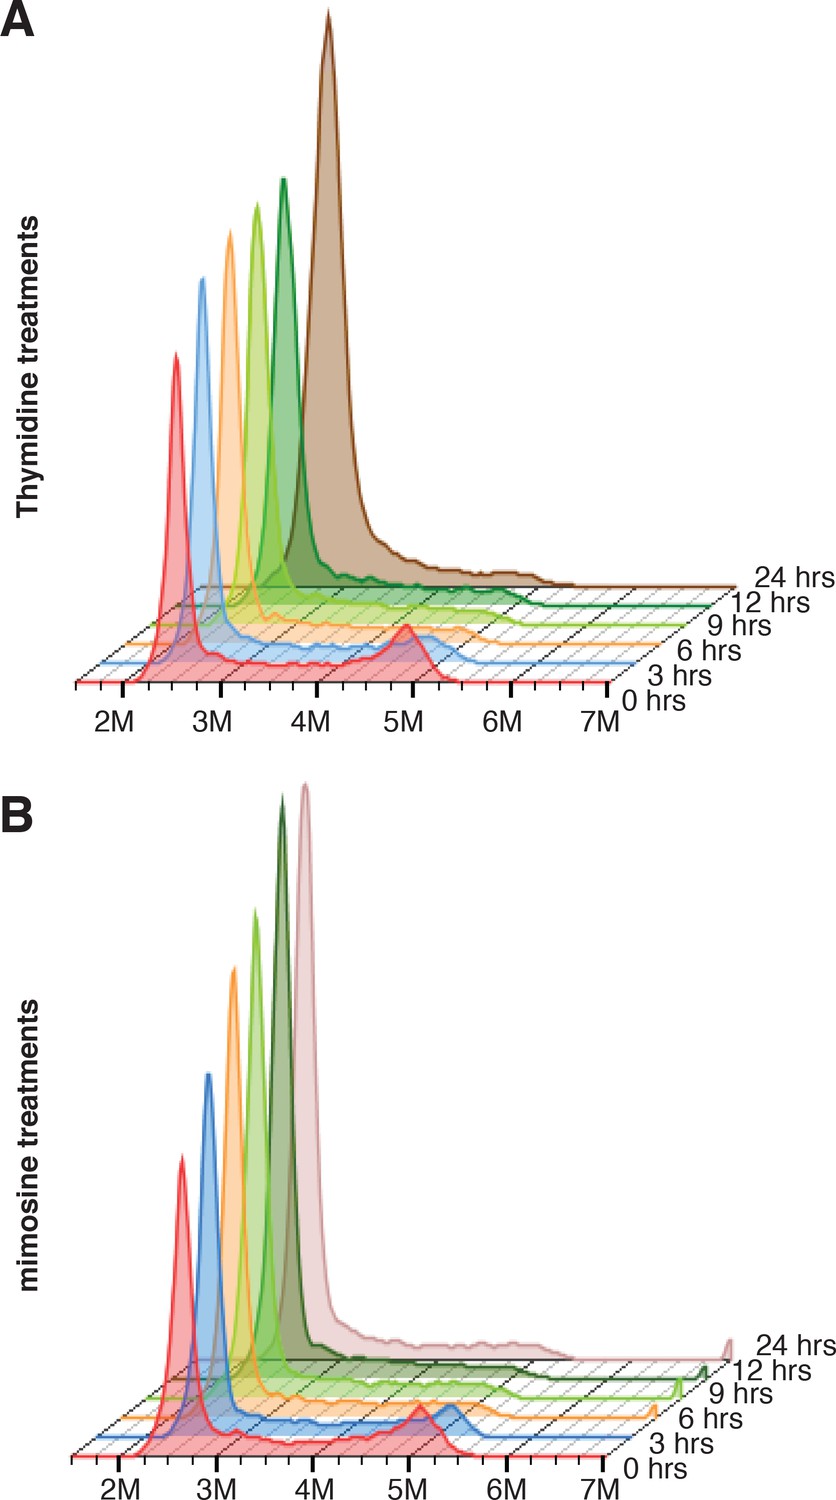
Cell cycle profiles of cells treated with thymidine and mimosine.
Cells analyzed in Figure 5C and D were stained with propidium iodide (PI) for cell cycle analysis. The cell cycle profiles of cells treated with thymidine (A) or mimosine (B) at each time point are presented as stacked histograms.
Figure 6 with 1 supplement
Retrotransposition during the cell cycle.
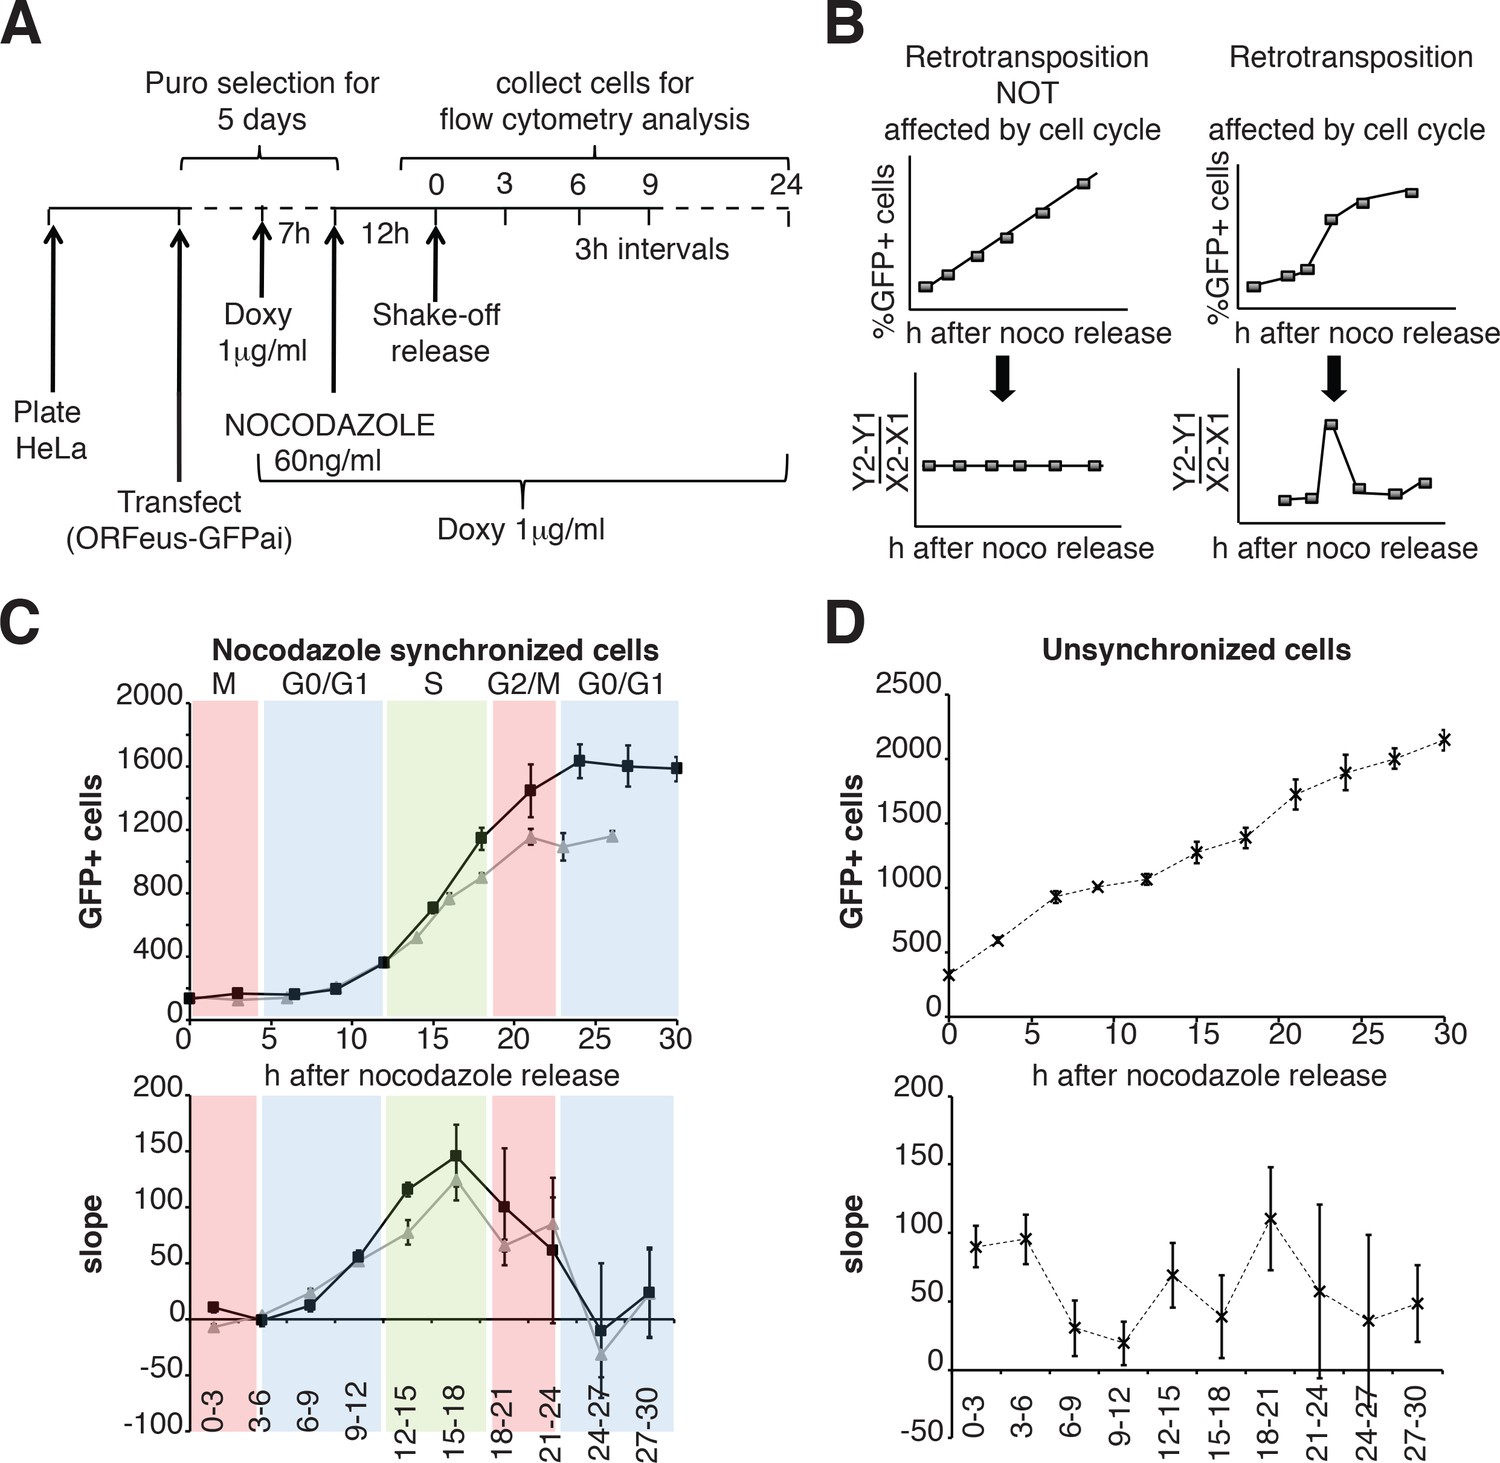
(A) Scheme of the experimental timeline followed for experiments presented in E-F). HeLa M2 cells were plated and transfected in six well plates. 24 hr after transfection 1 μg/ml puromycin was added to the medium for 5 days. During puromycin selection cells were split into 10 cm plates to avoid contact inhibition. During the 5th day of puromycin selection, 3 × 10⁶ cells were freshly replated in 10 cm plates and after 3 hr, doxycycline was added to the medium to a final concentration of 1 μg/ml. After 7 hr, nocodazole was added to a final concentration of 60 ng/ml. After 12 hr, medium was discarded and mitotic cells were collected by mechanical shake off. Cells were washed and 0.4 × 10⁶ mitotic cells were replated in each of 3 cm wells. At the indicated time points, the percentage of GFP+ cells was measured using a flow cytometer. (B) prediction of retrotransposition measurements if cell cycle affects (left panels) or does not affect (right panels) retrotransposition. (C–D) Retrotransposition analysis of nocodazole synchronized (C) or not synchronized (D) cells. The % of GFP+ cells in a population of 10000 cells is reported in the indicated time points. Bottom panels show slope changes from the corresponding measurements on the top panels. The shaded colored boxes indicate specific cell cycle stages extrapolated from propidium iodide (PI) measurements reported in Figure 6—figure supplement 1. The two lines (gray and black) represent two experiments using independent transfections of the retrotransposition reporter. (error = S.D., n = 4).
Figure 6—figure supplement 1

PI analysis of the cell cycle.
(A) HeLa M2 cells from Figure 4E–F were fixed and treated with propidium iodide (PI) for cell cycle analysis by cytofluorimetry. The % of cells in each cell cycle stage was measured for each time point. The shaded colored boxes indicate the cell cycle stage extrapolated from this analysis.
Figure 7 with 2 supplements
Analysis of L1 retrotransposition during the cell cycle using FT-AI reporter.
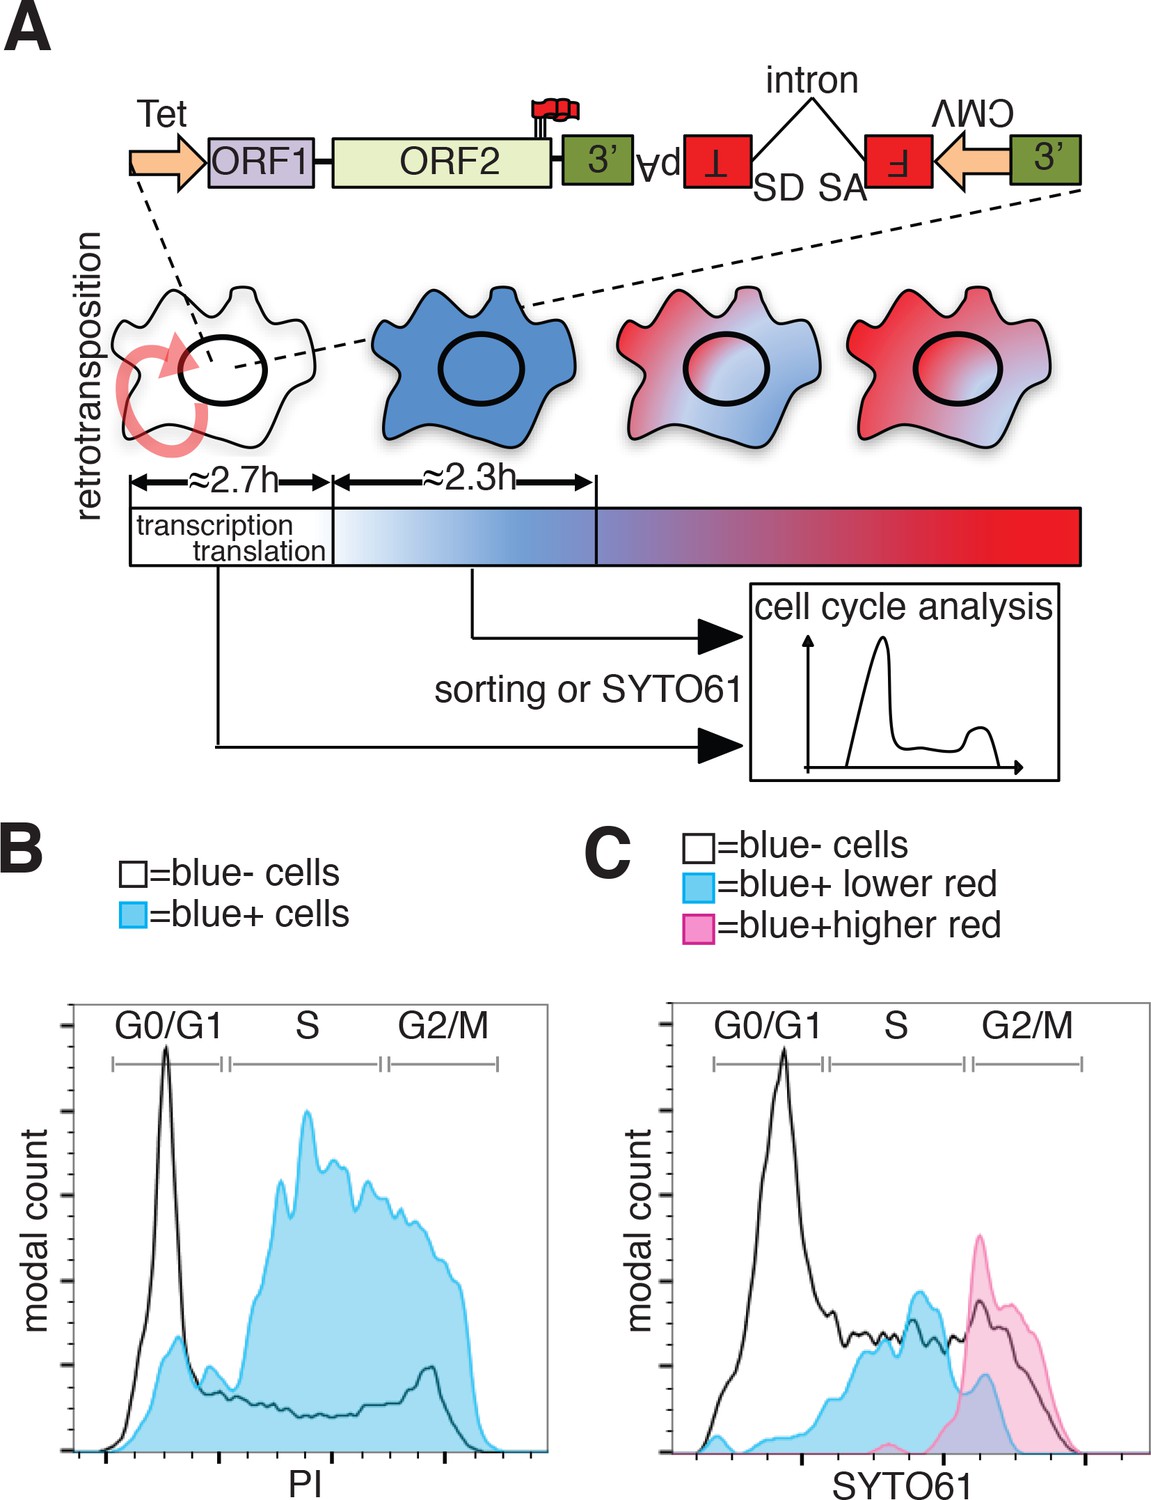
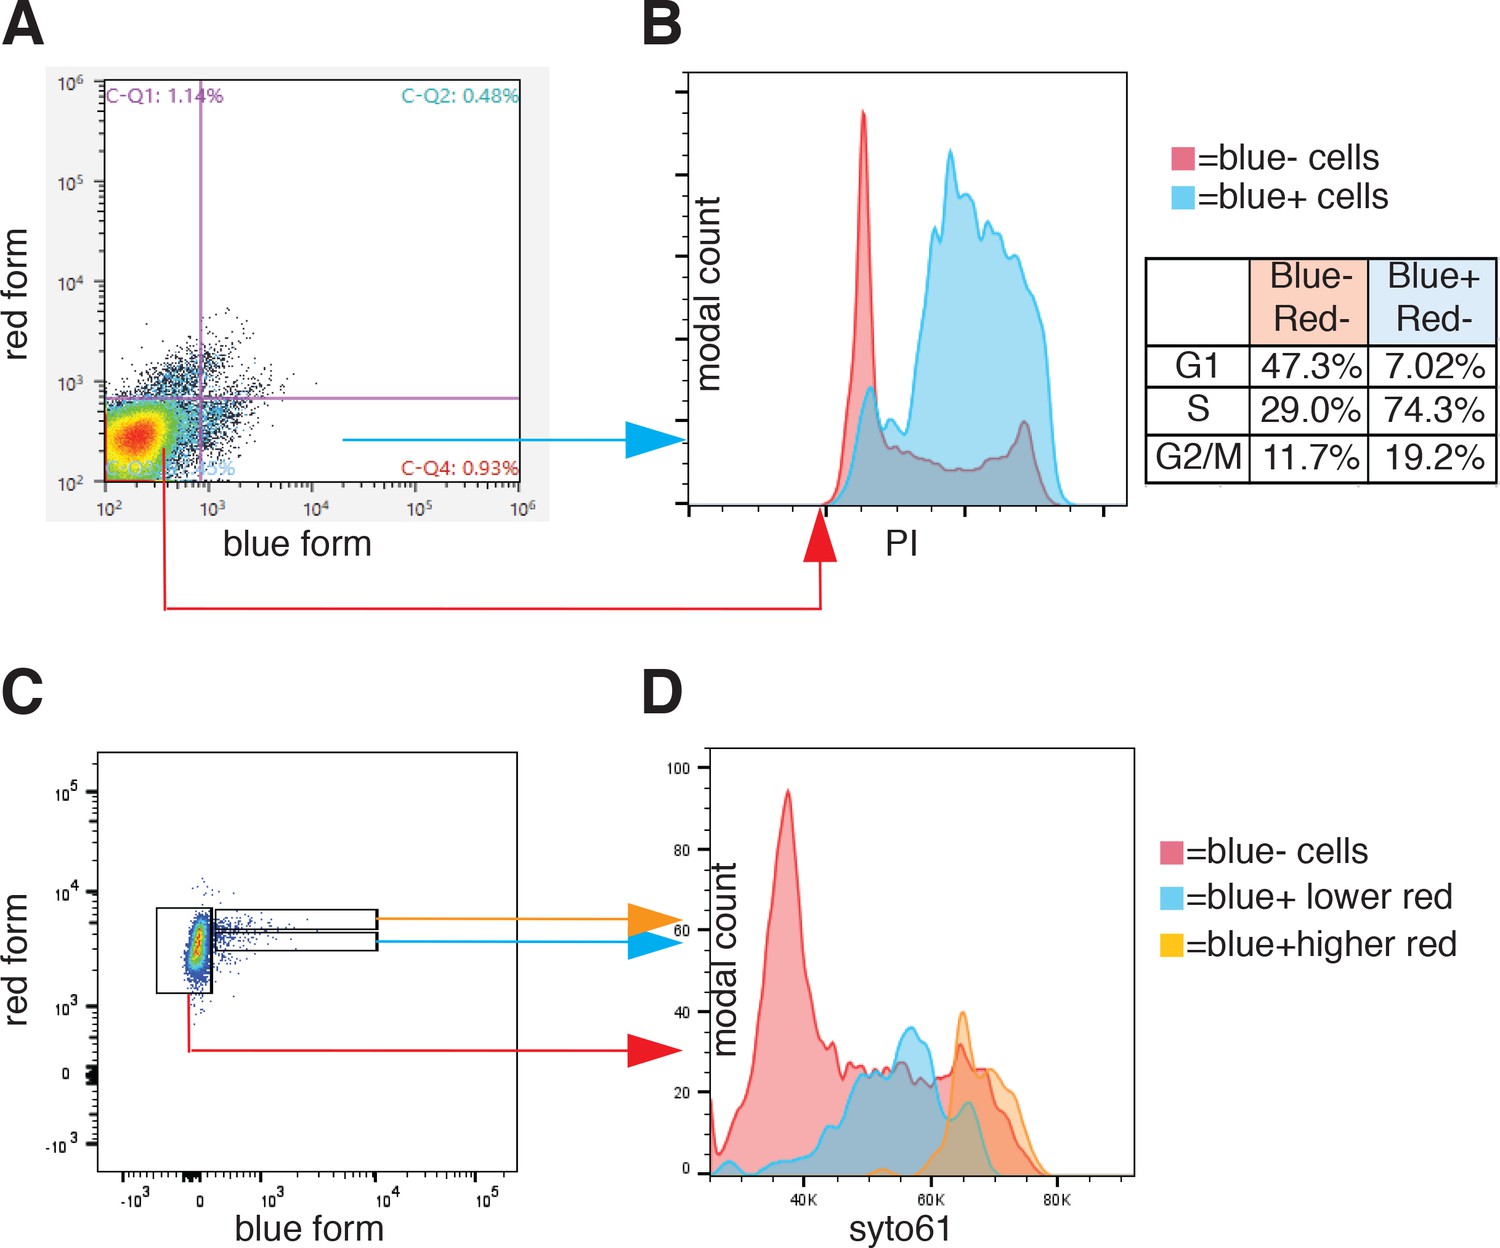
(A) Schematic of the fluorescent-timer-AI reporter (FT-AI) and of the experimental design. HeLa M2 cells were transfected with a FT-AI reporter. After induction of L1 expression (24 hr, 1 μg/ml doxycycline), cells undergoing retrotransposition are blue and can be sorted by FACS or directly stained with SYTO61 for cell cycle analysis. Within about 2.7 hr of doxycycline treatment 50% of the cells will start to express the FT reporter as estimated in Figure 7—figure supplement 1A. After about 2.35 hr (Figure 7—figure supplement 1B) from expression of the blue FT (retrotransposition event), cells start to become red. Double negative (blue-/red-) cells were also collected by sorting and analyzed as control. The sorted cells are then stained with PI and their cell cycle stage determined. (tet = Tetracycline inducible promoter, 3’=3’UTR, pA = polyA signal, FT = fluorescent timer, SD = splice donor, SA = splice acceptor, CMV = cytomegalovirus constitutive promoter, red round arrow = L1 ‘jumping’). (B) Histogram of cell cycle distribution of sorted and PI stained blue-red- cells (black line) and blue+red- cells (blue histogram). The percentage of cells in each cell cycle stage after sorting and PI staining are reported in Figure 7—figure supplement 2B. (C) Cell cycle analysis using SYTO61 dye of blue- cells that did not undergo retrotransposition (black line), of blue+ cells expressing lower red signal (blue histogram) or blue+ cells expressing higher red signal (purple histogram). The complete profiles of analysis for the reported cells are presented in Figure 7—figure supplement 2C–D.
Figure 7—figure supplement 1
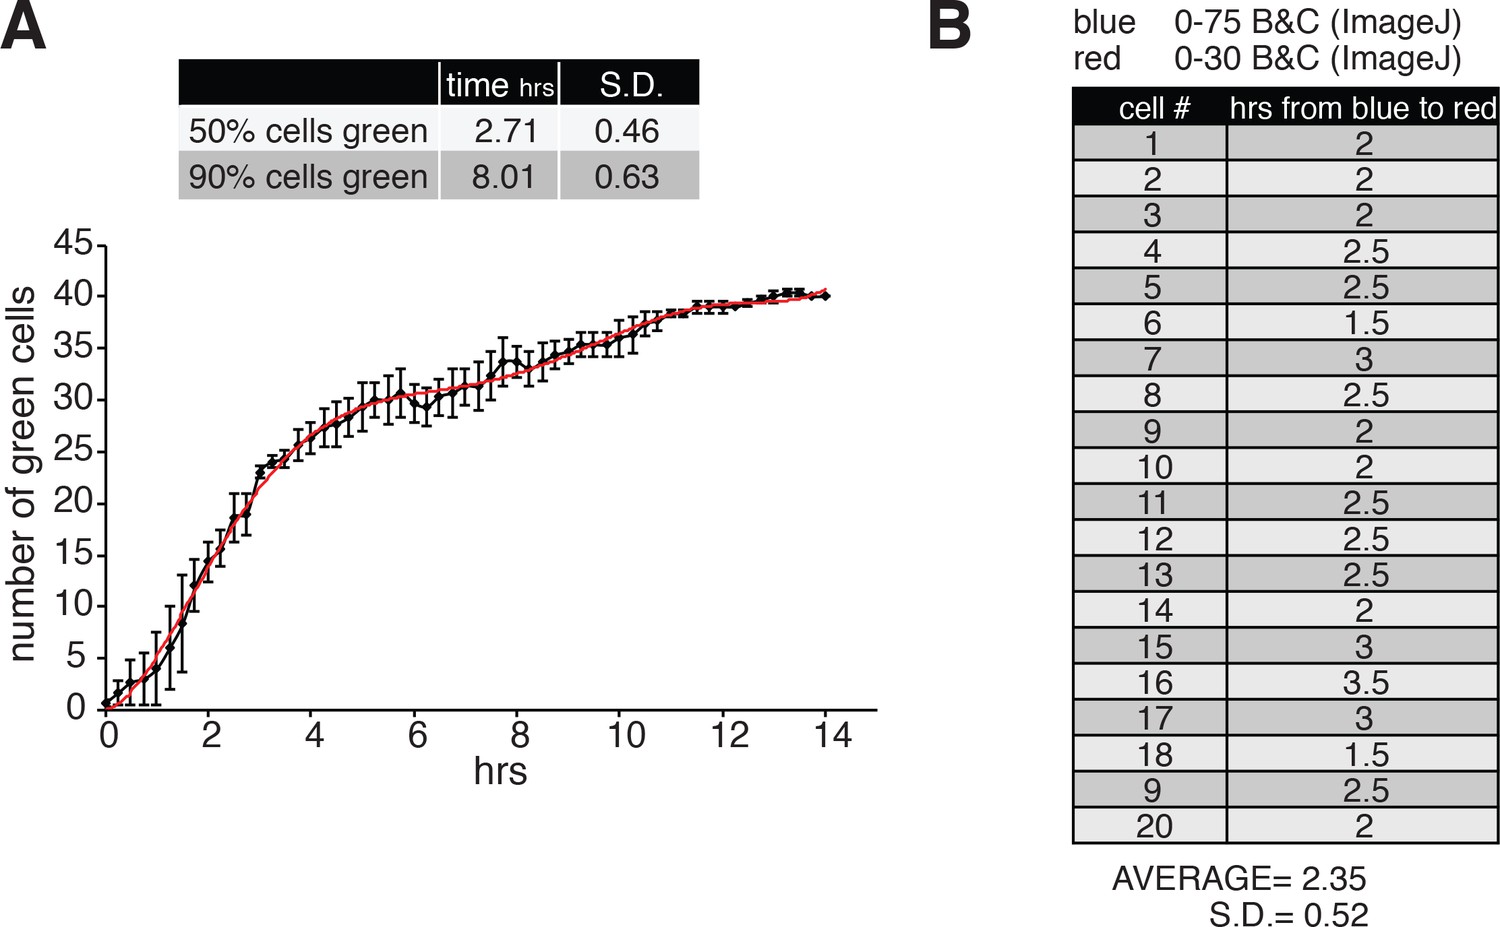
Dynamics of GFP expression, fast FT maturation and PI analysis.
(A) Quantification of a fluorophore (GFP) expression under a Tet-CMV promoter. HeLa M2 cells expressing a pCEP-puro encoding GFP under doxycycline control, were used for a 15 hr live cell imaging experiment. Time zero represents the time of doxycycline (1 μg/ml) addition to the medium. Pictures of the GFP signal were taken every 15 m using an EVOS-FL-auto with on-stage incubator. (50% of the cells are green after 2.71 ± 0.46 hr; 90% of the cells are green after 8.01 ± 0.63 hr). (B) Quantification of fast-FT fluorophore maturation from blue to red. HeLa M2 cells expressing Tet-inducible fast fluorescent timer (FT) were used for 20 hr live cell imaging measurements. Cells were pretreated with doxycycline for several hours before starting the collection of pictures every 30 min using DAPI (blue) and RFP (red) filters. 20 cells that started to express the FT protein within the timeframe of the experiment were analyzed (cell #). The brightness and contrast parameters (B and C) were set, as indicated, using ImageJ. The number of frames in which a cell showed blue signal but not red signal was counted and the time in which each cell transition from ‘only blue’ to red was extrapolated. The average value and standard deviation (S.D.) for the 20 analyzed cells are reported in h (2.35 ± 0.52 hr).
Figure 7—figure supplement 2
Cell cycle analysis of FT-AI.
HeLa cells expressing the FT-AI retrotransposition reporter were treated with doxycycline 1 ug/ml for 24 hr. Upon treatment, blue only cells (quadrant C-Q4) and double negative cells (quadrant C-Q3) were sorted as shown in the dot plot shown in (A). Sorted cells were then stained with PI and re-analyzed to measure the percentage of cells in each cell cycle stage (histograms and table in (B)). The profiles of the two PI histograms from double negative (red) and only blue (blue) cells were overlaid using a modal Y axis. The inferred percentage of cells in each cell cycle stage is reported in the table. (C) HeLa cells expressing the FT-AI retrotransposition reporter were treated with doxycycline 1 µg/ml for 24 hr. Upon doxycycline treatment cells were treated with 5 μM SYTO61 DNA labeling dye for 1 hr at 37°C. Cells were then analyzed with a LSRII-UV fluorimeter. Three populations were gated and considered for cell cycle analysis: blue negative (blue-) cells (red), blue positive (blue+) with higher red fluorescence (orange) and blue+ with lower red fluorescence (blue). The three cell cycle curves are overlaid in (D).
Figure 8 with 1 supplement
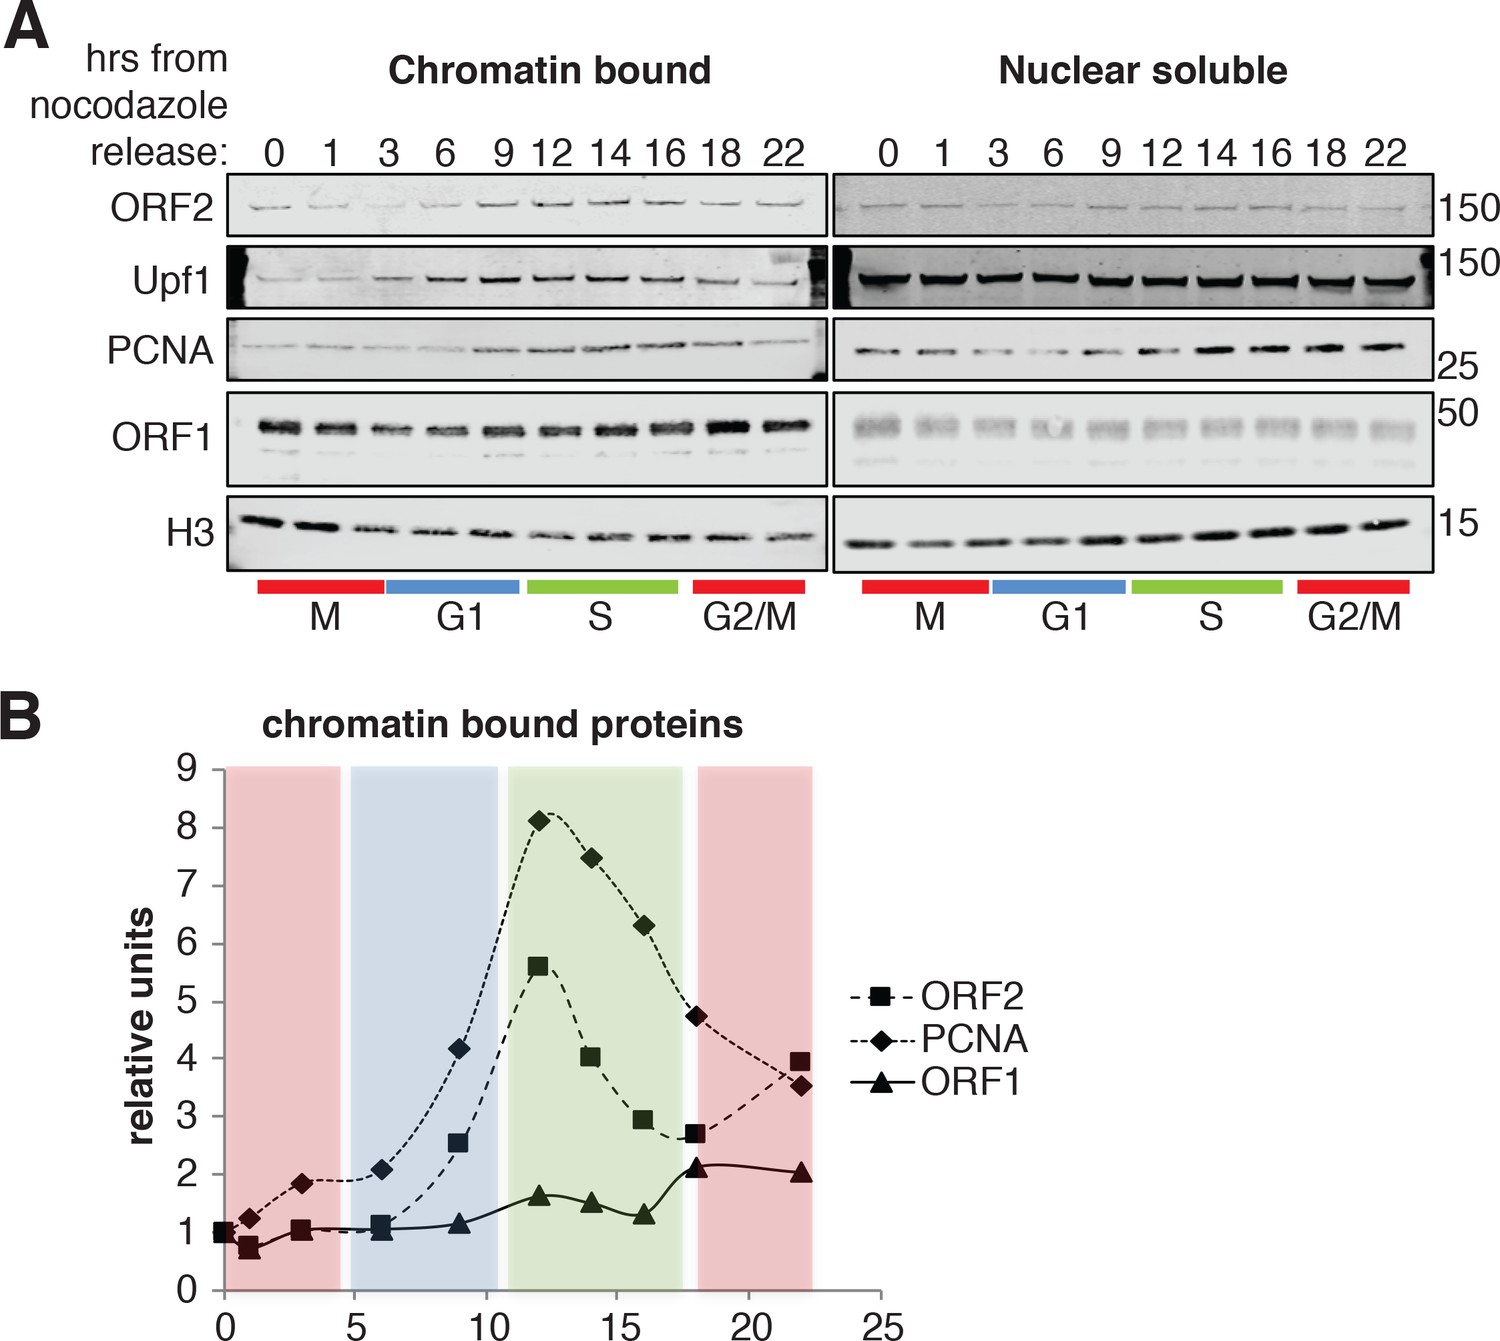
ORF2p binds chromatin during S phase.
(A) Western blot of chromatin bound proteins or nuclear soluble proteins extracted from HeLa M2 cells expressing recoded L1, synchronized with nocodazole and released into the cell cycle for the indicated times. The colored bars below the blots indicate cell cycle phases extrapolated from Figure 4—figure supplement 1. The targets of the antibodies used for blotting are indicated. The quantification of the ORF2p, ORF1p and PCNA proteins bound to chromatin are reported in (B) as ratio of H3 signals. The relative units at time zero are set to 1.
Figure 8—figure supplement 1
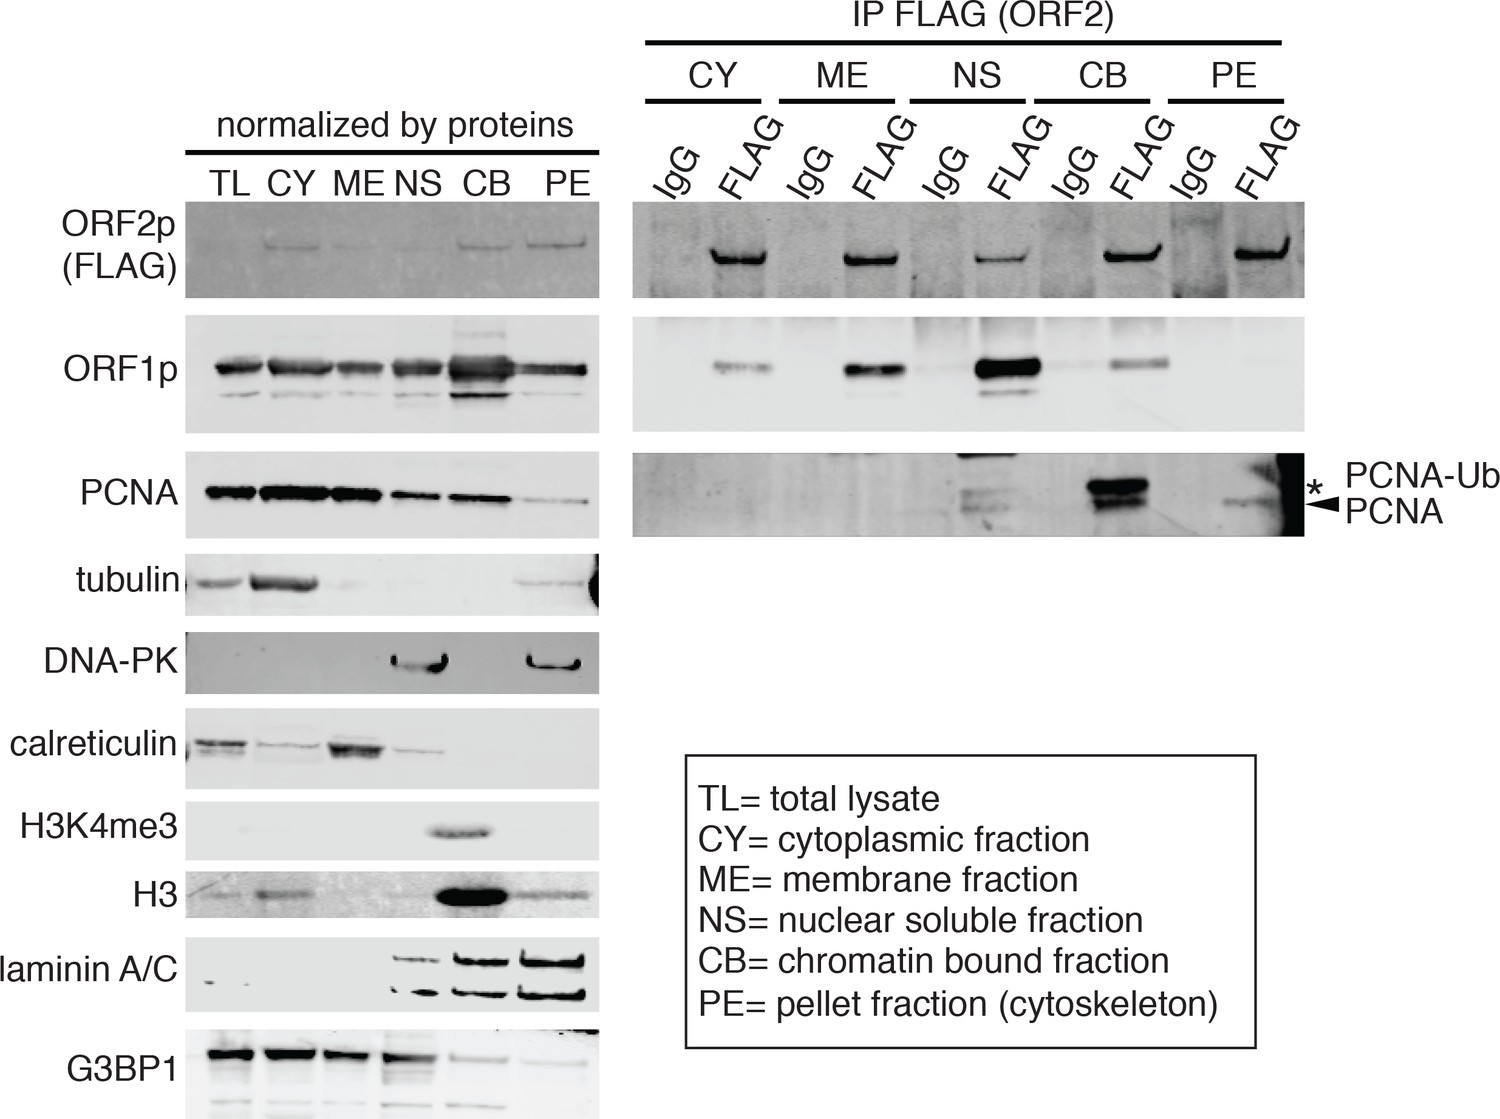
Analysis of nuclear fractions.
HeLa M2 cells expressing a recoded L1 with a 3XFlagTag on ORF2p C terminus were processed for the isolation of protein cellular fractions using a protein fractionation kit (Thermo prod. number 78840). Upon fractionation ORF2p was immunoprecipitated (IP) from each fraction using FLAG-M2 (SIGMA) conjugated dynabeads. Western blotting analysis for each fraction was performed using the indicated antibodies. (tubulin = cytosol marker, DNA-PK = nuclear soluble marker, calreticulin = membranes marker, H3K4me and H3 = chromatin marker, laminin A/C = nuclear membrane marker, G3BP1 = stress granules marker PCNA-Ub = ubiquitinated PCNA).
Figure 9

ORF2p is associated with replication fork proteins during S phase.
(A) Schematic of sequential ORF2-PCNA immunoprecipitation and mass spectrometry analysis. HCT116 expressing V5-PCNA, rtTA and a recoded L1 (ORFeus) with flag-tagged ORF2p were used to immune-precipitate ORF2p. The immunoprecipitated complexes eluted with FLAG peptides were split in two and used for immunoprecipitation with V5 or IgG control antibodies. After native elution with V5 peptides the samples were analyzed by mass spectrometry. (B) Peptide numbers of known DNA replication fork proteins (identified by their UniProt number) obtained after mass spectrometry analysis of the ORF2p-PCNA/IgG sequential IP. Peptide counts of two independent experiments are reported. Red = high confident interactors that are found in both experiments and with no peptides in the IgG control IPs; orange = possible interactors that are found in both experiments and with some peptides in the IgG control IPs; yellow = low confidence interactors that are found in just one experiment and with no peptides in the IgG control IPs; gray = MCM proteins not identified as ORF2p interactors in our analysis. (C) Western blot of MCM6 and PCNA proteins co-immunoprecipitated upon IgG (control), ORF1 or FLAG(ORF2) IP. Grindates of 293TLD cells expressing a recoded L1 with flag-tagged ORF2p were used. (SUP = supernatant after IP, IP = immunoprecipitation). (D) RT-qPCR quantification of L1 after direct immunoprecipitation from HCT116-V5-PCNA-L1 cells using IgG, FLAG-M2 (ORF2p) or V5 (PCNA) antibodies (top panel) or after sequential IP using FLAG-IgG or FLAG-V5 antibodies (bottom panel). "cDNA" amount refers to amount of cDNA produced in in vitro RT reactions and reflects mRNA concentrations in the immunoprecipitates. (E) Immunostaining of ORF2p (red) and PCNA (green) in cells synchronized with double thymidine block and released for 2 hr in S phase.
-
Figure 9—source data 1
Complete list of proteins and peptides identified by mass spectrometry.
All the proteins and the corresponding peptides identified by mass spectrometry analysis after sequential ORF2p-V5 or ORF2p-IgG IP are reported. The score (sum of scores of the individual peptides), coverage, number of peptides (# peptides) and number of peptide spectra matches (# PSM) are reported for each protein. Two replicates of ORF2p-IgG IPs (orange and blue columns for experiment 1 and 2 respectively) and two replicates of ORF2p-V5 IPs (yellow and green columns for experiment 1 and 2 respectively) are reported.
- https://doi.org/10.7554/eLife.30058.031
Figure 10
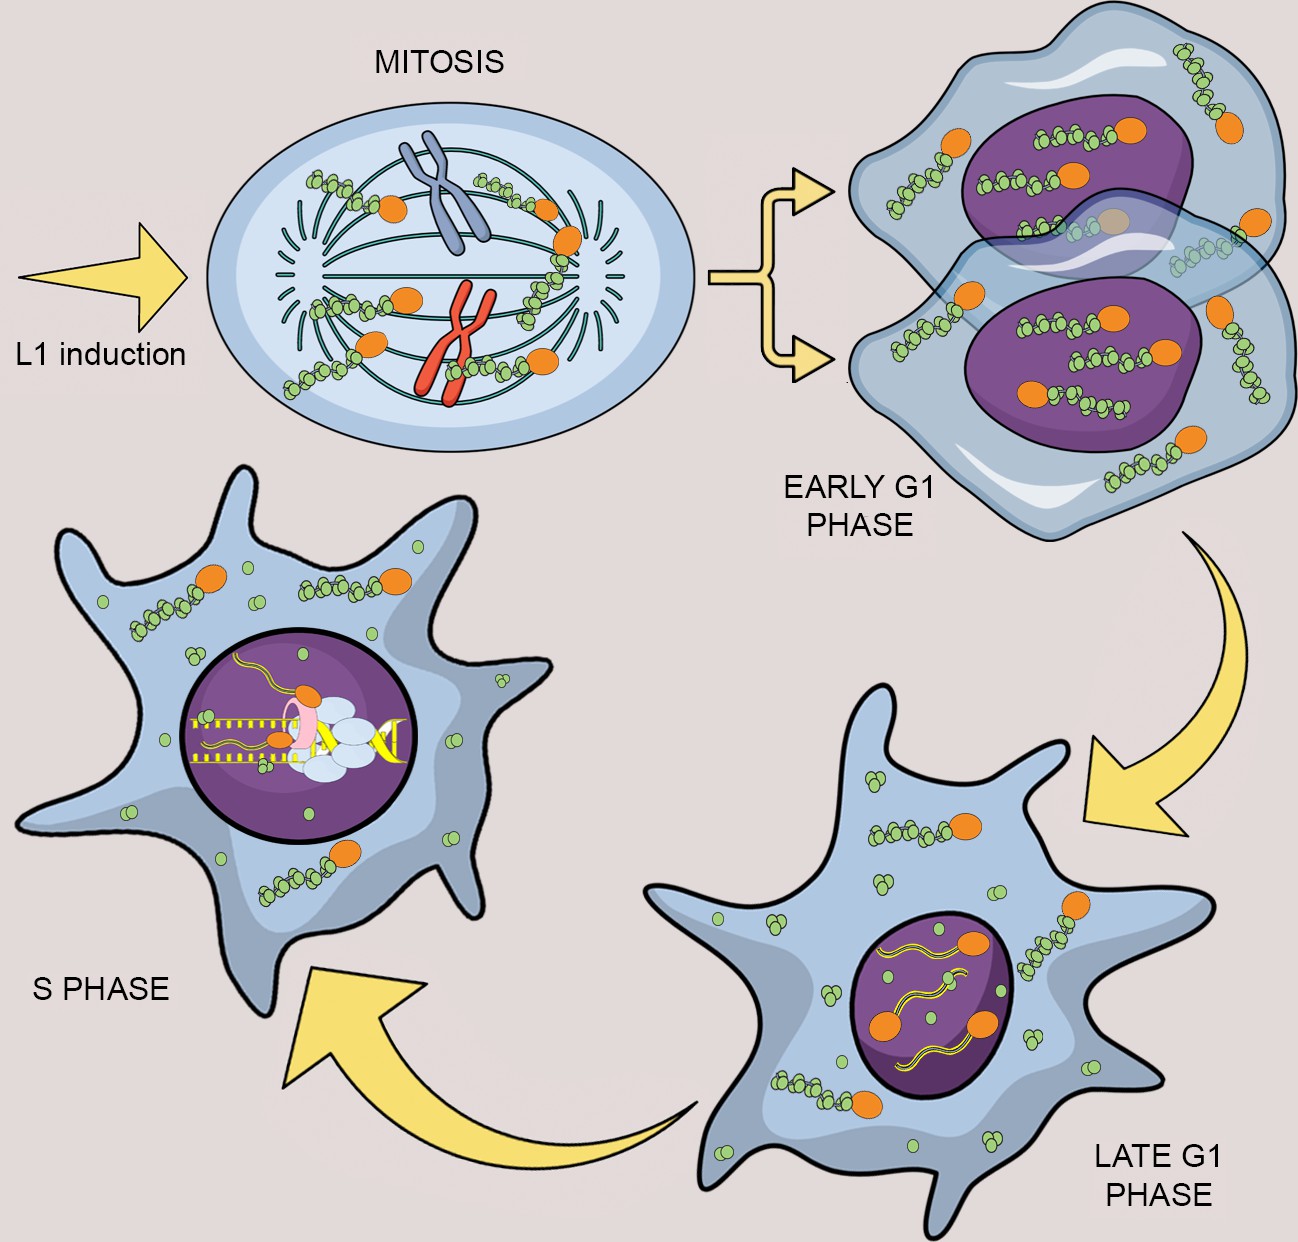
Model of L1 protein dynamics and L1 retrotransposition during the cell cycle.
After induction of L1 expression, L1 RNPs formed by ORF1p (green balls), ORF2p (orange balls) and L1mRNA (blue/yellow line interacting with ORF2p and ORF1p trimers), enter the nucleus as a result of mitotic nuclear membrane breakdown. In early G1 phase, when the nuclear membrane re-assembles, L1 RNPs are found in the nucleus. ORF1p, but not ORF2p is then exported from the nucleus through a CRM1 dependent mechanism leaving ORF2p and L1 mRNA into the nucleus. During S phase and DNA replication the ORF2p-mRNA L1 particles retrotranspose into new loci of the genome and interact with components of the replication fork: PCNA (pink tube) and MCM proteins (light blue balls).
Videos
Video 1
ORFeus ORF1p/ORF2p Z stack.
Z-stacks of recoded L1 (ORFeus) ORF1p (left) and ORF2p (right) expressed in HeLa-M2 treated for 24 hr with doxycycline 0.1 μg/ml. Red arrows points to cells expressing cytoplasmic and nuclear ORF2p and ORF1p; the green arrow points to a cell expressing cytoplasmic and nuclear ORF2p and just cytoplasmic ORF1p.
Video 2
L1rp ORF1p/ORF2p Z stack.
Z-stacks of L1rp ORF1p (left) and ORF2p (right) expressed in HeLa-M2 treated for 24 hr with doxycycline 0.1 μg/ml.
Video 3
ORFeus ORF1p/ORF2p/L1 mRNA Z stack.
Z-stacks of chromatin (DAPI), ORF2p (FLAG), ORF1p (JH74) and L1 ORFeus mRNA (cy5-probes) in HeLa-M2 cells expressing ORFeus (LD401) and treated for 24 hr with doxycycline 0.1 μg/ml. The max intensity projection images of these cells is presented in Figure 3A row 1.
Video 4
L1rp ORF1p/ORF2p/L1mRNA Z stack.
Z-stacks of chromatin (DAPI), ORF2p (FLAG), ORF1p (JH74) and L1rp mRNA (cy5-probes) in HeLa-M2 cells expressing L1rp (MT302) and treated for 24 hr with doxycycline 0.1 μg/ml. The max intensity projection image of these cells is presented in Figure 3A row 4.
Additional files
-
Supplementary file 1
RNA-FISH probe sequences.
The DNA sequences of the RNA-FISH probes used to detect L1rp and ORFeus mRNA are reported.
- https://doi.org/10.7554/eLife.30058.033
-
Transparent reporting form
- https://doi.org/10.7554/eLife.30058.034
Download links
A two-part list of links to download the article, or parts of the article, in various formats.
Downloads (link to download the article as PDF)
Open citations (links to open the citations from this article in various online reference manager services)
Cite this article (links to download the citations from this article in formats compatible with various reference manager tools)
LINE-1 protein localization and functional dynamics during the cell cycle
eLife 7:e30058.
https://doi.org/10.7554/eLife.30058


