Ribosome surface properties may impose limits on the nature of the cytoplasmic proteome
- University of Groningen, Netherlands
Figures
Figure 1
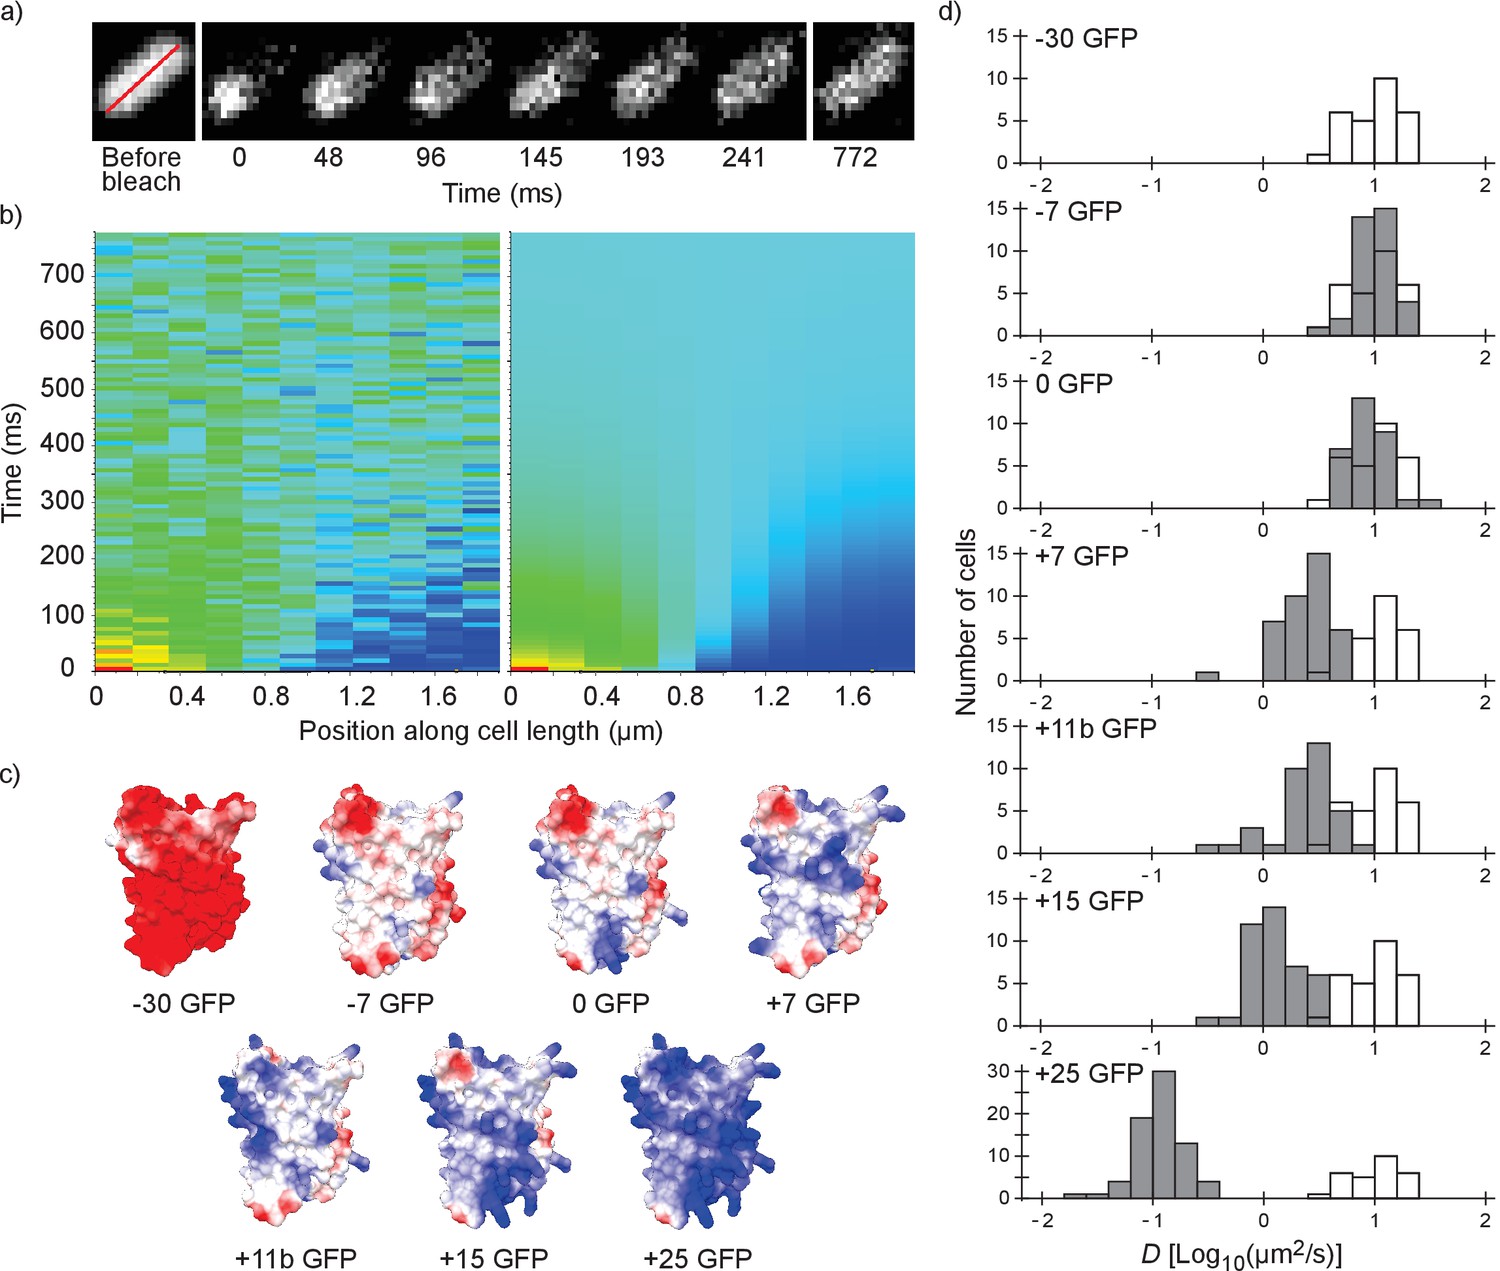
Illustration of the fluorescence recovery after photobleaching (FRAP) method, models of GFP variants and histograms of diffusion coefficients of surface modified variants of GFP in Escherichia coli.
(a) Data from a FRAP experiment. The zero time point is recorded immediately after the bleach. The red line marks the region along which the recovery is analyzed. (b) Fluorescence intensity along the red line in time, for data (left) and the fit to that data (right). The data is fitted with a numerical variant of the 1D diffusion equation. From the fit we obtain the diffusion coefficient. (c) Structural models of the surface-modified GFP variants, based on the superfolder GFP structure (PDBID:2B3P). The colors indicate the charge. The images were generated using UCSF Chimera (Pettersen et al., 2004) and MSMS package (Sanner et al., 1996). (d) Histograms of diffusion coefficients of GFP variants in E. coli over a population of cells. For comparison, the histogram for the −30 GFP variant is shown in white in every plot. P-values are reported in Supplementary file 1C.
Figure 2 with 1 supplement
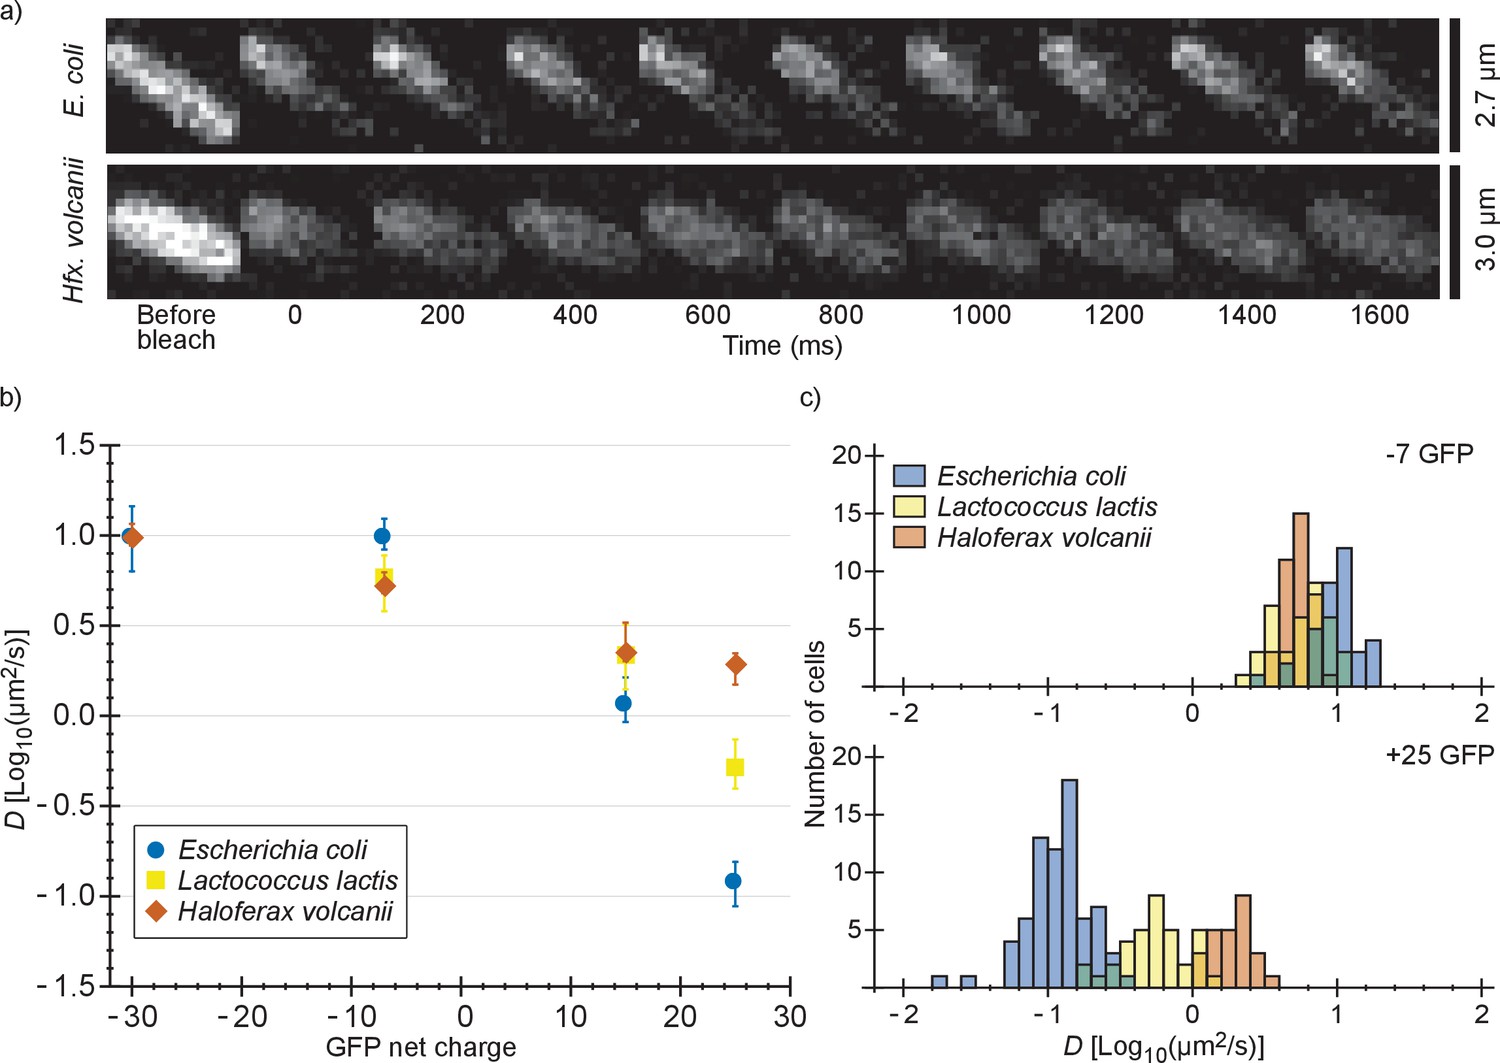
Comparison of diffusion coefficients of surface-modified variants of GFP in E. coli, L. lactis and Hfx. volcanii.
(a) Example FRAP data for E. coli and Hfx. volcanii cells expressing +25 GFP. We chose cells of comparable size so that the diffusion rate can be compared visually. (b) The GFP diffusion coefficient plotted against its net charge in all three organisms. The points indicate medians and the error bars show the interquartile range. P-values are reported in Supplementary file 1C. (c) Histograms of GFP diffusion coefficients for the −7 and +25 variants in all three organisms.
Figure 2—figure supplement 1
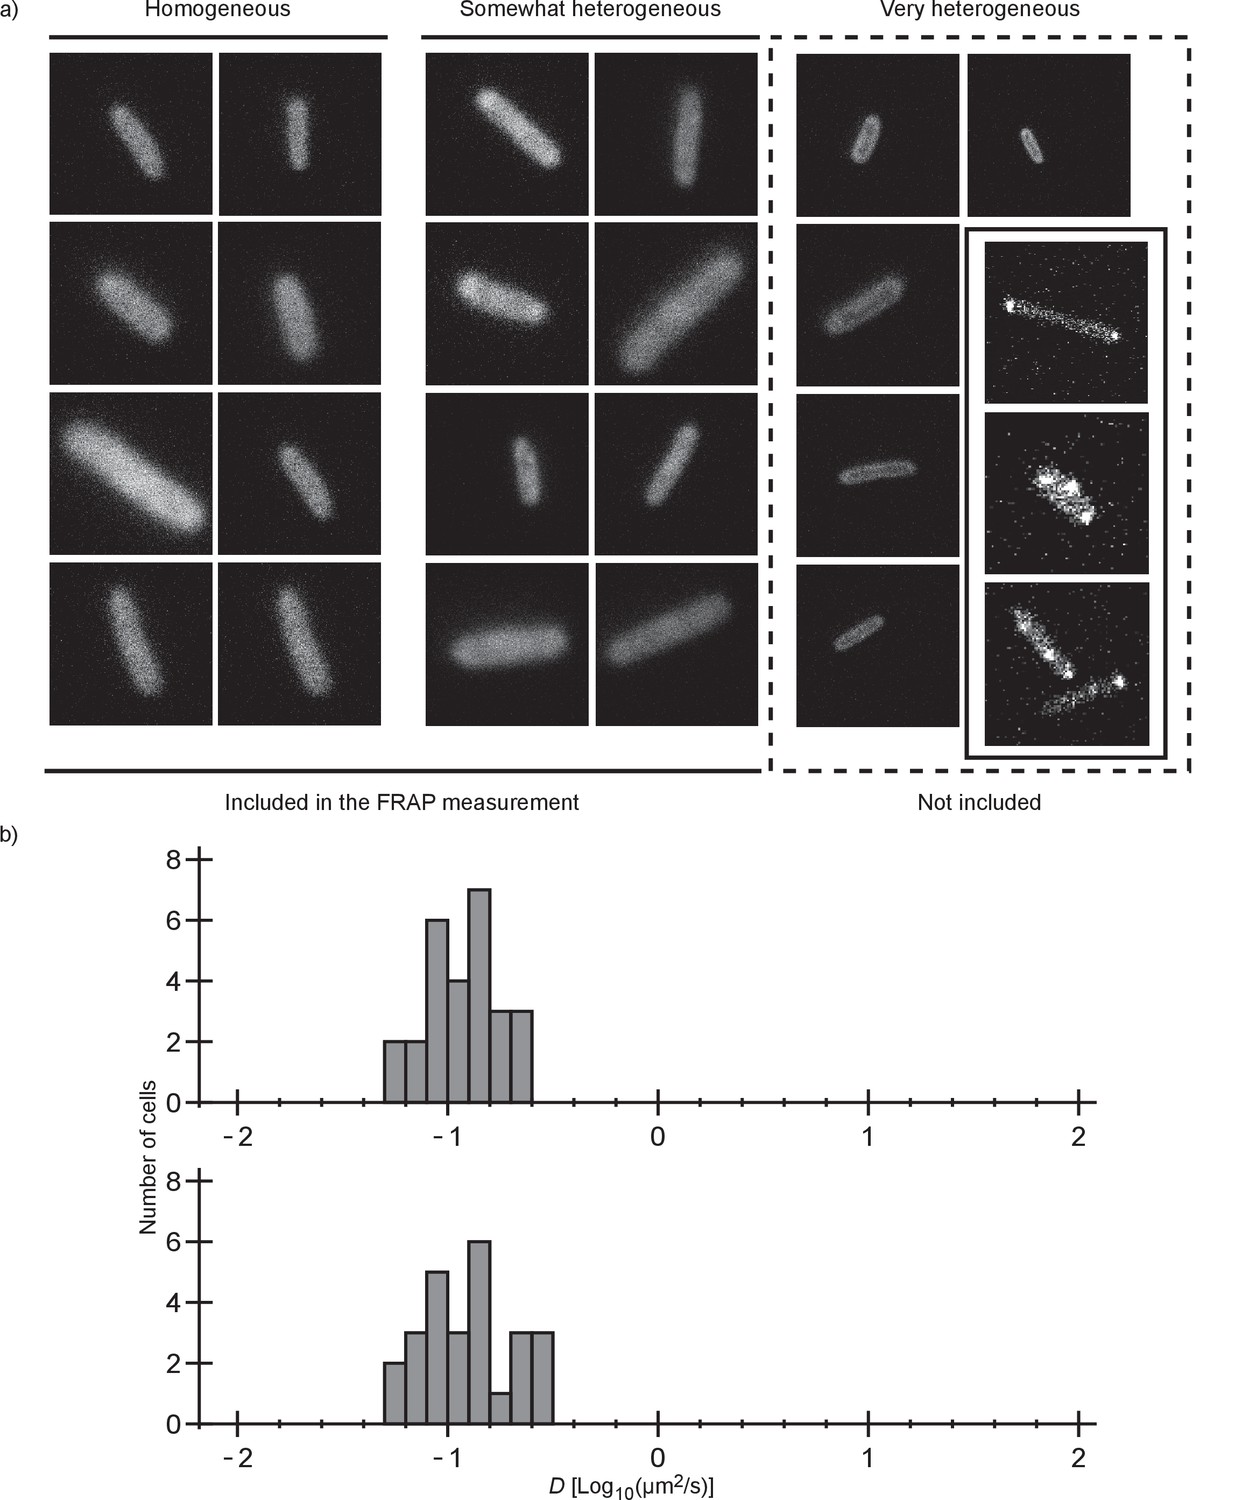
Unequal fluorescence distribution for +25 GFP in E. coli and Hfx. volcanii.
(A) Pictures of E. coli and Hfx. volcanii (in box with solid border) with different degrees of heterogeneity in the distribution of fluorescence. (B) Comparison of diffusion coefficients of +25 GFP in E. coli cells with a homogeneous (top) and a somewhat heterogeneous (bottom) distribution of fluorescence.
Figure 3
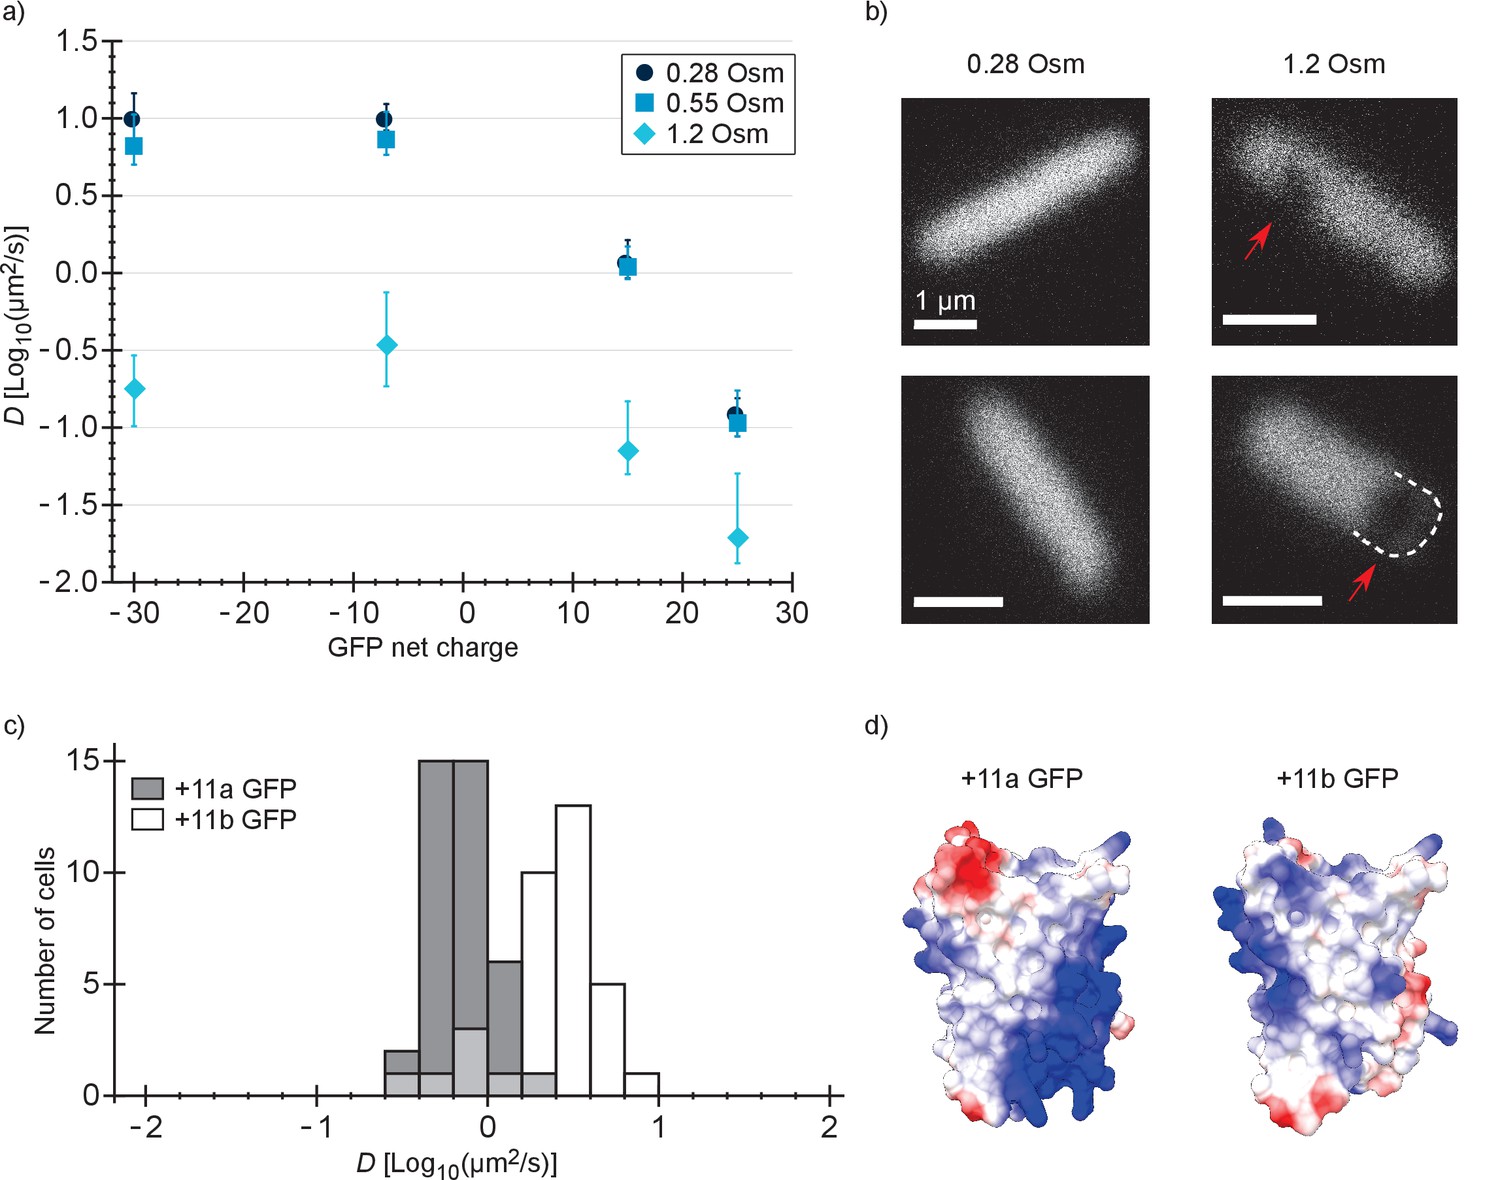
Diffusion coefficients of surface-modified variants of GFP at different osmotic stress and charge distribution effects.
(a) GFP diffusion coefficients as a function of their net charge and degree of osmotic stress in E. coli. The points indicate medians and the error bars show the interquartile range. Discs: E. coli cells resuspended in medium with the same osmolality as the growth medium (0.28 Osm); data from Figure 2b. Squares: cells resuspended in 0.55 Osm; Diamonds: cells resuspended in 1.2 Osm. P-values are reported in Supplementary file 1C. (b) Microscopy images of −7 GFP fluorescence of cells resuspended in 0.28 Osm (left panel) and 1.2 Osm medium osmolality (right panel). Red arrows indicate invaginations which appear after rapid osmotic upshift. Scale bars are 1 µm. (c) Histogram of diffusion coefficients for +11a (grey bars) and +11b GFP (white bars) in E. coli, measured at growth osmolality (0.28 Osm). The FRAP data only includes cells with homogeneous fluorescence. P-values are reported in Supplementary file 1C. (d) Structural models of +11a and +11b GFP variants. The colors indicate the charge distribution; the same protein faces are shown.
Figure 4 with 2 supplements
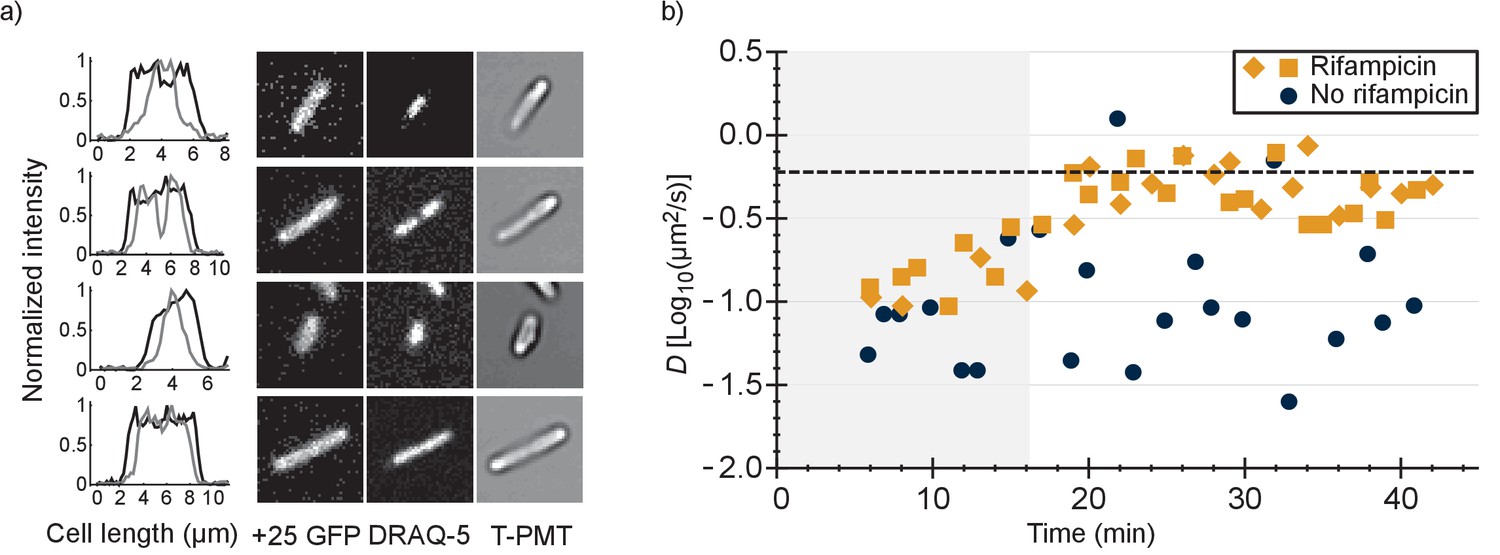
Comparison of distributions of +25 GFP and DNA in E. coli and diffusion of +25 GFP in the presence and absence of mRNA.
(a) Co-localization of +25 GFP and DNA in E. coli. The plots indicate the fluorescence profile for +25 GFP (black) and DNA (grey) along the length of the cell, averaged over a 5 pixel wide band. The images show the corresponding cells in the +25 GFP, DRAQ-5 (DNA) and T-PMT channels. The T-PMT image corresponds to the transmitted excitation light during the recording of the fluorescence (it is equivalent to a bright-field image). (b) Diffusion of +25 GFP in E. coli in the presence and absence of mRNA. At time point zero, DMSO + rifampicin (yellow) or DMSO only (blue) was added to the cells. The squares and diamonds indicate different replicates. The dashed line indicates the diffusion coefficient of the 30S ribosome after the addition of rifampicin. At the transition from the shaded region to the white region, >75% of the mRNA is gone.
Figure 4—figure supplement 1
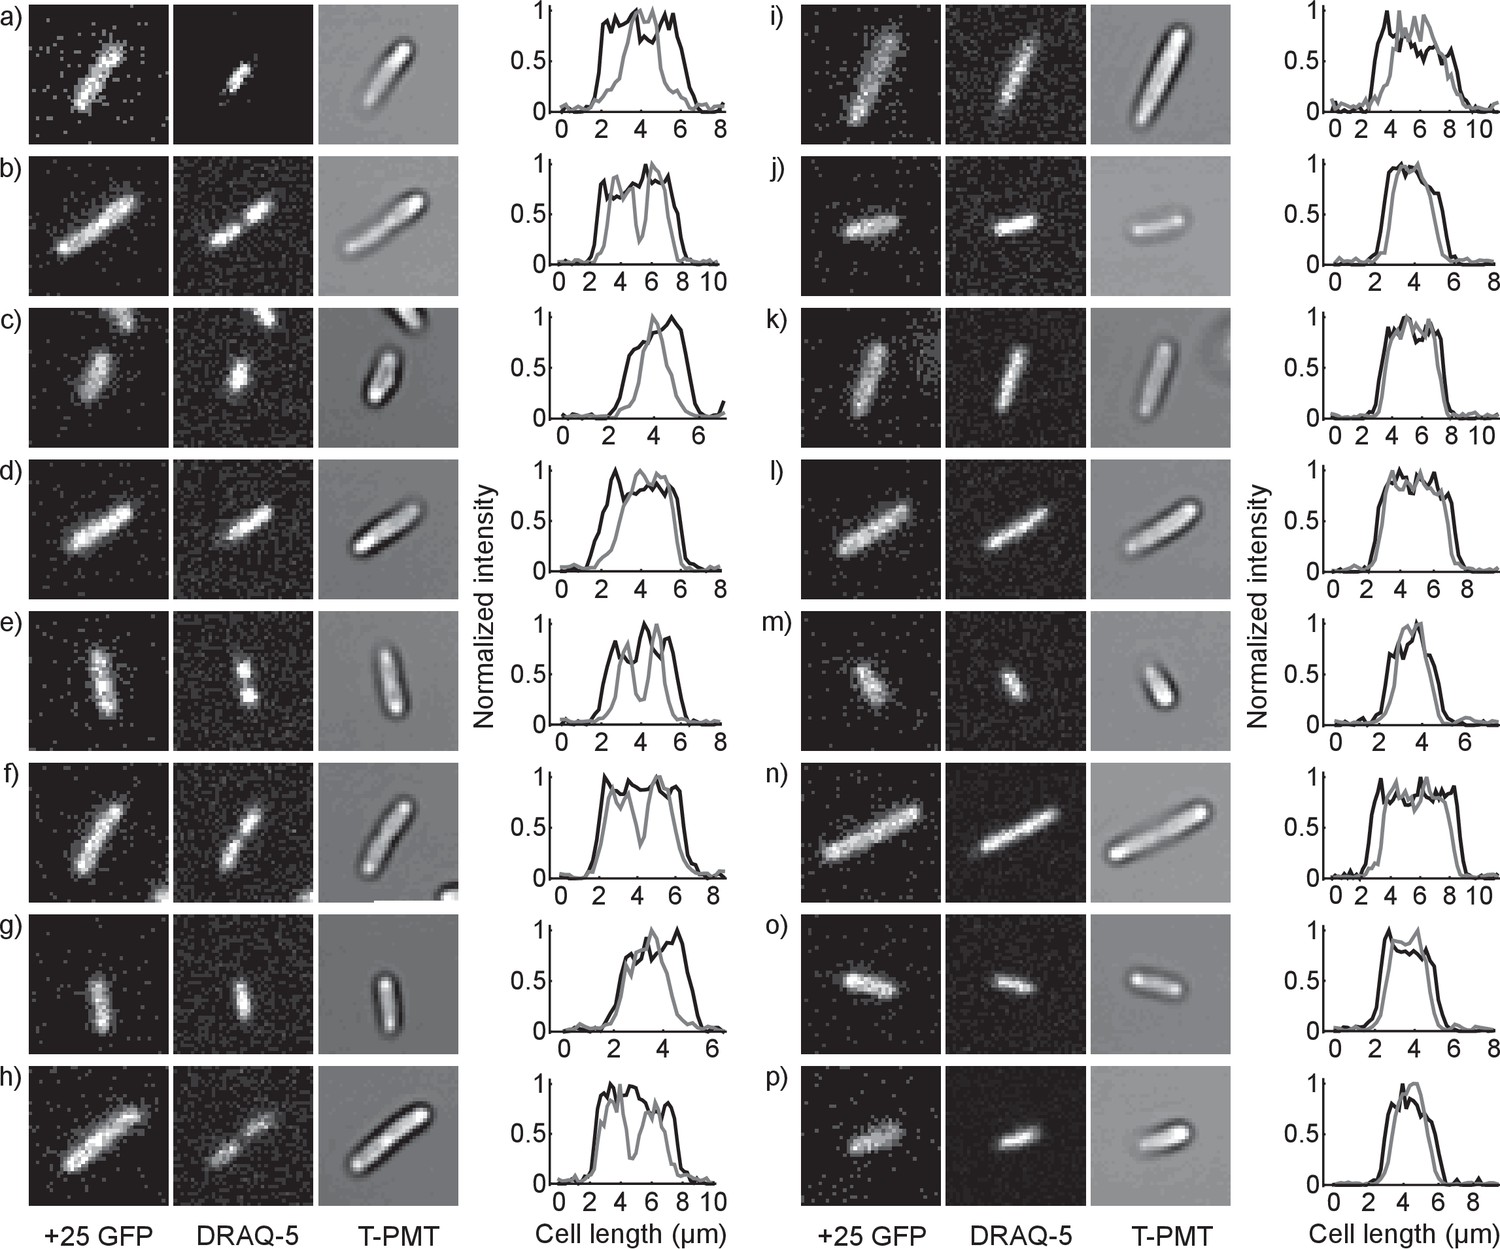
Comparison of distributions of +25 GFP and DNA in E. coli.
DRAQ-5 reports on the presence of DNA. The T-PMT image is constructed from the transmitted excitation light during the recording of the fluorescence (it is equivalent to a bright-field image). The plots indicate the fluorescence profile for +25 GFP (black) and DNA (grey) along the length of the cell, averaged over a five pixel wide band.
Figure 4—figure supplement 2

Diffusion coefficients of −7 and +25 GFP in DNA-containing and DNA-free regions.
To create DNA free regions, E. coli cells were elongated by adding cephalexin, and DNA was condensed by treating the cells with chloramphenicol. (a) Example of a FRAP experiment on treated cells. The line along which the recovery was analyzed was drawn over the highly fluorescent middle part of the cell. (b) Examples of E. coli cells after treatment with cephalexin, chloramphenicol and DRAQ-5. DRAQ-5 visualized DNA and the T-PMT is equivalent to a bright field image. (c) Comparison of histograms of −7 and +25 GFP diffusion coefficients in DNA-containing (same data as in Figure 1d; top panel) and DNA-free regions (bottom panel). (d) Diffusion coefficients of −7 and +25 GFP in treated cells as a function of time. The zero time point indicates when the cells are resuspended in DRAQ-5 free medium right before the FRAP measurements. Each point corresponds to a single cell. Discs, squares, diamonds and triangles indicate different replicates.
Figure 5
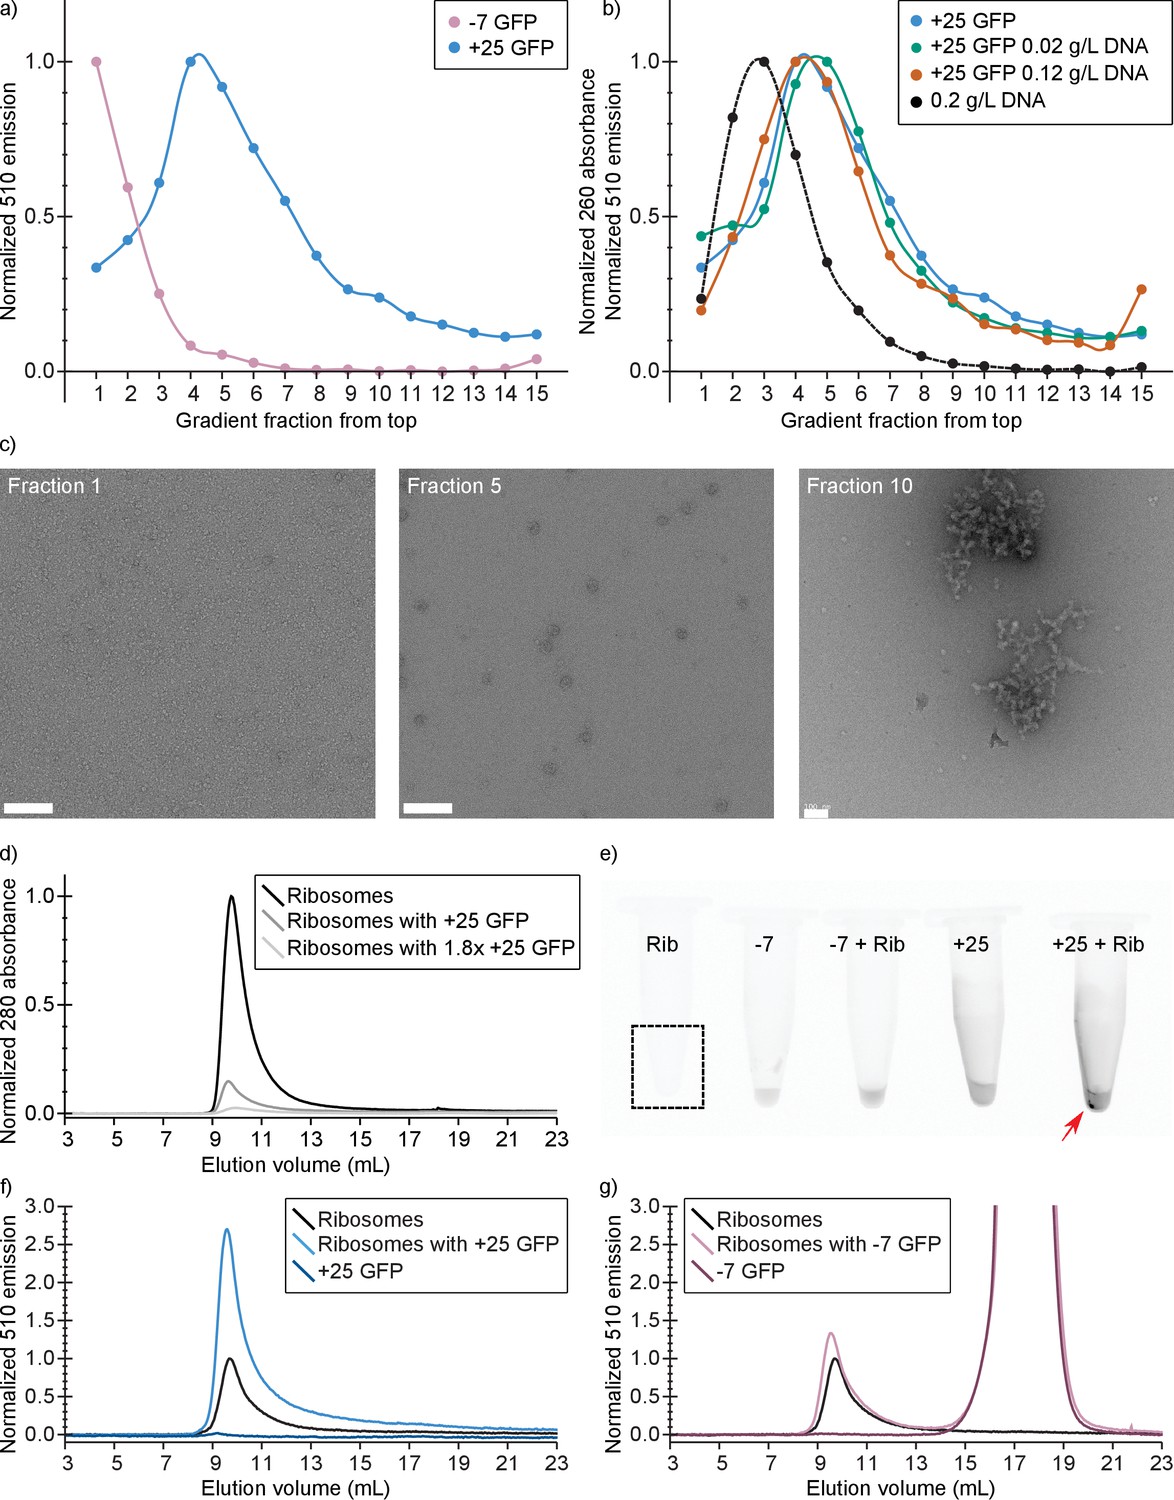
In vitro experiments show that +25 GFP associates with ribosomes.
(a) Comparison of fluorescence profiles of sucrose gradient centrifugation experiments performed on E. coli cell lysates containing either −7 or +25 GFP. The majority of −7 GFP is present in the loaded sample (fractions 1 and 2), while +25 GFP peaks at fractions 4–5, corresponding to 15–18% (w/v) sucrose. The fluorescence signals were normalized to the highest value, because the absolute fluorescence of +25 GFP is lower than that of −7 GFP. (b) Comparison of fluorescence (and absorption) profiles of sucrose gradient centrifugation experiments performed on purified DNA (0.2 g/L), and E. coli cell lysates containing +25 GFP with or without additional DNA. (c) Transmission electron microscopy images of uranyl acetate-stained fractions from the cell lysate containing sucrose gradients. Fraction one lacks distinct large structures, whereas fraction 10 shows large aggregates. Ribosomes, spheres of around 25–30 nm diameter, are visible and peak in fraction 5. The scale bar is 100 nm. (d) Elution profiles on a Sephadex 200 of pure ribosomes, ribosomes with +25 GFP, and ribosomes with 1.8x as much +25 GFP, measured as absorbance at 280 nm (e) Fluorescence imaging of tubes containing ribosomes, −7 GFP, ribosomes mixed with −7 GFP, +25 GFP, and ribosomes mixed with +25 GFP. The indicated fluorescent pellet appears after centrifuging the samples. The tube containing only ribosomes is not visible due to lack of fluorescence. (f) Elution profiles of ribosomes, +25 GFP, and ribosomes mixed with +25 GFP, measured as fluorescence at 510 nm; the excitation wavelength was 488 nm. The higher fluorescence of ribosomes mixed with +25 GFP is accompanied by decrease in absorbance at 280 nm; (g) Elution profiles of ribosomes, −7 GFP, and ribosomes mixed with −7 GFP, measured as fluorescence at 510 nm; the excitation wavelength was 488 nm. Unlike for +25 GFP, when ribosomes are mixed with −7 GFP the absorbance at 280 nm remains the same (data not shown).
Figure 6 with 1 supplement
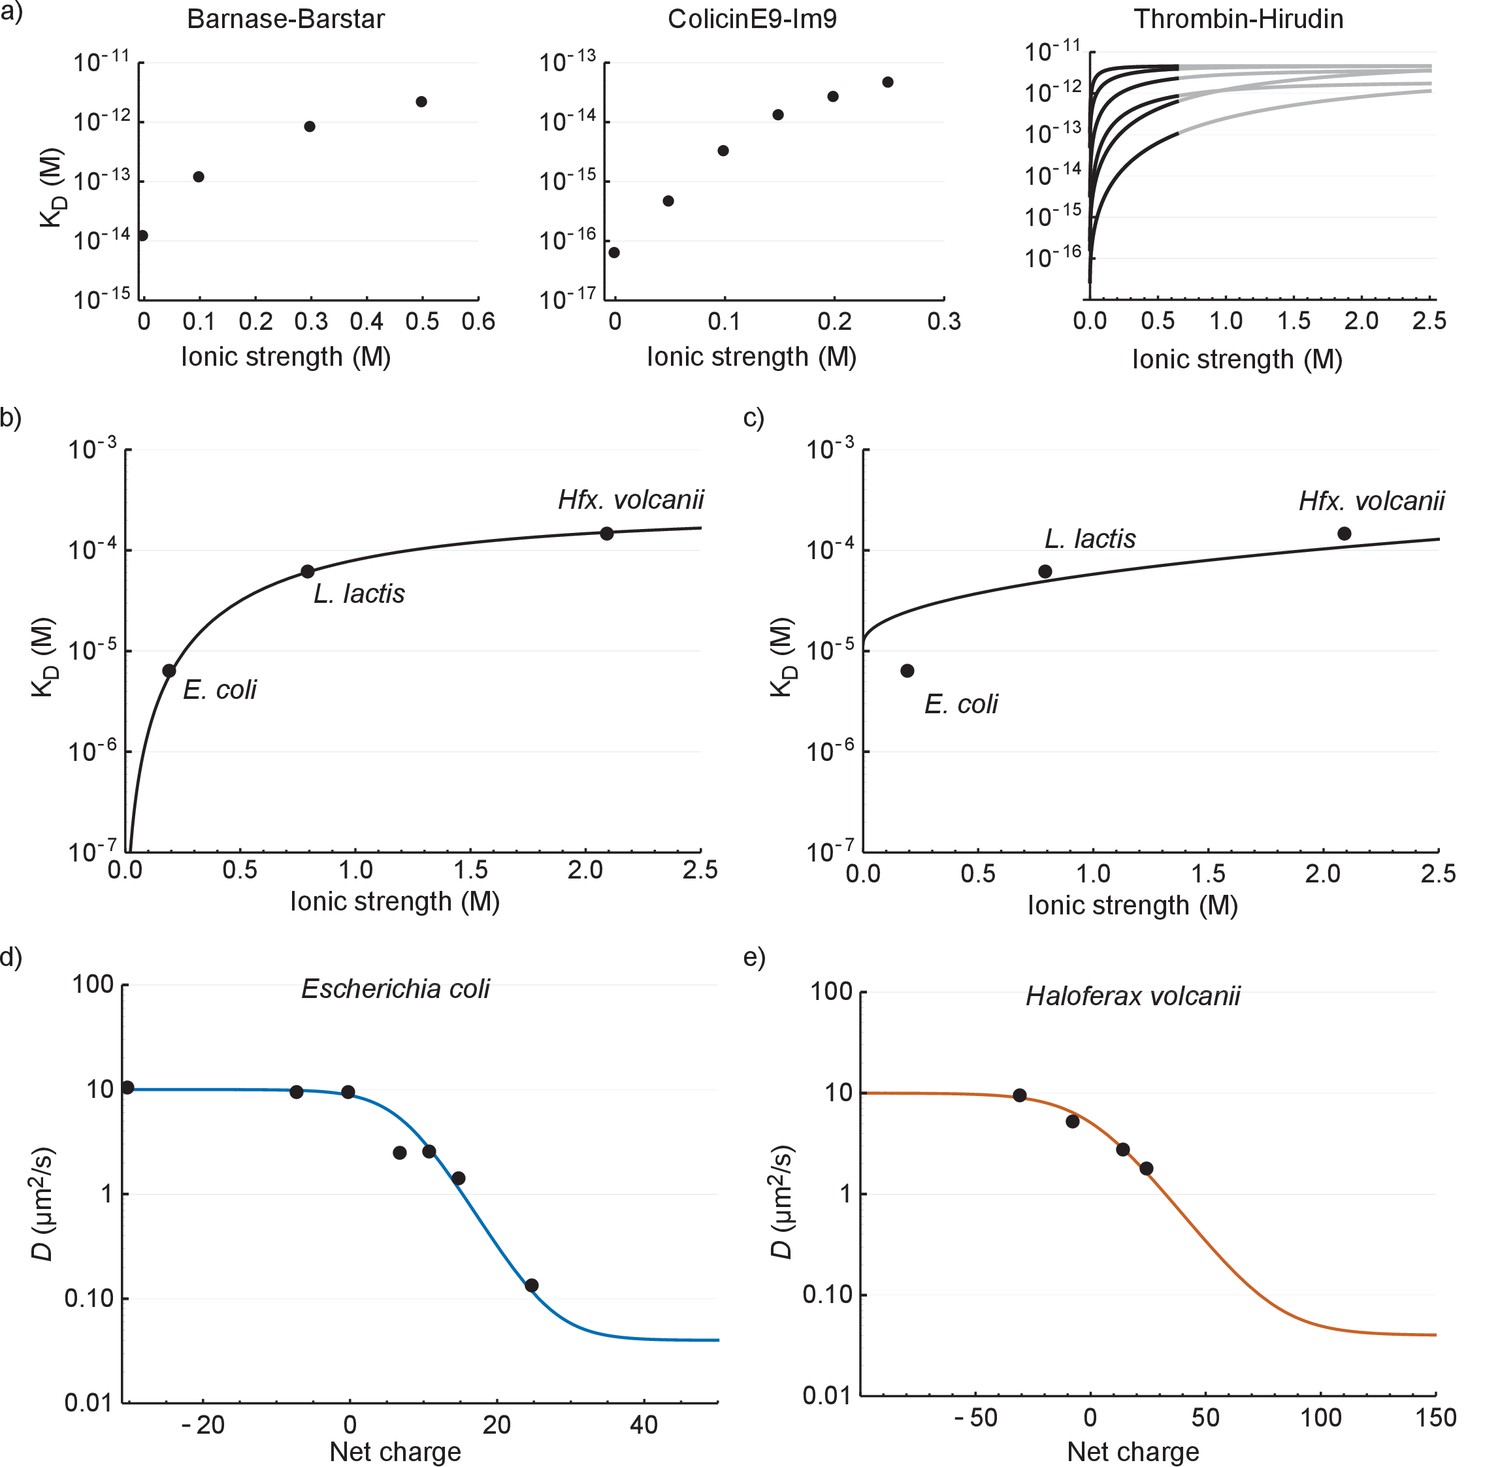
The relation between the diffusion coefficient, net charge and ionic strength.
(a) The dependence of dissociation coefficients on ionic strength for protein binding pairs barnase-barstar, colicinE9-Im9, and different variants of hirudin binding to thrombin. The data from the literature was in the form of and and we used to determine the affinity constants. For the thrombin-hirudin interactions we show fits with a combination of Equations (3) and (4). The black part spans the data, the grey part is an extrapolation. The charge on hirudin decreases from the bottom to the top line (at the black part). (b) The dependence of dissociation coefficients on ionic strength for +25 GFP. The black line is a fit with a combination of Equations (3) and (4). (c) Same data as in (b) but with the non-ionic contribution to the binding free energy fixed at zero during fitting. (d) The dependence of diffusion coefficient on GFP net charge for E. coli. The line is a fit with Equation 5. We did not include +11a GFP because of its different charge distribution. (e) The dependence of diffusion coefficient on GFP net charge for Hfx. volcanii. The line is a fit with Equation 5.
Figure 6—figure supplement 1

Fraction of free GFP variants in E. coli, L. lactis and Hfx. volcanii.
Using the data from Figure 2b we calculated the fraction of GFP bound to ribosomes. a) The fraction of free GFP variants as a function of ribosome diffusion coefficient. b) The fraction of free GFP variants as a function of GFP net charge.
-
Figure 6—figure supplement 1—source data 1
Free fraction of GFP variants in E. coli, L. lactis and Hfx. volcanii.
- https://doi.org/10.7554/eLife.30084.013
Figure 7 with 2 supplements
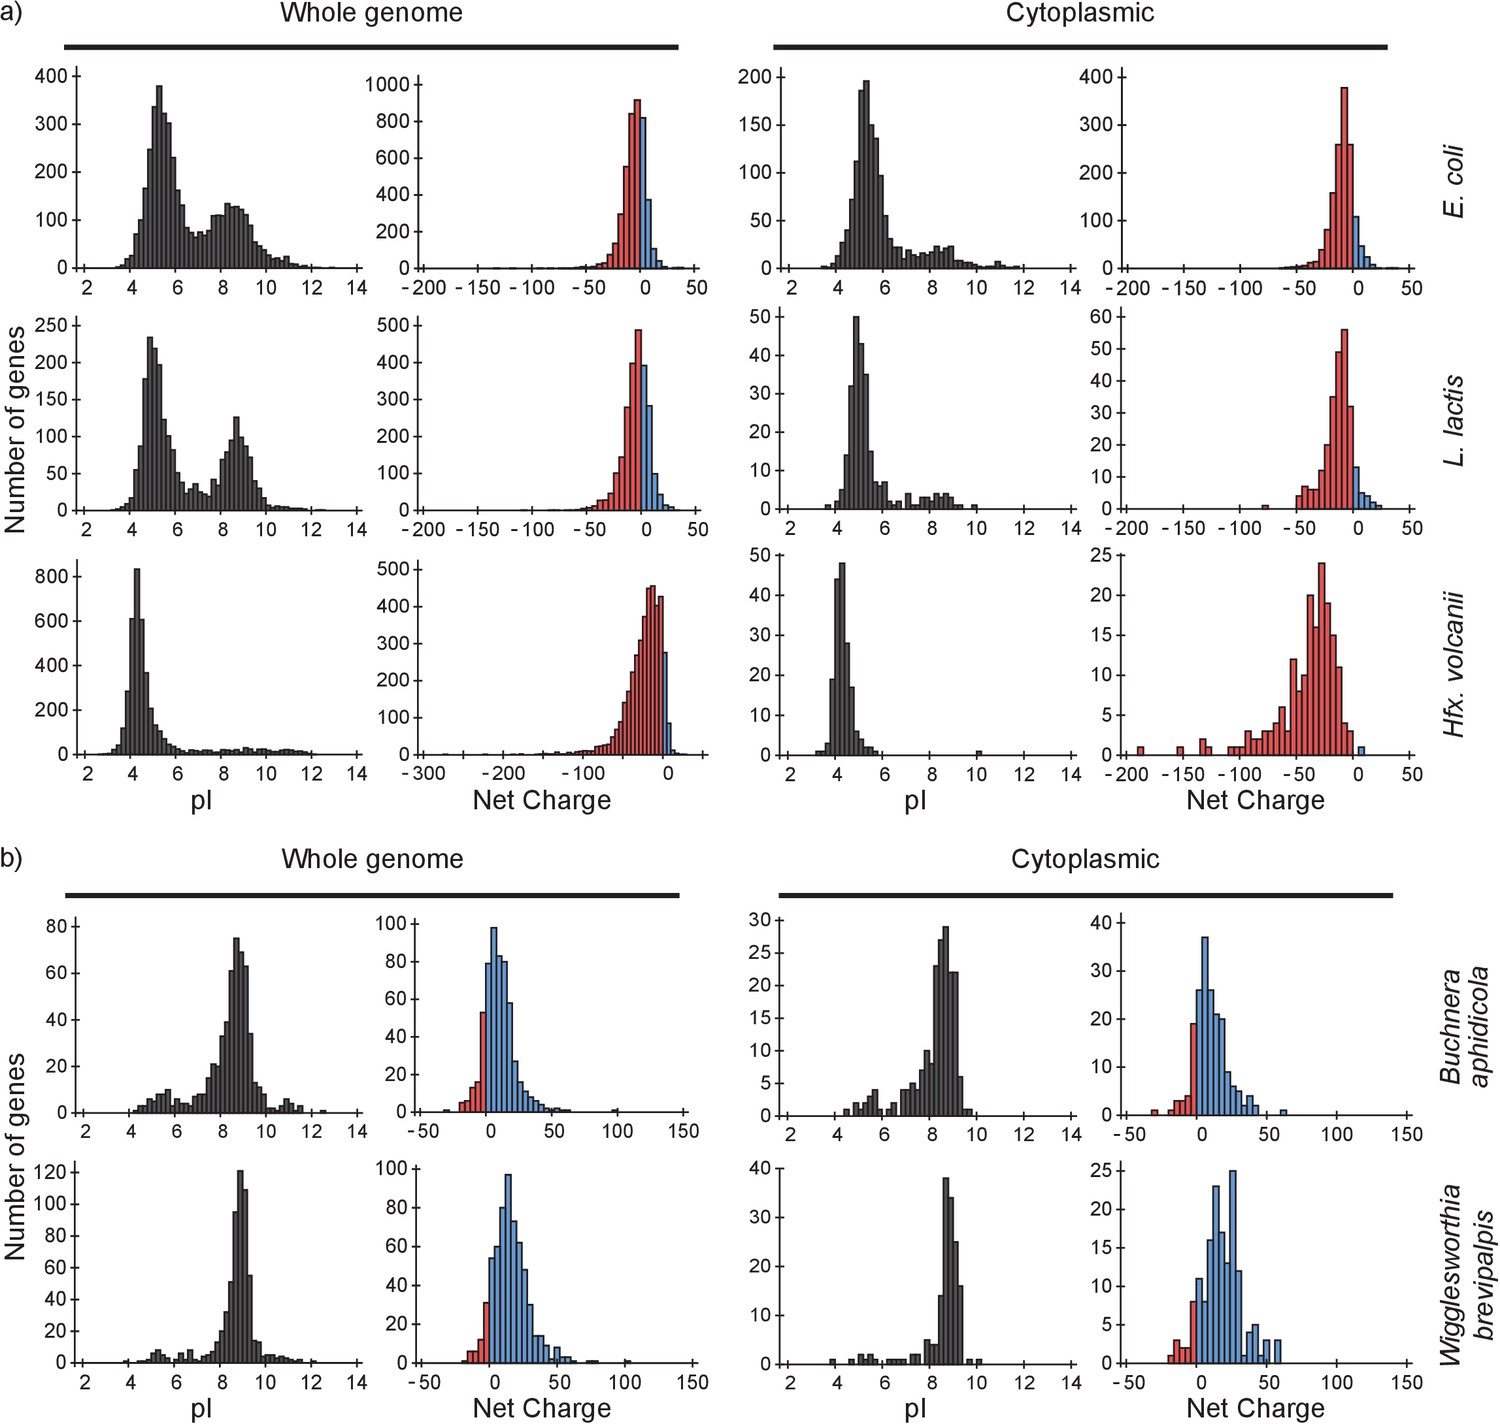
pI and net charge distributions for proteins of E. coli, L. lactis, Hfx. volcanii, Buchnera aphidicola and Wiggleworthia glossinidia brevipalpis.
The histograms show the number of genes that encode proteins with given pI and net charge. We show distributions over all genes (left panels) and over genes that encode cytoplasmically localized proteins (right panels). (a) E. coli, L. lactis, and Hfx. volcanii; (b) the two symbionts, Buchnera aphidicola and Wiggleworthia glossinidia brevipalpis, that have the most positive proteomes (from the four symbionts that we analysed). We used gene ontology annotations from the UniProt database to find the cytoplasmic proteins. In all cases we assumed a pH of 7.5 for calculating the net charge. The symbionts were selected based on pI profiles from (Kiraga et al., 2007).
Figure 7—figure supplement 1

pI and net charge distributions for the E. coli proteome, taking into account protein abundance.
(a) Histograms of the number of genes that encode proteins with given pI (left panel) or net charge (right panel) that are located in the cytoplasm of E. coli. (b) Histograms of the number of protein copies with given pI (left panel) or net charge (right panel) that are located in the cytoplasm of a single E. coli cell. We used a pH of 7.5 to calculate the net charge.
Figure 7—figure supplement 2

Protein pI and net charge distributions for Buchnera aphidicola, Blochmannia floridanus, Onion yellows phytoplasma, and Wigglesworthia glossinidia brevipalpis.
Histograms of number of genes that encode for proteins with given pI and net charge. Left panel: the whole proteome; right panel: cytoplasmic proteome. In all cases we assumed a pH of 7.5 for calculating the net charge.
Figure 8
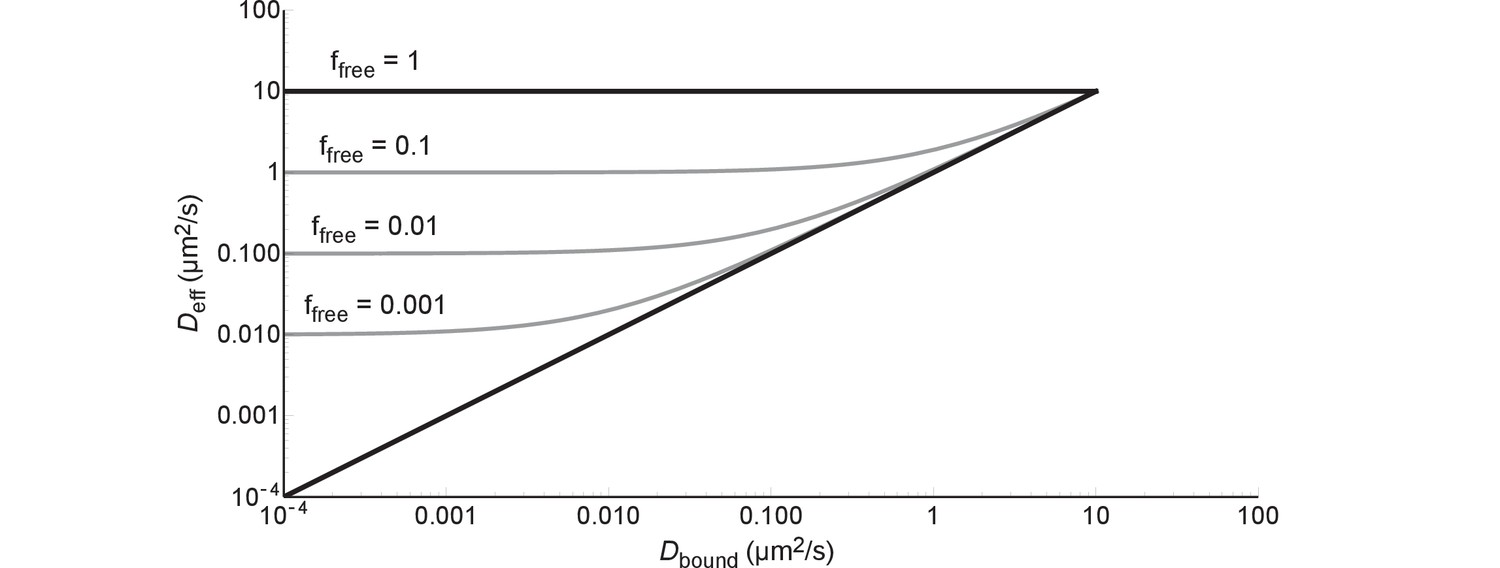
The effective diffusion coefficient as a function of free fraction and the diffusion coefficient of the bound complex.
All lines are generated with Equation (6) and = 10 µm2/s.
Additional files
-
Supplementary file 1
GFP sequences and diffusion coefficients
(A) Amino acid sequences of the GFP variants. (B) Diffusion coefficients in E. coli, L. lactis and Hfx. volcanii. (C) P-values for pairwise comparisons of diffusion coefficients for GFP variants in E. coli (Eco), L. lactis (Lla), and Hfx. volcanii (Hvo). For E. coli we also compared diffusion coefficients under normal (0.28 Osm) and shock conditions (1.2 Osm). (D) Fitting parameters for the relation between diffusion coefficient, GFP net charge, and ionic strength.
- https://doi.org/10.7554/eLife.30084.018
-
Transparent reporting form
- https://doi.org/10.7554/eLife.30084.019
Download links
A two-part list of links to download the article, or parts of the article, in various formats.
Downloads (link to download the article as PDF)
Open citations (links to open the citations from this article in various online reference manager services)
Cite this article (links to download the citations from this article in formats compatible with various reference manager tools)
Ribosome surface properties may impose limits on the nature of the cytoplasmic proteome
eLife 6:e30084.
https://doi.org/10.7554/eLife.30084


