Independent manipulation of histone H3 modifications in individual nucleosomes reveals the contributions of sister histones to transcription
- Shanghai Institute of Biochemistry and Cell Biology, University of Chinese Academy of Sciences, Chinese Academy of Sciences, China
- Shanghai Institutes for Biological Sciences, Chinese Academy of Sciences, China
- Shanghai Tech University, China
Figures
Figure 1 with 1 supplement

The complementary mutants of histone H3A110D and H3L130H are assembled into nucleosomes in vivo.
(A) Schematic illustration of the production of histone H3 mutants that are able to complement and form heterodimers. (B and D) Schematic strategy for screening histone H3 mutants. Genomic HHF1, HHF2 (encoding histone H4), HHT1 and HHT2 (encoding histone H3) genes were knocked out, and yeast cells (LHT001 background) were transformed with plasmids expressing wild-type (WT) or mutated histone H3 along with WT H4. (C) Histone H3 mutants cannot survive without WT histone H3. Dotting assay was performed to examine the cell viability of WT cells (LHT001) and 15 histone H3 mutants carrying pRS313-hht1a/b (HIS3 marker). (E) H3A110D and H3L130H mutants can form a heterodimer. Mutants carrying both pRS313-hht1a (HIS3 marker) and pRS314-hht1b (TRP1 marker) were dotted on a 5-fluoroorotic acid (5-FOA) plate. WT and mutants that survived on 5-FOA plate are highlighted in red.
Figure 1—figure supplement 1
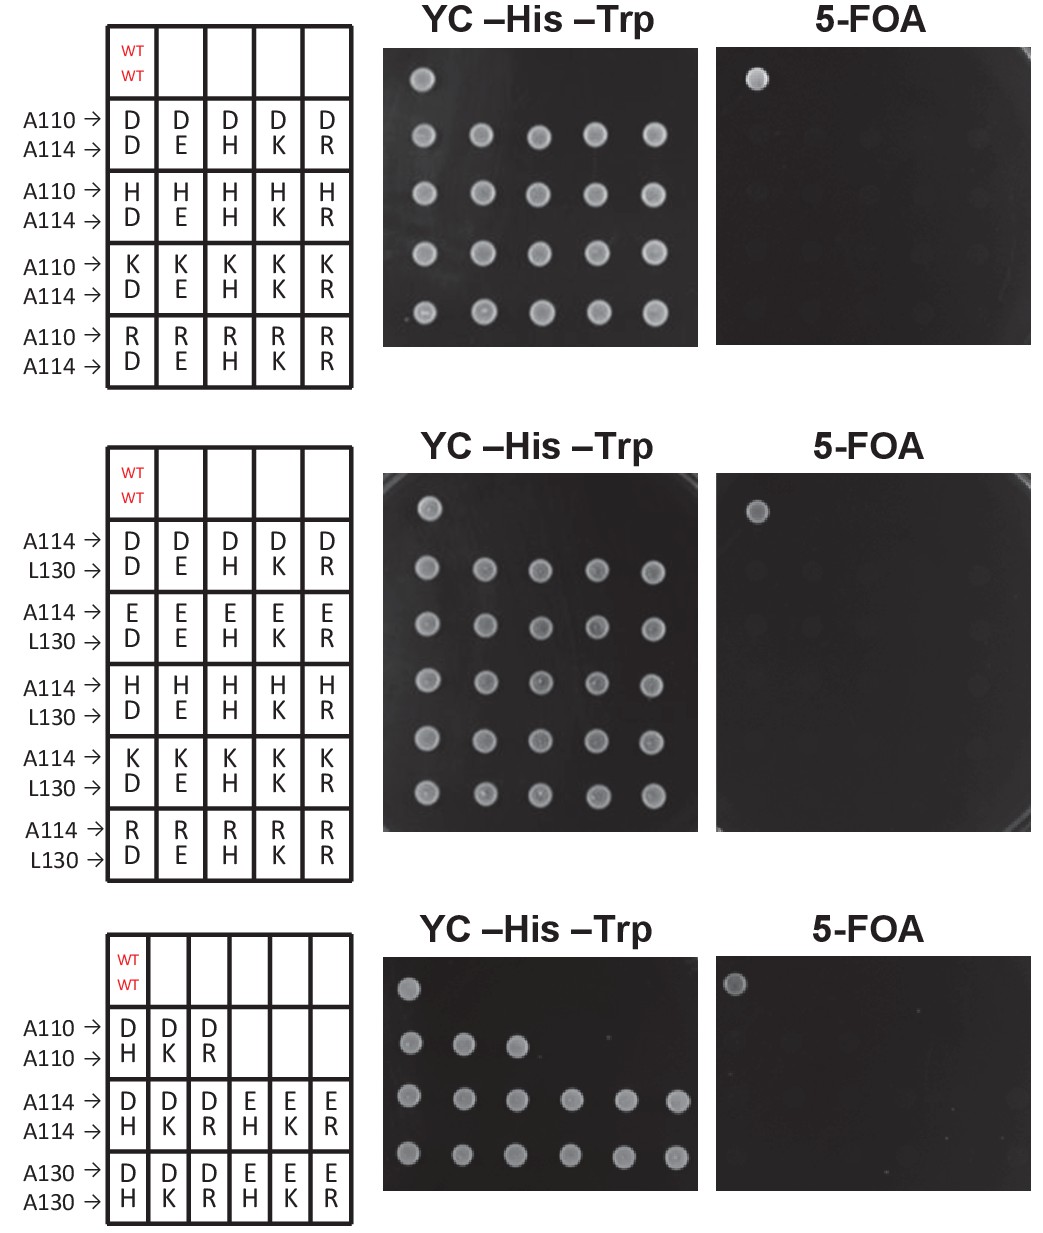
The pairwise histone H3 mutants other than H3A110D and H3L130H cannot grow when the WT histone H3 gene is counter-selected using 5-FOA.
A dotting assay was performed as in Figure 1E. The wild-type strain (LHT001) that survived on the 5-FOA plate is highlighted in red.
Figure 2 with 2 supplements
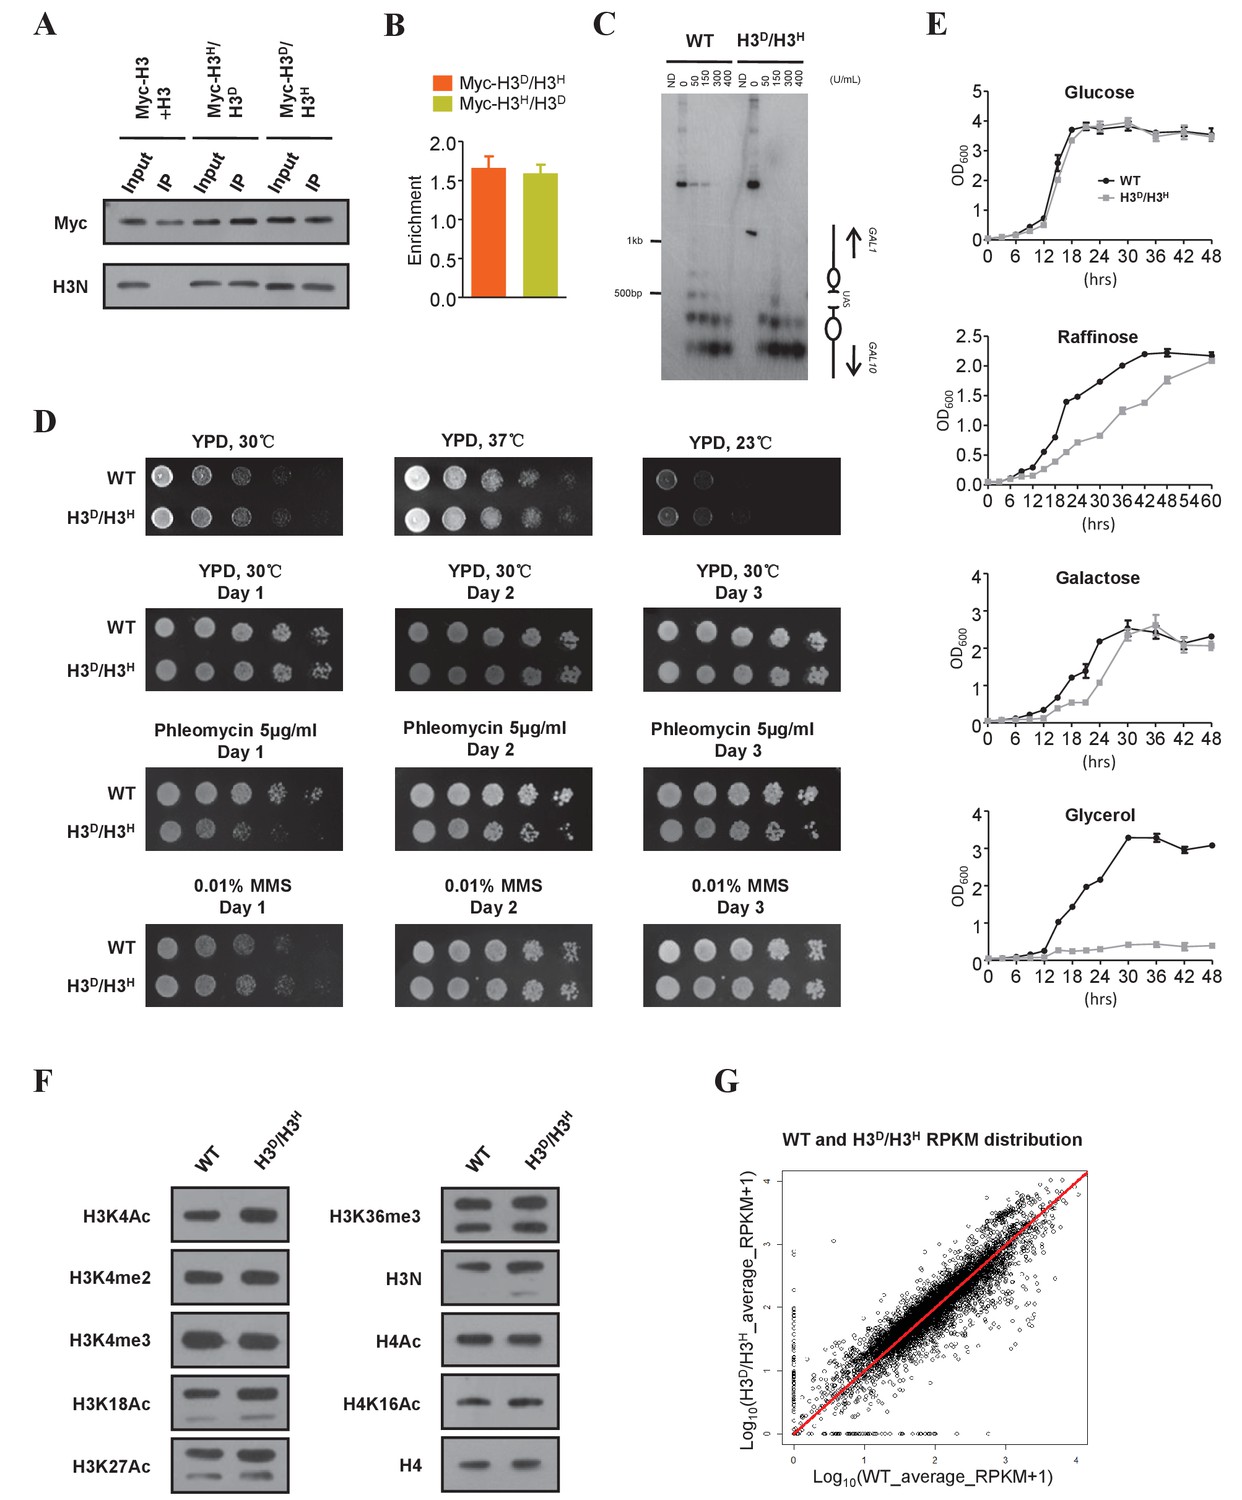
Characterization of the H3D/H3H strain.
(A) Mononucleosomes prepared from both the cells expressing Myc-tagged H3 (ZL38) and the cells expressing untagged H3 (LHT001) were mixed (Myc-H3 +H3) and immunoprecipitated with the anti-Myc antibody. The same immunoprecipitation (IP) assay was performed with mononucleosomes from strains bearing Myc-H3L130H/H3A110D (Myc-H3H/H3D) and Myc-H3A110D/H3L130H (Myc-H3D/H3H). The precipitated mononucleosomes were denatured and examined by western blotting with both anti-Myc (Myc) and anti-histone H3 N-terminal antibodies (H3N). (B) Chromatin IP (ChIP) analysis was performed in Myc-H3A110D/H3L130H (Myc-H3D/H3H) and Myc-H3L130H/H3A110D (Myc-H3H/H3D) cells using anti-Myc antibody. The precipitated DNA was analyzed by qRT-PCR with primers specific for the GAL1-10 gene promoter and normalized to the ACT1 gene. Error bars indicate s.e.m. for three independent experiments. (C) MNase digestion of nuclei from WT (LHT001) and H3D/H3H strains. Nuclei were digested with increasing concentrations of MNase for 4 min. MNase cleavage sites were mapped from the EcoRI site within GAL10 by indirect end labeling analysis on a 1.6% agarose gel. Marker fragments are from PCR products of 1 kb and 500 bp in length. The UAS region and nucleosome positions are schematically shown on the right. ND, naked DNA. (D) Dotting assays were performed in H3D/H3H mutant and WT (LHT001) cells. Plates were photographed after incubation at 37°C, 30°C and 23°C on yeast extract peptone dextrose (YPD) medium or after incubation at 30°C on YPD, YPD containing phleomycin and YPD containing MMS on Days 1, 2 and 3. (E) Growth curve assays were performed in H3D/H3H mutant and WT cells for the indicated time in medium containing different carbon sources. (F) Yeast chromatins extracted from WT (LHT001) and H3D/H3H strains were monitored by western blot analysis with antibodies against H3K4ac, H3K4me2, H3K4me3, H3K18ac, H3K27ac, H3K36me3, H3N (H3 N-terminal), H4ac, H4K16ac and H4. Signals are normalized by anti-H4 antibody. (G) Scatter plot showing the average Reads Per Kilobase per Million mapped reads (RPKM) of two replicates distribution of the WT (LHT001) and H3D/H3H strains. The Pearson's product-moment correlation of Log10(WT_average_RPKM +1) and Log10(H3D/H3H _average_RPKM +1) is 0.9236. The red line is the fitted curve, which has a slope of 0.9966 and which passes through the (0,0) point. R-square is 0.98 and p value≤2.2e-16 (see Materials and methods for details).
-
Figure 2—source data 1
Characterization of the H3D/H3H strain.
- https://doi.org/10.7554/eLife.30178.008
-
Figure 2—source data 2
Analysis of RNA-Seq data.
- https://doi.org/10.7554/eLife.30178.009
Figure 2—figure supplement 1

Mononucleosome preparation from H3D/H3H cells.
(A) Mononucleosomes were prepared from H3D/H3H cells, and purified by fast protein liquid chromatography. Molecular standards are labeled above the elution profile. (B) Fractions around the peak fractions (No. 14 to 31) were collected and denatured. The length of DNA was analyzed in a 2% agarose gel. Size markers are on the left. (C) Histone H3 in the fractions (labeled on top) was examined by western blotting using the anti-H3 N-terminal antibody. Fraction 26 was selected as mononucleosomes for further experiments.
Figure 2—figure supplement 2

Sample-to-sample reproducibility for the RNA-Seq assay of WT (LHT001) and H3D/H3H strains.
(A) The scatter plot shows the FPKM distribution for the two WT replicates. The Pearson's product-moment correlation for WT_rep1 and WT_rep2 is 0.9907. The red line is the fitted curve, which has a slope of 0.8711 and which passes through the (0,0) point. R-square is 0.9823 and p value≤2.2e-16. (B) Scatter plot showing the FPKM distribution for the two H3D/H3H's replicates. The Pearson's product-moment correlation for H3D/H3H_rep1 and H3D/H3H_rep2 is 0.9913. The red line is the fitted curve, which has a slope of 0.9875 and which passes through the (0,0) point. R-square is 0.9846 and p value≤2.2e-16.
Figure 3
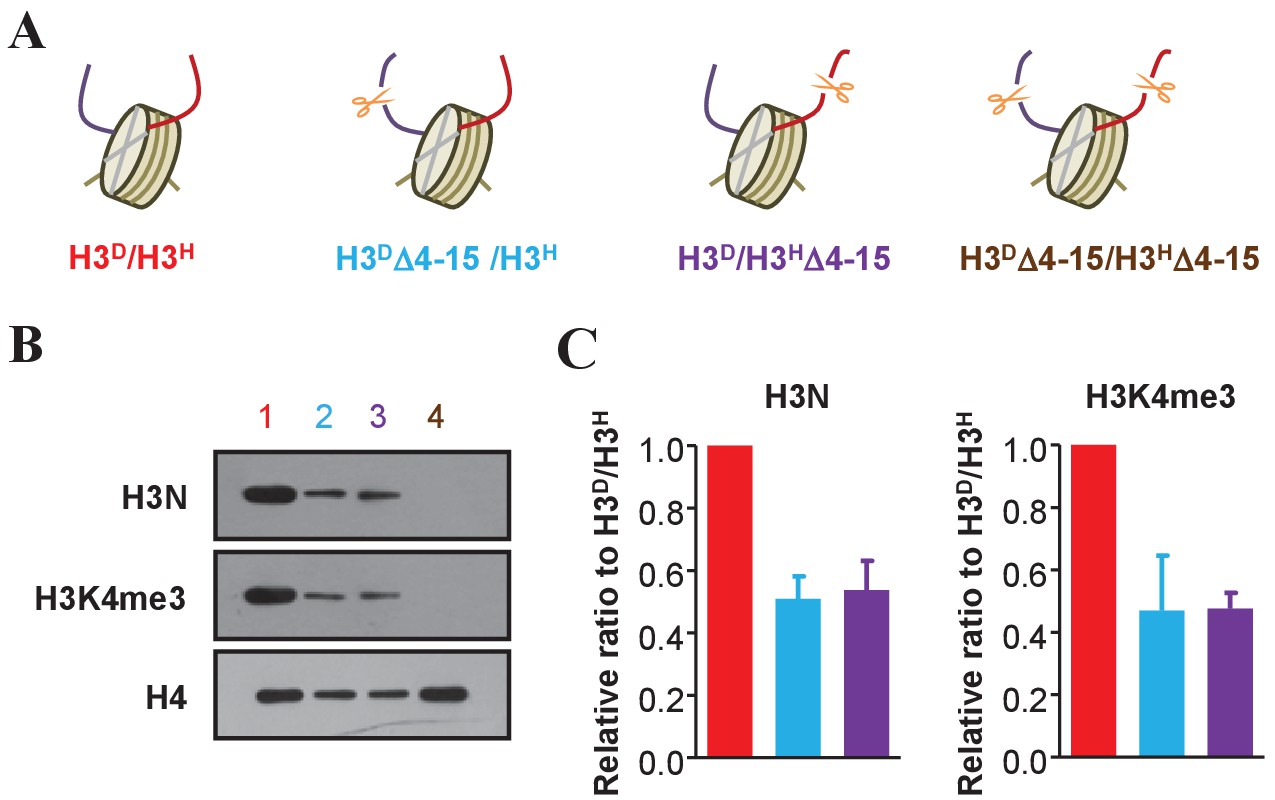
Examination of an asymmetric deletion in the N-terminus of histone H3.
(A) Schematic illustration of asymmetrical N-terminal-deleted histone H3 mutants of H3DΔ4–15/H3H, H3D/H3HΔ4–15 and H3DΔ4–15/H3HΔ4–15 derived from the H3D/H3H strain. The genotype of each mutant is labeled in a different color, and these colors are applied to identify each mutant in all the panels in this figure. (B) Asymmetric H3 N-terminal-deletion is successfully established on chromatin. Nucleosomes were immunoprecipitated by the anti-H2B antibody from cells of the yeast strains in (A) and analyzed by western blotting using the anti-H3 N-terminal antibody, the anti-H3K4me3 antibody and, as a normalization, the anti-H4 antibody. (C) Quantification of the H3N and H3K4me3 signals in (B) as mean ratio relative to H3D/H3H and normalized to H4 signals. (See the Materials and methods for quantification details.)
-
Figure 3—source data 1
Examination of an asymmetric deletion in the N-terminus of histone H3.
- https://doi.org/10.7554/eLife.30178.011
Figure 4
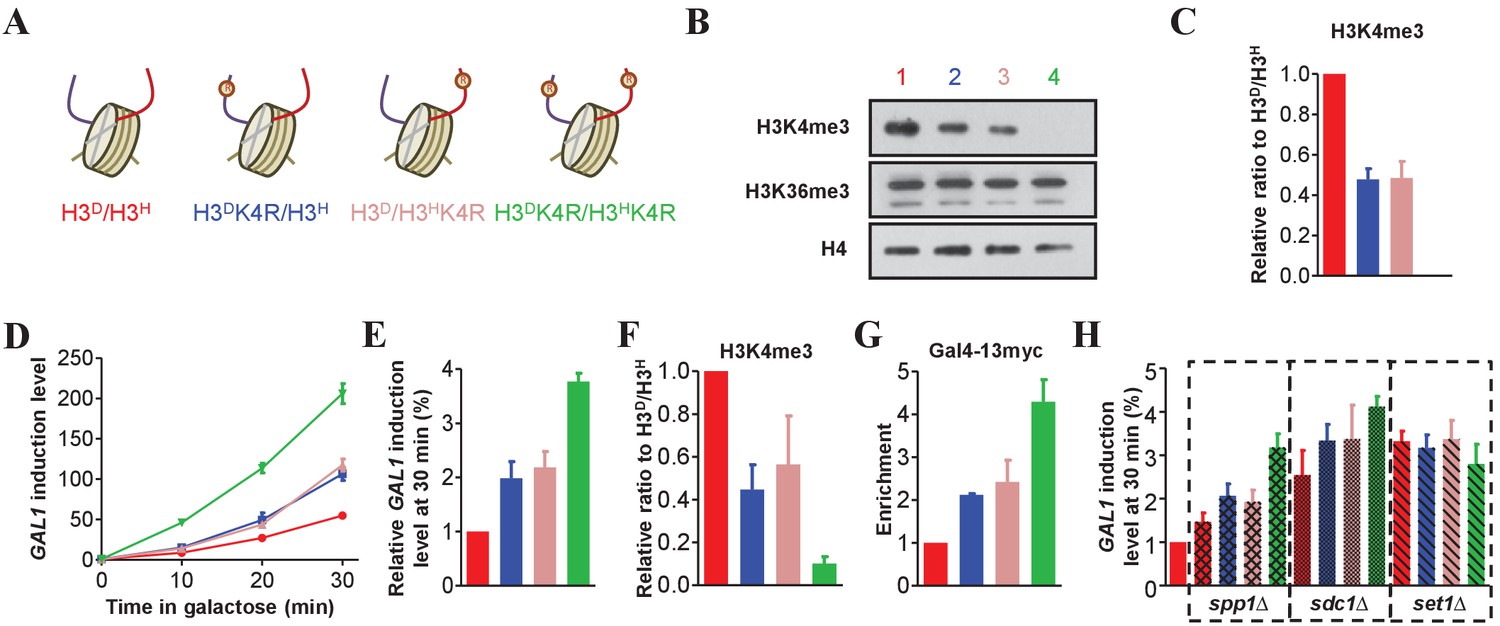
Asymmetrically methylated K4 on sister H3s independently upregulates GAL1 transcription efficiency.
(A) Schematic illustration of asymmetrical mutation of histone H3K4R on either H3A110D (H3D) or H3L130H (H3H). The K to R mutation is marked by ® on the histone H3 tails. The color labeling of each strain is applied for all the corresponding panels. (B) Asymmetrical K4me3 marks on sister H3s are successfully established on chromatin. Nucleosomes were immunoprecipitated by the anti-H2B antibody from isogenic strains and analyzed by western blotting using anti-H3K4me3, anti-H3K36me3 and, as a normalization, anti-H4 antibodies. (C) Quantification of western blotting signals for H3K4me3 as mean ratio relative to H3D/H3H and normalized to signals for H4. (D) The cells with asymmetrical sister K4me3 show an intermediate level of GAL1 gene expression. Yeast strains illustrated in (A) were subject to galactose induction. Total RNA was prepared at the indicated time points and analyzed by real-time quantitative PCR (qRT-PCR) with primers specific for GAL1 and normalized by ACT1. (E) An alternative representation of the data in (D) at 30 min is expressed as mean ratio to H3D/H3H, whose level was set to 1. (F) Asymmetric K4me3 on sister H3s is established in GAL1. ChIP experiments were performed on the promoter of GAL1 in the indicated yeast strains using the anti-H3K4me3 antibody, and values are normalized to histone H4. (G) The levels of Gal4 recruitment are inversely proportional to the levels of K4me3. Gal4 was tagged with 13 × myc, and ChIP experiments were performed on the UAS region of GAL1 in the indicated yeast strains with anti-Myc antibody. (H) Detection of GAL1 levels when SPP1, SDC1 or SET1 is deleted. SPP1, SDC1 or SET1, respectively, was knocked out in the indicated strains, which were subject to galactose induction. RNA was extracted, analyzed and expressed as in (E). H3D/H3H cells are regarded as WT controls. All of the ChIP values are expressed as mean ratio to H3D/H3H, whose level was set to 1. All error bars indicate s.e.m. for at least duplicated experiments.
-
Figure 4—source data 1
Asymmetrically methylated K4 on sister H3s independently upregulates GAL1 transcription efficiency.
- https://doi.org/10.7554/eLife.30178.013
Figure 5
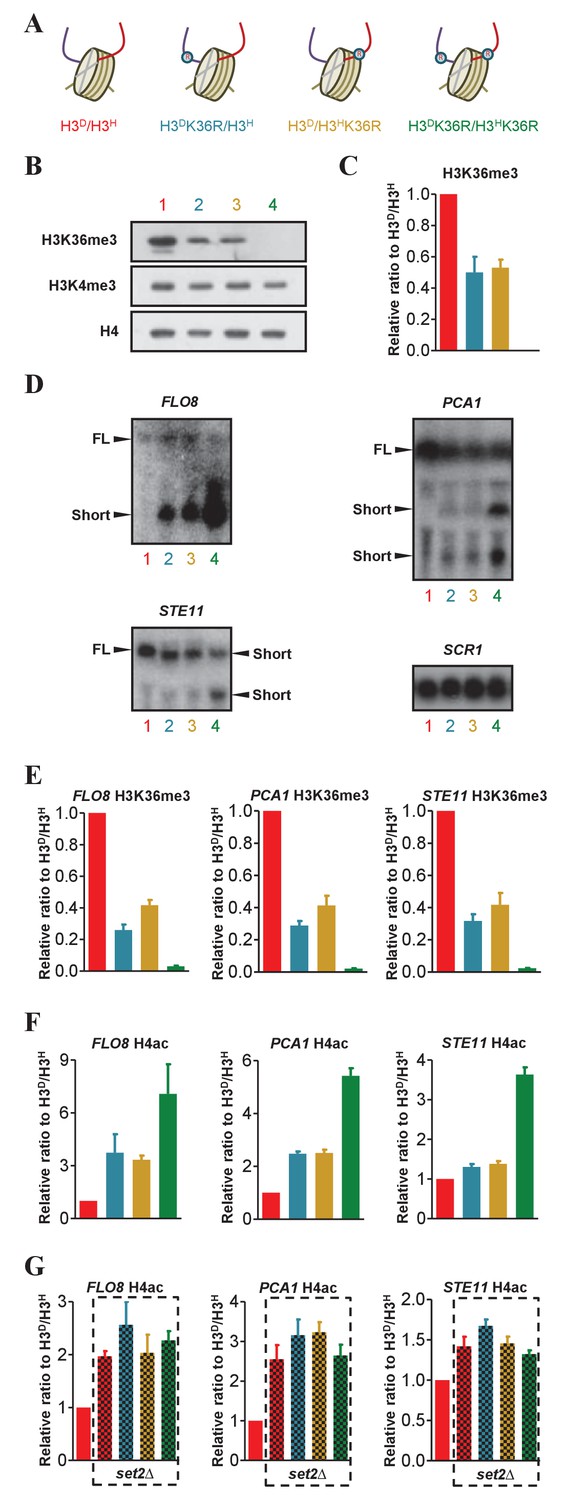
The H3K36me3 marks on sister histones regulate transcription independently.
(A) Schematic illustration of asymmetrical mutation of histone H3K36R on either H3A110D (H3D) or H3L130H (H3H). The K to R mutation is marked by ® on the histone H3. The color labeling of each strain is applied for all the corresponding panels. (B) Asymmetrical K36me3 on sister H3s is successfully established on chromatin. Nucleosomes were immunoprecipitated by anti-H2B antibody from isogenic strains, as identified by colored numbers, and analyzed by western blot using anti-H3K4me3, anti-H3K36me3 and, as a normalization, anti-H4 antibody. (C) Quantification of western blot signals for H3K36me3 as mean ratio relative to H3D/H3H and normalized to signals for H4. (D) Northern blot analysis of the FLO8, STE11 and PCA1 transcripts in H3K36R mutants. RNA from H3D/H3H, H3DK36R/H3H, H3D/H3HK36R and H3DK36R/H3HK36R strains was probed with sequences complementary to the 3' region of FLO8, STE11, PCA1 and, as a loading control, SCR1. The full-length (FL) and short transcript signals are indicated. (E and F) Asymmetric K36me3 on sister H3s results in an intermediate level of H4ac in FLO8, STE11 and PCA1. ChIP experiments were performed in 3' ORF region of FLO8, STE11 and PCA1 in the indicated cells with anti-H3K36me3 antibody (E) and anti-H4ac antibody (F). Values are normalized to histone H4 and expressed as mean ratio to H3D/H3H. (G) H4ac level of the FLO8, STE11 and PCA1 loci in set2∆ cells bearing different K36me3 states on sister H3s. SET2 was knocked out in the indicated cells and ChIP experiments were performed as in (E). Values are normalized to histone H4 and expressed as mean ratio to H3D/H3H. The H3D/H3H cells are regarded as a WT control. In all cases, the values of H3D/H3Hare set to 1. All error bars indicate s.e.m. for at least duplicated experiments.
-
Figure 5—source data 1
The H3K36me3 marks on sister histones regulate transcription independently.
- https://doi.org/10.7554/eLife.30178.015
Figure 6

The H3K79me marks on both sister histones contribute to the regulation of sub-telomeric chromatin structure.
(A) Schematic illustration of the asymmetrical mutation of histone H3K79R on either H3A110D (H3D) or H3L130H (H3H). The K to R mutation is marked by on the histone H3. The color labeling of each strain is applied in the other panels in this figure. (B) Asymmetrical K79me2/3 on sister H3s is established on chromatin. Nucleosomes were immunoprecipitated by anti-H2B antibody from isogenic strains (identified by colored numbers) and analyzed by western blot using anti-H3K79me2/3, anti-H3K4me3 and, as a normalization, anti-H4 antibody. (C) Quantification of western blot signals for H3K79me2/3 as mean ratio relative to H3D/H3H. (D) Both H3K79me marks on sister H3s are required for the maintenance of telomere silencing. Total RNA was prepared and analyzed by real-time quantitative PCR (qRT-PCR) with primers specific for COS12, ERR1 and ERR3 and normalized by ACT1. The black bar represents data for samples of sir2∆ H3D/H3H mutants, acting as a positive control. Values are calculated and expressed as in Figure 4E. (E and F) Detection of K79me2/3 (E) and H4ac (F) at the promoters of the COS12, ERR1 and ERR3. ChIP experiments were performed on the promoters of COS12, ERR1 and ERR3 in the indicated cells with anti-H3K79me2/3 antibody (E) and anti-H4ac antibody (F). Values are normalized to histone H4 and expressed as mean ratio to H3D/H3H. All error bars indicate s.e.m. for at least duplicated experiments.
-
Figure 6—source data 1
The H3K79me marks on both sister histones contribute to the regulation of sub-telomeric chromatin structure.
- https://doi.org/10.7554/eLife.30178.017
Figure 7
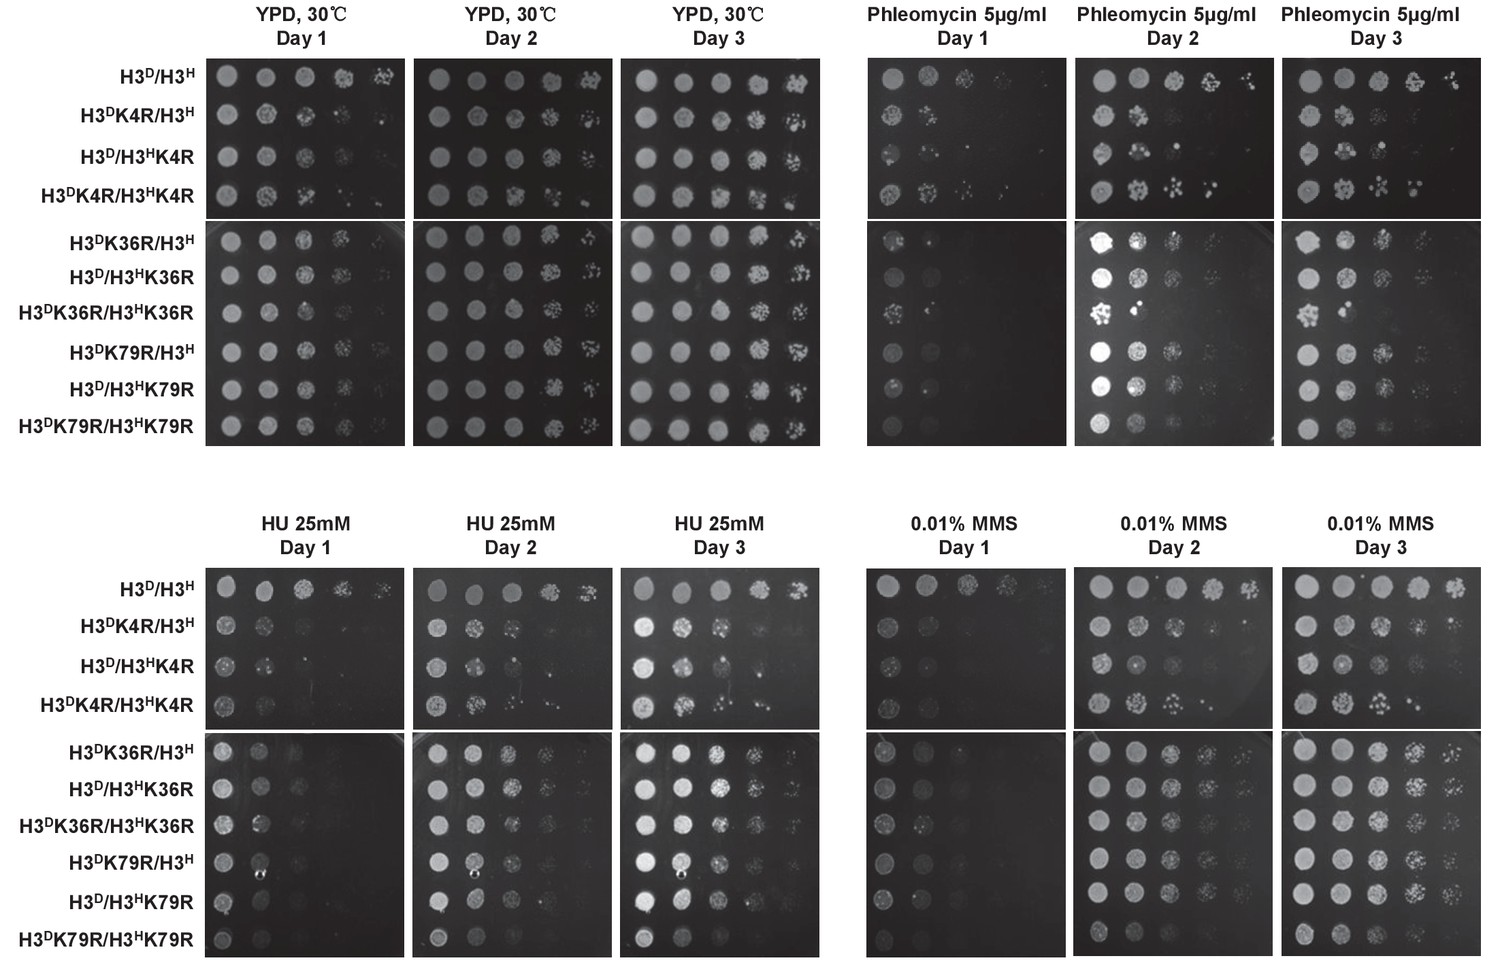
The performance of histone mutants challenged by multiple DNA damage reagents.
Dotting assay was performed in the indicated mutants as in Figure 2D. Plates were photographed after incubation at 30°C on YPD medium or YPD medium containing DNA damage reagents, that is, 5 mg/ml phleomycin, 25 mM HU and 0.01% MMS, for 1, 2 and 3 day(s).
Figure 8 with 1 supplement
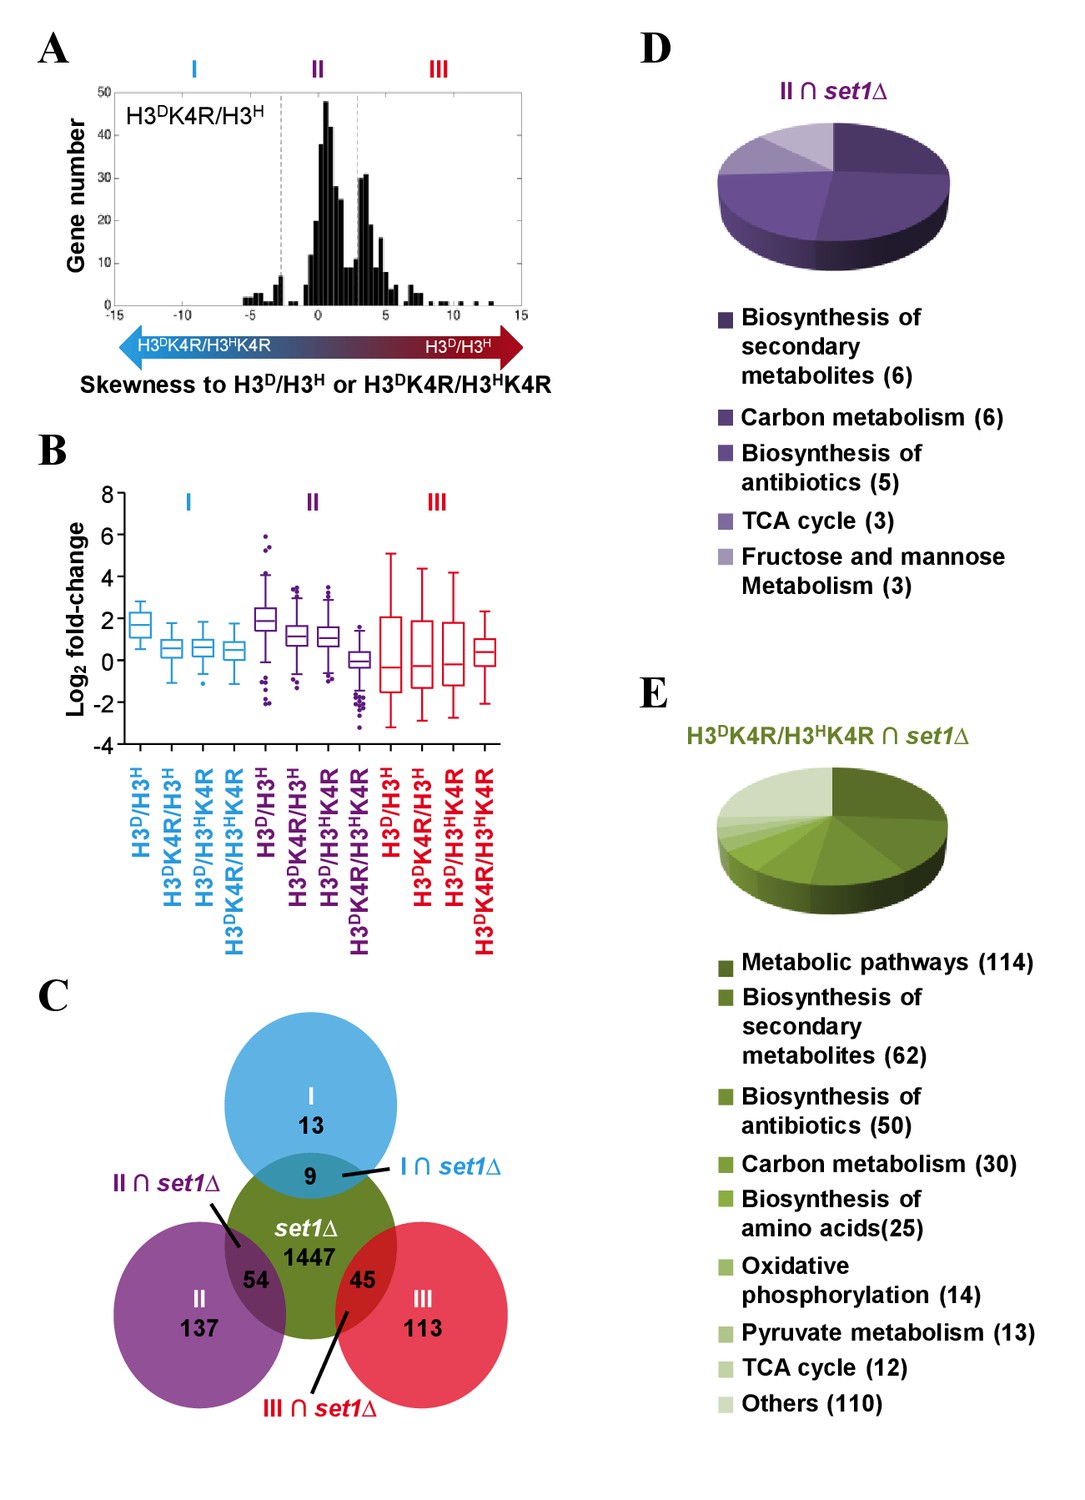
Genes in glycometabolism pathways are regulated by asymmetrically methylated K4 on sister H3s in response to glucose starvation.
(A) Histogram showing the gene skewness score (GSS) of asymmetrical K4R mutants in set MID calculated by a GSS model (see the Materials and methods for details). Bidirectional arrows with gradient colors indicate the increasing skewness of log2 fold change in asymmetrical K4R mutants to those in either H3D/H3H (red end) or H3DK4R/H3HK4R (blue end) cells. Genes are classified to three clusters (I, II and III) by t-test according to the protocols described in the Materials and methods. (B) Boxplots showing the gene's fold-changes of H3D/H3H and K4R mutants in three gene clusters (blue, cluster I; purple, cluster II; red, cluster III). The log2 fold-change values are calculated as described in the Materials and methods. (C) Venn diagram showing the overlaps between genes whose fold-change values are significantly altered by SET1 knockout in the H3D/H3H strain in response to glucose starvation (green circle), and the genes in clusters I (blue circle), II (purple circle), and III (red circle), respectively. (D and E) Pathways regulated by asymmetrically methylated K4 on sister H3s in response to glucose starvation. Pie charts show the pathways with which the genes are specifically associated, under the regulation of asymmetrical K4me on sister H3s (D), or under the regulation of K4me (E).
-
Figure 8—source data 1
Genes in glycometabolism pathways are regulated by asymmetrically methylated K4 on sister H3s in response to glucose starvation.
- https://doi.org/10.7554/eLife.30178.021
-
Figure 8—source data 2
Genes regulated by H3K4R mutation under glucose starvation.
- https://doi.org/10.7554/eLife.30178.022
-
Figure 8—source data 3
GSS of K4R mutants.
- https://doi.org/10.7554/eLife.30178.023
-
Figure 8—source data 4
Gene type classification.
- https://doi.org/10.7554/eLife.30178.024
-
Figure 8—source data 5
KEGG pathway analysis of RNA-Seq data.
- https://doi.org/10.7554/eLife.30178.025
Figure 8—figure supplement 1
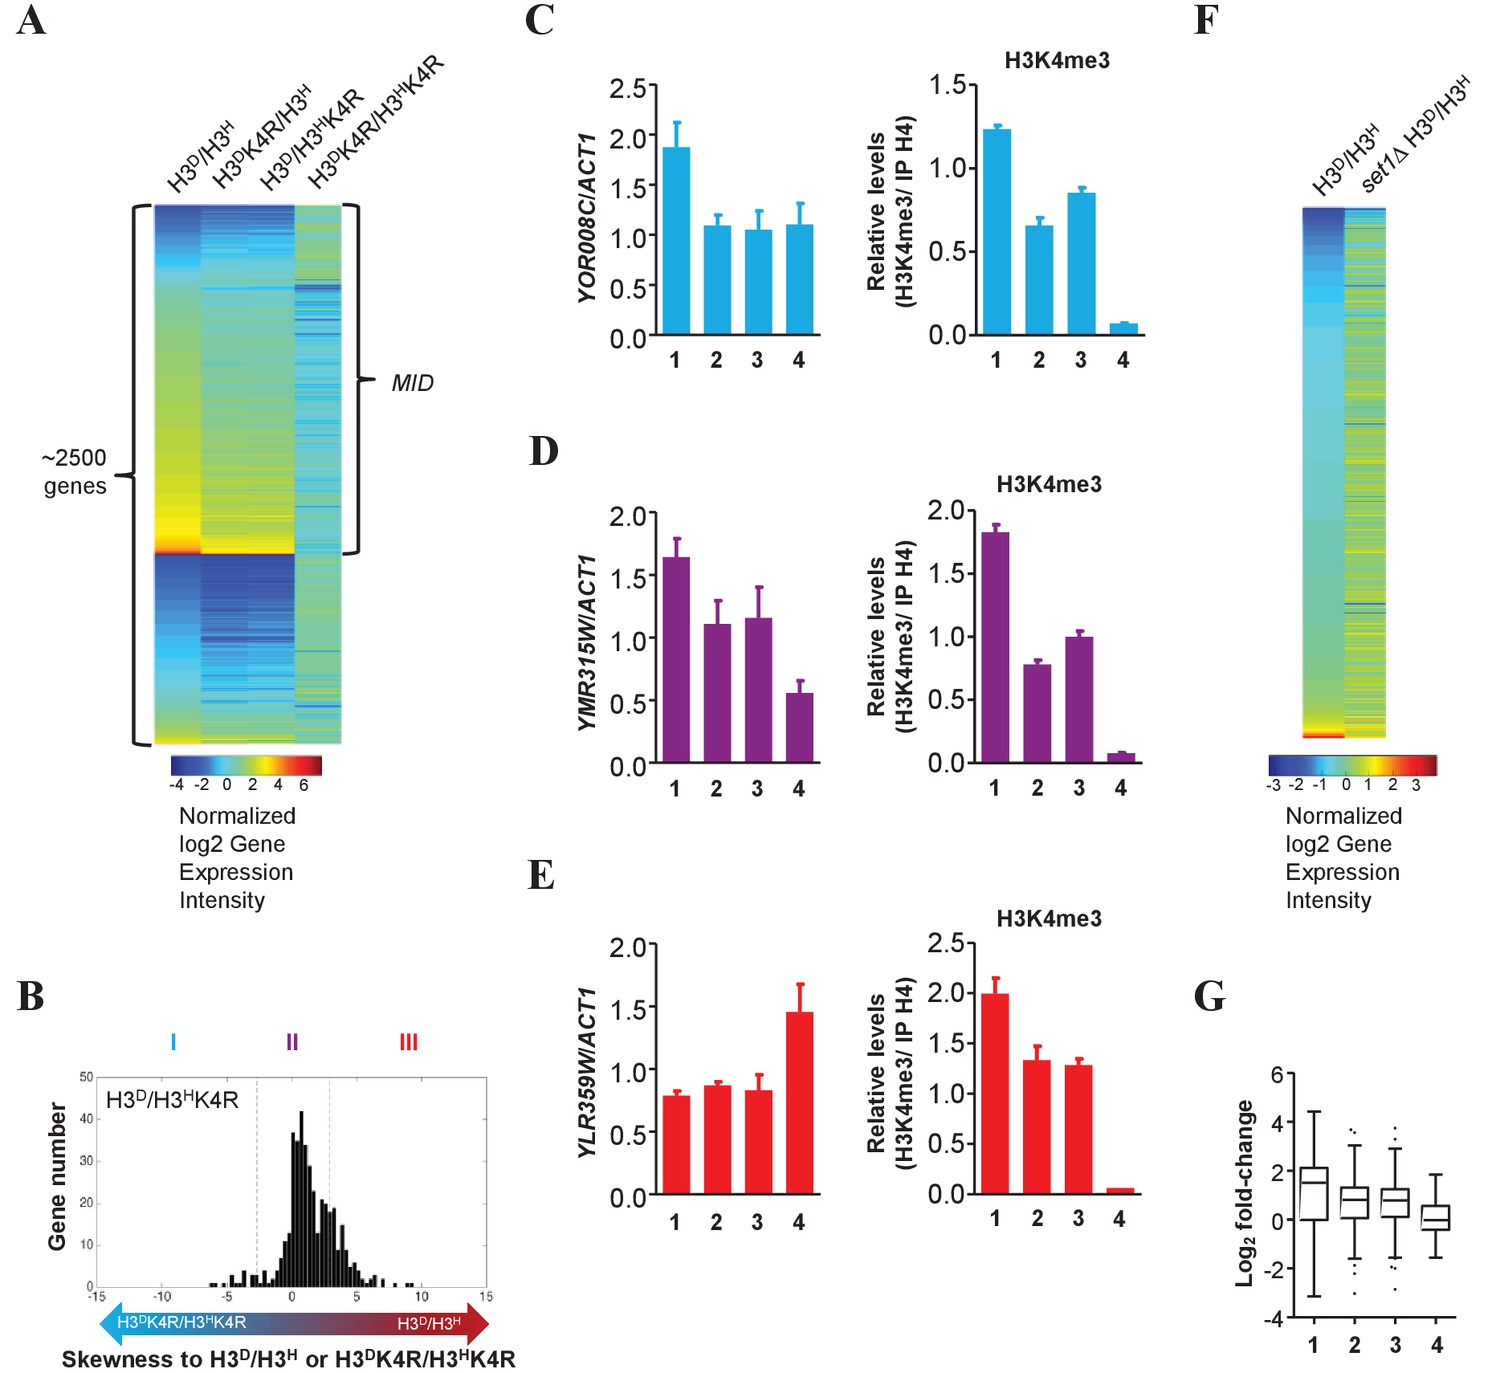
Genes in glycometabolism pathways are regulated by asymmetrically methylated K4 on sister H3s in response to glucose starvation.
(A) Heatmap showing the log2 fold-change of 2500 genes that exhibit significant differences (p<0.05, t-test) between H3D/H3H and H3DK4R/H3HK4R cells. The set MID was the ~1500 gene collection of asymmetrical K4R mutants (H3DK4R/H3H and H3D/H3HK4R) whose log2 fold-change fell between those of H3D/H3H and H3DK4R/H3HK4R cells. (B) Bidirectional arrows with gradient colors indicate the increasing skewness of log2 fold-change in asymmetrical K4R mutants to those in either H3D/H3H (red end) or H3DK4R/H3HK4R (blue end) cells. Genes are classified into three clusters (I, II and III) by t-test as described in the Materials and methods. (C–E) Fold-change in YOR008C (in I∩set1∆) (left panel in C), YMR315W (in II∩set1∆) (left panel in D) or YLR359W (in III∩set1∆) (left panel in E) expression upon glucose starvation is confirmed by qRT-PCR with primers specific for the genes' ORF regions. The qRT-PCR values are normalized to ACT1. H3K4me3 levels in the YOR008C (right panel in C), YMR315W (right panel in D) or YLR359W (right panel in E) loci in H3D/H3H (lane 1), H3DK4R/H3H (lane 2), H3D/H3HK4R (lane 3) and H3DK4R/H3HK4R (lane 4) cells were detected by ChIP with anti-H3K4me3 antibody. H3K4me3 signals were normalized to histone H4 signals on the same chromatin. All error bars indicate s.e.m. for at least duplicated experiments. (F) Heatmap showing the log2 fold-change of genes exhibiting significant differences between H3D/H3H and set1Δ H3D/H3H cells. (G) Boxplots displaying fold-change of genes regulated by H3K4me in glycometabolism pathways in H3D/H3H (lane 1), H3DK4R/H3H (lane 2), H3D/H3HK4R (lane 3) and H3DK4R/H3HK4R (lane 4) cells.
Author response image 1
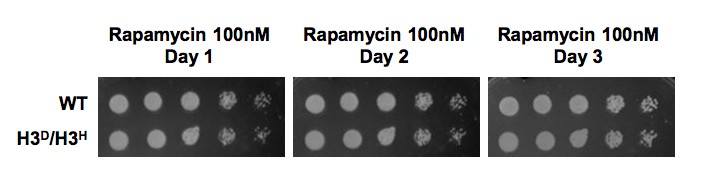
H3D/H3H strain grow as well as WT cell when challenged by rapamycin.
WT (LHT001) and H3D/H3H cells were grown on YP plate with 100nM rapamycin and photographed at Day1-3 as indicated on the top. Cells grown on YPD plate was set as a control which was displayed in Figure 2D in the revised manuscript.
Author response image 2
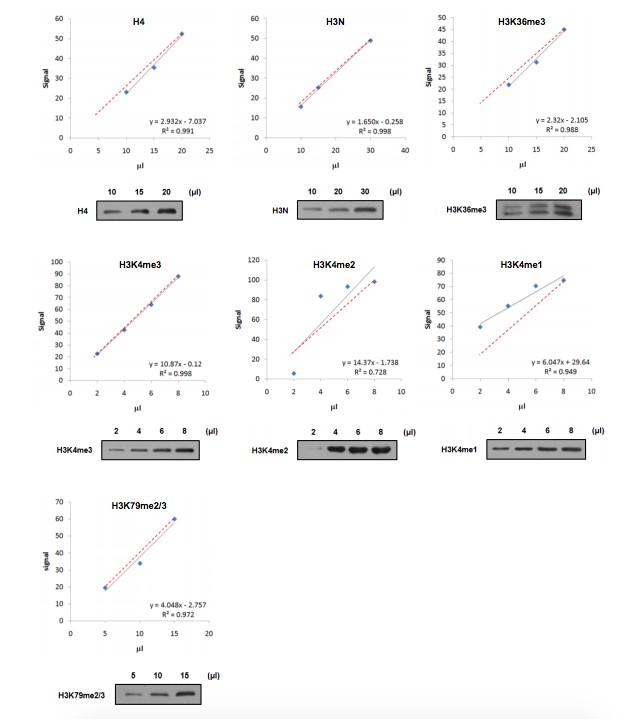
Linear range of antibodies.
Nucleosomes were immunoprecipitated and loaded in gradient as indicated. Western blot was performed using the indicated antibodies and quantified by ImageJ software. The relationship (black line) between sample loading and fluorescence signal was displayed by linear regression. The theoretical correlation between these two variables was represented as red dash line.
Author response image 3
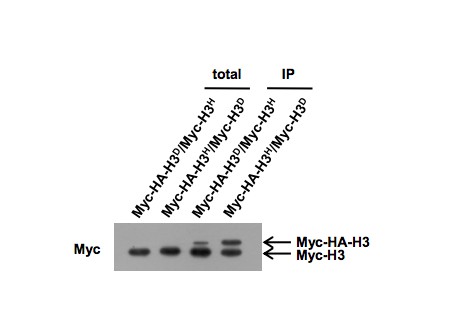
Immunoprecipitation analysis using anti-Myc antibody.
Additional files
-
Supplementary file 1
S. cerevisiae strains used in this study.
- https://doi.org/10.7554/eLife.30178.026
-
Supplementary file 2
Antibodies used in this study.
- https://doi.org/10.7554/eLife.30178.027
-
Supplementary file 3
Oligonucleotides used in this study.
- https://doi.org/10.7554/eLife.30178.028
-
Transparent reporting form
- https://doi.org/10.7554/eLife.30178.029
Download links
A two-part list of links to download the article, or parts of the article, in various formats.
Downloads (link to download the article as PDF)
Open citations (links to open the citations from this article in various online reference manager services)
Cite this article (links to download the citations from this article in formats compatible with various reference manager tools)
Independent manipulation of histone H3 modifications in individual nucleosomes reveals the contributions of sister histones to transcription
eLife 6:e30178.
https://doi.org/10.7554/eLife.30178


