Synapse maintenance and restoration in the retina by NGL2
- Washington University School of Medicine, United States
Figures
Figure 1 with 1 supplement

AAV-mediated knockout of Ngl2 in horizontal cells.
(A) Schematic illustrating AAV-mediated CRISPR/Cas9 strategy for Ngl2 knockout in horizontal cells. In AAV-sgNGL2-tdT, small guide RNAs targeting NGL2 (sgNGL2) were expressed from a Pol III U6 promoter, and the red fluorescent protein tdT was expressed from a Pol II CAG promoter. AAV-sgNGL2-tdT was injected intravitreally into Cas9 mice (Platt et al., 2014). (B) Representative images of an axon of a horizontal cell infected with AAV-sgNGL2-tdT (injection at P0, analysis at P30) in a Cas9 retina. Left, overview of the axon labeled by tdT; right, magnified excerpts showing NGL2 staining at tips of this axon and overlapping axons of uninfected horizontal cells. (C) Relative NGL2 intensity in axon tips of infected vs. uninfected horizontal cell, for AAV-sgNGL2-tdT (sgNGL2) and AAV-YFP (YFP). Dots show data from single cells compared to its neighbors, the circle (errorbar) indicates the mean (±SEM) of the population. In 19 of 20 horizontal cells (3 mice) infected with AAV-sgNGL2-tdT, the NGL2 intensity was significantly reduced (p<0.01 for each, Wilcoxon rank sum test), whereas NGL2 intensity was unchanged in five of five horizontal cells (2 mice) infected with AAV-YFP. (D) Representative images of two overlapping horizontal cell axons labeled with CFP and tdT, respectively. Left, overview image; right, magnified excerpts from rods contacted by tips of either (top and middle) or both (bottom) axons. (E) Summary data of shared rod contacts (i.e., overlapping axon tips) within the overlapping territory of two horizontal cell axons. Dots show data from individual horizontal cell pairs, the circle (errorbar) indicates the mean (±SEM) of the population.
Figure 1—figure supplement 1
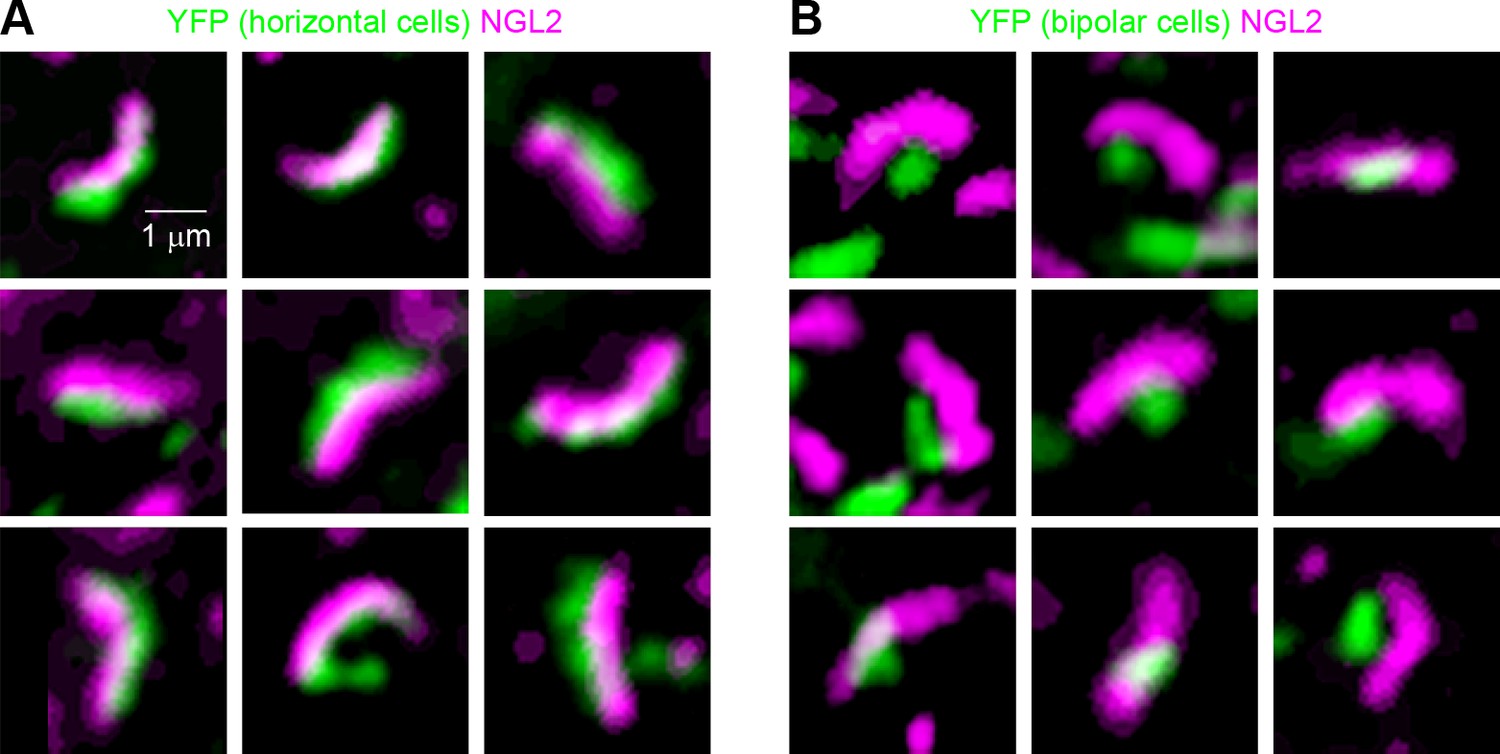
NGL2 localizes to tips of horizontal cell axons, not rod bipolar cell dendrites.
(A and B) Representative images of axon tips of horizontal cells infected with AAV-YFP (A, injection at P0, imaging at P30) or dendrites of rod bipolar cells infected with AAV-Grm6-YFP (B) in wild-type retinas stained for NGL2.
Figure 2 with 3 supplements
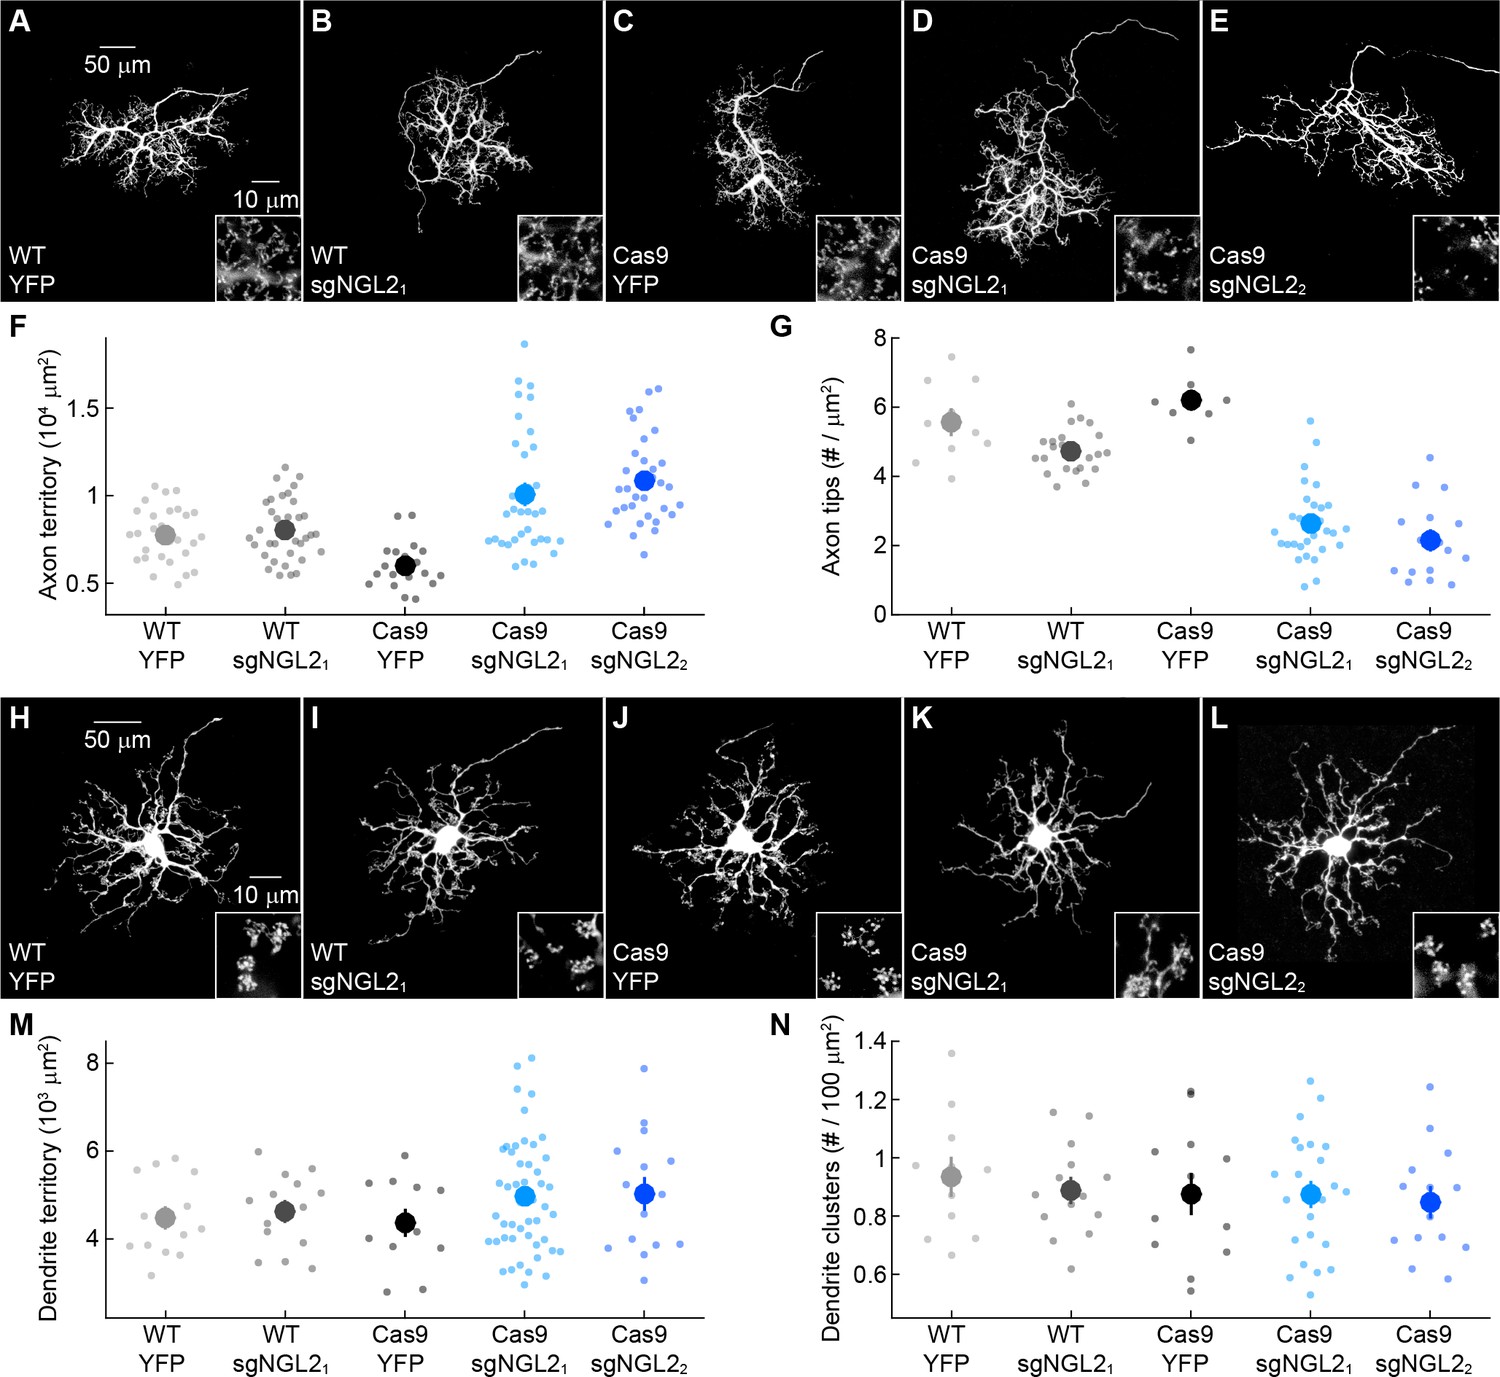
NGL2 regulates horizontal cell axon size and tip density cell autonomously.
(A–E) Representative images of horizontal cell axons labeled by AAV-YFP (YFP) or AAV-sgNGL2-tdT (sgNGL21 and sgNGL22) in wild-type (WT) and Cas9 mice. Overview images are maximum intensity projections of the complete axons; insets show maximum intensity projections limited to axon tips at higher magnification. (F and G) Summary data of axon territories (F) and the density of axon tips in these territories (G). Dots show data from single cells, circles (errorbars) indicate means (±SEM) of the respective populations. AAV-sgNGL2-tdT infection in wild-type mice did not affect horizontal cell axon size (WT YFP n = 29, 8 mice, WT sgNGL21n = 37, 12 mice, p=1) or tip density (WT YFP n = 10, 3 mice, WT sgNGL21n = 23, 8 mice, p=0.25). Horizontal cell axons in Cas9 mice were similar in size (WT YFP n = 29, 8 mice, Cas9 YFP n = 20, 8 mice, p=0.11) and tip densities (WT YFP n = 10, 3 mice, Cas9 YFP n = 8, 4 mice, p=1) to horizontal cell axons in wild-type mice. Both sgRNAs tested drastically increased horizontal cell axon size in Cas9 mice (Cas9 sgNGL21n = 35, 6 mice, p<10−7 for comparison to Cas9 YFP, Cas9 sgNGL22n = 32, 7 mice, p=10−9 for comparison to Cas9 YFP) and reduced tip densities (Cas9 sgNGL21n = 29, 5 mice, p < 10-12 for comparison to Cas9 YFP, Cas9 sgNGL22n = 16, 3 mice, p<0.001 for comparison to Cas9 YFP). (H – L) Analogous to (A – E) for horizontal cell dendrites and their contacts with cones. (M and N) Analogous to (F and G) for horizontal cell dendrites territories (WT YFP n = 15, 8 mice, WT sgNGL21n = 15 , 9 mice, Cas9 YFP n = 12, 8 mice, Cas9 sgNGL21n = 47, 6 mice, Cas9 sgNGL22n = 15, 7 mice) and terminal clusters within these territories (WT YFP n = 12, 6 mice, WT sgNGL21n = 15, 9 mice, Cas9 YFP n = 12, 8 mice, Cas9 sgNGL21n = 14, 3 mice, Cas9 sgNGL22n = 14, 6 mice). No significant differences between genotypes and AAVs were observed for horizontal cell dendrites (p>0.9, for all comparisons). P-values reported in this figure legend are from ANOVA tests with Bonferroni correction for multiple comparisons.
Figure 2—figure supplement 1

Nearly all horizontal cell axon tips are synaptic.
(A and B) Representative images of axon tips of horizontal cells infected with AAV-YFP in a wild-type retina (A) and with AAV-sgNGL2-tdT in a Cas9 retina (B) stained for the presynaptic ribbon marker Bassoon. (C) Summary data of axon tips overlapping with Bassoon staining in horizontal cells infected with AAV-YFP wild-type retinas and horizontal cells infected with AAV-sgNGL2-tdT in Cas9 retinas (YFP 96.7 ± 1.3%, n = 7, 3 mice, sgNGL2 97.7 ± 1.4%, n = 4, 2 mice, p=0.94, Wilcoxon rank sum test). Dots show data from single cells, circles (errorbars) indicate means (±SEM) of the respective populations.
Figure 2—figure supplement 2
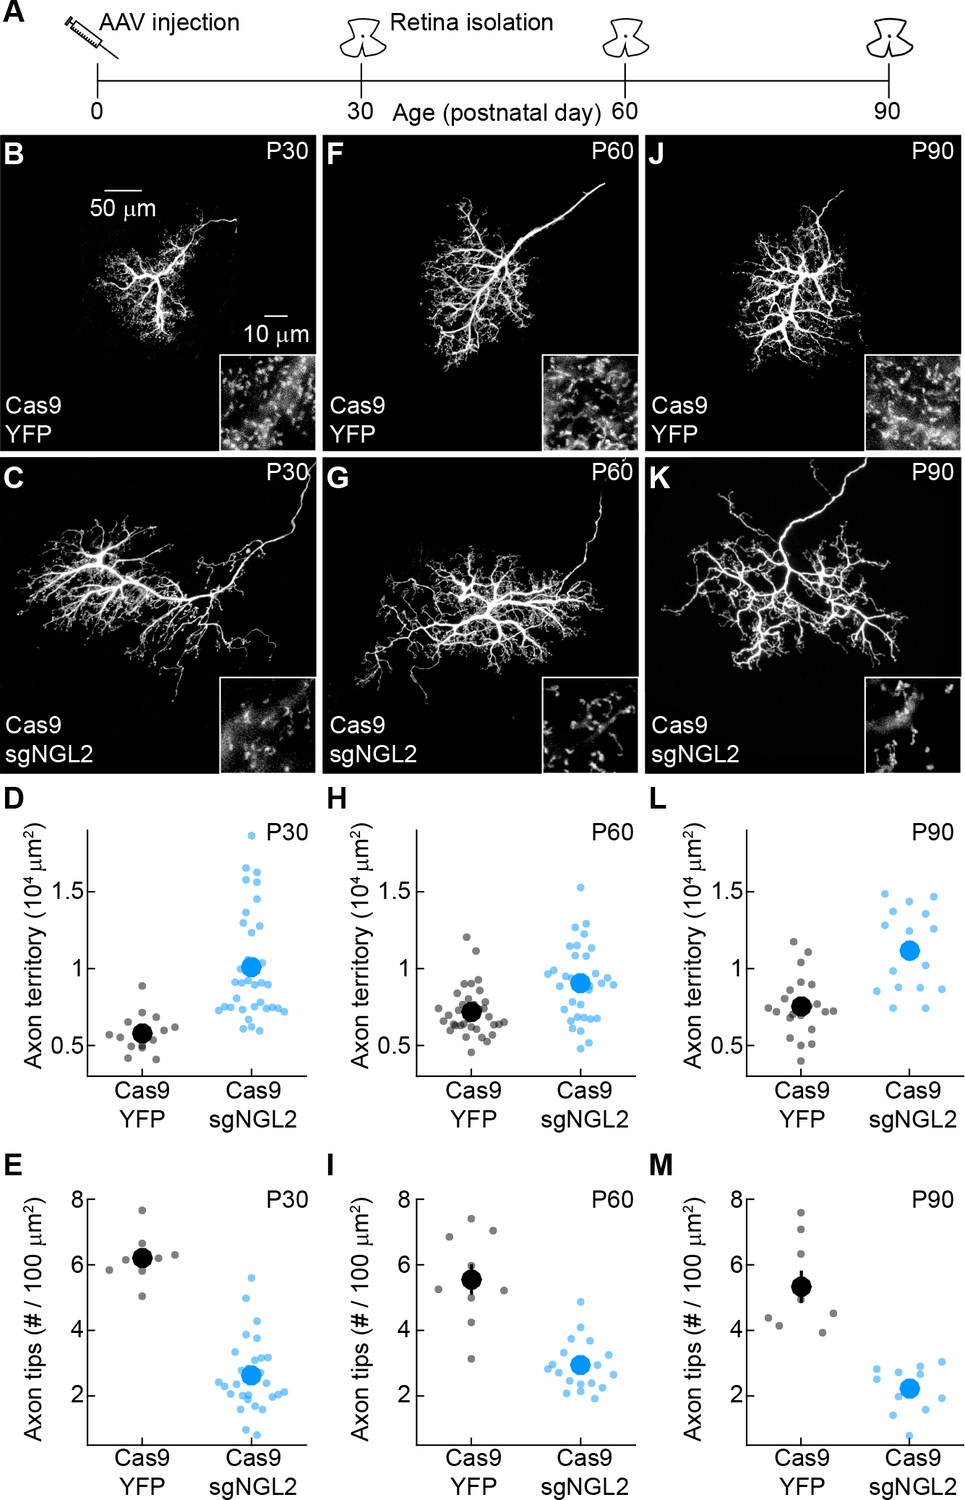
Stable changes in horizontal cell axon size and axon tip density after NGL2 removal.
(A) Schematic illustrating experimental timeline. AAVs were intravitreally injected into newborn (P0) mice and retinas collected on P30, P60, and P90. (B and C) Representative images of horizontal cell axons labeled by AAV-YFP (YFP) or AAV-sgNGL2-tdT (sgNGL2) in Cas9 mice, imaged at P30. Overview images are maximum intensity projections of the complete axons; insets show maximum intensity projections limited to axon tips at higher magnification. (D and E) Summary data of axon territories (D) and the density of axon tips in these territories (E) at P30. Dots show data from single cells, circles (errorbars) indicate means (±SEM) of the respective populations. At P30, axons of horizontal cells infected with AAV-sgNGL2-tdT occupied larger territories (Cas9 YFP n = 14, 8 mice, Cas9 sgNGL2 n = 35, 17 mice, p<10−5), and had lower axon tip densities (Cas9 YFP n = 8, 4 mice, Cas9 sgNGL2 n = 29, 8 mice, p=10−4) compared to horizontal cells infected with AAV-YFP. (F and G) Representative images analogous to (B and C) for tissue collected at P60. (H and I) Summary data analogous to (D and E) for tissue collected at P60. At P60, axons of horizontal cells infected with AAV-sgNGL2-tdT were larger (Cas9 YFP n = 35, 15 mice, Cas9 sgNGL2 n = 34, 11 mice, p<0.001), and the density of axon tips was reduced (Cas9 YFP n = 10, 3 mice, Cas9 sgNGL2 n = 20, 6 mice, p<10−4) compared to horizontal cells infected with AAV-YFP. (J and K) Representative images analogous to (B and C) for tissue collected at P90. (L and M) Summary data analogous to (D and E) for tissue collected at P90. At P90, axons of horizontal cells infected with AAV-sgNGL2-tdT were larger (Cas9 YFP n = 22, 12 mice, Cas9 sgNGL2 n = 17, 8 mice, p<0.001), and the density of axon tips was reduced (Cas9 YFP n = 9, 3 mice, Cas9 sgNGL2 n = 11, 5 mice, p<0.001) compared to horizontal cells infected with AAV-YFP. P-values in this figure legend are from Wilcoxon rank sum tests.
Figure 2—figure supplement 3
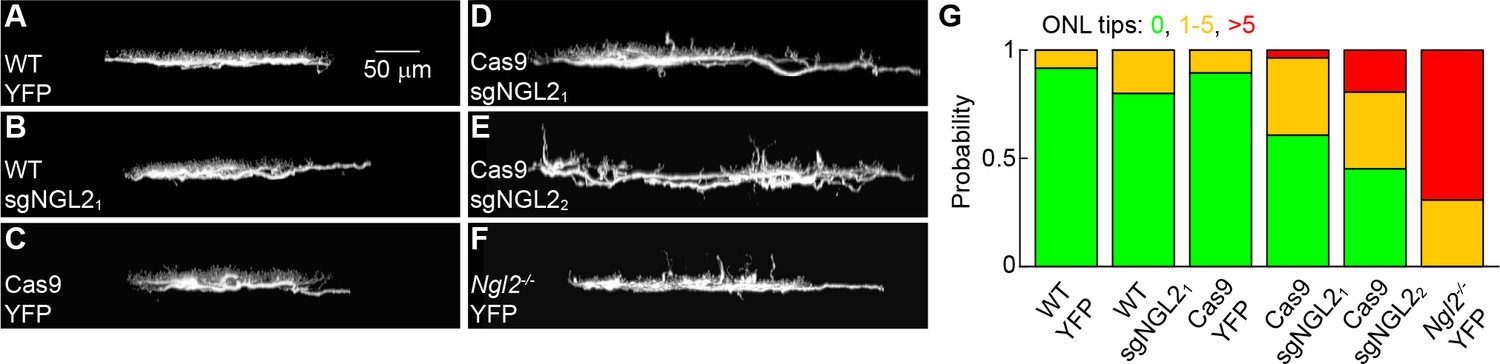
Effects of NGL2 removal on horizontal cell axon targeting.
(A–F) Representative images of horizontal cell axons – rotated maximum intensity projections of confocal image stacks from retinal whole mounts – labeled by AAV-YFP (YFP, (A, C, F) or AAV-sgNGL2-tdT (sgNGL21, B, D; sgNGL22 E) in wild-type (WT, (A, B), Cas9 (C - E), and Ngl2-/- (F) mice. (G) Summary data indicating the fraction of all horizontal cells examined in the different combinations of AAVs and genotypes (WT YFP n = 12, 3 mice, WT sgNGL21n = 35, 12 mice, Cas9 YFP n = 19, 6 mice, Cas9 sgNGL21, n = 28, 6 mice, Cas9 sgNGL22, n = 31, 7 mice, Ngl2-/- YFP n = 13, 4 mice) with no (green), one to five (orange), and more than five (red) mistargeted tips in the outer nuclear layer (ONL). Horizontal cells infected with AAV-sgNGL2-tdT (sgNGL22, not sgNGL21) in Cas9 mice had more severe mistargeting phenotypes than horizontal cells in wild-type mice infected with AAV-YFP (p<0.02) or AAV-sgNGL2-tdT (p<0.004), or horizontal cells in Cas9 mice infected with AAV-YFP (p<0.004). Horizontal cells in Cas9 mice infected with AAV-sgNGL2-tdT (sgNGL22 and sgNGL21) in Cas9 mice had less severe mistargeting phenotypes than horizontal cells in Ngl2-/- mice infected with AAV-YFP (p<0.002). P-values in this figure legend are from tests.
Figure 3 with 1 supplement

NGL2 restrains horizontal cell axon growth and maintains axon tips in young adult mice.
(A) Schematic of the experimental timeline. AAVs were injected into the vitreous chamber of P30 mice and retinas collected on P60. (B and C) Representative images of horizontal cell axons labeled by AAV-YFP (YFP) or AAV-sgNGL2-tdT (sgNGL2) in Cas9 mice, imaged at P60. Overview images are maximum intensity projections of the complete axons; insets show maximum intensity projections limited to axon tips at higher magnification. (D and E) Summary data of axon territories (D) and the density of axon tips in these territories (E) at P60. Dots show data from single cells, circles (errorbars) indicate means (±SEM) of the respective populations. At P60, axons of horizontal cells infected with AAV-sgNGL2-tdT occupied larger territories (Cas9 YFP n = 35, 15 mice, Cas9 sgNGL2 n = 46, 6 mice, p<10−9, Wilcoxon rank sum test), and had lower densities of axon tips (Cas9 YFP n = 10, 3 mice, Cas9 sgNGL2 n = 12, 4 mice, p<0.001, Wilcoxon rank sum test) compared to horizontal cells infected with AAV-YFP.
Figure 3—figure supplement 1

NGL2 restrains HC axon growth and maintains axon tips in adult mice.
(A) Schematic of the experimental timeline. AAVs were injected into the vitreous chamber of P30 mice and retinas collected at P90. (B and C) Representative images of axons of horizontal cells infected with AAV-YFP (YFP) or AAV-sgNGL2-tdT (sgNGL2) in Cas9 mice, imaged at P90. Overview images are maximum intensity projections of the complete axons; insets show maximum intensity projections limited to axon tips at higher magnification. (D and E) Summary data of axon territories (D) and axon tip densities (E) at P90. Dots show data from single cells, circles (errorbars) indicate means (±SEM) of the respective populations. At P90, axons of horizontal cells infected with AAV-sgNGL2-tdT had expanded territories (Cas9 YFP n = 22, 8 mice, Cas9 sgNGL2 n = 48, 12 mice, p<10−6), and lost tips compared to horizontal cells infected with AAV-YFP (Cas9 YFP n = 9, 3 mice, Cas9 sgNGL2 n = 28, 7 mice p<0.003). P-values in this figure legend are from Wilcoxon rank sum tests.
Figure 4 with 1 supplement
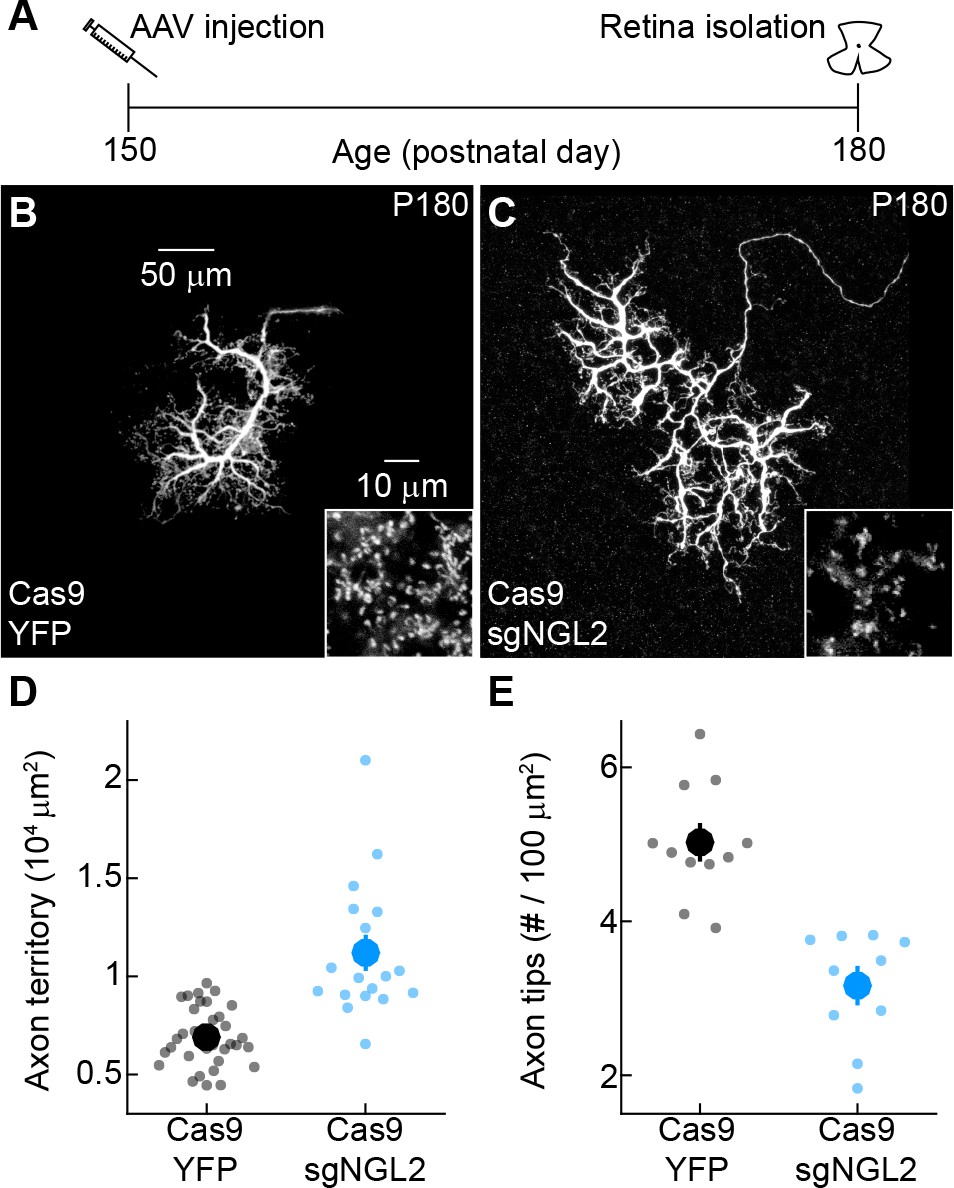
NGL2 restrains horizontal cell axon growth and maintains axon tips in mature adult mice.
(A) Schematic of the experimental timeline. AAVs were injected into the vitreous chamber of P150 mice and retinas collected on P180. (B and C) Representative images of horizontal cell axons labeled by AAV-YFP (YFP) or AAV-sgNGL2-tdT (sgNGL2) in Cas9 mice. Overview images are maximum intensity projections of the complete axons; insets show maximum intensity projections limited to axon tips at higher magnification. (D and E) Summary data of axon territories (D) and the density of axon tips in these territories (E). Dots show data from single cells, circles (errorbars) indicate means (±SEM) of the respective populations. Axons of horizontal cells infected with AAV-sgNGL2-tdT occupied larger territories (Cas9 YFP n = 34, 9 mice, Cas9 sgNGL2 n = 18, 11 mice, p<10−6, Wilcoxon rank sum test), and had lower densities of axon tips (Cas9 YFP n = 11, 3 mice, Cas9 sgNGL2 n = 10, 3 mice, p<0.001, Wilcoxon rank sum test) compared to horizontal cells infected with AAV-YFP.
Figure 4—figure supplement 1

Small guide RNAs targeting Ngl2 do not affect horizontal cell axons in mature adult wild-type mice.
(A) Representative image of the axon of a horizontal cell infected with AAV-sgNGL2-tdT (sgNGL2) in a wild-type retina. Overview images are maximum intensity projections of the complete axons; insets show maximum intensity projections limited to axon tips at higher magnification. Summary data of axon territories (B, n = 26, 5 mice) and axon tip densities (C, n = 16, 3 mice). Dots show data from single cells, circles (errorbars) indicate means (±SEM) of the respective populations.
Figure 5 with 1 supplement
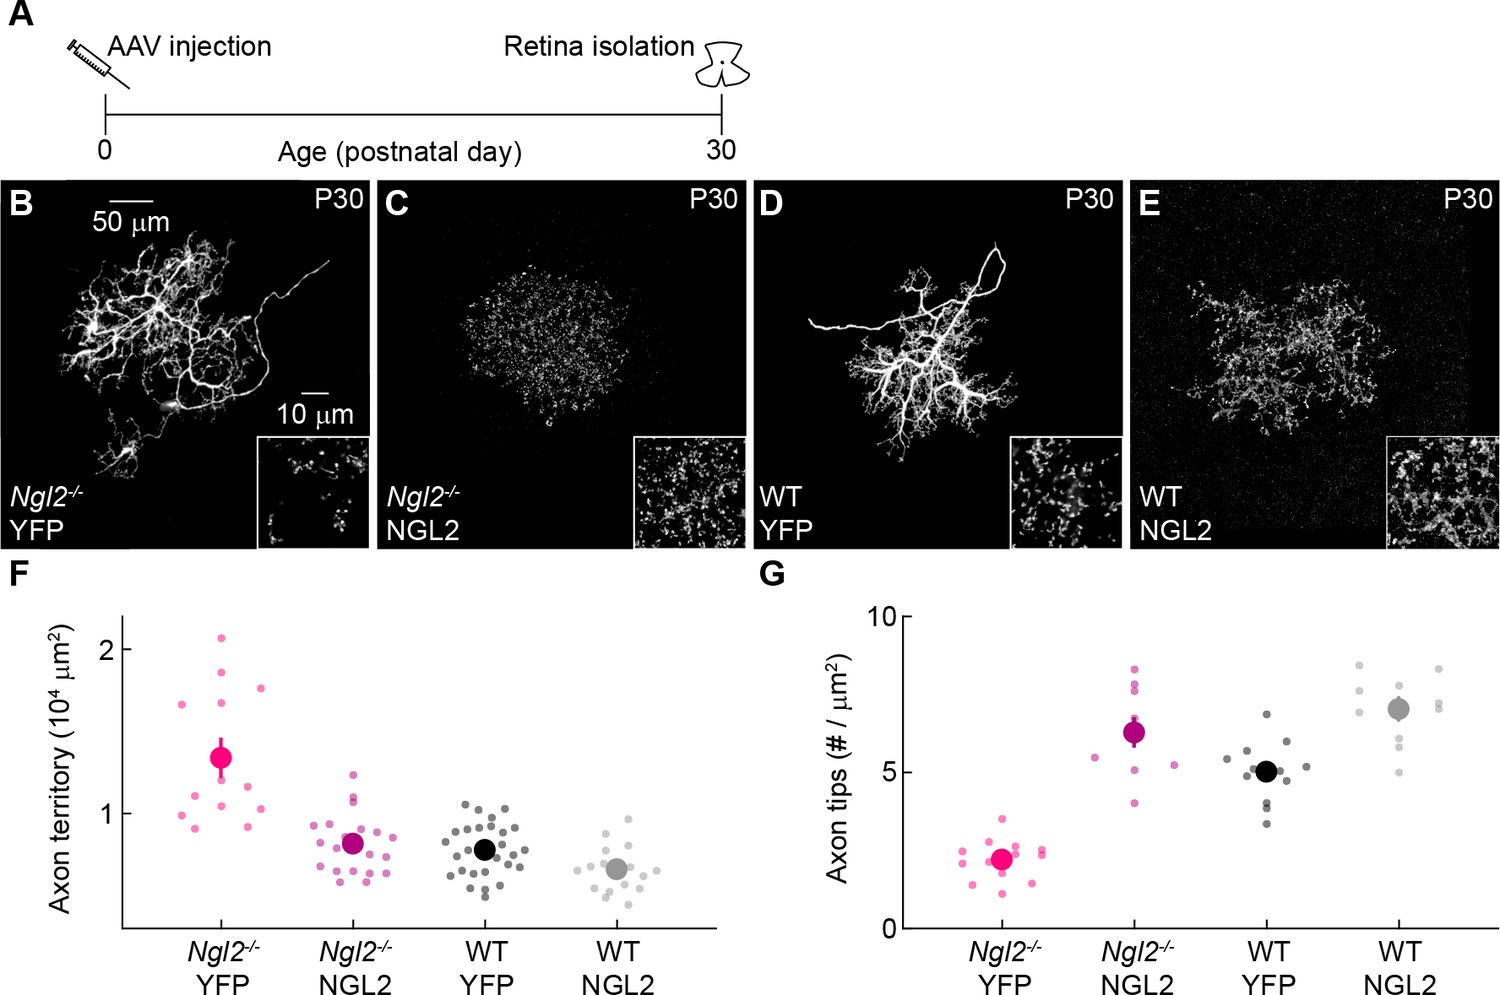
AAV-mediated NGL2 expression normalizes axon growth and enhances axon tip formation of horizontal cells in developing Ngl2-/- mice.
(A) Schematic of the experimental timeline. AAVs were injected into the vitreous chamber of P0 mice and retinas collected at P30. (B–E) Representative images of axons of horizontal cells infected with AAV-YFP (YFP, (B and D) or AAV-NGL2 (NGL2, C, and E) in Ngl2-/- mice (B and C) or wild-type littermates (D and E). Overview images are maximum intensity projections of the complete axons; insets show maximum intensity projections limited to axon tips at higher magnification. (F and G) Summary data of axon territories (F) and the density of axon tips in these territories (G). Dots show data from single cells, circles (errorbars) indicate means (±SEM) of the respective populations. AAV-mediated expression of NGL2 reduced horizontal cell axon territories (Ngl2-/- YFP n = 12, 4 mice, Ngl2-/- NGL2 n = 21, 4 mice, p<10−7), restoring them to wild-type levels (WT YFP n = 31, 5 mice, p=1 for comparison to Ngl2-/- NGL2). In wild-type mice, axon territories of AAV-NGL2-infected horizontal cells were not significantly different from AAV-YFP-infected horizontal cells (WT NGL2, n = 15, 3 mice, p=0.48 for comparison to WT YFP). AAV-mediated NGL2 expression increased axon tip density in Ngl2-/- mice (Ngl2-/- YFP n = 10, 3 mice, Ngl2-/- NGL2 n = 12, 3 mice, p<10−10) beyond wild-type levels (WT YFP n = 12, 3 mice, p<10−6 for comparison to Ngl2-/- NGL2). AAV-mediated expression of NGL2 in wild-type mice similarly increased the axon tip density of horizontal cell axons (WT NGL2, n = 10, 3 mice, p<0.001 for comparison to WT YFP). P-values reported in this figure legend are from ANOVA tests with Bonferroni correction for multiple comparisons.
Figure 5—figure supplement 1

AAV-mediated NGL2 expression in Ngl2-/- and wild-type P30 retinas.
(A and B) Higher magnification excerpts of overview images in Figure 5 (C) and (E). We adjusted the brightness of the images in this figure supplement to reveal wild-type NGL2 expression in (B) and document its absence in (A) at the expense of saturating signals of AAV-mediated NGL2 expression.
Figure 6 with 1 supplement
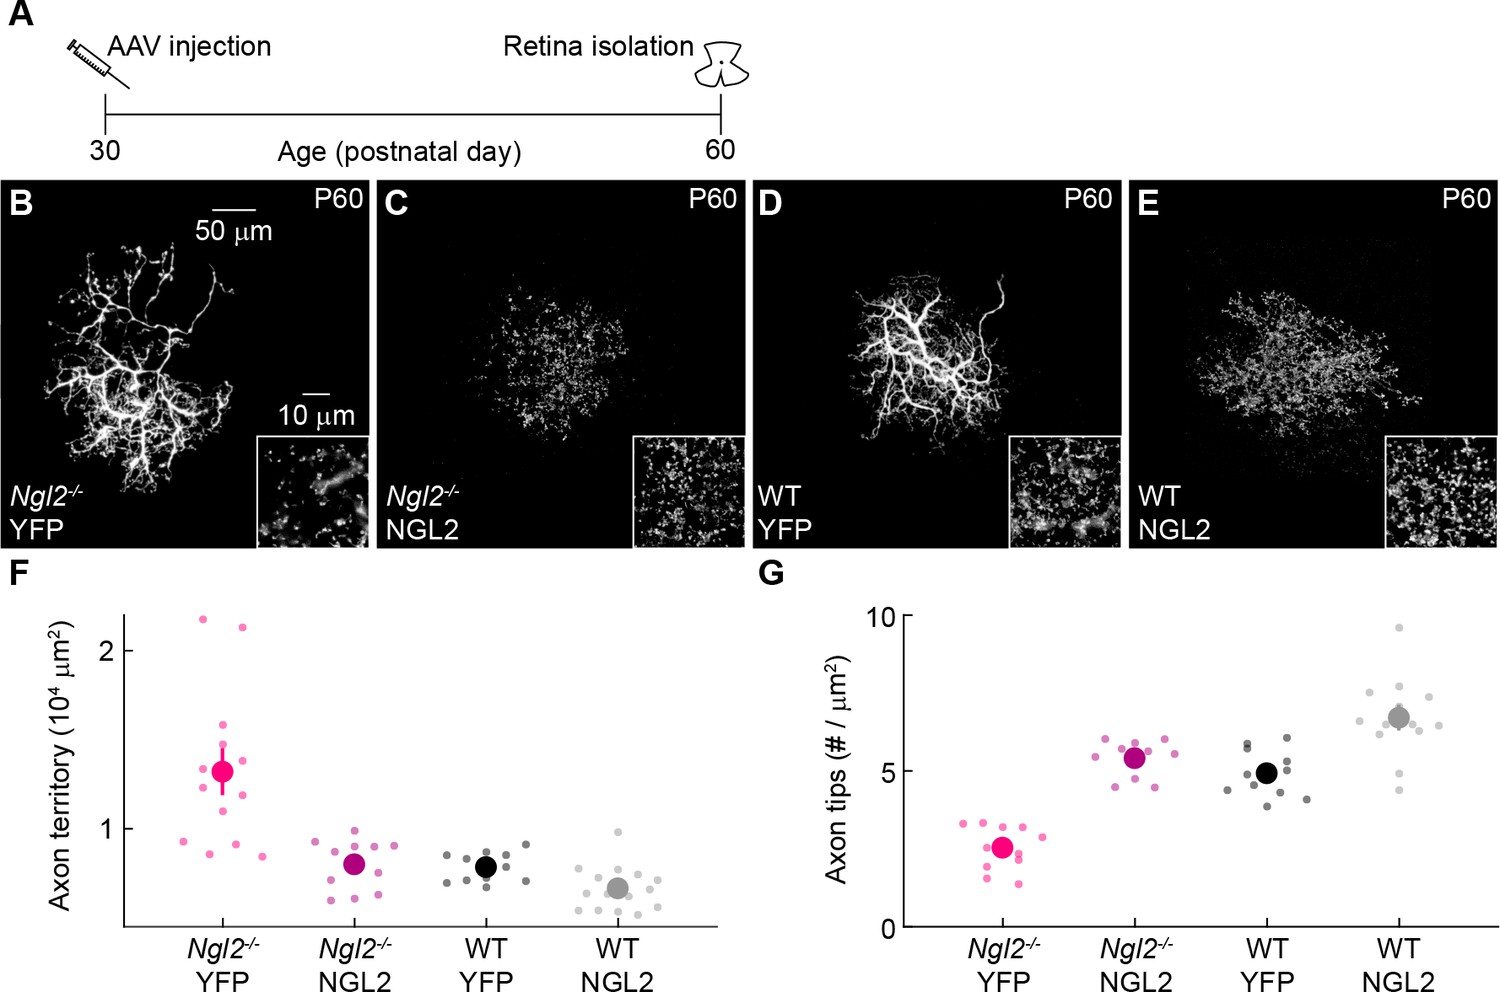
AAV-mediated NGL2 expression shrinks axon arbors and restores axon tips of horizontal cells in adult Ngl2-/- mice.
(A) Schematic of the experimental timeline. AAVs were injected into the vitreous chamber of P30 mice and retinas collected at P60. (B–E) Representative images of axons of horizontal cells infected with AAV-YFP (YFP, (B and D) or AAV-NGL2 (NGL2, (C and E) in Ngl2-/- mice (B and C) or wild-type littermates (D and E). Overview images are maximum intensity projections of the complete axons; insets show maximum intensity projections limited to axon tips at higher magnification. (F and G) Summary data of axon territories (F) and the density of axon tips in these territories (G). Dots show data from single cells, circles (errorbars) indicate means (±SEM) of the respective populations. AAV-mediated expression of NGL2 reduced horizontal cell axon territories (Ngl2-/- YFP n = 12, four mice, Ngl2-/- NGL2 n = 12, two mice, p<10−4), restoring them to wild-type levels (WT YFP n = 11, four mice, p=1 for comparison to Ngl2-/- NGL2). In wild-type mice, axon territories of AAV-NGL2-infected horizontal cells were not significantly different from AAV-YFP-infected horizontal cells (WT NGL2, n = 15, four mice, p=1 for comparison to WT YFP). AAV-mediated NGL2 expression increased axon tip density in Ngl2-/- mice (Ngl2-/- YFP n = 11, 4mice, Ngl2-/- NGL2 n = 10, two mice, p<10−7) to wild-type levels (WT YFP n = 11, four mice, p=1 for comparison to Ngl2-/- NGL2). AAV-mediated expression of NGL2 in wild-type mice similarly increased the axon tip density of horizontal cells (WT NGL2, n = 13, four mice, p<0.001 for comparison to WT YFP). P-values reported in this figure legend are from ANOVA tests with Bonferroni correction for multiple comparisons.
Figure 6—figure supplement 1

AAV-mediated NGL2 expression in Ngl2-/- and wild-type P60 retinas.
(A and B) Higher magnification excerpts of overview images in Figure 6 (C) and (E). We adjusted the brightness of the images in this figure supplement to reveal wild-type NGL2 expression in (B) and document its absence in (A) at the expense of saturating signals of AAV-mediated NGL2 expression.
Tables
Key resources table
| Reagent type (species) or resource | Designation | Source or reference | Identifiers | Additional information |
|---|---|---|---|---|
| Mouse strain | Wild-type (C57Bl6/J) | Jackson Laboratory | RRID:IMSR_JAX000664 | |
| Mouse strain | Cas9 | Jackson Laboratory | RRID:IMSR_JAX:024858 | |
| Mouse strain | Ngl2-/- | (Soto et al., 2013) | ||
| Plasmid | pX330-U6-Chimeric_BB-CBh-hSpCas9 | Addgene | Plasmid # 42230 | |
| Plasmid | pmaxGFP | Lonza | Catalog # VDC-1040 | |
| Virus | AAV-YFP | This paper | ||
| Virus | AAV-Grm6-YFP | (Johnson et al., 2017) | ||
| Virus | AAV-sgNGL21-tdT | This paper | ||
| Virus | AAV-sgNGL22-tdT | This paper | ||
| Virus | AAV-NGL2 | This paper | ||
| Antibody | anti-NGL2 (mouse) | NeuroMab | RRID:AB_2137614 | 1:100 dilution |
| Antibody | anti-Bassoon (mouse) | Enzo | RRID:AB_2313990 | 1:500 dilution |
| Antibody | anti-DsRed (rabbit) | Clontech Laboratories | RRID:AB_10013483 | 1:1000 dilution |
| Antibody | anti-GFP (chicken) | ThermoFisher | RRID:AB_2534023 | 1:500 dilution |
| Antibody | anti-GFP (rabbit) | ThermoFisher | RRID:AB_221569 | 1:1000 dilution |
| Antibody | anti-chicken IgY Alexa 488 | ThermoFisher | RRID:AB_2534096 | 1:1000 dilution |
| Antibody | anti-rabbit IgG Alexa 488 | ThermoFisher | RRID:AB_2536097 | 1:1000 dilution |
| Antibody | anti-rabbit IgG Alexa 568 | ThermoFisher | RRID:AB_143011 | 1:1000 dilution |
| Antibody | anti-mouse IgG Alexa 568 | ThermoFisher | RRID:AB_2534072 | 1:1000 dilution |
| Antibody | anti-mouse IgG Alexa 633 | ThermoFisher | RRID:AB_2535718 | 1:1000 dilution |
Additional files
-
Transparent reporting form
- https://doi.org/10.7554/eLife.30388.016
Download links
A two-part list of links to download the article, or parts of the article, in various formats.
Downloads (link to download the article as PDF)
Open citations (links to open the citations from this article in various online reference manager services)
Cite this article (links to download the citations from this article in formats compatible with various reference manager tools)
Synapse maintenance and restoration in the retina by NGL2
eLife 7:e30388.
https://doi.org/10.7554/eLife.30388


