CD40 is a major regulator of dendrite growth from developing excitatory and inhibitory neurons
- Cardiff University, United Kingdom
Figures
Figure 1 with 2 supplements
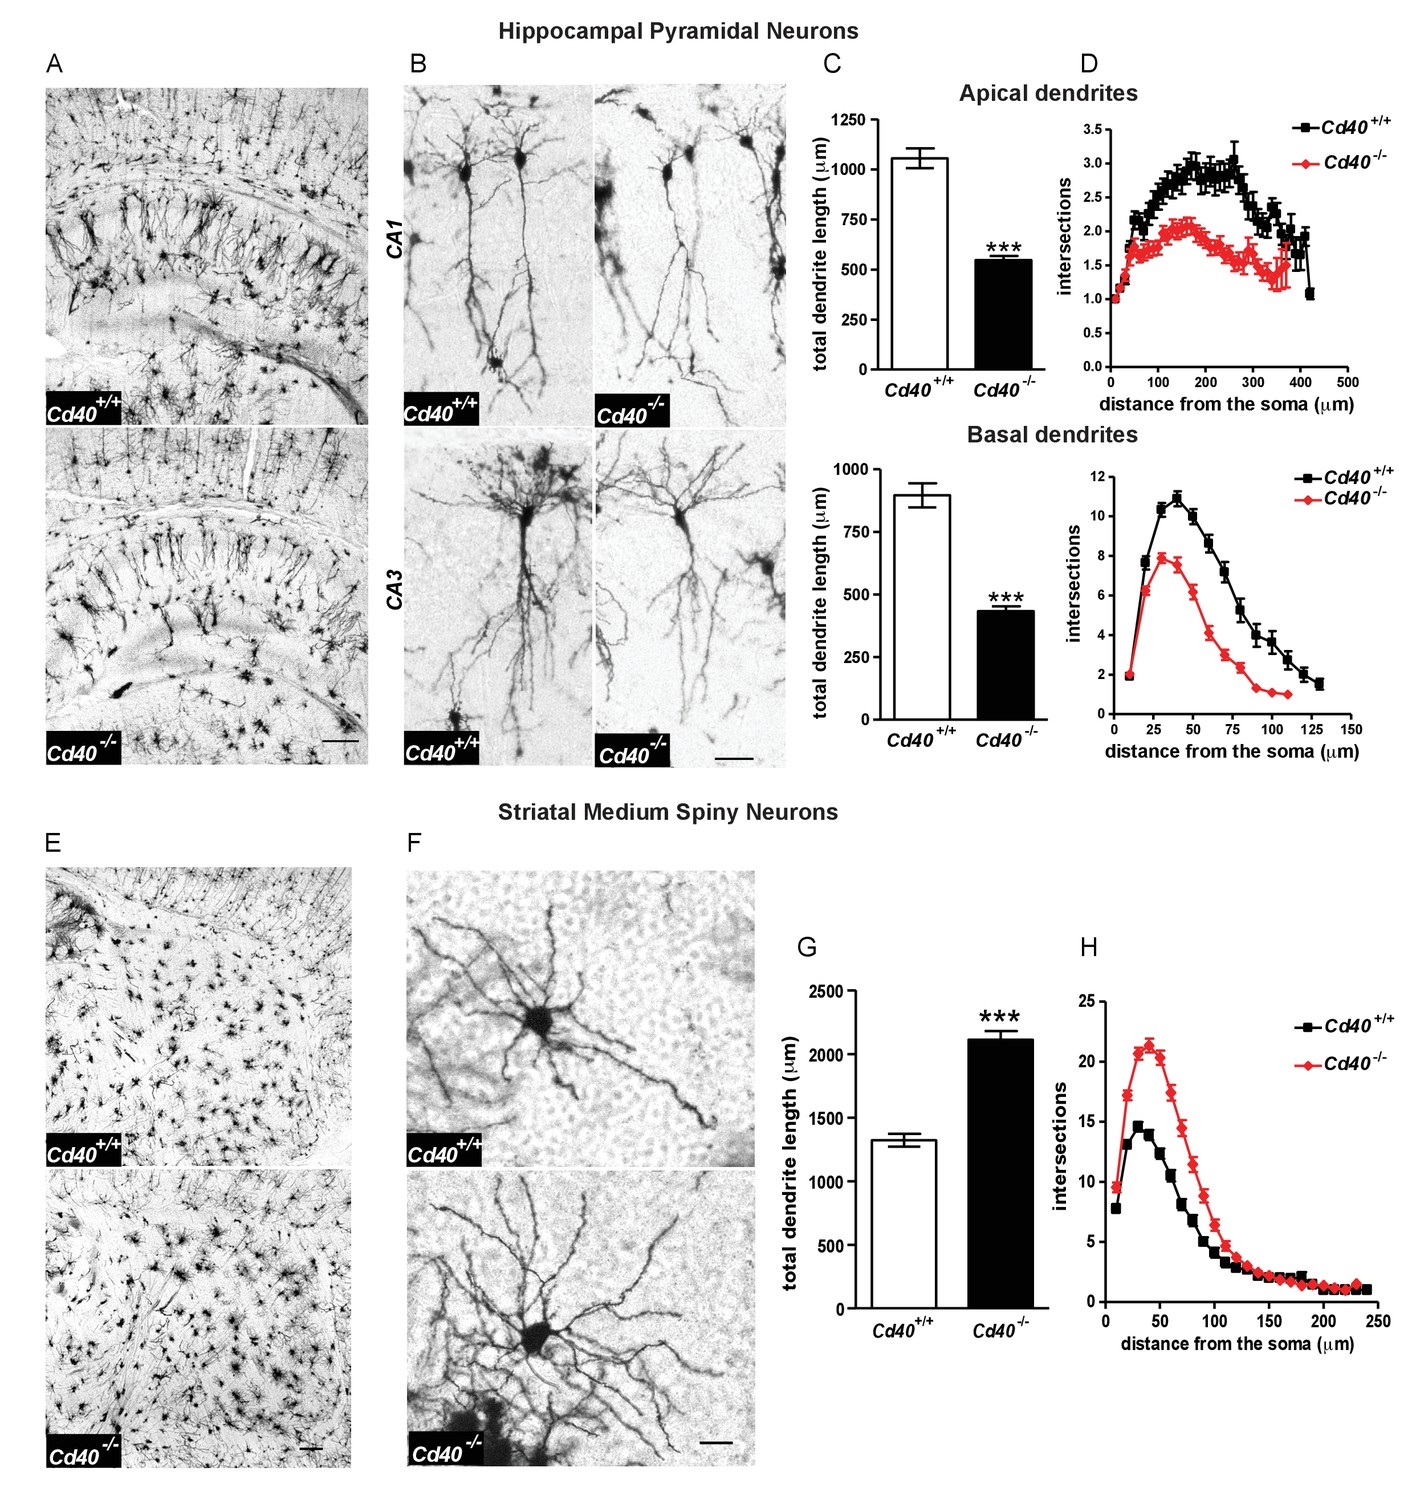
Phenotypic changes in hippocampal pyramidal neurons and striatal MSNs in P10 Cd40-/- mice.
(A) Representative low-power images of Golgi preparations of the hippocampal CA regions and dentate gyrus of Cd40+/+ and Cd40-/- mice. Scale bar, 250 μm. (B) High-power images of CA1 and CA3 pyramidal neurons of Cd40+/+ and Cd40-/- mice. Scale bar, 50 μm. (C) Quantification of the total apical dendrite lengths (Cd40+/+, n = 74 and Cd40-/-, n = 67) and total basal dendrite lengths (Cd40+/+, n = 51 and Cd40-/-, n = 49) of CA1 pyramidal neurons of Cd40+/+ and Cd40-/- mice. (D) Sholl plots of the apical (Cd40+/+, n = 86 and Cd40-/-, n = 71) and basal (Cd40+/+, n = 64 and Cd40-/-, n = 53) dendrites of CA1 pyramidal neurons. (E) Representative low-power images of Golgi preparations of the striatum of Cd40+/+ and Cd40-/- mice. Scale bar, 250 μm. (F) Representative high-power images of MSNs of Cd40+/+ and Cd40-/- mice. Scale bar, 20 μm. (G) Quantification of the total dendrite lengths of MSNs (Cd40+/+, n = 85 and Cd40-/-, n = 89). (H) Sholl plots of MSN dendrites (Cd40+/+, n = 85 and Cd40-/-, n = 89). The means ± s.e.m are shown in C, D, G and H. Data were obtained from neurons analysed in at least three mice of each genotype, ***p<0.0001 t-test (actual p values provided in the text). Sholl plots were analysed by two-way ANOVA with Bonferroni post tests. The statistical significances for each distance from the soma are included in Figure 1—source data 3.
-
Figure 1—source data 1
Data of individual Golgi-stained pyramidal neurons in Cd40+/+ and Cd40-/- mice.
- https://doi.org/10.7554/eLife.30442.005
-
Figure 1—source data 2
Data of individual Golgi-stained medium spiny neurons in Cd40+/+ and Cd40-/- mice.
- https://doi.org/10.7554/eLife.30442.006
-
Figure 1—source data 3
2-way ANOVA for pyramidal neurons and medium spiny neurons in Cd40+/+ and Cd40-/- mice.
- https://doi.org/10.7554/eLife.30442.007
Figure 1—figure supplement 1
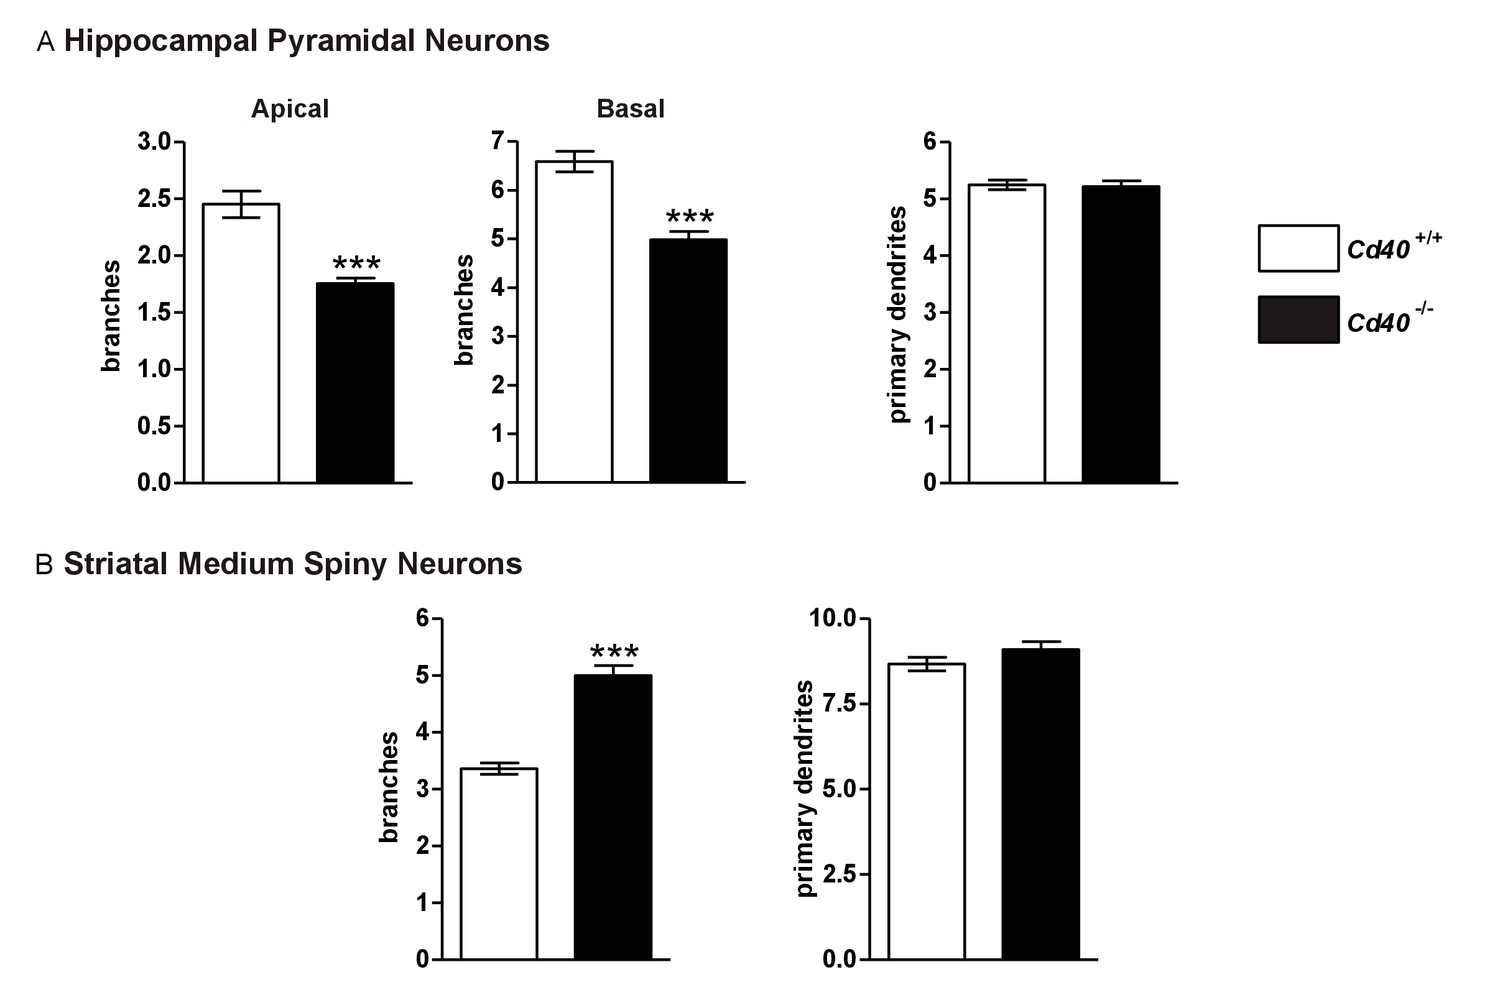
Opposite effects of the Cd40 null mutation on dendrite branching in hippocampal pyramidal neurons and striatal MSNs.
(A) Quantification of the number of branch points in the apical dendrite compartment (Cd40+/+, n = 86 and Cd40-/-, n = 71) and basal dendrite compartment (Cd40+/+, n = 64 and Cd40-/-, n = 53) and the number of primary dendrites (Cd40+/+, n = 85 and Cd40-/-, n = 60) of CA1 pyramidal neurons in Golgi preparations of P10 Cd40+/+ and Cd40-/- mice. (B) Quantification of the number of branch points (Cd40+/+, n = 85 and Cd40-/-, n = 89) and number of primary dendrites (Cd40+/+, n = 85 and Cd40-/-, n = 85) in striatal MSNs in Golgi preparations of P10 Cd40+/+ and Cd40-/- mice. Means ± s.e.m of data obtained from neurons analysed in at least three mice of each genotype, ***p<0.0001 t-test (actual p values provided in the text).
Figure 1—figure supplement 2

Phenotypic changes are maintained in P30 and adult Cd40-/- mice.
(A and B) Representative Golgi preparation images of the hippocampus of Cd40+/+ and Cd40-/- P30 and adult mice. (A) Low-power images of the hippocampal CA regions and dentate gyrus. Scale bar, 250 μm. (B) High-power images of CA1 pyramidal neurons. Scale bar, 50 μm. (C and D) Representative Golgi preparation images of the striatum of Cd40+/+ and Cd40-/- P30 and adult mice. (C) Low-power images of the striatum. Scale bar, 250 μm. (D) High-power images of striatal MSNs. Scale bar, 20 μm.
Figure 2 with 1 supplement
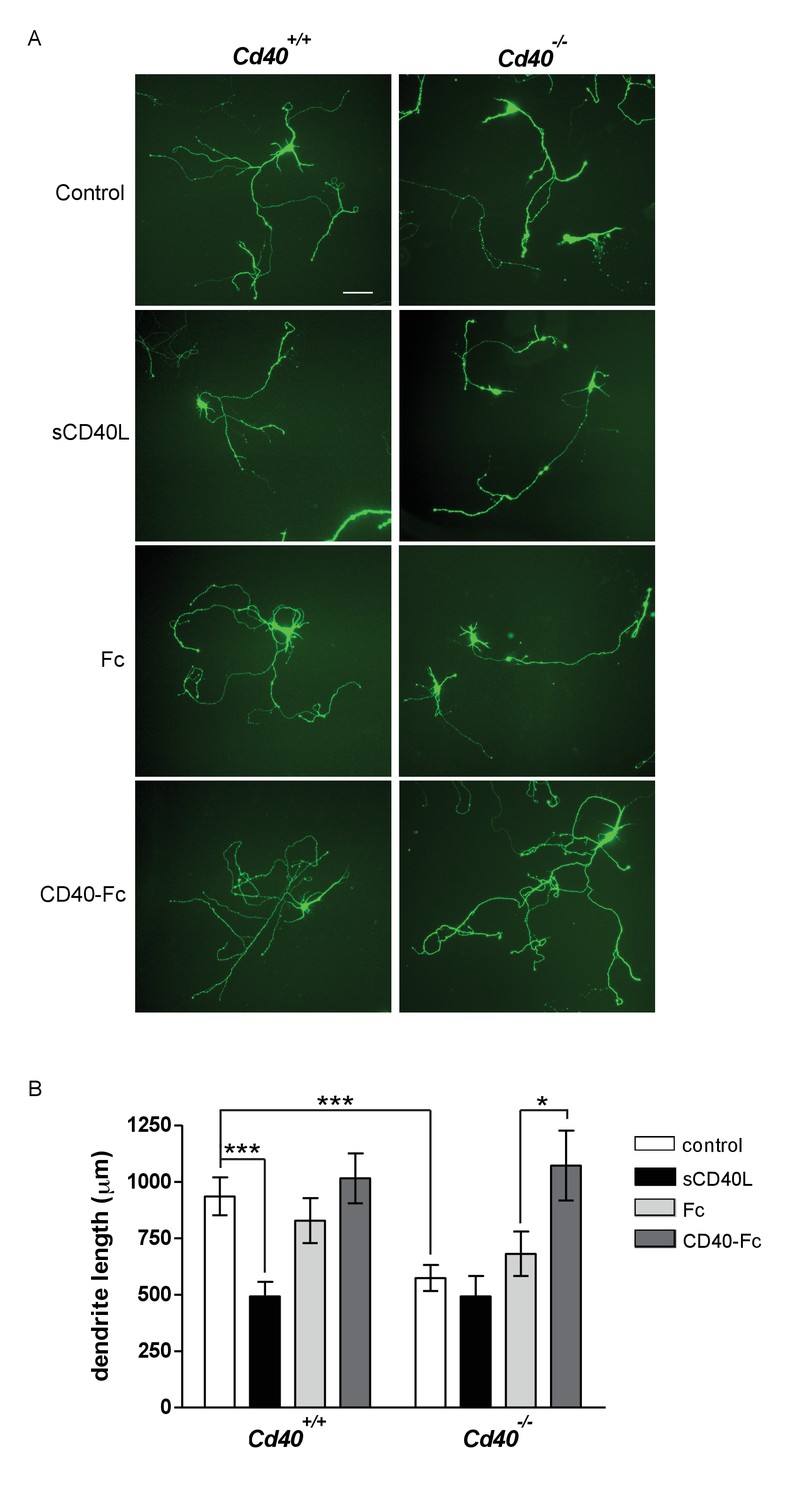
CD40-activated CD40L reverse signalling enhances dendrite growth from cultured hippocampal pyramidal neurons.
(A) Representative photomicrographs of hippocampal neurons of Cd40+/+ and Cd40-/- E18 embryos cultured for 9 days and treated 24 hr after plating with either soluble CD40L (sCD40L), CD40-Fc or Fc protein (each at 1 μg/ml) or untreated (control). Scale bar, 100 μm. (B) Quantification of total dendrite lengths of neurons in these cultures after 9 days in vitro. Mean ± s.e.m of data collected from three independent experiments from Cd40+/+ (control, n = 70; sCD40L, n = 51; Fc, n = 55; CD40-Fc, n = 61) and Cd40-/- (control, n = 60; sCD40L, n = 57; Fc, n = 61; CD40-Fc, n = 59). One-way ANOVA with multiple Newman-Keuls statistical comparison with control, *p<0.01, and ***p<0.0001 (actual p values provided in the text).
-
Figure 2—source data 1
Means, s.e.m. and n numbers for bar charts.
- https://doi.org/10.7554/eLife.30442.010
Figure 2—figure supplement 1
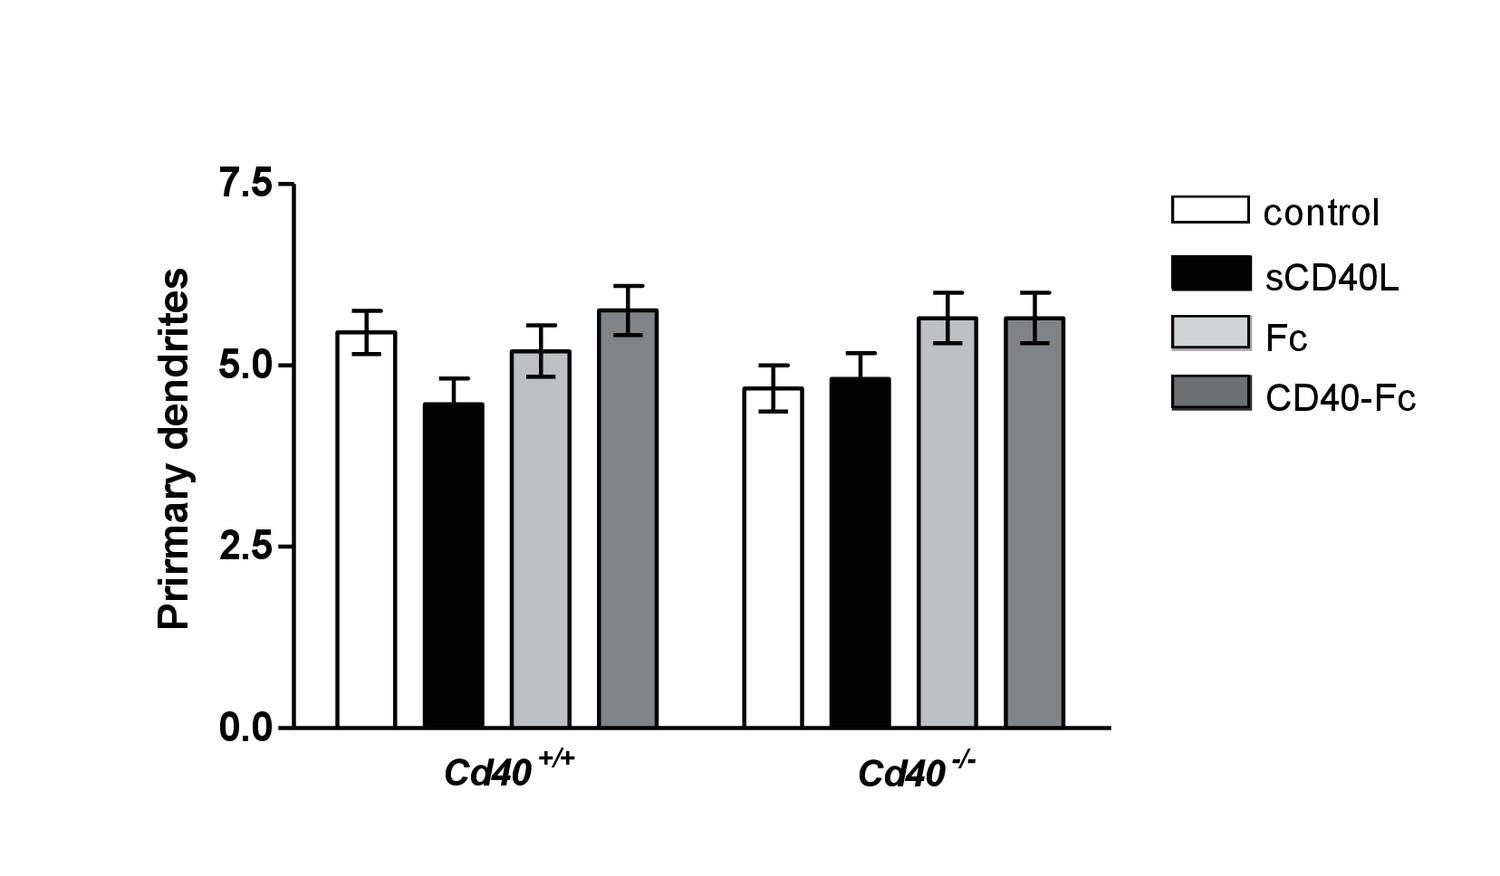
Number of primary dendrites per neuron in the neurite arbors of cultured hippocampal pyramidal neurons.
The neurons of E18 Cd40+/+ or Cd40-/- littermates were cultured for 9 days. 24 hr after plating, the cultures were treated with either soluble CD40L (sCD40L), CD40-Fc or Fc protein (each at 1 μg/ml) or remained untreated (control). Mean ± s.e.m of data collected from three independent experiments from Cd40+/+ (control, n = 70; sCD40L, n = 51; Fc, n = 55; CD40-Fc, n = 61) and Cd40-/- (control, n = 60; sCD40L, n = 57; Fc, n = 61; CD40-Fc, n = 59).
Figure 3
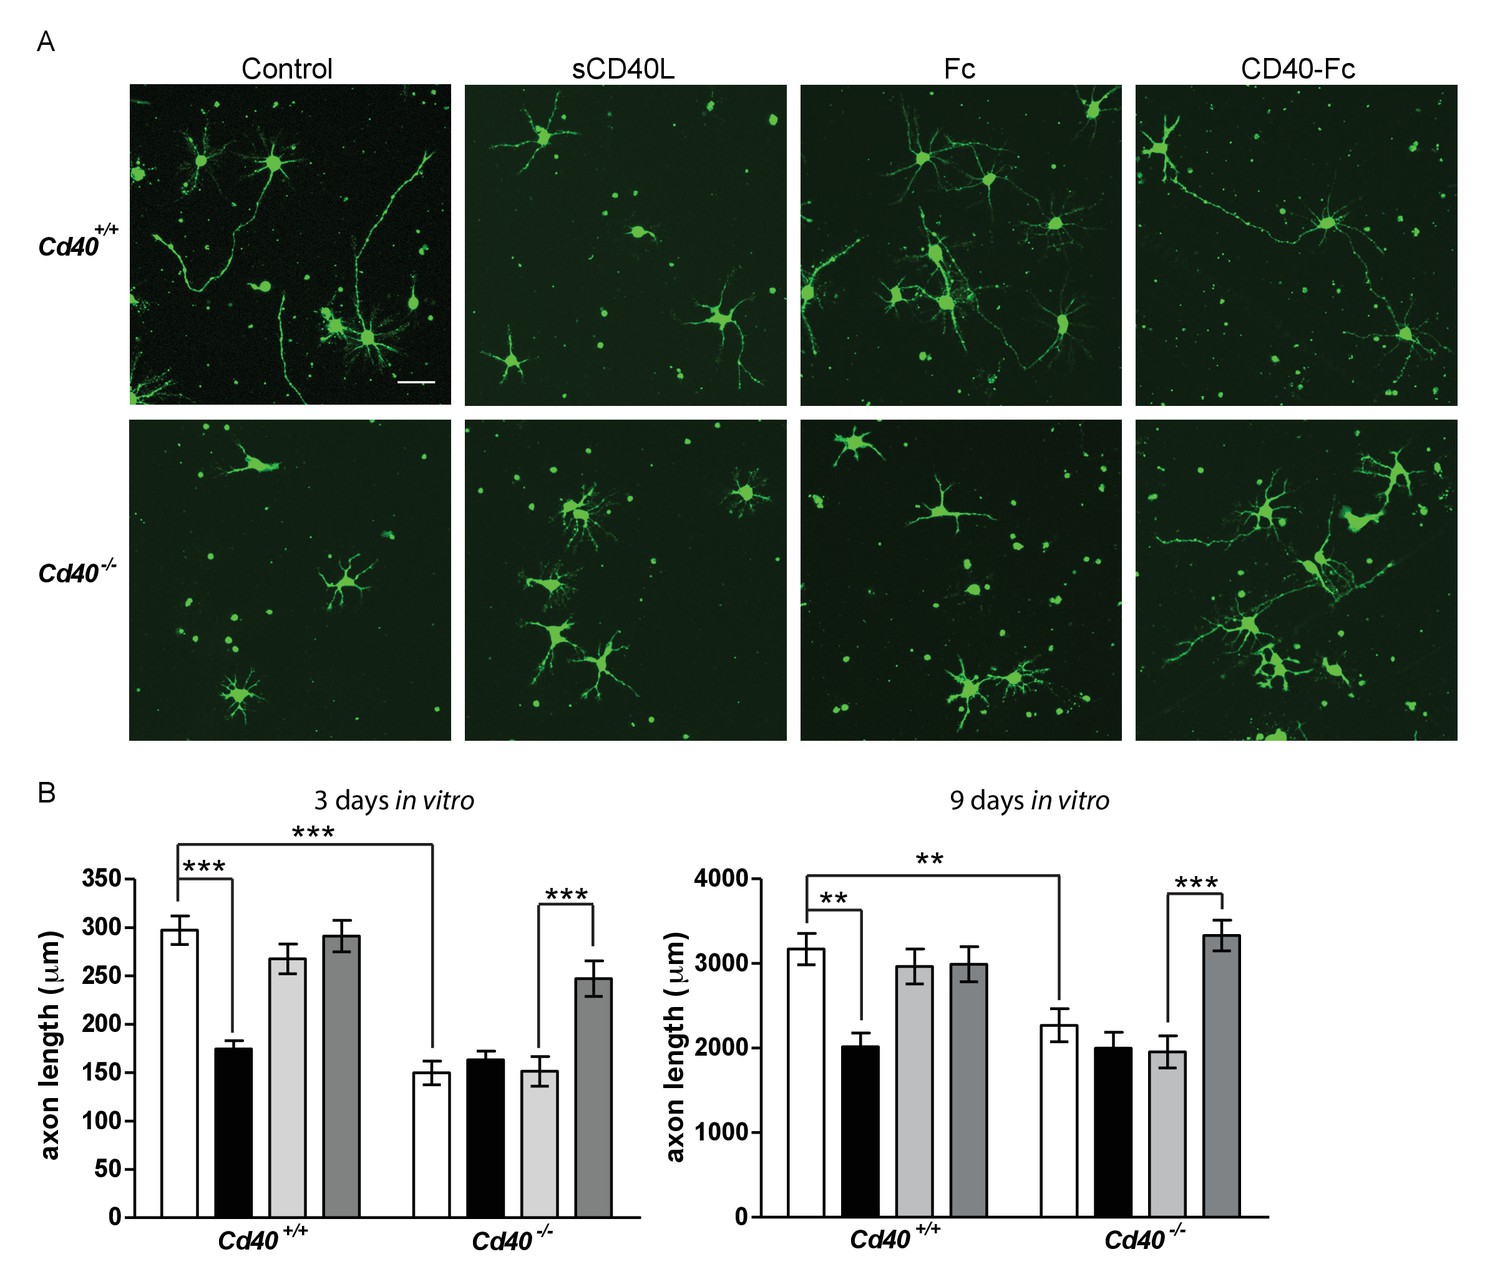
CD40-activated CD40L reverse signalling enhances axon growth from cultured hippocampal pyramidal neurons.
(A) Representative photomicrographs of neurons of Cd40+/+ and Cd40-/- E18 embryos cultured for 3 days and treated 24 hr after plating with either soluble CD40L (sCD40L), CD40-Fc or Fc protein (each at 1 μg/ml) or untreated (control). Scale bar, 50 μm. (B) Quantification of axon length from hippocampal pyramidal neurons of Cd40+/+ and Cd40-/- E18 embryos cultured for 3 and 9 days. Mean ± s.e.m of data collected from at least three independent experiments at 3 days from Cd40+/+ (control, n = 74; sCD40L, n = 68; Fc, n = 72; CD40-Fc, n = 77) and Cd40-/- (control, n = 61; sCD40L, n = 64; Fc, n = 56; CD40-Fc, n = 81); and at 9 days from Cd40+/+ (control, n = 70; sCD40L, n = 51; Fc, n = 55; CD40-Fc, n = 61) and Cd40-/- (control, n = 60; sCD40L, n = 57; Fc, n = 61; CD40-Fc, n = 59). One-way ANOVA with multiple Newman-Keuls statistical comparisons test between the conditions indicated, **p<0.001 and ***p<0.0001 (actual p values provided in the text).
-
Figure 3—source data 1
Means, s.e.m. and n numbers for bar charts.
- https://doi.org/10.7554/eLife.30442.012
Figure 4
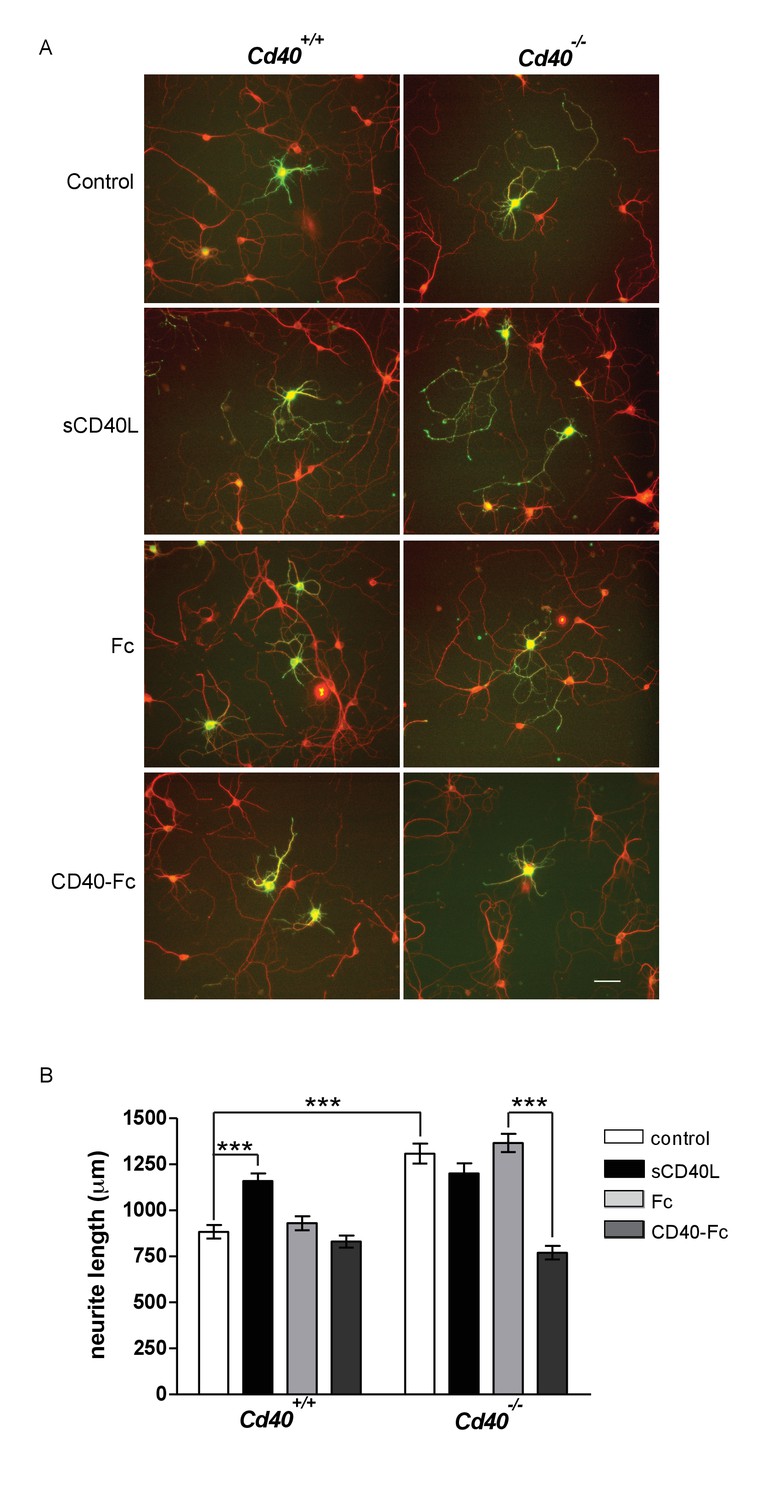
CD40-activated CD40L reverse signalling reduces neurite growth from cultured MSNs.
(A) Representative photomicrographs of MSNs of Cd40+/+ and Cd40-/- E14 embryos cultured for 10 days and treated with either soluble CD40L (sCD40L) at 0.5 μg/ml, CD40-Fc or Fc protein (each at 1 μg/ml) or untreated (control). Neurons were double labelled for βIII tubulin (red) and DARPP-32 (green) to identify MSNs. Scale bar, 50 μm. (B) Quantification of total neurite lengths of MSNs after 10 days in vitro. Mean ± s.e.m of data collected from three independent experiments from Cd40+/+ (control, n = 69; sCD40L, n = 65; Fc, n = 63; CD40-Fc, n = 62) and Cd40-/- (control, n = 60; sCD40L, n = 62; Fc, n = 52; CD40-Fc, n = 73). One-way ANOVA with multiple Newman-Keuls statistical comparisons with control. ***p<0.0001 (actual p values provided in the text).
-
Figure 4—source data 1
Means, s.e.m. and n numbers for bar charts.
- https://doi.org/10.7554/eLife.30442.014
Figure 5

PKC mediates the effect of CD40-activated CD40L reverse signalling on dendrite growth.
(A) Representative photomicrographs of hippocampal neurons of Cd40-/- E18 embryos cultured for 9 days and treated 24 hr after plating with either 1 μg/ml CD40-Fc, 1 μg/ml Fc protein, 500 nM Go6983, 500 nM PMA or the equivalent level of vehicle DMSO. Scale bar, 100 μm. (B) Quantification of total dendrite lengths of neurons in these cultures after 9 days in vitro. Mean ± s.e.m of data collected from three independent experiments in Cd40-/- (control, n = 43; DMSO, n = 43; Go6983, n = 34; Fc, n = 33; CD40-Fc, n = 37; CD40-Fc + Go6983, n = 37; PMA, n = 34). (C). Representative photomicrographs of MSNs of Cd40-/- E14 embryos cultured for 10 days and treated as indicated. MSNs were identified by double labelling for βIII tubulin (red) and DARPP-32 (green). Scale bar, 50 μm. (D) Quantification of total neurite lengths of MSNs after 10 days in vitro. Mean ± s.e.m of data collected from three independent experiments in Cd40-/- (control, n = 56; DMSO, n = 46; Go6983, n = 49; Fc, n = 50; CD40-Fc, n = 61; CD40-Fc + Go6983, n = 48; PMA, n = 58). *p<0.01 and ***p<0.0001, statistical comparison with the equivalent control (Fc for CD40-Fc and DMSO for PMA, actual p values provided in the text), one-way ANOVA with multiple Newman-Keuls tests.
-
Figure 5—source data 1
Means, s.e.m. and n numbers for pyramidal neuron bar charts.
- https://doi.org/10.7554/eLife.30442.016
-
Figure 5—source data 2
Means, s.e.m. and n numbers for medium spiny neuron bar charts.
- https://doi.org/10.7554/eLife.30442.017
Figure 6 with 1 supplement

PKC-β and PKC-γ selectively participate in mediating the effects of CD40-activated CD40L reverse signalling on dendritic growth.
(A) Representative photomicrographs of hippocampal neurons of Cd40+/+ and Cd40-/- E18 embryos transfected with either control siRNA or PKC-β siRNA and cultured for 9 days. The Cd40-/- neurons were treated with either 1 μg/ml Fc protein or 1 μg/ml CD40-Fc. Scale bar, 100 μm. (B) Quantification of dendrite length from hippocampal pyramidal neurons of Cd40+/+ and Cd40-/- E18 embryos cultured for 9 days. Mean ± s.e.m of data collected from four separate experiments of Cd40+/+ neurons (control siRNA transfected, n = 32; PKC-β siRNA transfected, n = 33; PKC-γ siRNA transfected, n = 27) and Cd40-/- neurons (control siRNA transfected, Fc treated, n = 39; control siRNA transfected, CD40-Fc treated, n = 35; PKC-β siRNA transfected, Fc treated, n = 39; PKC-β siRNA transfected, CD40-Fc treated, n = 39). (C) Representative photomicrographs of MSNs of Cd40+/+ and Cd40-/- E14 embryos transfected with either control siRNA or PKC-γ siRNA and cultured for 10 days. The Cd40-/- neurons were treated with either 1 μg/ml Fc protein or 1 μg/ml CD40-Fc. MSNs were identified by DARPP-32 (red) and transfected neurons by the expression of GFP (green). * indicates transfected neurons that were not positive for DARPP-32. Scale bar, 50 μm. (D) Quantification of neurite length from MSNs of Cd40+/+ and Cd40-/- E14 embryos cultured for 10 days. Mean ± s.e.m of data collected from four separate experiments of Cd40+/+ neurons (control siRNA transfected, n = 27; PKC-β siRNA transfected, n = 26; PKC-γ siRNA transfected, n = 25) and Cd40-/- neurons (control siRNA transfected, Fc treated, n = 34; control siRNA transfected, CD40-Fc treated, n = 26; PKC-γ siRNA transfected, Fc treated, n = 29; PKC-γ siRNA transfected, CD40-Fc treated, n = 24). **p<0.01 and ***p<0.001, actual p values provided in the text, one-way ANOVA with multiple Newman-Keuls tests.
-
Figure 6—source data 1
Means, s.e.m. and n numbers for Cd40+/+ pyramidal neuron bar charts.
- https://doi.org/10.7554/eLife.30442.020
-
Figure 6—source data 2
Means, s.e.m. and n numbers for Cd40+/+ medium spiny neuron bar charts.
- https://doi.org/10.7554/eLife.30442.021
-
Figure 6—source data 3
Means, s.e.m. and n numbers for Cd40-/- pyramidal neuron bar charts.
- https://doi.org/10.7554/eLife.30442.022
-
Figure 6—source data 4
Means, s.e.m. and n numbers for Cd40-/- medium spiny neuron bar charts.
- https://doi.org/10.7554/eLife.30442.023
Figure 6—figure supplement 1
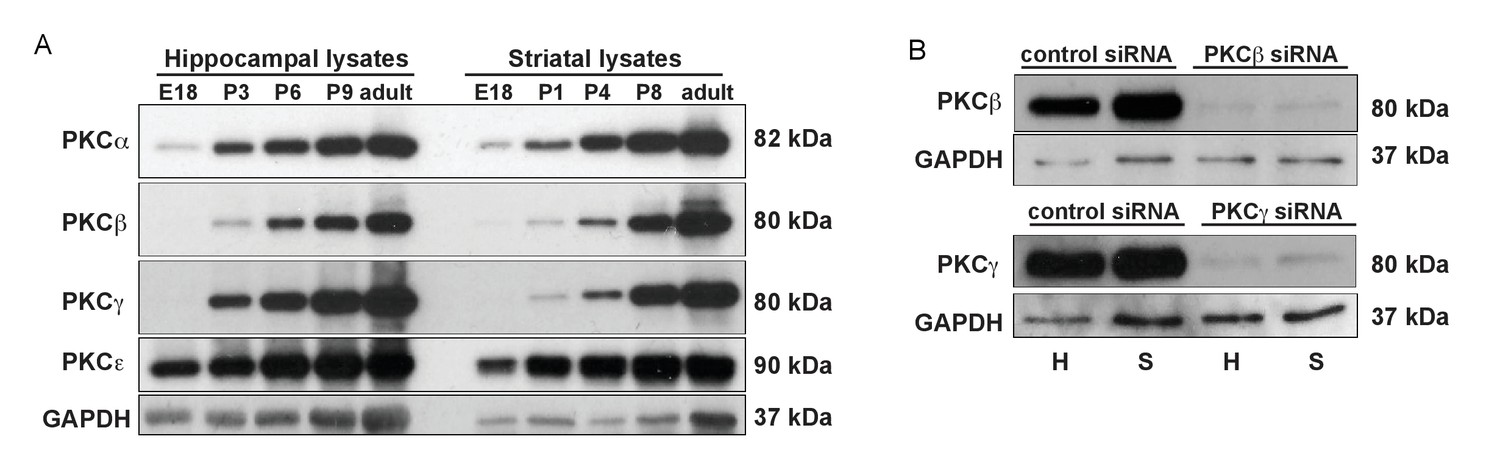
Expression of PKC isoforms in the hippocampus and striatum and siRNA knockdown of PKC-β and PKC-γ hippocampal and striatal cultures.
(A) Representative western blots of hippocampal and striatal lysates of hippocampal and striatal tissues probed with antibodies to PKC-α, PKC-β,PKC-γ, PKC-εand GAPDH loading controls. (B) Representative western blots of lysates of high-density hippocampal (H) and striatal (S) cultures transfected with either control siRNA, PKC-β siRNA or PKC-γ siRNA and probed with antibodies to PKC-β,PKC-γ and GAPDH.
Figure 7 with 1 supplement
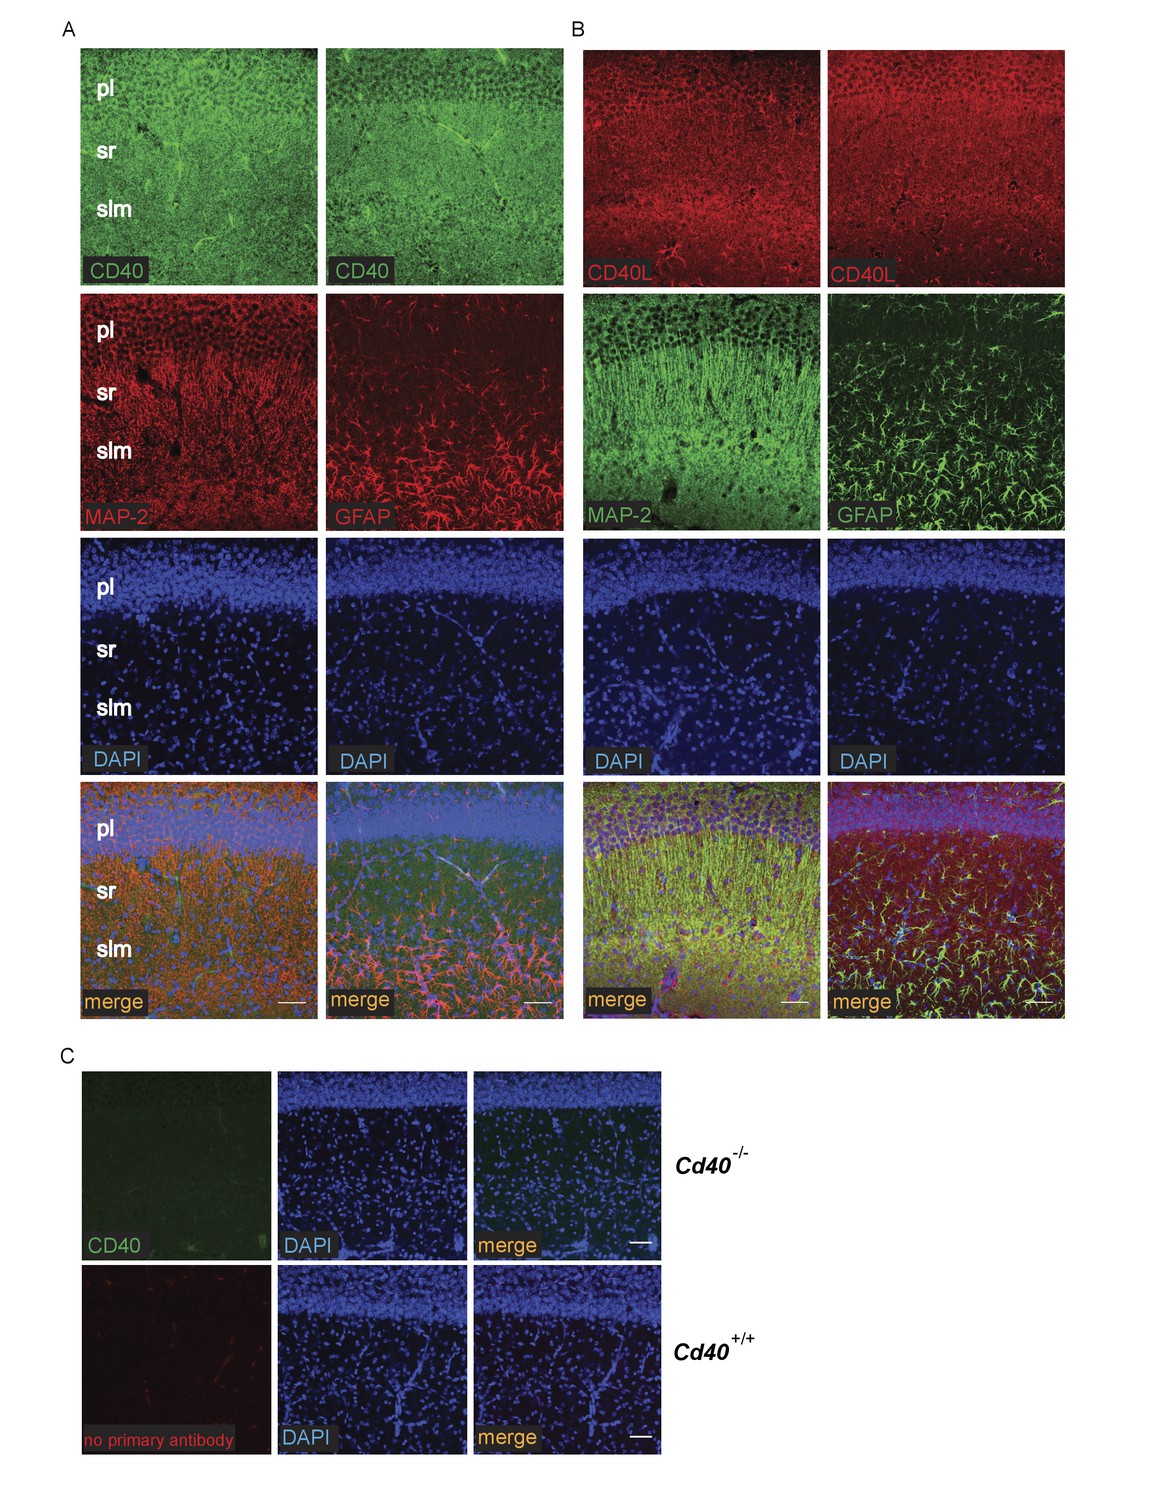
Localization of CD40 and CD40L in the developing hippocampus.
Representative images of sections of the CA1 region of P9 hippocampi labelled with either anti-CD40 (A) or anti-CD40L (B) together with DAPI and either anti-MAP-2 or anti-GFAP (pl, pyramidal layer; sr, stratum radiatum; slm, stratum lacunosum moleculare). (C) Antibody specificity controls: sections of the hippocampus of P9 Cd40-/- mice incubated with the anti-CD40 antibody and sections of the hippocampus of P9 Cd40+/+ mice that received no primary antibody. Scales bar, 50 μm.
Figure 7—figure supplement 1
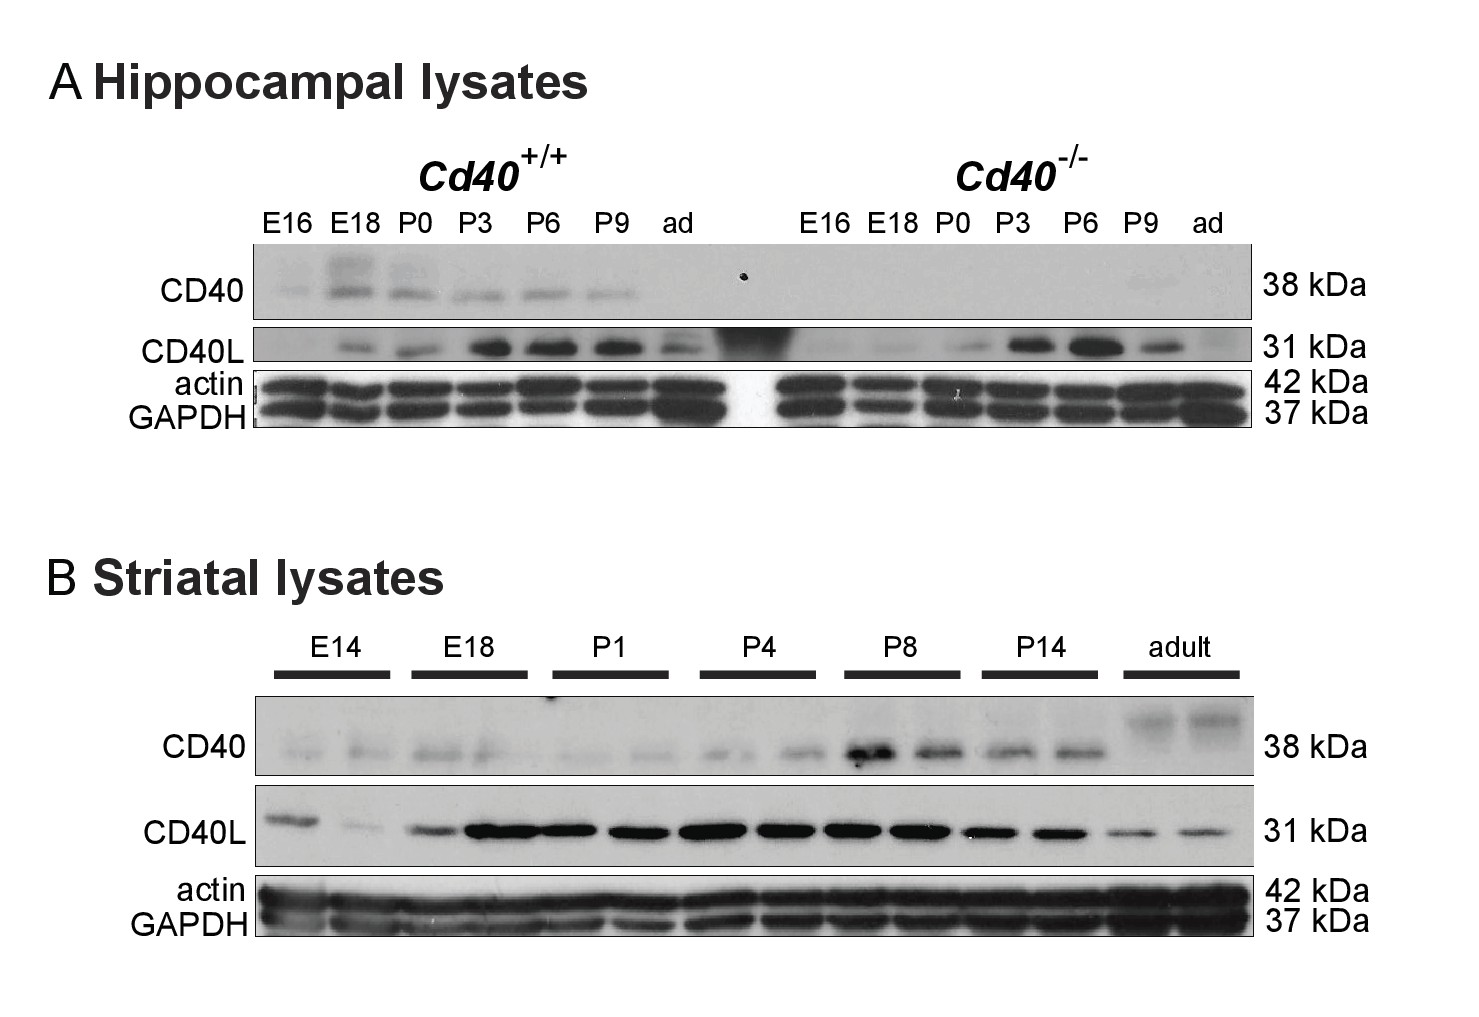
Expression of CD40 and CD40L in the developing hippocampus and striatum.
Representative western blots of hippocampal lysates of Cd40+/+ and Cd40-/- mice (A) and striatal lysates of Cd40+/+ mice (B) from embryonic, postnatal and adult (ad) mice probed with antibodies to CD40, CD40L, GAPDH and actin (loading controls). The band labelled in the lane between the Cd40+/+ and Cd40-/- tissue in (A) is the 31 kDa molecular weight marker.
Figure 8
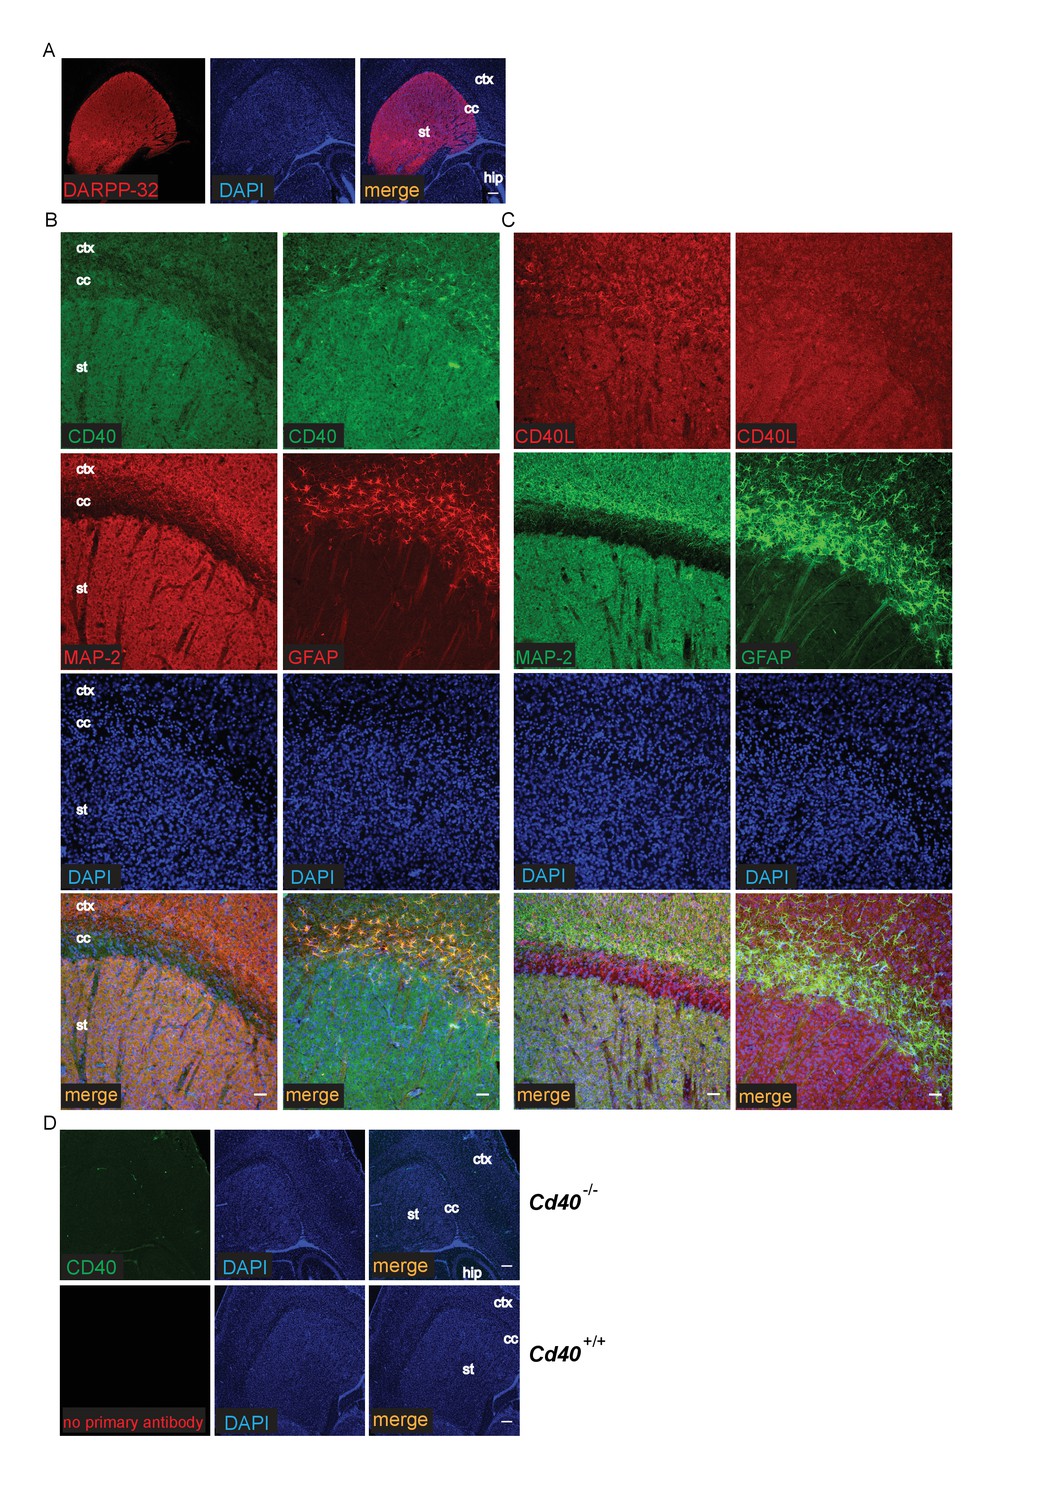
Localization of CD40 and CD40L in the developing striatum.
(A) Low-power images of the expression of striatal MSNs labelled with DARPP-32 and double labelled with DAPI. Scale bar, 250 μm. Representative higher power images of sections of the striatum labelled with either anti-CD40 (B) or anti-CD40L (C) together with DAPI and either anti-MAP-2 or anti-GFAP. (D) Antibody specificity controls: sections of the striatum of P9 Cd40-/- mice incubated with the anti-CD40 antibody and sections of the striatum of P9 Cd40+/+ mice that received no primary antibody (st, striatum; hip, hippocampus; ctx, cortex; cc, corpus callosum). Scale bar, 50 μm.
Figure 9

Co-localization of CD40 and CD40L in the cultured hippocampal pyramidal neurons and striatal MSNs.
(A) Representative images of dissociated E18 hippocampal cultures after 9 days in vitro triple labelling with anti-CD40, anti-CD40L and DAPI. The upper panels show images of neuronal cell bodies and proximal neural processes. The lower panels show distal neural processes. (B) Representative images of dissociated E14 striatal cultures after 10 days in vitro triple labelling with anti-CD40, anti-CD40L and βIII tubulin. Scale bar, 20 μm.
Additional files
-
Transparent reporting form
- https://doi.org/10.7554/eLife.30442.028
Download links
A two-part list of links to download the article, or parts of the article, in various formats.
Downloads (link to download the article as PDF)
Open citations (links to open the citations from this article in various online reference manager services)
Cite this article (links to download the citations from this article in formats compatible with various reference manager tools)
CD40 is a major regulator of dendrite growth from developing excitatory and inhibitory neurons
eLife 6:e30442.
https://doi.org/10.7554/eLife.30442


