Rapid DNA replication origin licensing protects stem cell pluripotency
- The University of North Carolina, United States
- The University of Minnesota, United States
- University of Minnesota, United States
- University of North Carolina, United States
Figures
Figure 1 with 3 supplements

Pluripotent stem cells load MCMs faster than differentiated cells.
(a) DNA-loaded MCM levels increase in G1 and decrease in S phase, whereas total MCM protein levels are constant throughout the cell cycle. (b) Flow cytometric analysis of DNA-loaded and total MCM in asynchronously proliferating RPE1-hTERT cells. Cell cycle phases are defined by DNA content and DNA synthesis. Left: Cells were labeled with EdU, extracted with nonionic detergent to remove unbound MCM, fixed, and stained with anti-MCM2 (a marker for the MCM2-7 complex), DAPI (total DNA), and for EdU incorporation (active DNA synthesis). Orange cells are S-phase with DNA-loaded MCM, blue cells are G1-phase with DNA-loaded MCM, and grey cells are G1/G2/M phase cells without DNA-loaded MCM. Right: Cells were treated as on the left except that they were fixed prior to extraction to detect total MCM2. (c) T98G cells were synchronized in G0 by contact inhibition and serum deprivation, then released into G1 for 10 or 12 hr, or re-synchronized in early S with hydroxyurea (HU), and released into S for 6 or 8 hr. MCM3 in chromatin-enriched fractions (Loaded) or whole cell lysates (Total) was detected by immunoblotting. (d) Chromatin flow cytometry of the indicated asynchronous cell lines measuring DNA content (DAPI), DNA synthesis (EdU incorporation), and loaded MCM (anti-MCM2). Blue Cells are G1-MCMDNA-positive and EdU-negative, orange are S phase-MCMDNA-positive; grey are G1/G2/M-MCMDNA-negative. (e) Stacked bar graph of cell cycle phase distribution from cells in (d); mean with error bars ± SD (n = 3 biological replicates). The percentage of G1 cells in each population is reported in the green sectors. The doubling times were calculated experimentally using regression analysis in GraphPad Prism.
Figure 1—figure supplement 1
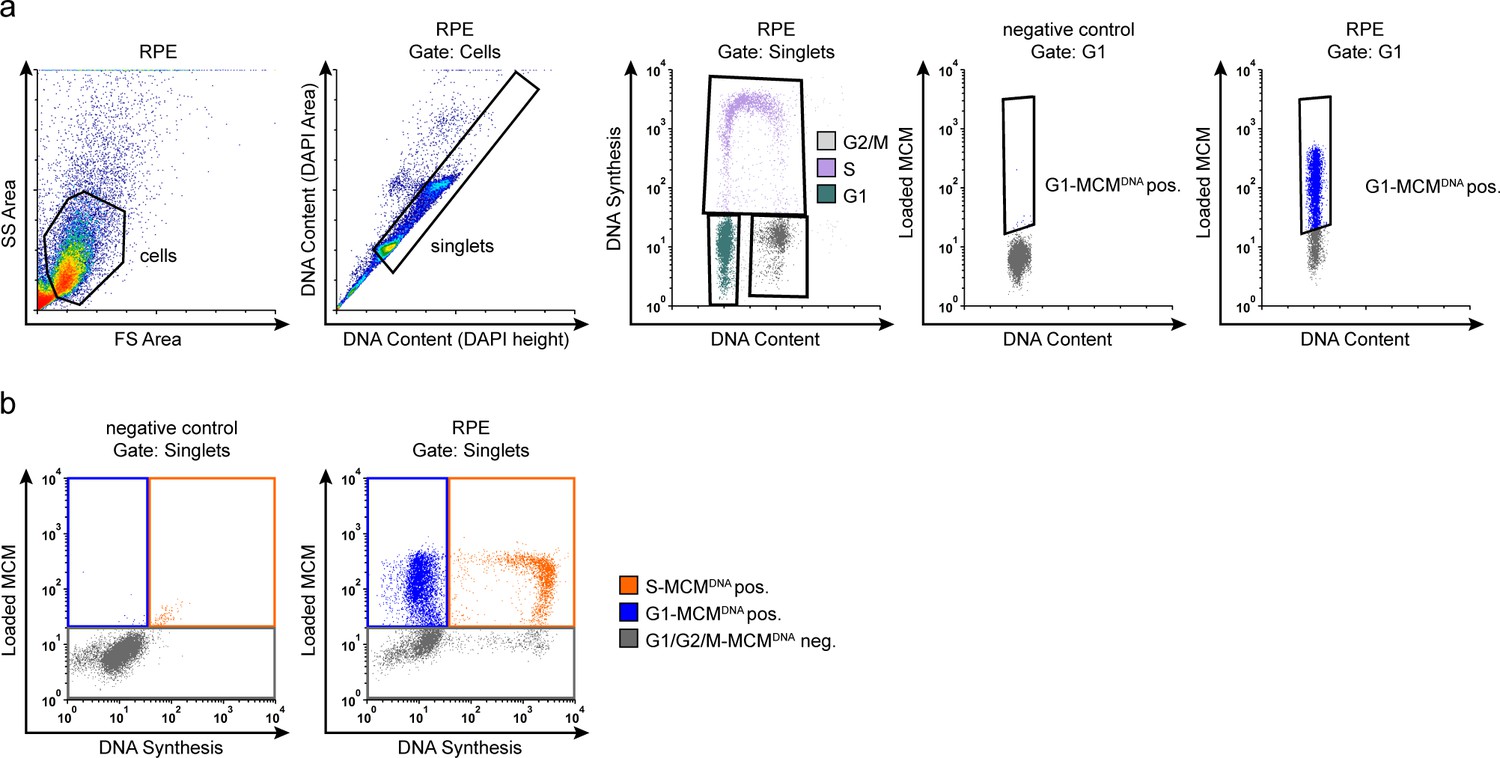
Flow cytometry gating.
(a) Example flow cytometry gating with chromatin extracted ARPE-19 (RPE) cells from Figure 1d, measuring loaded MCM (anti-MCM2), DNA Synthesis (EdU incorporation) and DNA content (DAPI). Gating to discriminate cells from debris was on FS-area vs SS-area, singlets (individual cells) from clumps of cells/doublets was on DAPI height vs DAPI area, cell cycle phases were determined on DAPI vs EdU Non-specific background staining by the secondary antibody was measured using a negative control sample stained without primary antibody, only secondary antibody. This background threshold gate was applied to experimental samples; G1-MCMDNA-positive cells were identified first by DNA content and EdU negative status (G1) and then by MCM2 signal. (b) Example flow cytometry color gating with chromatin extracted ARPE-19 cells from Figure 1d. Left: Negative control to define background staining with neither EdU detection nor MCM2 primary antibody. Cells were stained with DAPI, subjected to EdU detection chemistry, and stained with secondary antibody. Background thresholds were set using these controls and applied to experimental samples. Right: Experimental samples in main Figure 1d showing the gating to identify DNA synthesis (EdU), and loaded MCM (anti-MCM2). Gates define color schemes for color dot plots.
Figure 1—figure supplement 2
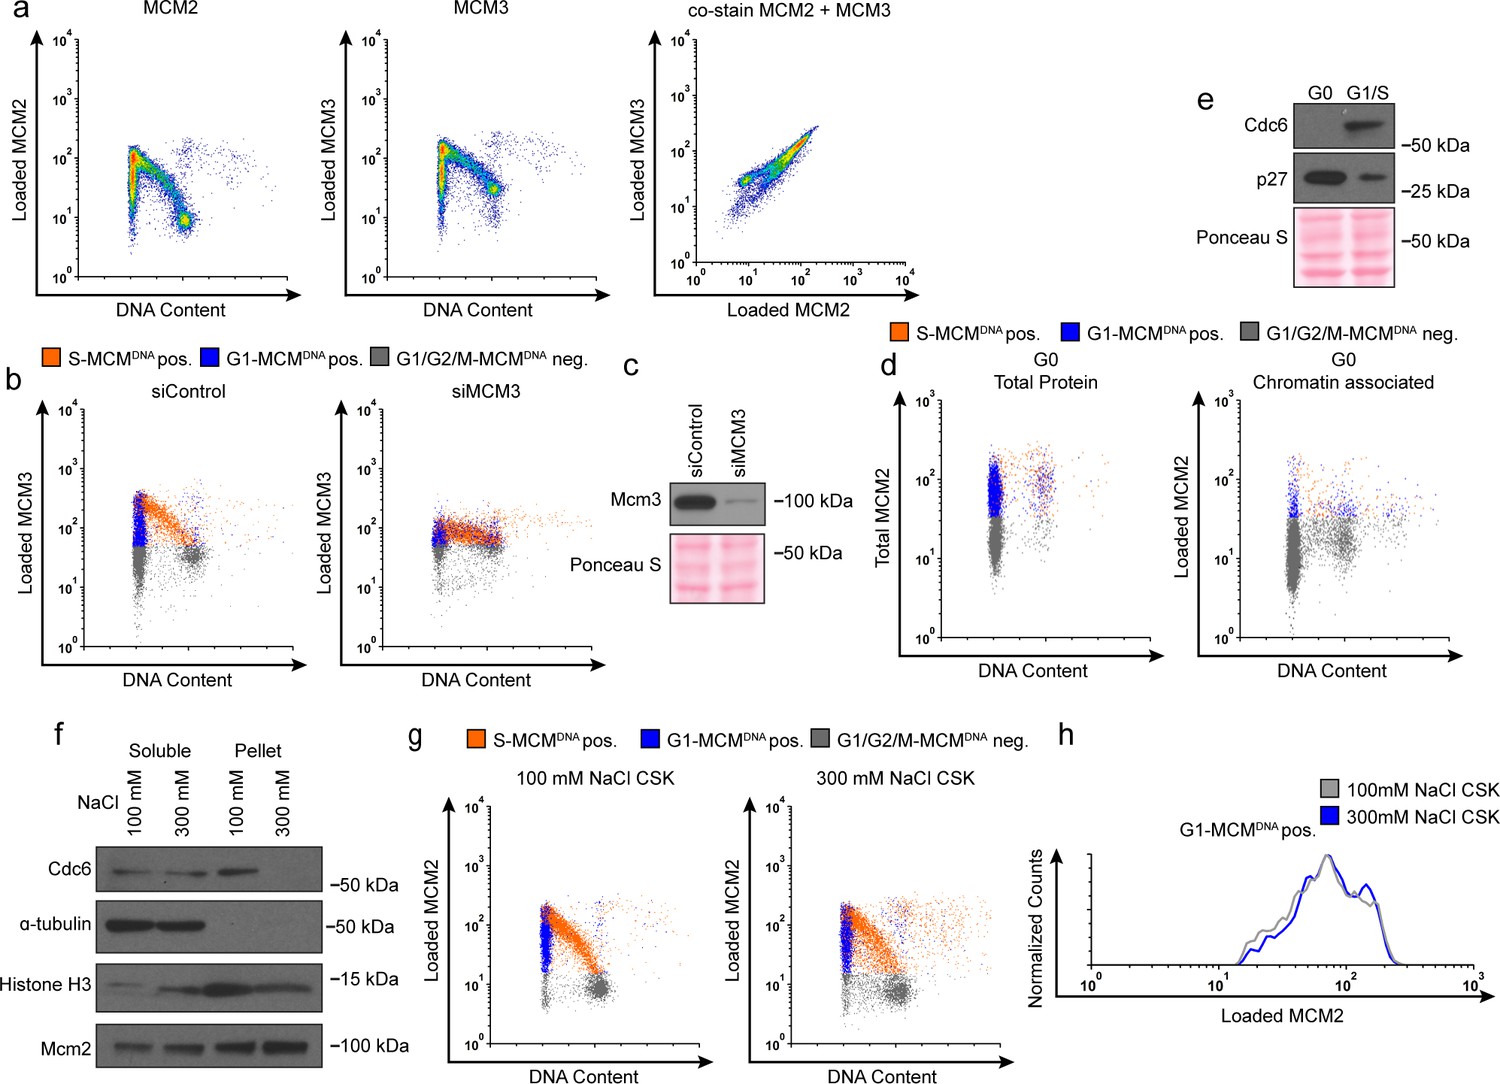
Validation of chromatin flow cytometry.
(a) Chromatin flow cytometry of RPE cells stained for loaded MCM2 (anti-MCM2), loaded MCM3 (anti-MCM3), and DNA content (DAPI). All three plots are the same sample. Cells stained with monoclonal MCM2 antibody for loaded MCM2 co-stain equally well for a polyclonal MCM3 antibody for loaded MCM3. (b) Chromatin flow cytometry of RPE cells treated with 100 nM siControl or a 100 nM pool of siMCM3 for 72 hr, measuring DNA content (DAPI), DNA synthesis (EdU incorporation), and loaded MCM3 (anti-MCM3). Loaded MCM3 levels decrease with siMCM3 treatment, demonstrating antibody specificity. (c) Immunoblot of cells from (b). (d) RPE cells synchronized in G0 by contact inhibition. Left: Total protein flow cytometry of G0 cells measuring total MCM (anti-MCM2), DNA synthesis (EdU incorporation) and DNA content (DAPI). Right: Chromatin flow cytometry of G0 cells measuring loaded MCM (anti-MCM2), DNA synthesis (EdU incorporation) and DNA content (DAPI). G0 cells lack loaded MCM, demonstrating antibody specificity. (e) Immunoblot of cells for (d) demonstrating G0 synchronization. (f) Immunoblots of cells fractionated into soluble protein and pellet (chromatin associated protein) using a normal-salt CSK buffer (100 mM NaCl) or high-salt CSK buffer (300 mM NaCl). High salt 300 mM NaCl strips away weakly chromatin-associated proteins, including Cdc6. (g) Chromatin flow cytometry of cells lysed with normal 100 mM NaCl CSK or high salt 300 mM NaCl CSK. (h) Histograms of only the G1-MCMDNA-positive cells from (g). The loaded MCM in G1 remains constant with high salt, demonstrating the chromatin flow cytometry measures DNA-loaded MCM. Note the harsh 300 mM salt alters nuclear morphology and scatter by flow cytometry; for this reason, we used the 100 mM NaCl extraction for all other flow cytometry experiments.
Figure 1—figure supplement 3
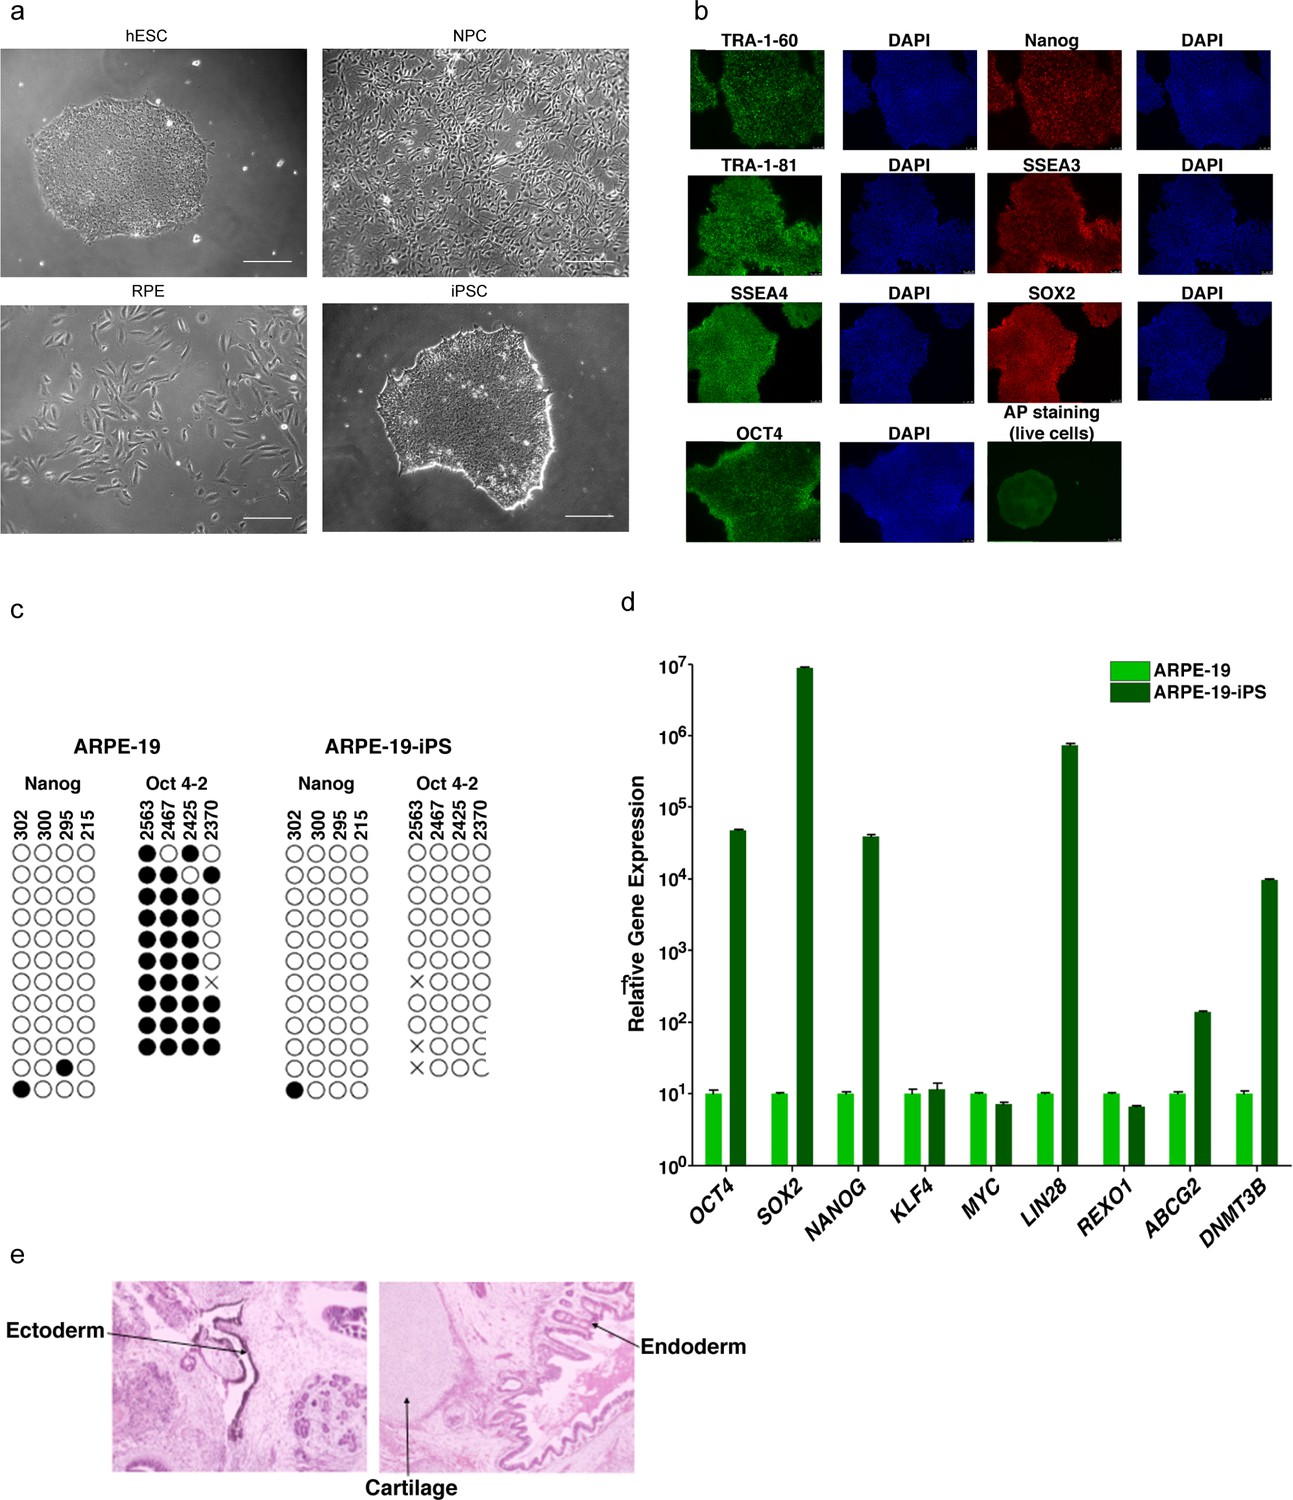
Characterization of pluripotent and differentiated cells.
(a) Representative phase contrast images in greyscale of indicated cell lines from Figure 1d. Scale bar is 50 μm. (b) Immunofluorescence analysis of iPS cells visualizing TRA-1–60, TRA-1–81, SSEA or OCT4 (in green) and Nanog, SSEA3 or SOX2 (in red). DAPI counterstaining for DNA indicates the nuclei of individual cells in each colony. Live alkaline phosphatase (AP) staining was also performed as a positive indicator of stem cells. (c) Bisulfite sequencing analysis of the NANOG and OCT4-2 promoter regions in ARPE-19 and ARPE-19-iPS cells is indicated. Methylated CpGs are indicated with a closed circle, and unmethylated CpGs are indicated with an open circle. An ‘X’ indicates a mismatch or gap in the bisulfite sequence. The CpG position relative to the downstream transcription start site is shown above each row. (d) Quantitative RT-PCR analysis showing the relative gene expression of OCT4, SOX2, NANOG, KLF4, MYC, LIN28, REXO1, ABCG2 and DNMT3B in ARPE-19 and ARPE-19-iPS cells (normalized to GAPDH). Error bars indicate standard error. (e) Hematoxylin and eosin staining of teratoma sections from immunodeficient mice injected with ARPE-19-iPS cells show cartilage, as well as endoderm and ectoderm teratoma formed by ARPE-19-iPS.
Figure 2 with 1 supplement
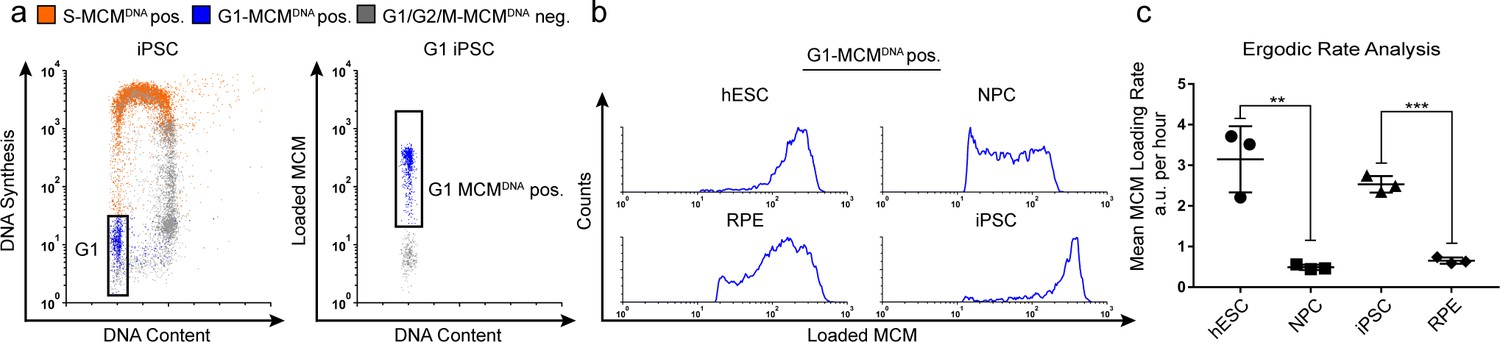
Quantification of MCM loading rate by ergodic rate analysis.
(a) Gating scheme for chromatin flow cytometry of iPSCs measuring DNA content (DAPI), DNA synthesis (EdU incorporation), and loaded MCM (anti-MCM2); this sample is from Figure 1d. (b) Histograms of only the G1-MCMDNA-positive cells from the four chromatin flow cytometry samples in Figure 1d. (c) Calculated mean MCM loading rate per hour by ergodic rate analysis; mean with error bars ± SD. (n = 3 biological replicates), unpaired two tailed t-test. **p=0.0049. ***p=0.001. See Materials and methods for details. See also Figure 2—source data 1.
-
Figure 2—source data 1
Raw ERA values.
- https://doi.org/10.7554/eLife.30473.009
Figure 2—figure supplement 1
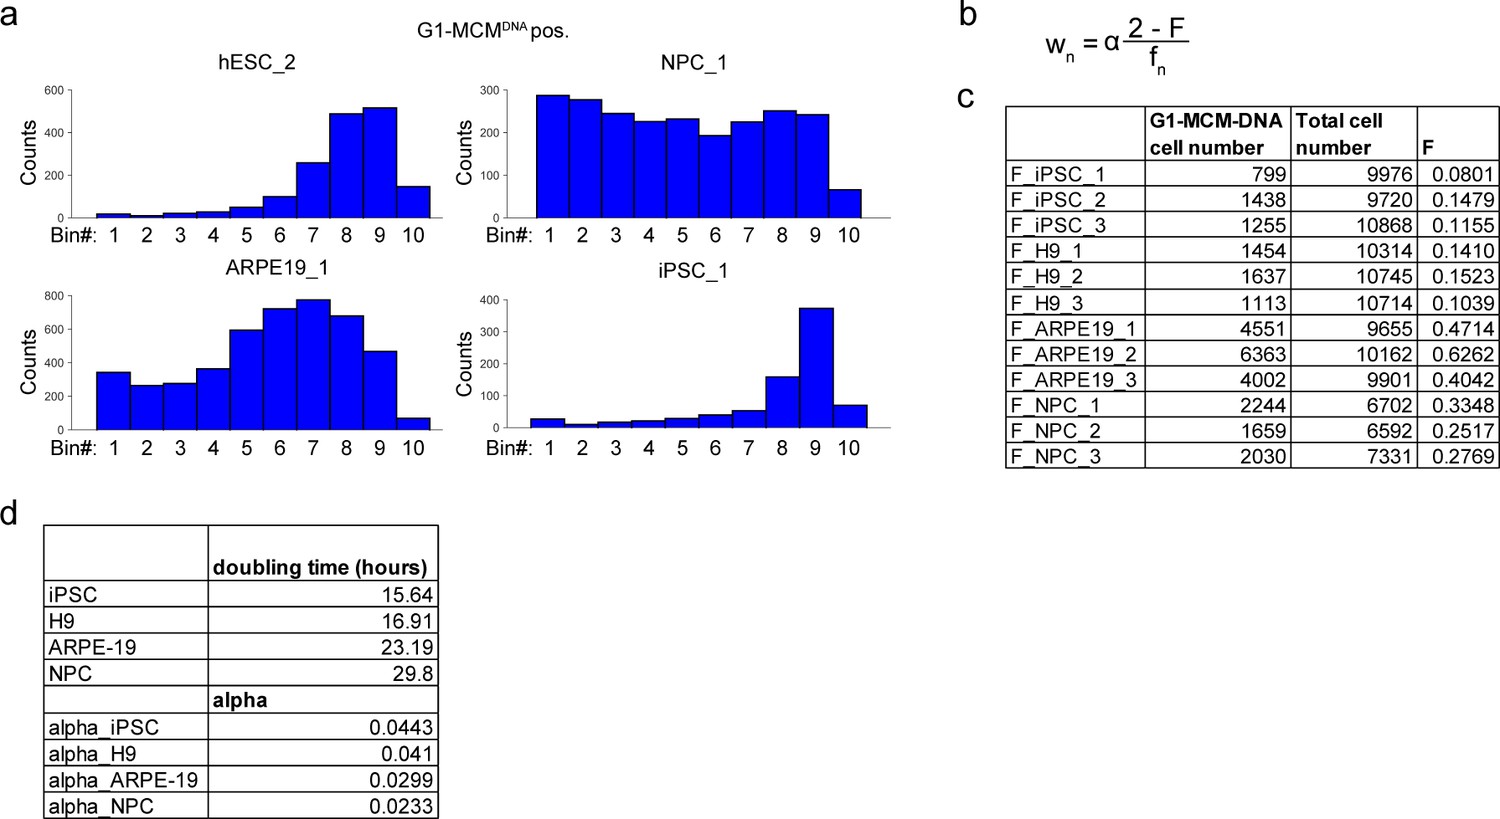
Ergodic rate analysis binning.
(a) Histograms from G1-MCMDNA-positive samples in Figure 2B, binned into 10 regions for ergodic rate analysis (see Materials and methods). (b) Ergodic rate equation based on Kafri et al. (2013). wn is the rate in each bin n, α is a constant accounting for doubling time, F is the fraction of cells in G1-MCMDNA positive out of all cells, fn is the fraction of cells in each bin n out of G1-MCMDNA positive (see Materials and methods). (c) Value of F for three biological replicates for each cell line, used to calculate Figure 2c. (d) Doubling time and alpha values used to calculate rates in Figure 2c.
Figure 3 with 1 supplement
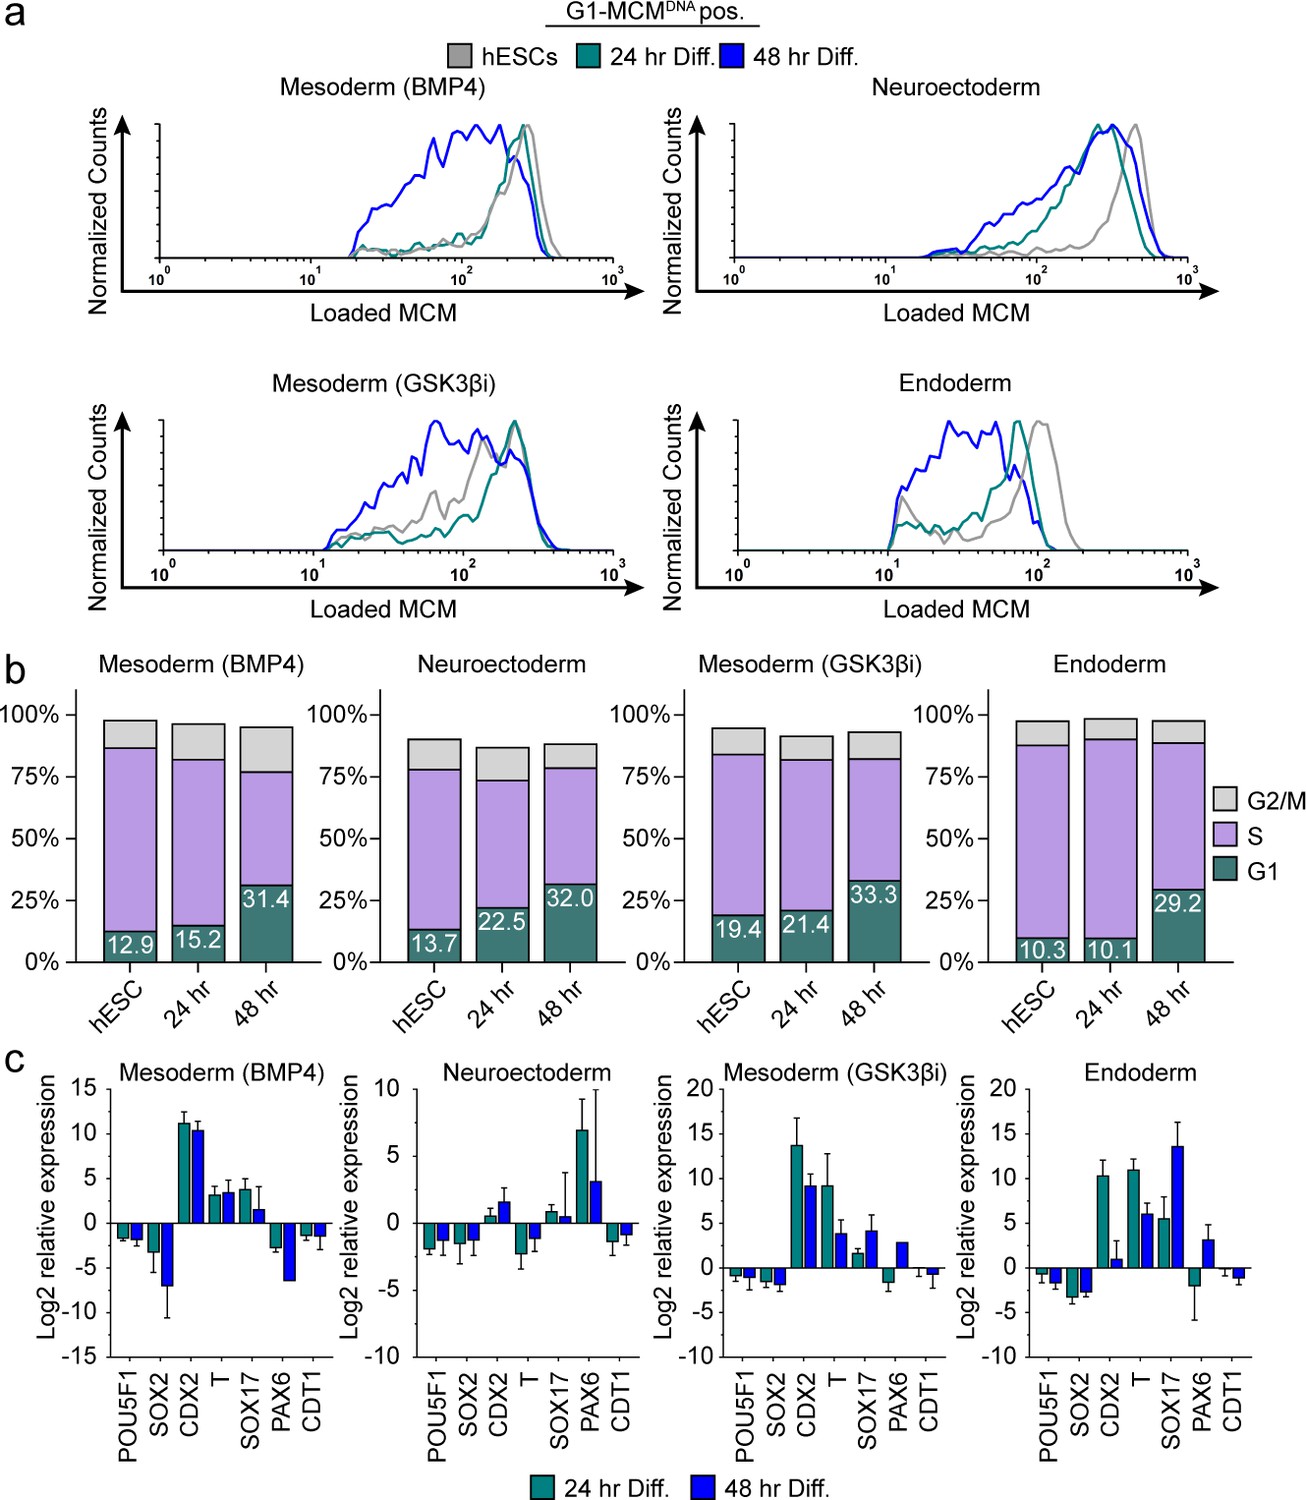
Differentiation universally decreases MCM loading rate.
(a) Chromatin flow cytometry of hESCs induced to differentiate toward mesoderm (BMP4), neuroectoderm, mesoderm (GSK3βi), or endoderm for 24 or 48 hr. Histograms show only G1-MCMDNA cells positive as in Figure 2b. See methods for differentiation protocols. Cell counts for 24 hr and 48 hr were normalized relative to corresponding hESC samples. (b) Stacked bar graphs of cell cycle distribution for cells in (a). (c) Gene expression analysis of differentiation markers by quantitative PCR of the samples in (a); log2 expression is relative to the undifferentiated cells. Data are mean ±SD of two biological replicates.
Figure 3—figure supplement 1
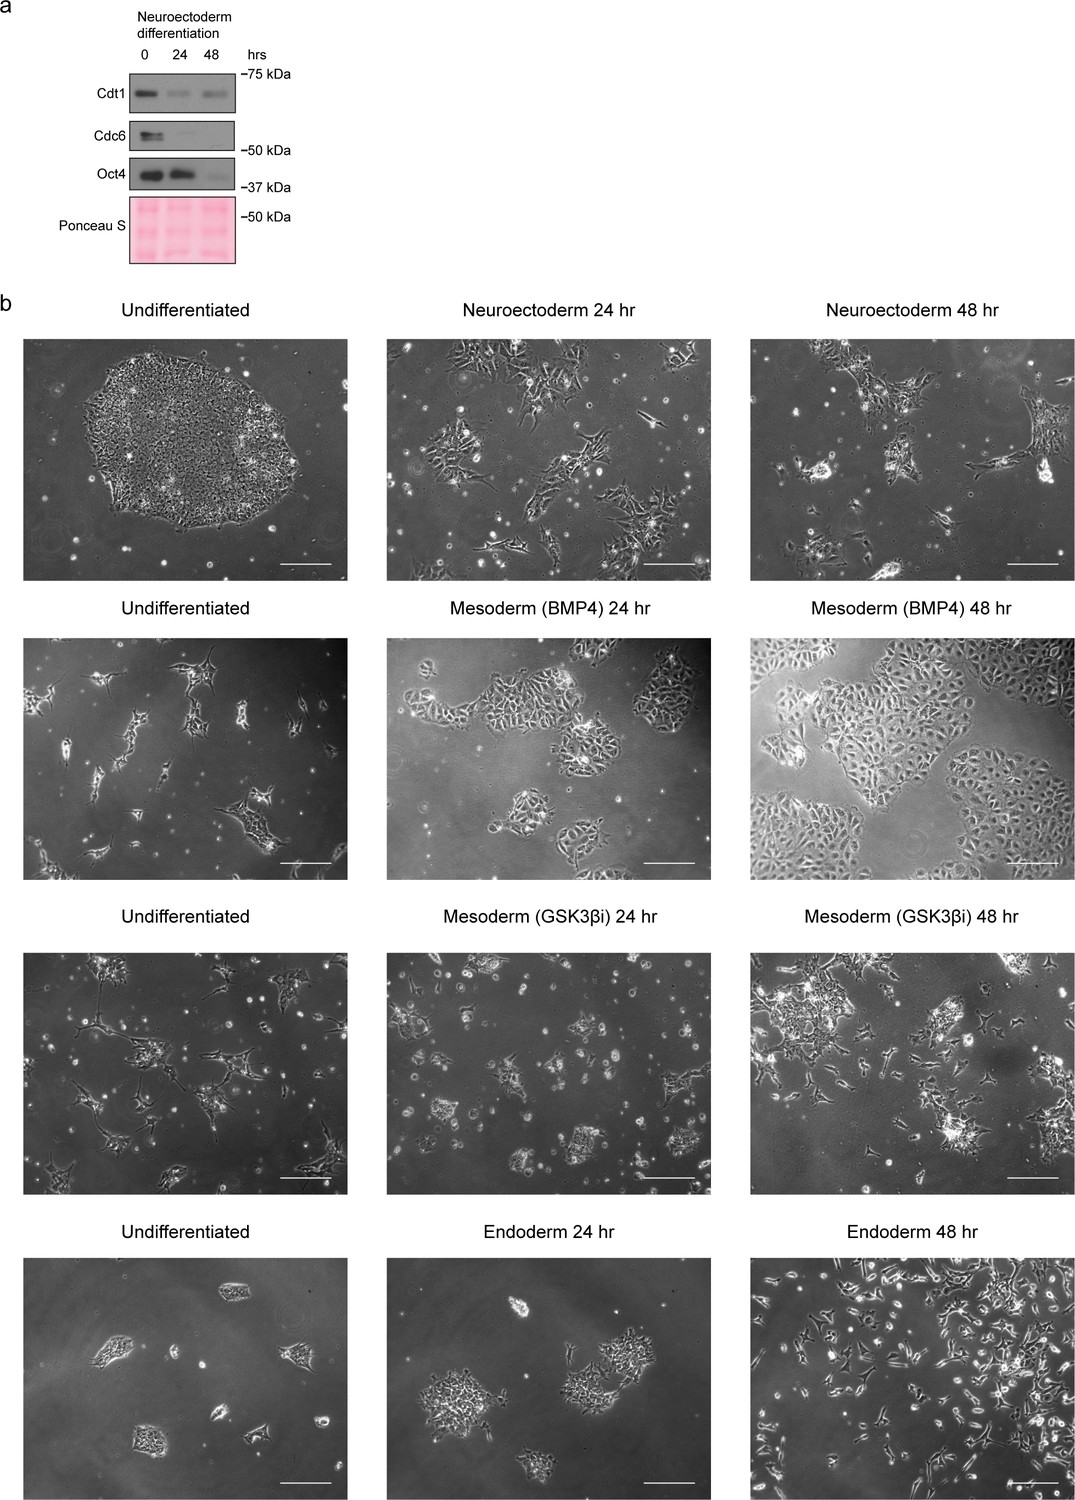
Stem cell differentiation.
(a) Immunoblots of neuroectoderm differentiation, as in Figure 3a. (b) Representative phase contrast images during the indicated differentiation protocols from Figure 3a. Scale bar is 50 μm.
Figure 4 with 1 supplement
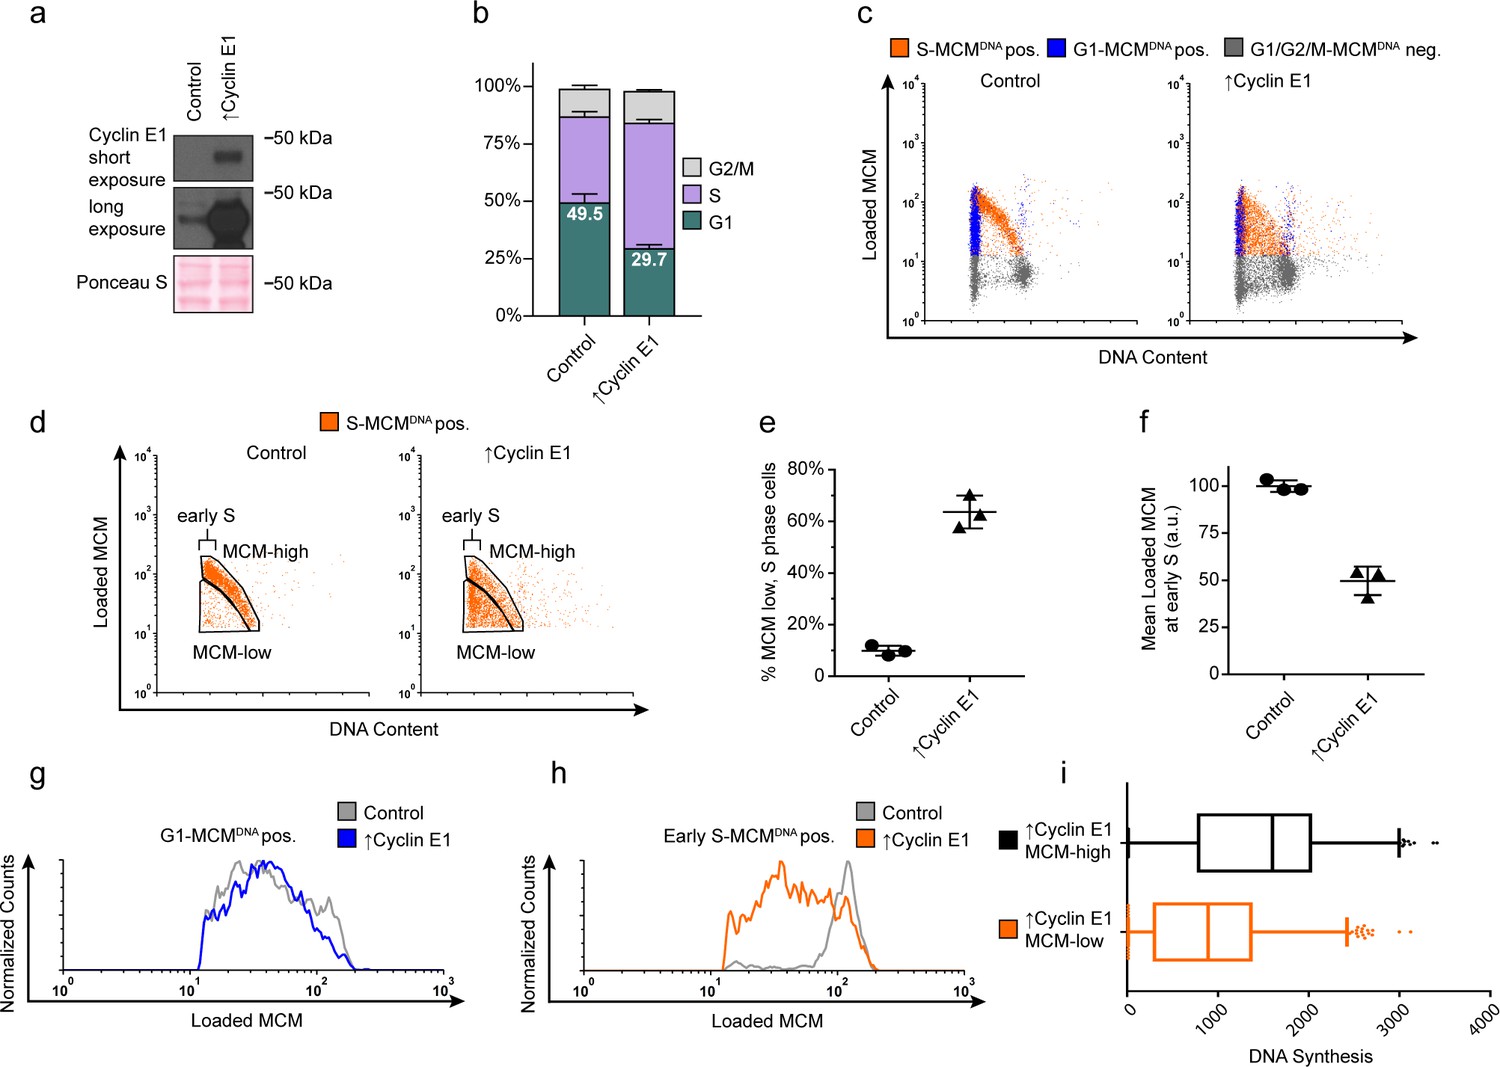
Cyclin E overproduction uncouples MCM loading and G1 length.
(a) Immunoblots of a stable derivative of RPE1-hTert cells bearing an integrated doxycycline-inducible cyclin E construct treated with 100 ng/mL doxycycline for 72 hr to overproduce Cyclin E1 (↑Cyclin E1) or with vehicle control. (b) Stacked bar graphs of cell cycle distribution measured by flow cytometry for cells shown in (a); mean with error bars ± SD (n = 3 biological replicates). (c) Chromatin flow cytometry of control or cyclin E-overproducing cells measuring DNA content (DAPI), DNA synthesis (EdU incorporation), and loaded MCM (anti-MCM2). (d) S phase-MCMDNA-positive cells from samples in (c) divided into populations that began S phase with high or low MCMDNA. Early S cells are S phase cells with G1 DNA content. (e) The percentage of MCMDNA positive, but-low MCM signal intensity S phase cells out of all S-MCMDNA-positive cells from three biological replicates; mean with error bars ± SD, unpaired two tailed t-test. ***p=0.002. (f) Mean loaded MCM in early S phase, (S-MCMDNA positive, G1 DNA content) from three biological replicates; mean with error bars ± SD, unpaired two tailed t-test. ***p=0.0004. (g) Histogram of G1-MCMDNA-positive cells from samples shown in (c). Counts for ↑Cyclin E1 are normalized to the control. (h) Histogram of early S cells from samples shown in (d). Counts for ↑Cyclin E1 are normalized to the control. (These data are one of the replicates quantified in (f).). (i) EdU intensity from ↑Cyclin E1, MCM-high or MCM-low cells from (d) as box-and-whiskers plots. Center line is median, outer box edges are 25th and 75th percentile, whiskers edges are 1st and 99th percentile, individual data points are lowest and highest 1%, respectively. Median EdU incorporation of MCM-high ↑Cyclin E1 cells is 1.8 fold greater than MCM-low, mean EdU incorporation is 1.6-fold greater in MCM-high than MCM-low, average of three biological replicates. Samples compared by unpaired, two tailed t-test, **p=0.0027, **p=0.0033, respectively.
Figure 4—figure supplement 1
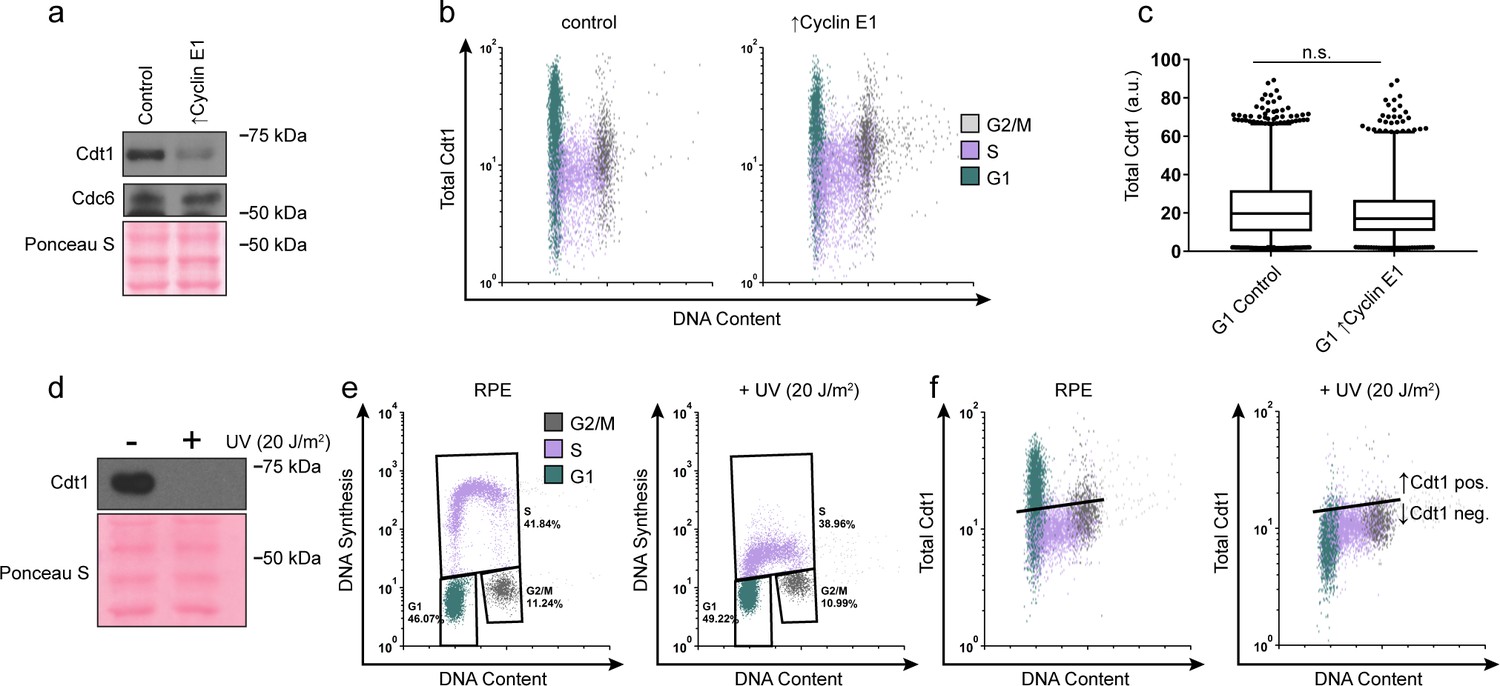
G1 Cdt1 levels are unaffected by Cyclin E overproduction.
(a) Immunoblots of whole cell lysates of asynchronous cells treated as in (Figure 4a). (b) Total Cdt1 detected by flow cytometry of cells treated as in Figure 4a measuring DNA content (DAPI), DNA synthesis (EdU incorporation), and Cdt1 (anti-Cdt1). Green are G1 cells, Purple are S phase cells (EdU positive), Grey are G2/M DNA content. (c) Box-and-whiskers plots of G1 Cdt1 concentration per cell from (b). Center line is median, outer box edges are 25th and 75th percentile, whiskers edges are 1st and 99th percentile, individual data points are lowest and highest 1%, respectively. G1 Cdt1 intensity in controls is 1.1-fold greater mean and 1.2-fold greater median than G1 ↑Cyclin E1. Samples were not significantly different, compared by two-tailed, unpaired t test, p=0.1907, p=0.3525, respectively; average of three biological replicates. (d) Immunoblot of whole cell lysate from RPE1-htert cells treated with or without 20 J/m2 of UV irradiation, collected 1 hr after irradiation. UV irradiation induces DNA repair coupled PCNA loading, subsequently targeting Cdt1 for degradation (Arias and Walter, 2005). (e) Flow cytometry of control and UV irradiated cells as in (a), measuring DNA content (DAPI), DNA synthesis (EdU incorporation), and Cdt1 (anti-Cdt1). Plots demonstrate decreased DNA synthesis after UV irradiation. (f) The same samples as in (e). G1 Cdt1 is degraded upon UV-induced DNA repair, demonstrating Cdt1 antibody specificity for immunofluorescence flow cytometry. Black line indicates background defined by controls staining with the secondary antibody alone. Cells below the line (such as the S phase cells) are Cdt1 negative. Cells above the line are Cdt1 positive.
Figure 5
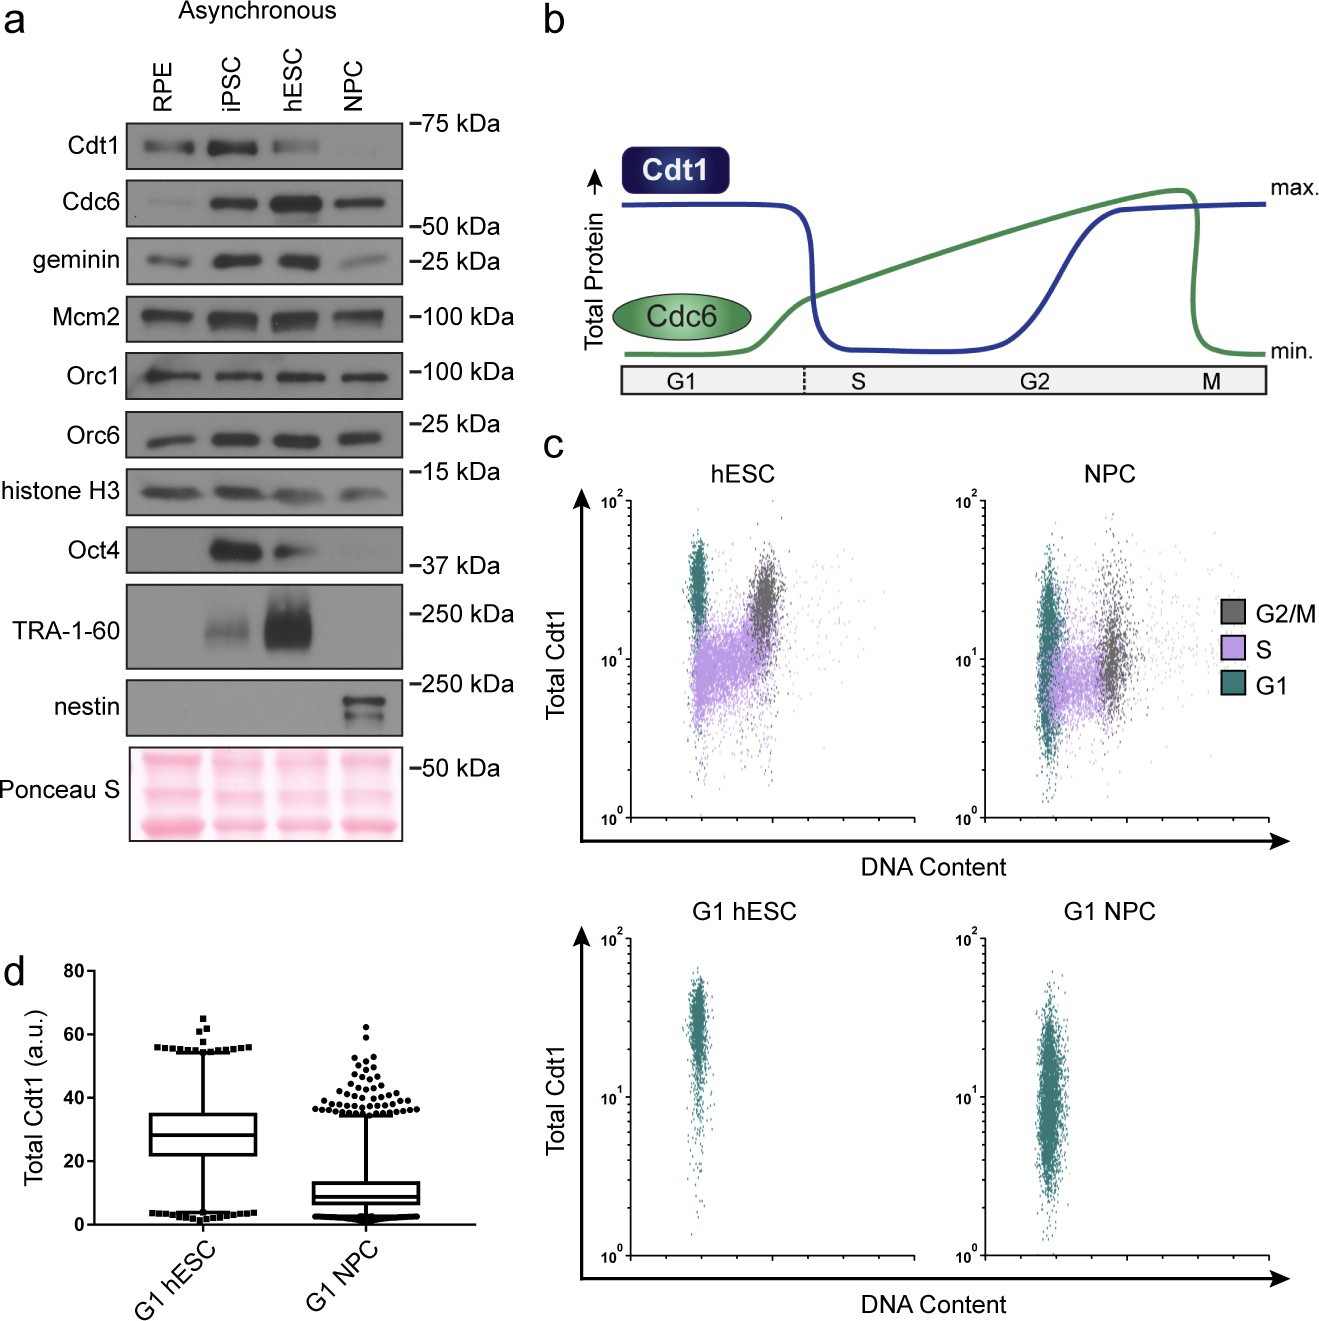
hESCs have high levels of Cdt1 in G1.
(a) Immunoblots of whole cell lysates from the indicated asynchronous cell lines. (b) Expected changes in total protein levels of Cdt1 and Cdc6 during the human cell cycle. (c) Total Cdt1 detected in asynchronous cells by flow cytometry measuring DNA content (DAPI), DNA synthesis (EdU incorporation), and Cdt1 (anti-Cdt1). Green cells are G1, purple cells are S phase (EdU positive), grey cells are G2/M. (d) Box-and-whiskers plots of G1 Cdt1 concentration per cell from (C). Center line is median, outer box edges are 25th and 75th percentile, whiskers edges are 1st and 99th percentile, individual data points are lowest and highest 1%, respectively. Median G1 Cdt1 in hESCs is 2.9-fold greater, mean is 2.2-fold greater than G1 Cdt1 in NPCs, mean p=0.0504 median p=0.0243, average of three biological replicates. Flow plots are G1 cells only (green) from (c).
Figure 6 with 1 supplement
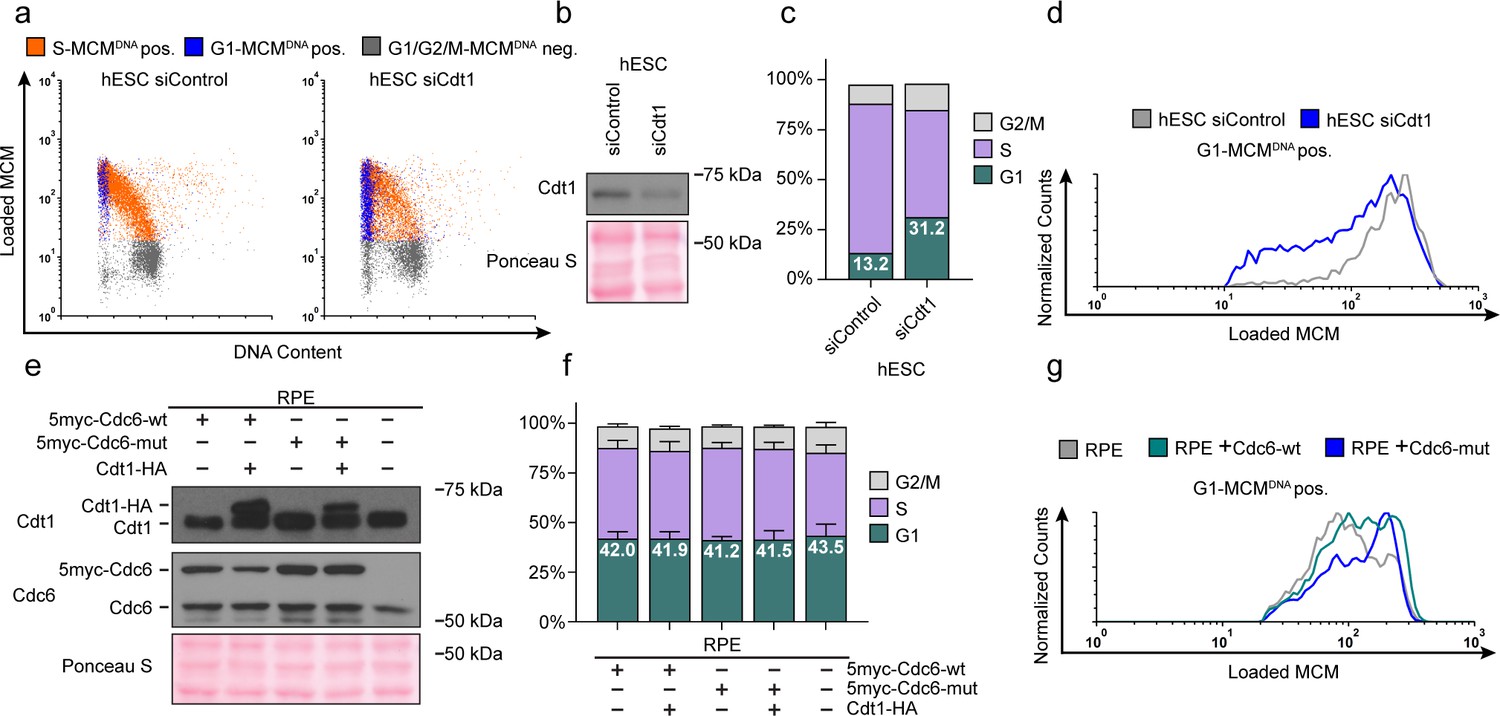
Manipulating MCM loading factors alters MCM loading rates.
(a) Chromatin flow cytometry for hESCs treated with 25 nM siCdt1 or 100 nM siControl for 24 hr and labeled with EdU for 30 min prior to harvest. (b) Immunoblot of total protein from cells in (a). (c) Stacked bar graph of cell cycle distributions for samples in (a); representative of two biological replicates. The percentage of G1 cells in each population is reported in the green sectors. (d) Histograms of loaded MCM in G1-MCMDNA cells. Counts for siCdt1 are normalized to the corresponding siControl sample. (e) Immunoblots of Cdt1 and Cdc6 in RPE cells with combinations of the following: constitutive production of 5Myc-Cdc6-wt or 5myc-Cdc6-mut (not targeted for degradation by APCCDH1: R56A, L59A, K81A, E82A, N83A) and an integrated doxycycline-inducible Cdt1-HA construct treated with 100 ng/mL doxycycline for 48 hr to overproduce Cdt1-HA. (f) Stacked bar graphs of cell cycle distribution measured by flow cytometry for cells shown in (e); mean with error bars ± SD (n = 3 biological replicates). The percentage of G1 cells in each population is reported in the green sectors. (g) Histogram of loaded MCM in G1-MCMDNA-positive cells from (e). Counts of Cdc6-wt and Cdc6-mut are normalized to parent RPE controls.
Figure 6—figure supplement 1
Manipulating MCM loading factors alters MCM loading rates.
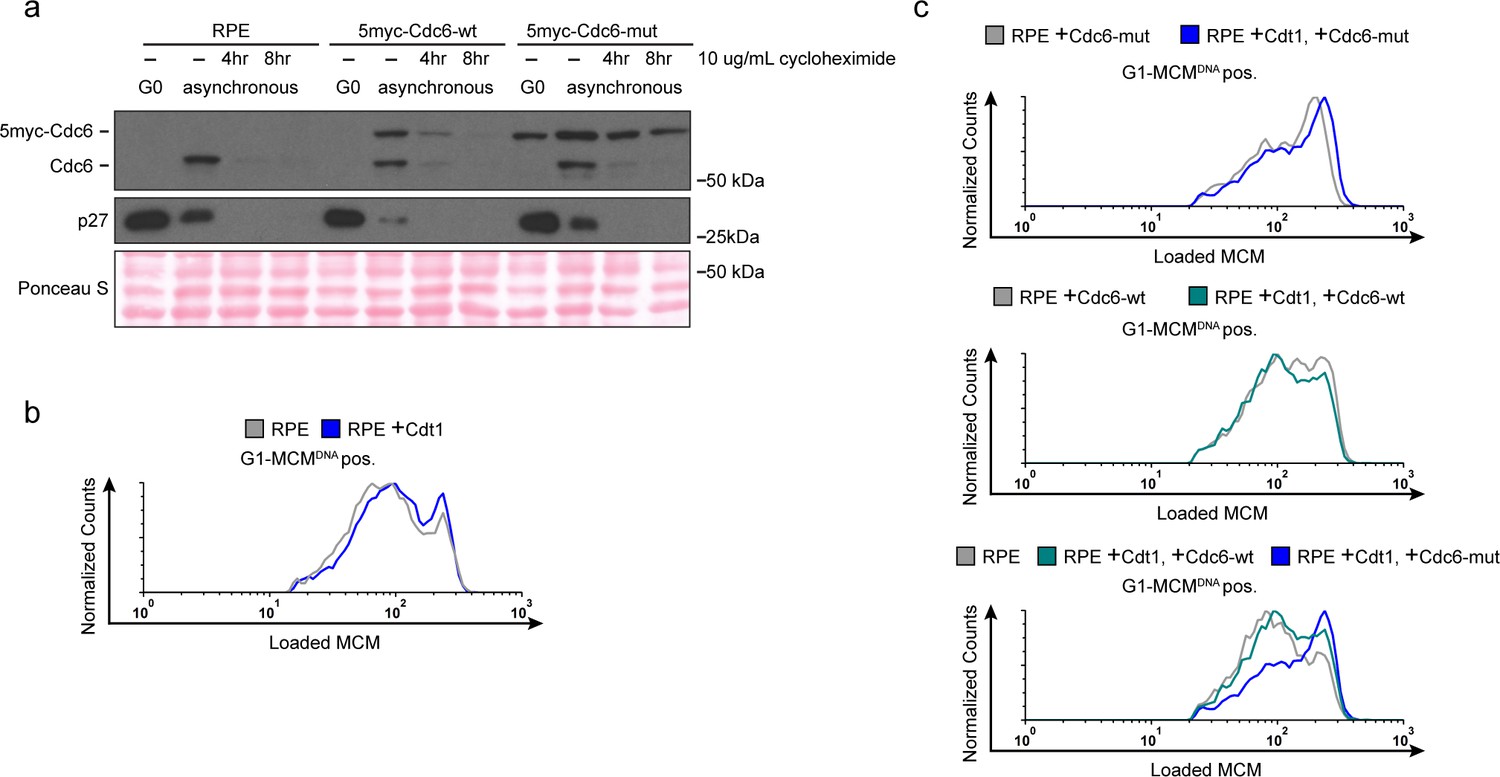
(a) Validation of the 5myc-Cdc6-mut. Immunoblots of total cell lysates of RPE, RPE +5myc-Cdc6-wt or RPE +5myc-Cdc6-mut. Cells were synchronized in G0 by contact inhibition. Asynchronous cells were treated with 10 ug/mL cycloheximide for 4 or 8 hr. Cdc6-mut is more stable in cycloheximde and is resistant to APCCDH1-induced degradation in G0 cells. (b) Histogram of loaded MCM in G1-MCMDNA positive cells in RPE cells expressing ectopic Cdt1 compared to control. There is little increase in MCM loading rate. Counts of Cdt1-expressing cells (blue,+Cdt1) are normalized to parent RPE controls (grey). (c) Histogram of loaded MCM in G1-MCMDNA-positive cells in RPE cells from (Figure 6e) with the indicated combinations of Cdc6 and Cdt1 expression. Counts in experimental samples (green and blue) are normalized to their respective controls (grey).
Figure 7 with 3 supplements
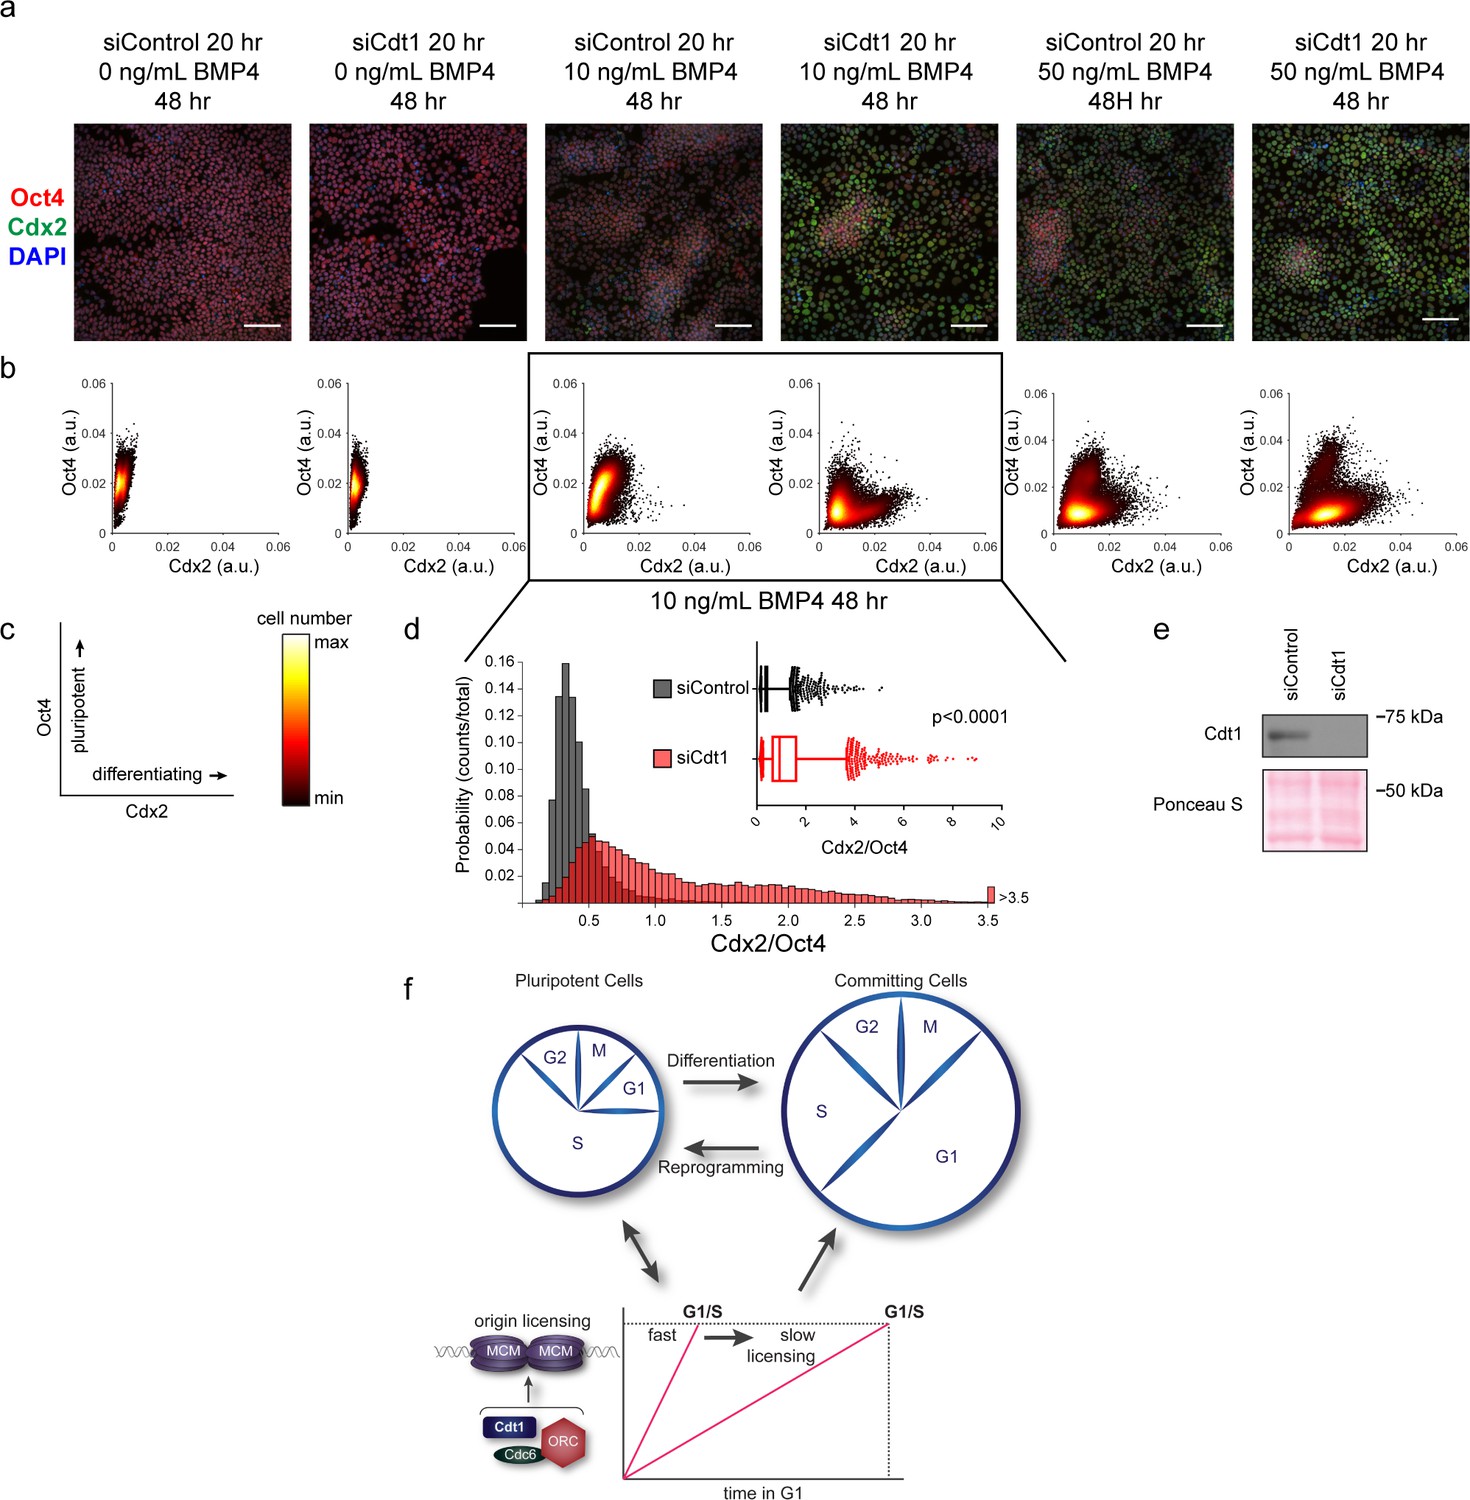
Slow MCM loading promotes differentiation.
(a) Immunofluorescence microscopy of hESCs treated with 100 nM of siControl or 100 nM of siCdt1 for 20 hr and then treated with BMP4 as indicated. Cells were fixed and stained with DAPI (blue), Cdx2 antibody (green), and Oct4 antibody (red). Images are one region of 18 fields-of-view per condition; scale bar is 100 μm (see Materials and methods). (b) Density scatterplots of mean fluorescence intensity (arbitrary units) of Oct4 and Cdx2 staining for each cell in each condition, >18,000 cells were quantified per condition. See also Figure 7—source data 1. (c) Diagram of the relationship between Oct4 and Cdx2 in pluripotent and differentiated cells as plotted in (b); color bar for scatterplots in (b). (d) Histogram of mean fluorescence intensity ratio Cdx2/Oct4 for all cells in siControl and siCdt1 treated with 10 ng/mL BMP4 for 48 hr. Rightmost histogram bin contains all values greater than 3.5. The inset is a box-and-whiskers plot of the same data, center line is median, outer box edges are 25th and 75th percentile, whiskers edges are 1st and 99th percentile, individual data points are lowest and highest 1%, respectively. Medians are 0.3722, 0.9319, and means are 0.4285, 1.194 for siControl and siCdt1, respectively. Samples compared by two tailed Mann-Whitney test, ****p<0.0001. See also Figure 7—source data 1. (e) Immunoblot for Cdt1 in whole cell lysates at 20 hr of siRNA treatment, prior to BMP4 treatment. (f) Illustration of the relationship between differentiation and MCM loading rate changes.
-
Figure 7—source data 1
Raw image values.
- https://doi.org/10.7554/eLife.30473.021
Figure 7—figure supplement 1
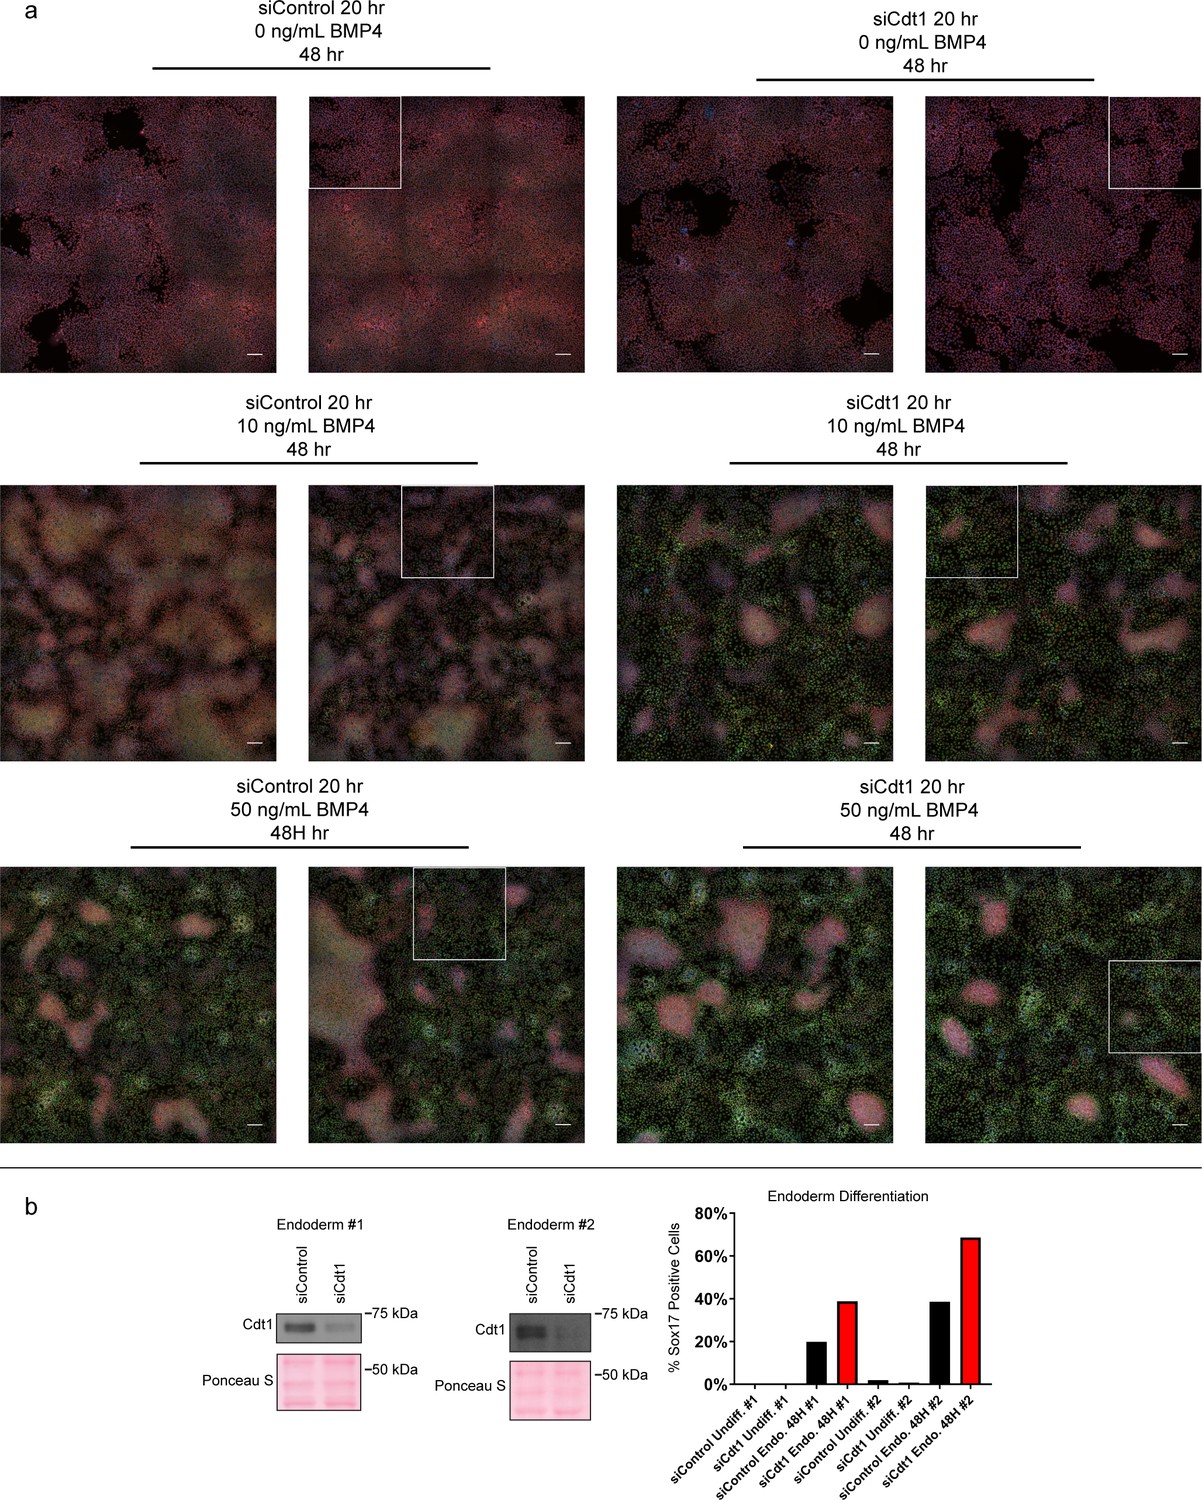
Complete microscopy dataset and endoderm differentiation.
(a) Complete immunofluorescence microscopy data for Figure 7. White boxes mark the areas shown in Figure 7b; scale bars are 100 μM. (b) Immunoblots for Cdt1 in whole cell lysates of hESCs treated with 100 nM siControl or siCdt1 for 24 hr prior to initiating differentiation toward endoderm, two biological replicates. Bar graph indicates the percentage of Sox17-positive cells, n > 2,300 cells per condition. See also Figure 7—source data 1.
Figure 7—figure supplement 2
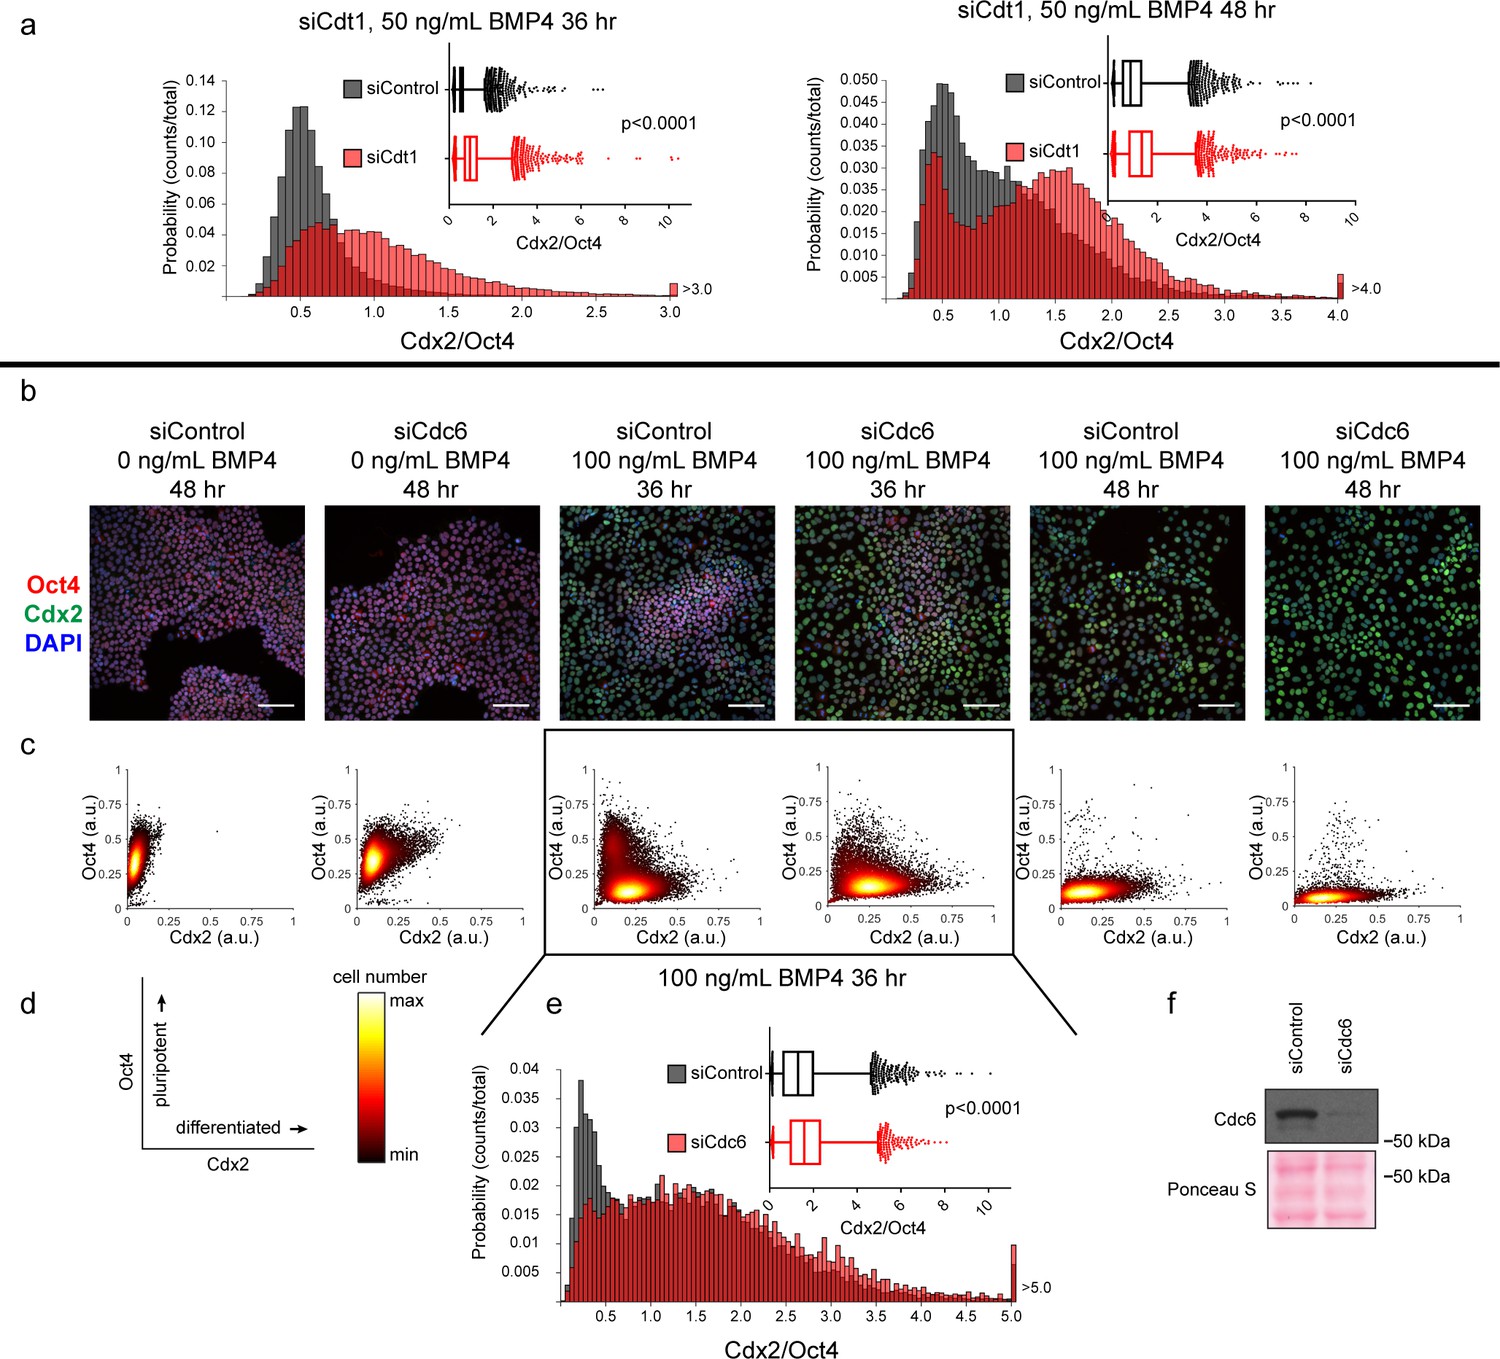
Slow MCM loading promotes differentiation.
(a) Histogram of mean fluorescence intensity ratio Cdx2/Oct4 for all cells in siControl and siCdt1 treated with 50 ng/mL BMP4 for 36 or 48 hr. Rightmost histogram bin contains all values greater than 3.0 or 4.0, respectively. The inset is a box-and-whiskers plot of the same data, center line is median, outer box edges are 25th and 75th percentile, whiskers edges are 1st and 99th percentile, individual data points are lowest and highest 1%, respectively. Medians for 50 ng/mL 36 hr are 0. 0.5418, 0.9465, and means are 0. 0.5993, 1.05 for siControl and siCdt1, respectively. Medians for 50 ng/mL 48 hr are 0.916, 1.368, and means are 1.055, 1.387 for siControl and siCdt1, respectively. Samples compared by two tailed Mann-Whitney test, ****p<0.0001. See also Figure 7—source data 1. (b) Immunofluorescence microscopy of hESCs treated with 100 nM of siControl or 100 nM of siCdc6 for 32 hr and then treated with BMP4 as indicated. Cells were fixed and stained with DAPI (blue), Cdx2 antibody (green), and Oct4 antibody (red). Images are one region of 27 fields of view per condition; scale bar is 100 μm. (see Materials and methods). (c) Density scatterplots of mean fluorescence intensity (arbitrary units) of Oct4 and Cdx2 staining for each cell in each condition,>7,900 cells were quantified per condition. See also Figure 7—source data 1. (d) Diagram of the relationship between Oct4 and Cdx2 in pluripotent and differentiated cells as plotted in (b); color bar for scatterplots in (b). (e) Histogram of the mean fluorescence intensity ratio Cdx2/Oct4 for all cells in siControl and siCdc6 treated with 100 ng/mL BMP4 for 36 hr. Rightmost histogram bin contains all values greater than 5.0. the inset is a box-and-whiskers plot of the same data, center line is median, outer box edges are 25th and 75th percentile, whiskers edges are 1st and 99th percentile, individual data points are lowest and highest 1%, respectively. Medians are 1.296, 1.58, and means are 1.433, 1.728 for siControl and siCdc6, respectively. Samples compared by two tailed Mann-Whitney test, ****p<0.0001. See also Figure 7—source data 1. (e) Immunoblot for Cdc6 in whole cell lysates at 32 hr of siRNA treatment, prior to BMP4 treatment.
Figure 7—figure supplement 3
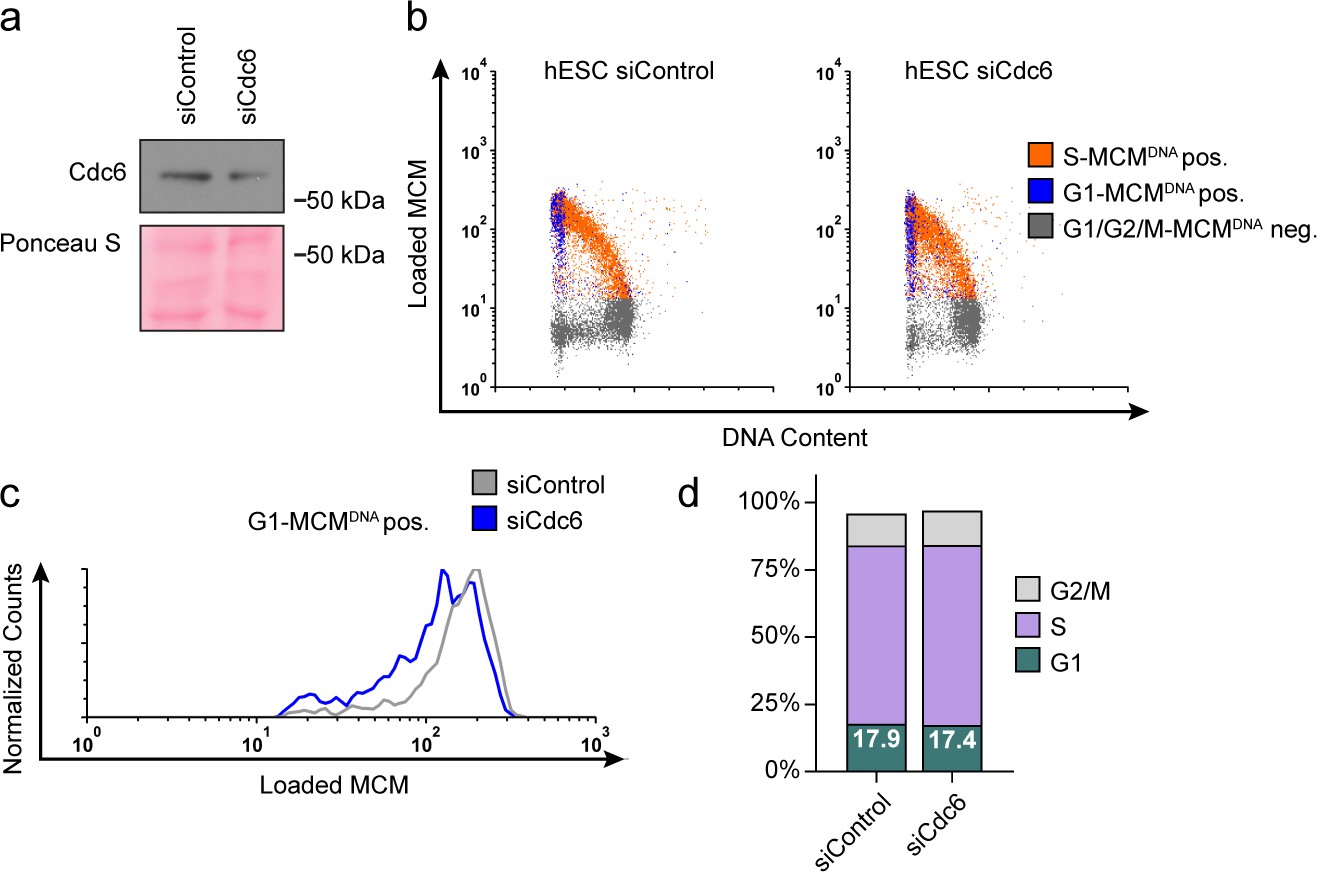
Reducing MCM loading rate by an alternative siRNA targeting Cdc6 instead of Cdt1.
(a) Immunoblot of total protein for hESCs treated with 100 nM siControl for 32 hr or 100 nM siCdc6 pool for 32 hr and pulse-labeled with EdU for 30 min prior to harvest. (b) Chromatin flow cytometry of cells from (a) stained with DAPI and anti-MCM2 and subjected to EdU detection. (c) Histogram MCMDNA positive intensity in G1 cells. Counts for siCdc6 are normalized to the corresponding siControl sample. (d) Stacked bar graph of cell cycle distributions for samples in (a).
Tables
Key resources table
| Reagent type (species) or resource | Designation | Source or reference | Identifiers | Additional information |
|---|---|---|---|---|
| Strain, strain background (Escherichia coli) | E. coli: DH5α | Invitrogen | Cat#11319019 | |
| Genetic reagent (Homo sapiens) | Rc/CMV cyclin E | Hinds et al. (1992) PMID: 1388095 | Addgene 8963 | |
| Genetic reagent (Homo sapiens) | pInducer20 | Meerbrey et al., 2011PMID: 21307310 | Addgene 44012 | |
| Genetic reagent (Homo sapiens) | ΔNRF | Dr. J. Bear | N/A | |
| Genetic reagent (Homo sapiens) | VSVG | Dr. J. Bear | N/A | |
| Genetic reagent (Homo sapiens) | pInducer20-Cyclin E1 | This Paper | N/A | see Materials and methods |
| Genetic reagent (Homo sapiens) | pDONR221 | Invitrogen | Cat#12536017 | |
| Genetic reagent (Homo sapiens) | pENTR221-Cyclin E1 | This Paper | N/A | |
| Genetic reagent (Homo sapiens) | PCR4-TOPO | Invitrogen | Cat# 450030 | |
| Genetic reagent (Homo sapiens) | pInducer20-blast | This Paper | N/A | see Materials and methods |
| Genetic reagent (Homo sapiens) | pInducer20-blast-Cdt1-HA | This Paper | N/A | see Materials and methods |
| Genetic reagent (Homo sapiens) | CLXSN-5myc-Cdc6-wt | This Paper | N/A | see Materials and methods |
| Genetic reagent (Homo sapiens) | CLXSN-5myc-Cdc6-mut | This Paper | N/A | see Materials and methods |
| Cell line (Homo sapiens) male | T98G | ATCC | Cat#CRL-1690 | |
| Cell line (Homo sapiens) female | RPE1-hTERT | ATCC | Cat#CRL-4000 | |
| Cell line (Homo sapiens) male | ARPE-19 | ATCC | Cat#CRL-2302 | |
| Cell line (Homo sapiens) female | H9 hESC (WA09) | WiCell | hPSCReg ID: WAe009-A | |
| Cell line (Homo sapiens) male | NPC | This Paper | N/A | see Materials and methods |
| Cell line (Homo sapiens) female | HEK293T | ATCC | Cat# CRL-3216 | |
| Cell line (Homo sapiens) male | ARPE-iPSC | This Paper | N/A | see Materials and methods |
| Antibody | Anti-Mcm2, mouse monoclonal (BM28) | BD Biosciences | Cat#610700;RRID: AB_2141952 | 1:10,000 (IB) 1:200 (FC) |
| Antibody | Anti-Mcm3, rabbit polyclonal | Bethyl Laboratories | Cat#A300-192A; RRID: AB_162726 | 1:10,000 (IB) 1:200 (FC) |
| Antibody | Anti-Cdt1, rabbit monoclonal (D10F11) (immunoblots) | Cell Signaling Technologies | Cat#8064S; RRID: AB_10896851 | 1:10,000 (IB) |
| Antibody | Anti-Cdt1, rabbit monoclonal (EPR17891) (flow cytometry) | Abcam | Cat#ab202067; RRID:AB_2651122 | 1:100 (FC) |
| Antibody | Anti-Cdc6, mouse monoclonal (180.2) | Santa Cruz Biotechnology | Cat#sc-9964; RRID: AB_627236 | 1:2000 (IB) |
| Antibody | Anti-Oct4, rabbit polyclonal (immunoblots) | Abcam | Cat#ab19857; RRID: AB_445175 | 1:4000 (IB) |
| Antibody | Anti-Oct4, mouse monoclonal (9B7) (microscopy) | Millipore | Cat#:MABD76; RRID: AB_10919170 | 1:1000 (IF) |
| Antibody | Anti-Cdx2, rabbit monoclonal (EPR2764Y) | Abcam | Cat#ab76541; RRID: AB_1523334 | 1:1000 (IF) |
| Antibody | Anti-Sox17, goat polyclonal | R and D Systems | Cat#AF1924; RRID: AB_355060 | 1:500 (IF) |
| Antibody | Anti-Cyclin E1, rabbit polyclonal | Santa Cruz Biotechnology | Cat#sc-198; RRID: AB_631346 | 1:2000 (IB) |
| Antibody | Anti-Orc1, rabbit polyclonal | Bethyl Laboratories | Cat#A301-892A; AB_1524103 | 1:1000 (IB) |
| Antibody | Anti-Orc6, rat monoclonal (3A4) | Santa Cruz Biotechnology | Cat#sc-32735; RRID: AB_670295 | 1:5000 (IB) |
| Antibody | Anti-geminin, rabbit polyclonal | Santa Cruz Biotechnology | Cat#sc-13015; RRID: AB_2263394 | 1:3000 (IB) |
| Antibody | Anti-Histone H3, rabbit monoclonal (D1H2) | Cell Signaling Technologies | Cat#4499S; RRID: AB_10544537 | 1:10,000 (IB) |
| Antibody | Anti-TRA-1–60, mouse monoclonal (cl.A) | Invitrogen | Cat#41–1000; RRID: AB_605376 | 1:5000 (IB) |
| Antibody | Anti-nestin, mouse monoclonal (10 C2) | Abcam | Cat#ab22035; RRID: AB_446723 | 1:10000 (IB) |
| Antibody | Anti-TRA-1–60 mouse (immunofluorescence) | Millipore/Chemicon | Cat# MAB4360; RRID: AB_2119183 | 1:400 (IF) |
| Antibody | Anti-TRA-81 mouse (immunofluorescence) | Millipore/Chemicon | Cat# MAB4381; RRID:AB_177638 | 1:400 (IF) |
| Antibody | Anti-SSEA-4 mouse (MC-813–70) (immunofluorescence) | Millipore/Chemicon | Cat# MAB4304; RRID:AB_177629 | 1:200 (IF) |
| antibody | Anti-SSEA3 rabbit (MC-631) (immunofluorescence) | Millipore/Chemicon | Cat# MAB4303; RRID:AB_177628 | 1:200 (IF) |
| Antibody | Anti-Oct3/4 goat polyclonal (immunofluorescence) | Abcam | Cat# ab27985; RRID:AB_776898 | 1:200 (IF) |
| Antibody | Anti-NANOG goat polyclonal (immunofluorescence) | Everest Biotech | Cat# EB068601; RRID:AB_2150379 | 1:200 (IF) |
| Antibody | Anti-p27 rabbit polyclonal | Santa Cruz Biotechnology | Cat#sc-528; RRID:AB_632129 | 1:2000 (IB) |
| Antibody | Anti-α-tubulin | Sigma Aldrich | Cat#9026 | 1:50000 (IB) |
| Antibody | Goat anti-Mouse-HRP | Jackson ImmunoResearch | Cat#115-035-146; RRID: AB_2307392 | 1:10000 (IB) |
| Antibody | Donkey anti-Rabbit-HRP | Jackson ImmunoResearch | Cat#711-035-152; RRID: AB_10015282 | 1:10000 (IB) |
| Antibody | Bovine anti-Goat-HRP | Jackson ImmunoResearch | Cat#805-035-180; RRID: AB_2340874 | 1:10000 (IB) |
| Antibody | Donkey anti-Rat-HRP | Jackson ImmunoResearch | Cat#712-035-153; RRID: AB_2340639 | 1:10000 (IB) |
| Antibody | Donkey anti-Goat-Alexa 594 | Jackson ImmunoResearch | Cat#705-585-147; RRID: AB_2340433 | 1:1000 (IF) |
| Antibody | Donkey anti-Rabbit-Alexa 488 | Life Technologies | Cat#A21206; RRID: AB_2535792 | 1:1000 (IF) (FC) |
| Antibody | Goat anti-Mouse-Alexa 594 | Life Technologies | Cat#A11032; RRID: AB_2535792 | 1:1000 (IF) |
| Antibody | Donkey anti-Rabbit-Alexa 647 | Jackson ImmunoResearch | Cat#711-605-152; RRID: AB_2492288 | 1:1000 (FC) |
| Antibody | Donkey anti-Mouse-Alexa 488 | Jackson ImmunoResearch | Cat#715-545-140; RRID: AB_2340845 | 1:1000 (FC) |
| Sequence-based reagent | siCdt1- CCUACGUCAAGCUGGACAATT | Nevis et al. (2009) PMCID: PMC2972510 | N/A | |
| Sequence-based reagent | siCdc6-2534- CACCAUGCUCAGCCAUUAAGGUAUU | Nevis et al. (2009) PMCID: PMC2972510 | N/A | |
| Sequence-based reagent | siCdc6-2144- UCUAGCCAAUGUGCUUGCAAGUGUA | Nevis et al. (2009) PMCID: PMC2972510 | N/A | |
| Sequence-based reagent | siControl (Luciferase)- CUUACGCUGAGUACUUCGA | Coleman et al. (2015) PMID: 26272819 | N/A | |
| Sequence-based reagent | siMCM3-2859 5’- augacuauugcaucuucauug | This paper | synthesized by invitrogen | |
| Sequence-based reagent | siMCM3-2936 5’- aacauaugacuucugaguacu | This paper | synthesized by invitrogen | |
| Sequence-based reagent | POU5F1-F: 5'-CCTGAAGCAGAAGAGGATCACC, | Eton Bioscience | ||
| Sequence-based reagent | POU5F1-R 5'-AAAGCGGCAGATGGTCGTTTGG, | Eton Bioscience | ||
| Sequence-based reagent | CDX2-F 5'-ACAGTCGCTACATCACCATCCG, | Eton Bioscience | ||
| Sequence-based reagent | CDX2-R 5'-CCTCTCCTTTGCTCTGCGGTTC, | Eton Bioscience | ||
| Sequence-based reagent | T-F 5'-CTTCAGCAAAGTCAAGCTCACC, | Eton Bioscience | ||
| Sequence-based reagent | T-R 5'-TGAACTGGGTCTCAGGGAAGCA, | Eton Bioscience | ||
| Sequence-based reagent | SOX17-F 5'-ACGCTTTCATGGTGTGGGCTAAG, | Eton Bioscience | ||
| Sequence-based reagent | SOX17-R 5'-GTCAGCGCCTTCCACGACTTG, | Eton Bioscience | ||
| Sequence-based reagent | CDT1-F 5'-GGAGGTCAGATTACCAGCTCAC, | Eton Bioscience | ||
| Sequence-based reagent | CDT1-R, 5'-TTGACGTGCTCCACCAGCTTCT, | Eton Bioscience | ||
| Sequence-based reagent | SOX2-F 5'-CTACAGCATGATGCAGGACCA, | Eton Bioscience | ||
| Sequence-based reagent | SOX2-R 5'-TCTGCGAGCTGGTCATGGAGT, | Eton Bioscience | ||
| Sequence-based reagent | PAX6-F 5'-AATCAGAGAAGACAGGCCA, | Eton Bioscience | ||
| Sequence-based reagent | PAX6-R 5'-GTGTAGGTATCATAACTC, | Eton Bioscience | ||
| Sequence-based reagent | ACTB-F 5'-CACCATTGGCAATGAGCGGTTC, | Eton Bioscience | ||
| Sequence-based reagent | ACTB-R 5'-AGGTCTTTGCGGATGTCCACGT | Eton Bioscience | ||
| Sequence-based reagent | CDC6-KEN-F: 5- ctccaccaaagcaaggcaaggcggccgcaggtccccctcactcacatacac | Eurofins | ||
| Sequence-based reagent | CDC6-KEN-R: 5- GTGTATGTGAGTGAGGGGGACCTGCGGCCGCCTTGCCTTGCTTTGGTGGAG | Eurofins | ||
| Sequence-based reagent | CDC6-DBOX-F: 5- aagccctgcctctcagccccgccaaacgtgccggcgatgacaacctatgcaa | Eurofins | ||
| Sequence-based reagent | CDC6-DBOX-R: 5- TTGCATAGGTTGTCATCGCCGGCACGTTTGGCGGGGCTGAGAGGCAGGGCTT | Eurofins | ||
| Sequence-based reagent | AgeI-rta3-F: 5- gctcggatctccaccccgtaccggtcctgcagtcgaattcac | Eurofins | ||
| Sequence-based reagent | AgeI-IRES-blast-R: 5-ACAAAGGCTTGGCCATGGTTTAAGCTTATCATCGTGTTTTTCA | Eurofins | ||
| Sequence-based reagent | Blast-F:5- tgaAaaacacgatgataagcttaaaccatggccaagcctttgt | Eurofins | ||
| Sequence-based reagent | Blast-AgeI-Ind-R: 5-GTTCAATCATGGTGGACCGG CTATTAGCCCTCCCACACATAACCA | Eurofins | ||
| Sequence-based reagent | BP-cycE-F 5'GGGGACAAGTTTGTACAAAAAAGCAGGCTACCATGAAGGAGGACGGCGGC | Eurofins | ||
| Sequence-based reagent | BP-cycE-R 5'GGGGACCACTTTGTACAAGAAAGCTGGGTTCACGCCATTTCCGGCCCGCT | Eurofins | ||
| Software, algorithm | MATLAB | MathWorks | https://www.mathworks.com/ | |
| Software, algorithm | GraphPad Prism 7 | GraphPad Software | https://www.graphpad.com/scientific-software/prism/ | |
| Software, algorithm | NIS-Elements Advanced Research Software | Nikon | https://www.nikoninstruments.com/Products/Software/NIS-Elements-Advanced-Research | |
| Software, algorithm | CellProfiler | Carpenter et al., 2006 PMC1794559 | http://cellprofiler.org/ | |
| Software, algorithm | FCS Express 6 | De Novo Software | https://www.denovosoftware.com/ | |
| Software, algorithm | FCSExtract Utility | Earl F Glynn | http://research.stowers.org/mcm/efg/ScientificSoftware/Utility/FCSExtract/index.htm | |
| Software, algorithm | QUMA | RIKEN | http://quma.cdb.riken.jp | |
| Software, algorithm | Adobe Photoshop CS6 | Adobe | http://www.adobe.com/products/photoshop.html | |
| Commercial assay or kit | CytoTune-iPS 2.0 Sendai reprogramming kit | Invitrogen | Cat#A16517 | |
| Commercial assay or kit | DNeasy Blood and Tissue kit | Qiagen | Cat#69504 | |
| Commercial assay or kit | RNeasy Mini kit | Qiagen | Cat#74104 | |
| Commercial assay or kit | Epitect Bisulfite kit | Qiagen | Cat#59104 | |
| Commercial assay or kit | Norgen Biotek’s Total RNA Purification Kit | Norgen Biotek | Cat#37500 | |
| Commercial assay or kit | Applied Biosystem’s High-Capacity RNA-to-cDNA | Applied Biosystem | Cat#4387406 | |
| Commercial assay or kit | Alkaline Phosphatase Detection Kit | Millipore | Cat# SCR004 | |
| Commercial assay or kit | QIAquick Gel Extraction kit | Qiagen | Cat# 28704 | |
| Chemical compound, drug | DAPI | Life Technologies | Cat#D1306 | |
| Chemical compound, drug | EdU | Santa Cruz Biotechnology | Cat#sc-284628 | |
| Chemical compound, drug | Ponceau S | Sigma Aldrich | Cat#P7170-1L | |
| Peptide, recombinant protein | BMP4 Protein | R and D Systems | Cat#314 BP-010 | |
| Peptide, recombinant protein | Activin A Protein | R and D Systems | Cat#338-AC-010 | |
| Chemical compound, drug | Y-27632 2HCl | Selleck Chemicals | Cat#S1049 | |
| Chemical compound, drug | CHIR-99021 | Selleck Chemicals | Cat#S2924 | |
| Chemical compound, drug | mTESR1 | Stem Cell Technologies | Cat#05850 | |
| Chemical compound, drug | STEMdiff Neural Induction Medium | Stem Cell Technologies | Cat#05835 | |
| Chemical compound, drug | STEMdiff Neural Progenitor Medium | Stem Cell Technologies | Cat#05833 | |
| Chemical compound, drug | Essential 8 Medium | Life Technologies | Cat#A1517001 | |
| Chemical compound, drug | Doxycycline | CalBiochem | Cat#324385 | |
| Chemical compound, drug | Alexa 647-azide | Life Technologies | Cat#A10277 | |
| Chemical compound, drug | Alexa 488-azide | Life Technologies | Cat#A10266 | |
| Chemical compound, drug | Hydroxyurea | Alfa Aesar | Cat#A10831 | |
| Chemical compound, drug | Corning Matrigel GFR Membrane Matrix | Corning | Cat#CB-40230 | |
| Chemical compound, drug | Poly-L-Ornithine | Sigma Aldrich | Cat#P4957-50ML | |
| Chemical compound, drug | Laminin | Sigma Aldrich | Cat#L2020-1MG | |
| Chemical compound, drug | ReLesR | Stem Cell Technologies | Cat#05872 |
Additional files
-
Transparent reporting form
- https://doi.org/10.7554/eLife.30473.022
Download links
A two-part list of links to download the article, or parts of the article, in various formats.
Downloads (link to download the article as PDF)
Open citations (links to open the citations from this article in various online reference manager services)
Cite this article (links to download the citations from this article in formats compatible with various reference manager tools)
Rapid DNA replication origin licensing protects stem cell pluripotency
eLife 6:e30473.
https://doi.org/10.7554/eLife.30473


