A homozygous FANCM mutation underlies a familial case of non-syndromic primary ovarian insufficiency
- Université Paris Sud, Université Paris Saclay, Hôpital Bicêtre, France
- CNRS UMR8200,Equipe labellisée La Ligue Contre Le Cancer, Université Paris Sud, Université Paris Saclay, Gustave Roussy, France
- Université Paris Diderot, France
- Université Paris-Diderot, CNRS, UMR 8251, INSERM, U1133, France
- Turku University Hospital, Finland
- CNRS UMR8200, Université Paris Sud, Université Paris Saclay, France
- UMR967 INSERM, CEA/DRF/iRCM/SCSR/LDG, Université Paris Diderot, Sorbonne Paris Cité, Université Paris-Sud, Université Paris-Saclay, France
- Hôpital Necker-enfants malades, France
- UMR Inserm 1052, CNRS 5286, Faculté de Médecine Laennec, France
- AP-HP, Université Paris-Sud, Université Paris-Saclay, France
Figures
Figure 1
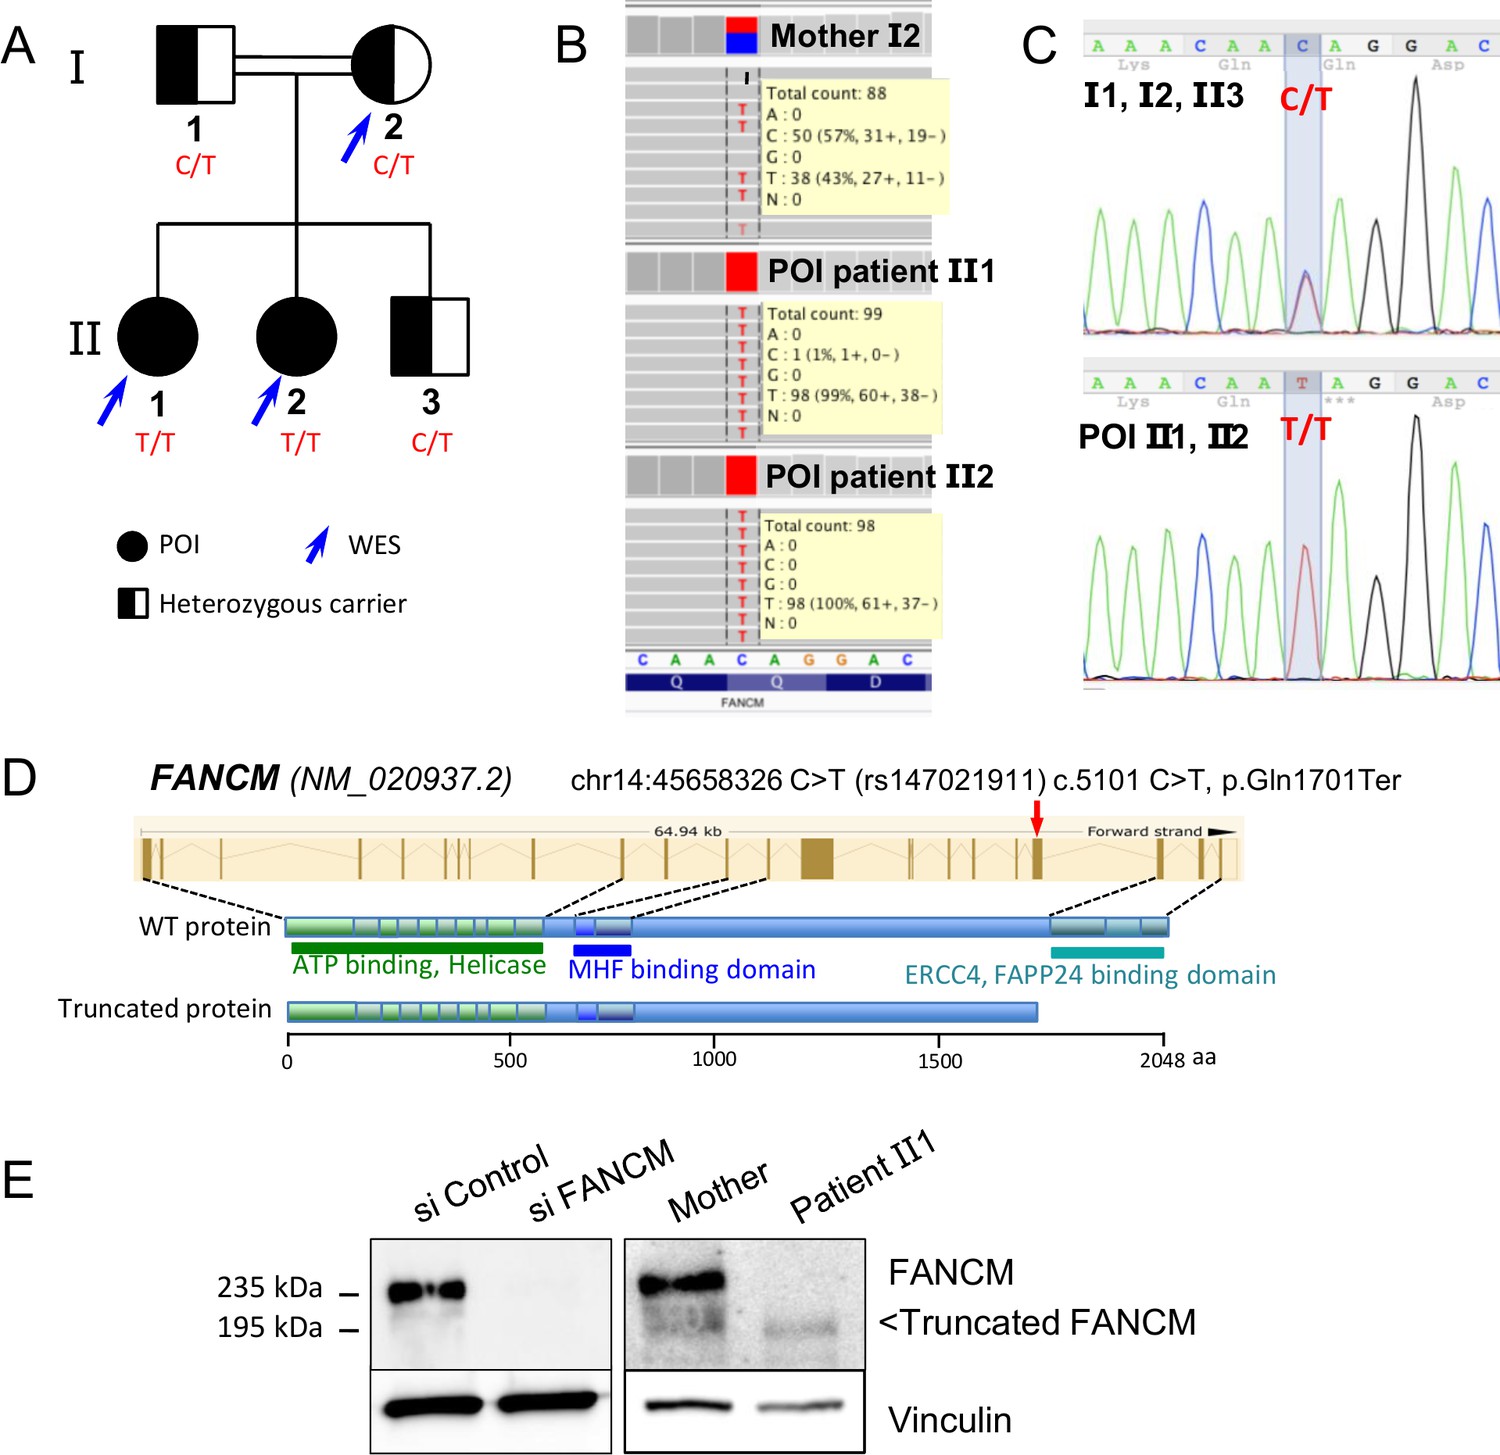
Molecular analysis of the POI family.
(A) Pedigree of the Finnish family with two sisters affected with POI. (B) Exome data visualization in IGV (Integrative Genomics Viewer) shows a high coverage of the variant position and a large number of reads in the three individuals. (C) Sanger sequencing confirmed the presence of the variant at a homozygous state in both affected sisters and at a heterozygous state in both parents and their brother. (D) Structure of the FANCM gene and protein, and position of the causal variant. (E) Western blots of FANCM in the POI family. HEK293 cell transfected with a FANCM-specific siRNA were used to validate the specificity of the anti-FANCM antibody. To transiently deplete FANCM, HEK293 cells were transfected with 20 nmol/L of small interfering RNA (siRNA) targeting FANCM, 5'-GGC-UAC-GUC-CAG-GAG-CGC-3' with the CaCL2 method. Panel present the result of a representative experiment on at least three independent analysis.
Figure 2
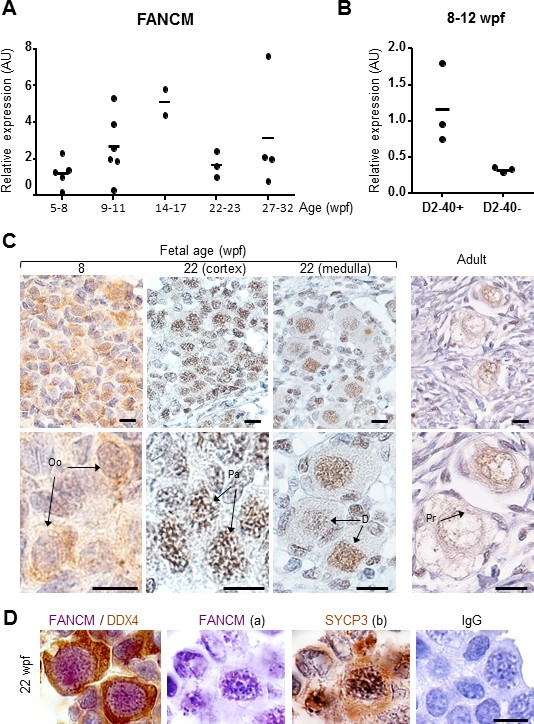
FANCM expression in human fetal ovaries.
(A) Relative FANCM mRNA abundance was measured by RT-qPCR in human fetal ovaries from 5 to 32 weeks post-fertilization (wpf). (B) Germ cells (D2-40+) and somatic cells (D2-40-) were sorted from three ovaries ranging from 8 to 12 wpf and FANCM expression was measured. ACTB was used to normalize FANCM expression in all samples. Dots represent different ovaries and the mean is indicated by the line. (C) Immunohistochemistry of FANCM in human fetal and adult ovaries. Fetal ovaries at 8 and 22 wpf and adult ovaries were studied. FANCM positive cells appear in yellow/brown color (monoclonal FANCM CV5.1 antibody, Novus Biologicals, Abingdon, UK). Ovarian sections were counterstained with hematoxylin (blue staining). Oo, oogonia; Pa, oocyte at the pachytene stage of meiosis I, D, oocyte at the diplotene stage of meiosis I; Pr, oocyte in primordial follicle. (D) Co-staining in 22 wpf ovaries, for FANCM (purple) and DDX4 (brown) confirmed the germ cell identity of FANCM-positive cells (left). Successive staining for FANCM and SYCP3 in the same section (panels a and b). Negative control performed with non-immune mouse IgG (right). Scale bar: 10 μm.
Figure 3

Chromosomal breakage and hypersensitivity to Mitomycin C associated to the FANCM 5101C > T mutation.
(A) Spontaneous and mitomycin C-induced chromosome breakage in primary lymphocytes from the mother and the two POI sisters. Data presented in table are the result of a single experiment. A minimum of 50 metaphases were scored for each sample. (B and B') Examples of untreated and MMC-treated metaphases from patient-2. Arrows indicate breaks and chromosome rearrangements, that is radial figures. (C) Western blot showing FANCD2 expression and monoubiquitination in the same lymphocytes than in A and B. Immunoblot analysis were performed using mouse monoclonal anti-FANCM antibody (CV5.1), mouse monoclonal anti-FANCD2, (Santa-Cruz Biotechnology, Dallas, Texas, USA), rabbit anti-FANCA (Abcam, Cambridge, UK), mouse anti-vinculin (Abcam). Panel present the result of a representative experiment on at least three independent analysis. (D) MMC-induced growth inhibition in lymphoblasts from POI patient-2 and her mother compared to the response of cells from a FANCA (HSC-72), a FANCC (HSC-536), a healthy donor (HSC-93, WT) as well as to the patient cells transduced with a WT FANCM-cDNA. The points on the lines represent the means of 3 to 7 independent experiments ± S.D. *p<0,05, **p<0.01, Unpaired Student's T test. (E) The recovery of the MMC-induced FANCD2-monoubiquitination following FANCM expression in cells from patient 2 is shown. (1) and (2) indicate two independent experiments. Cells were treated with MMC (500 ng/ml) and proteins extracted 24 hr later.
-
Figure 3—source data 1
File presents the original data of each growth inhibition experiment used to calculate mean and S.D. for Figure 3D.
Numbers are the percentage of cell growth in treated samples compared to the untreated cells.
- https://doi.org/10.7554/eLife.30490.010
Figure 4
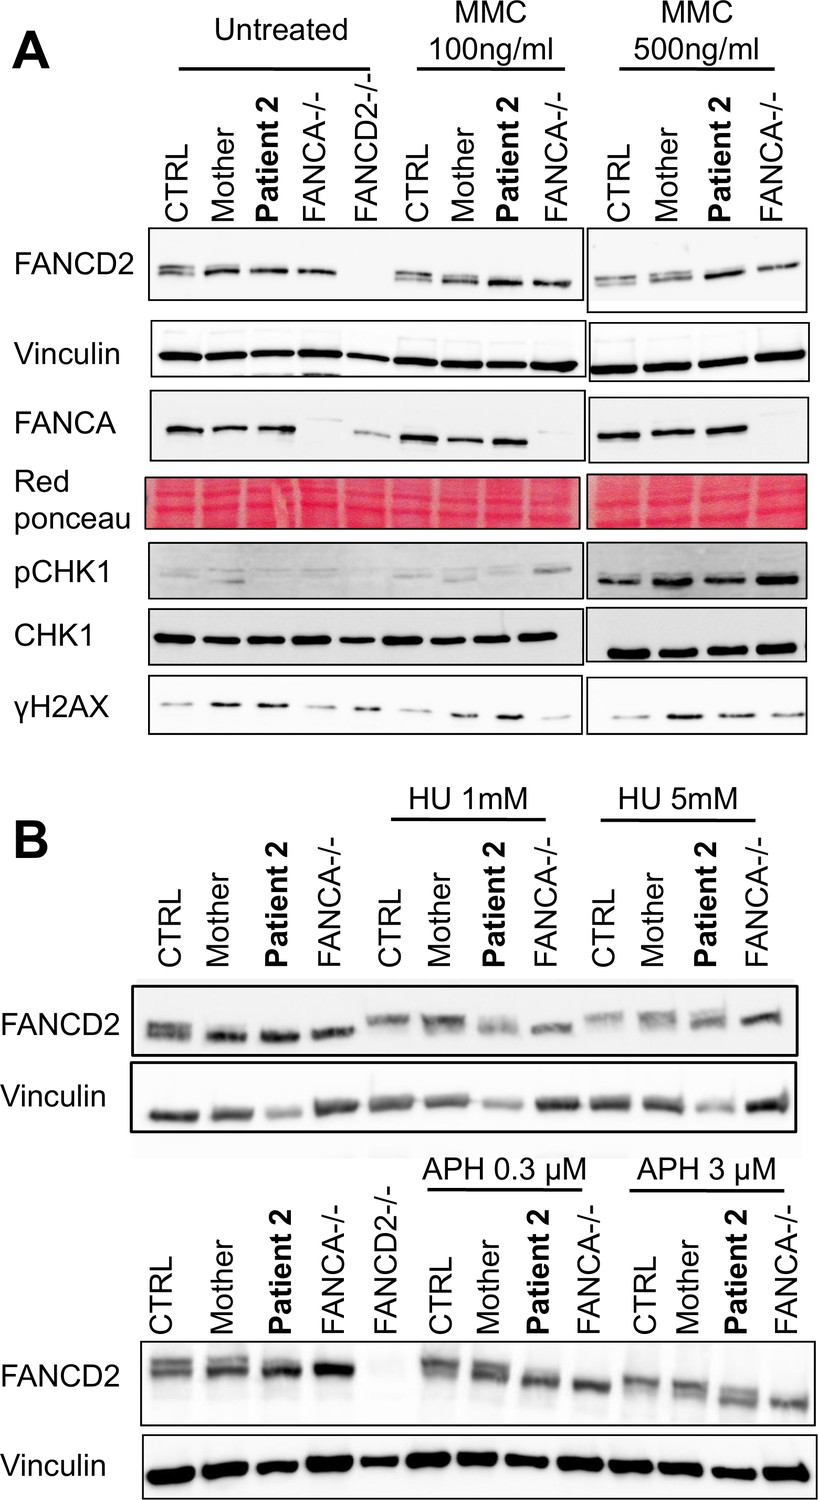
The FANCM 5101C>T mutation leads to altered FANCD2 monoubiquitination in response to DNA damage but not to replication inhibition.
Western blot showing FANCD2 monoubiquitination, CHK1 and H2AX phosphorylation in response to MMC (A), or HU or APH (B) in cells from patients 2 and her mother. FANCA (HSC-72) and FANCD2 (GM16756) lymphoblasts were used for comparison. Each panel presents the result of a representative experiment on at least three independent analysis. Proteins were extracted 24 hr after exposure to genotoxins.
Tables
Table 1
Clinical, hormonal and ultrasonography studies of patients with FANCM mutation
https://doi.org/10.7554/eLife.30490.004| Case | Menstrual cycles | Age at evaluation | BMI (Height cm/ weight Kg) | FSH IU/l | LH IU/l | E2 nmol/l | AMH ng/ml | T nmol/l | PRL mU/l | TSH mU/l | Ovarian surface (R/L) mm | Presence of follicles at US |
|---|---|---|---|---|---|---|---|---|---|---|---|---|
| Patient-1 | Secondary amenorrhea (24 years) | 24 | 22,27 (160/57) | 41 | 38 | 0.388 | 1.8 | 254 | 2.6 | 20 × 17 cyst/ 16 × 8 | Yes (2) | |
| 26 | 120 | 0.053 | <0.2 | 285 | 26 × 11/ 18 × 8 | Yes (1) | ||||||
| 28 | 65 | 51 | 0.120 | <0.2 | 0.96 | |||||||
| Patient-2 | Spanio menorrhea (22 years) | 22 | 24,46 (163/65) | 16 | 4 | 0.069 | 843 | |||||
| 23 | 16 | 0.6 | NA | 1.7 | 18 × 11/ 19 × 10 | No |
-
BMI: body mass index US: ultrasonography; E2: estradiol; T: testosterone; P: progesterone; PRL: prolactin; NA: not available
Follicular phase: 3.5-12.5 [FSH (IU/l)], 2.4-12.6 [LH (IU/l)], 0.11-0.22 [E2 (nmol/l)]
-
Ovulatory phase: 4.7-21.5 [FSH (IU/l)], 14-96 [LH (IU/l)], 0.42-1.40 [E2 (nmol/l)]
Luteal phase 1.7-7.7 [FSH (IU/l)], 1-11.4 [LH (IU/l)], 0.17-0.79 [E2 (nmol/l)]
-
Menopause 26-135 [FSH (IU/l)], 8-33 [LH (IU/l)], ≤ 0.05 [E2 (nmol/l)]
Table 2
Whole Exome sequencing metrics in the Finnish family with FANCM Q1701* variant.
https://doi.org/10.7554/eLife.30490.005| WES metrics | mother | POI 1 | POI 2 |
|---|---|---|---|
| Gbases | 6.682 | 7.273 | 6.931 |
| Number of reads (millions) | 44.5 | 48.5 | 46.2 |
| % Alignment | 97.03 | 97.12 | 97.09 |
| % Mismatch Rate R1 | 0.19 | 0.19 | 0.2 |
| % Mismatch Rate R2 | 0.31 | 0.31 | 0.32 |
| %≥Q30 bases | 96.34 | 96.26 | 96.15 |
| Mean Quality Score | 39.4 | 39.4 | 39.4 |
| Mean Depth (X) | 68 | 74 | 70 |
| % of bases covered at 25X | 83 | 84 | 83 |
Table 3
Whole Exome sequencing Variant filtering in the Finnish family with FANCM Q1701* variant
https://doi.org/10.7554/eLife.30490.006| Variants called in | Mother | POI 1 | POI 2 |
|---|---|---|---|
| Total | 40621 | 40343 | 40561 |
| SNPs | 37929 | 37590 | 37859 |
| Indels | 2692 | 2753 | 2702 |
| Variant filters | # of variants | ||
| Shared between POI 1 and POI 2 | 32784 | ||
| in coding sequence or splice | 17207 | ||
| in CDS, but not synonymous | 8855 | ||
| homozygous in both POI 1 and POI 2 | 4053 | ||
| and heterozygous in Mother | 512 | ||
| MAF < 1% in EVS and 1000G and ExAC | 5 | ||
| <1% in IG exomes | 2 | ||
| with high potential functional impact | 1 | ||
Table 4
Compilation of Whole-Exome-Sequencing data for the genes of the FANC pathway, excluding all the genes except FANCM as potentially harboring a causative variant.
https://doi.org/10.7554/eLife.30490.007| Gene name | Alias | Mean depth in targeted exons (1) | Nb variants in | Htz variants | Mean ratio for htz allelic | Presence of htz variants (5) | Nbr of rare variants (6) | |||||||
|---|---|---|---|---|---|---|---|---|---|---|---|---|---|---|
mother | POI 1 | POI 2 | family (2) | in >= 1 sister (3) | reads in sisters (4) | upstream | 5'UTR | deep intronic | 3'UTR | downstream | correct segregation | and pathogenic | ||
| FANCA | 87.9 | 94.9 | 90.3 | 29 | yes | 0.92 | no | no | yes | yes | yes | 0 | 0 | |
| FANCB | 88.6 | 93.8 | 89.9 | 2 | yes | 1.14 | no | no | no | no | no | 0 | 0 | |
| FANCC | 64.4 | 71.5 | 68.2 | 0 in this family | ||||||||||
| FANCD1 | BRCA2 | 84.6 | 90.5 | 84.5 | 12 | yes | 1.01 | yes | yes | no | no | no | 0 | 0 |
| FANCD2 | 76.1 | 82.1 | 75.0 | 2 | yes | 0.825 | no | no | no | yes | yes | 0 | 0 | |
| FANCE | 89.5 | 100.2 | 99.0 | 2 | yes | 1.08 | no | no | no | no | no | 0 | 0 | |
| FANCF | 143.0 | 150.2 | 139.7 | 0 in this family | ||||||||||
| FANCG | 123.5 | 139.8 | 130.2 | 1 | yes | 1.22 | no | no | no | no | no | 0 | 0 | |
| FANCI | 75.7 | 80.3 | 76.6 | 9 | yes | 0.89 | no | no | no | no | yes | 0 | 0 | |
| FANCJ | BRIP1 | 104.2 | 113.0 | 107.7 | 4 | yes | 0.76 | no | no | yes | no | no | 0 | 0 |
| FANCL | 80.2 | 88.5 | 80.7 | 3 | yes | 0.96 | no | no | no | no | no | 0 | 0 | |
| FANCM | 86.9 | 91.3 | 87.8 | 1 | no | / | no | no | no | no | no | 1 | 1 | |
| FANCN | PALB2 | 97.0 | 106.9 | 101.1 | 0 in this family | |||||||||
| FANCO | RAD51C | 92.1 | 103.2 | 94.9 | 1 | yes | 0.77 | no | yes | no | no | no | 0 | 0 |
| FANCP | SLX4 | 107.9 | 116.4 | 112.8 | 15 | yes | 0.88 | no | no | no | yes | no | 0 | 0 |
| FANCQ | ERCC4 | 91.5 | 98.1 | 90.9 | 2 | yes | 1.21 | no | no | yes | no | no | 0 | 0 |
| FANCR | RAD51 | 75.9 | 82.4 | 74.5 | 0 in this family | |||||||||
| FANCS | BRCA1 | 87.6 | 94.3 | 86.8 | 1 | yes | 0.85 | no | no | no | no | no | 0 | 0 |
| FANCT | UBE2T | 53.9 | 63.2 | 52.6 | 2 | yes | 0.91 | no | no | no | no | no | 0 | 0 |
| FANCU | XRCC2 | 104.3 | 116.1 | 113.1 | 0 in this family | |||||||||
| FANCV | MAD2L2 | 72.6 | 85.4 | 74.3 | 0 in this family | |||||||||
| FAAP100 | C17orf70 | 69.0 | 66.8 | 69.1 | 7 | yes | 0.94 | no | yes | yes | yes | no | 0 | 0 |
| FAAP24 | C19orf40 | 58.3 | 64.6 | 59.2 | 2 | yes | 0.89 | no | no | no | no | no | 0 | 0 |
| FAAP20 | C1orf86 | 57.7 | 62.0 | 59.7 | 3 | yes | 1.20 | yes | no | yes | yes | no | 0 | 0 |
| FAAP16 | APITD1 | 37.7 | 44.2 | 40.7 | 4 | yes | 1.12 | no | yes | yes | no | no | 0 | 0 |
| FAAP10 | STRA13 | 57.3 | 62.1 | 57.8 | 4 | yes | 1.18 | no | yes | no | no | yes | 0 | 0 |
| FAN1 | 101.8 | 112.9 | 102.6 | 4 | yes | 0.97 | no | no | no | yes | no | 0 | 0 | |
| mean | 84.0 | 91.7 | 85.9 | 110 | 0.99 | |||||||||
-
(1) For each gene, the mean depth per exon was averaged over all exons of the gene. The high coverage for all genes excludes the possibility of not detecting a causative variant in other FANC genes.
(2) Total number of upstream, downstream, 5' and 3' UTRs, intronic, synonymous, splice site, missense, frameshift and stop variants in each gene.
-
(3) The presence of heterozygous variants in at least one of the patients excludes the possibility of hemizygosity for all genes (with the exception of the variant in FANCM that is homozygous)
(4) The ratio between the number of reads for each allele was averaged for all heterozygous variants in the two affected sisters. A ratio close to one for each gene indicates no bias and argues against a possible deletion for the gene.
-
(5) The presence of heterozygous variants in the various genic portions argues against the possibility of partial deletions.
(6) Among the 110 variants detected in the genes included in the FANC pathway, only the non-sense variant found in FANCM is homozygous in both patients, is rare (below 1% in ExAC database) and predicted as pathogenic.
Additional files
-
Transparent reporting form
- https://doi.org/10.7554/eLife.30490.012
Download links
A two-part list of links to download the article, or parts of the article, in various formats.
Downloads (link to download the article as PDF)
Open citations (links to open the citations from this article in various online reference manager services)
Cite this article (links to download the citations from this article in formats compatible with various reference manager tools)
A homozygous FANCM mutation underlies a familial case of non-syndromic primary ovarian insufficiency
eLife 6:e30490.
https://doi.org/10.7554/eLife.30490


