Figures
Figure 1
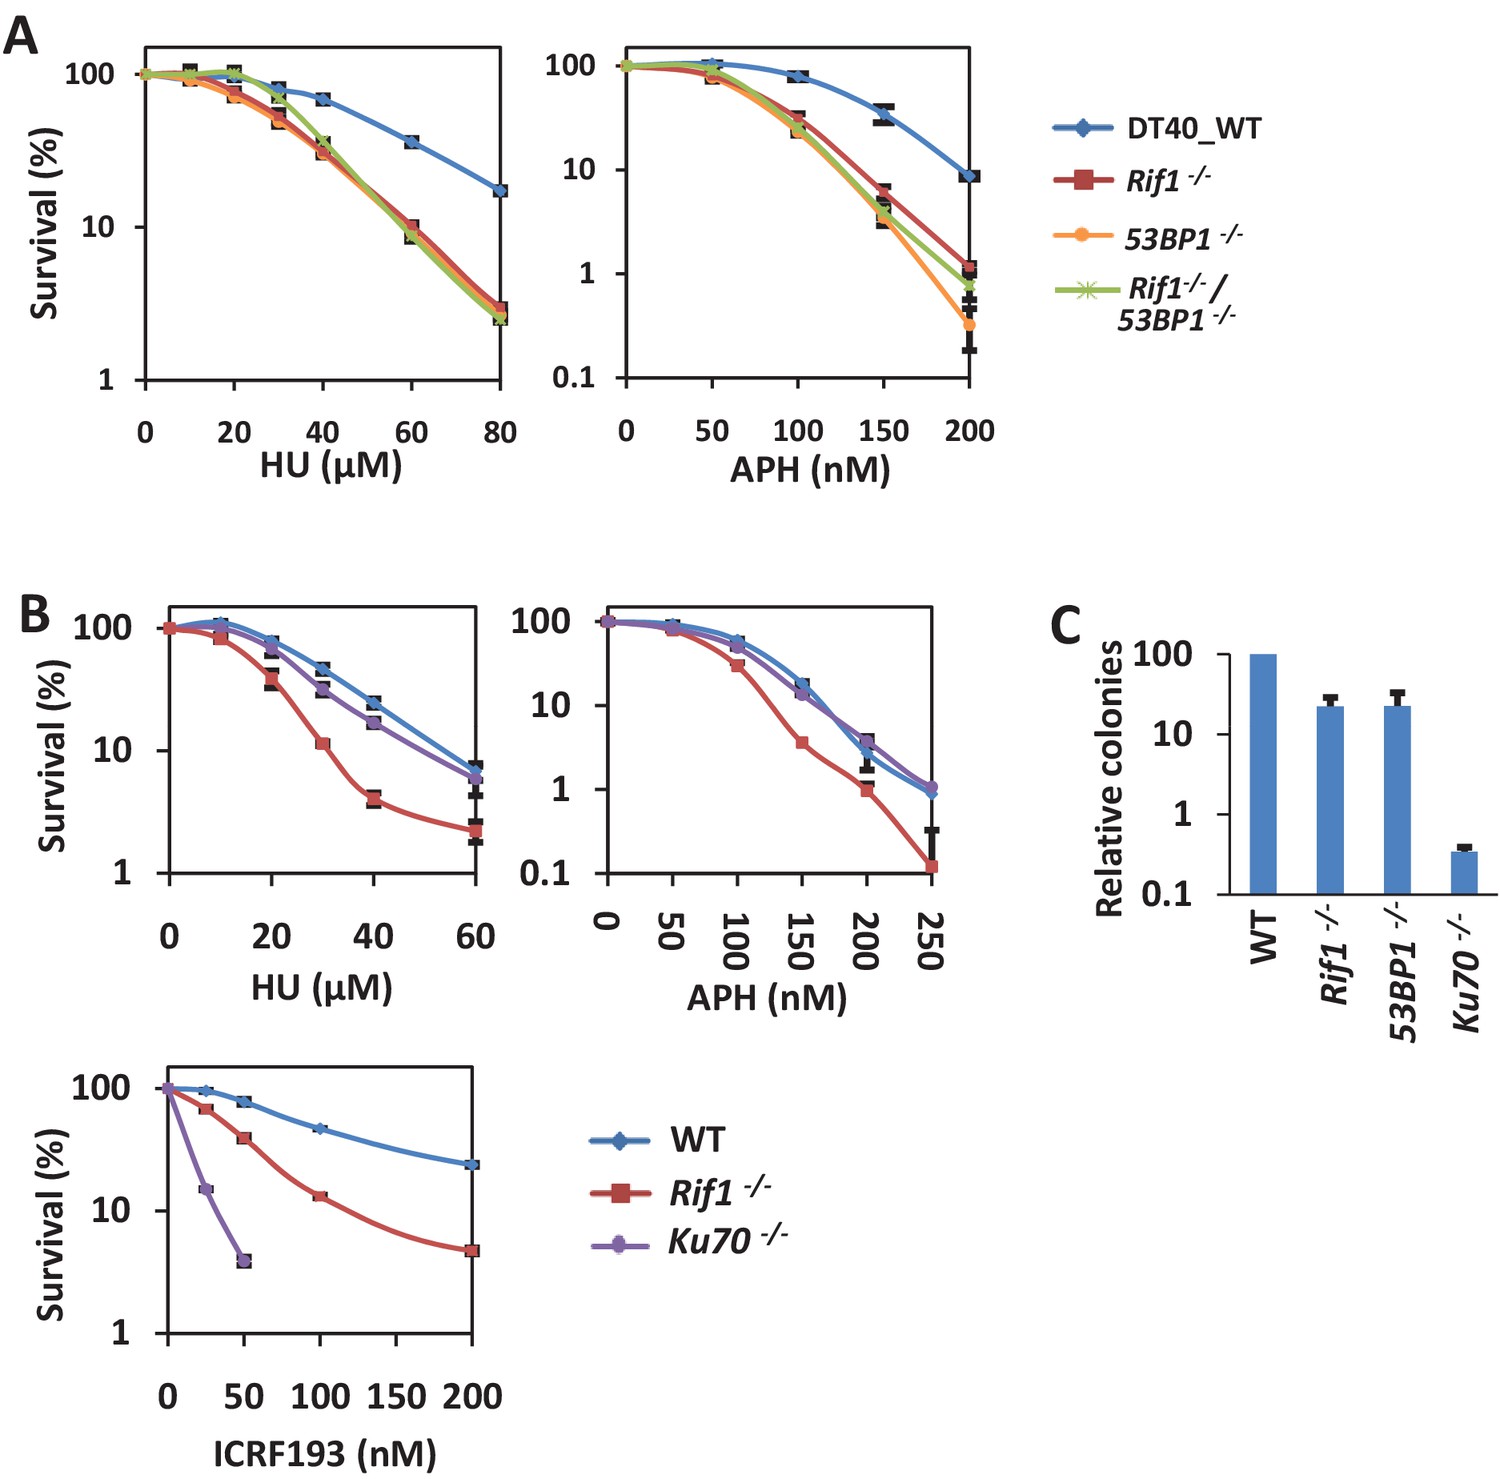
53BP1 and RIF1 play a role in resisting replication stress in a DSB repair-independent manner.
(A) Genetic interaction analysis between RIF1 and 53BP1 by sensitivity assay using MTT staining in DT40 cells. The mean and s.d. from three independent experiments are shown. (B) Sensitivity assay of variant DT40 cells. The mean and s.d. from three independent experiments are shown. (C) Random integration assay of variant DT40 cells. The mean and s.d. from three independent experiments are shown.
Figure 2 with 2 supplements
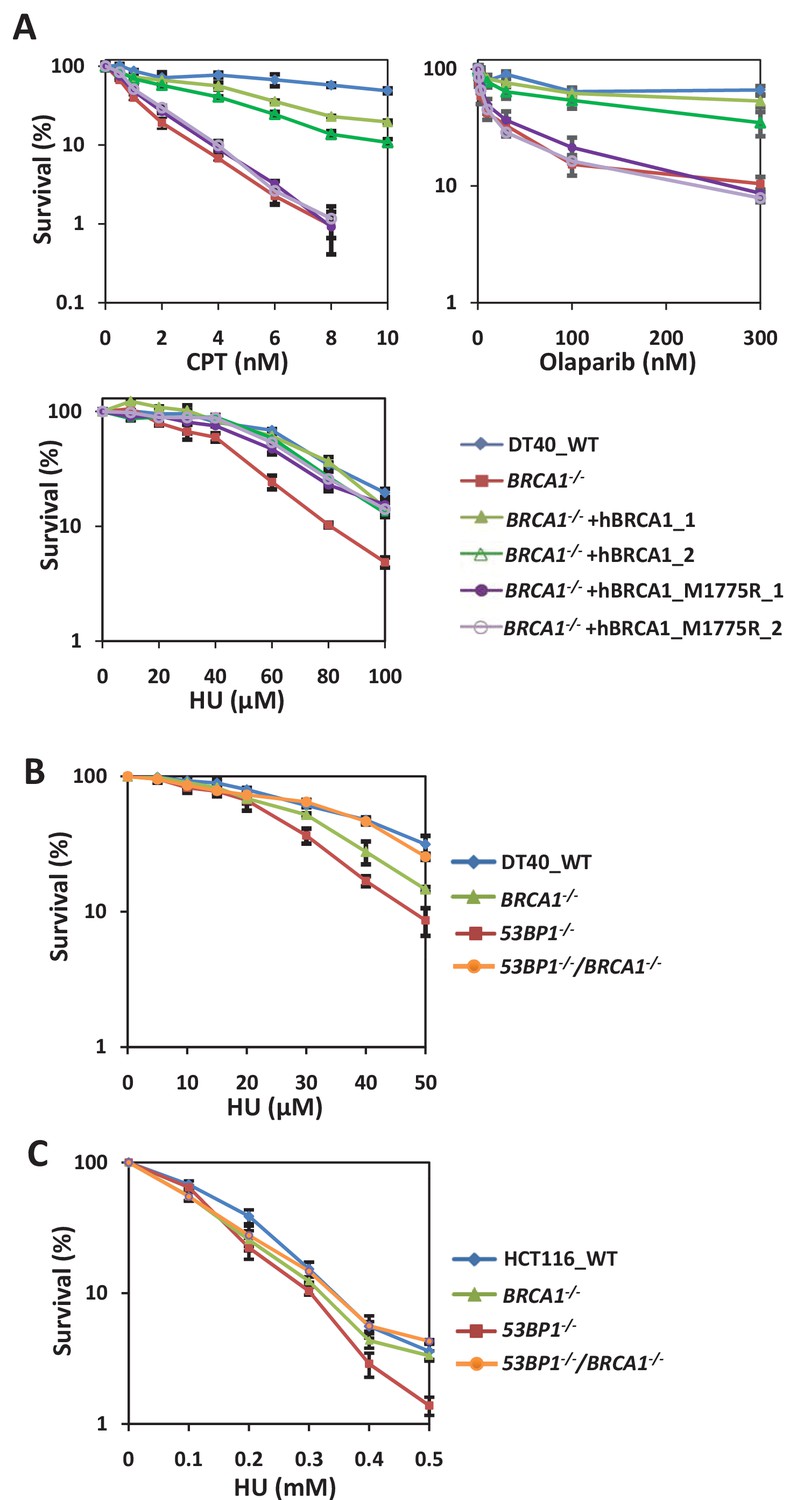
BRCA1 and 53BP1 interact antagonistically to resist replication stress in a DSB repair-independent manner.
(A) Sensitivity assay of BRCA1-/- DT40 cells complemented with wild type or M1775R human BRCA1. The mean and s.d. from three independent experiments are shown. (B) Genetic interaction analysis between BRCA1 and 53BP1 by sensitivity assay using MTT staining in DT40 cells. The mean and s.d. from three independent experiments are shown. (C) Sensitivity assay of wild-type, 53BP1-/-, BRCA1-/- and 53BP1-/- BRCA1-/- HCT116 cells. The mean and s.d. from three independent experiments are shown. Please refer to Figure 2—figure supplement 1 and Figure 2—figure supplement 2 for additional information in support of Figure 2.
Figure 2—figure supplement 1
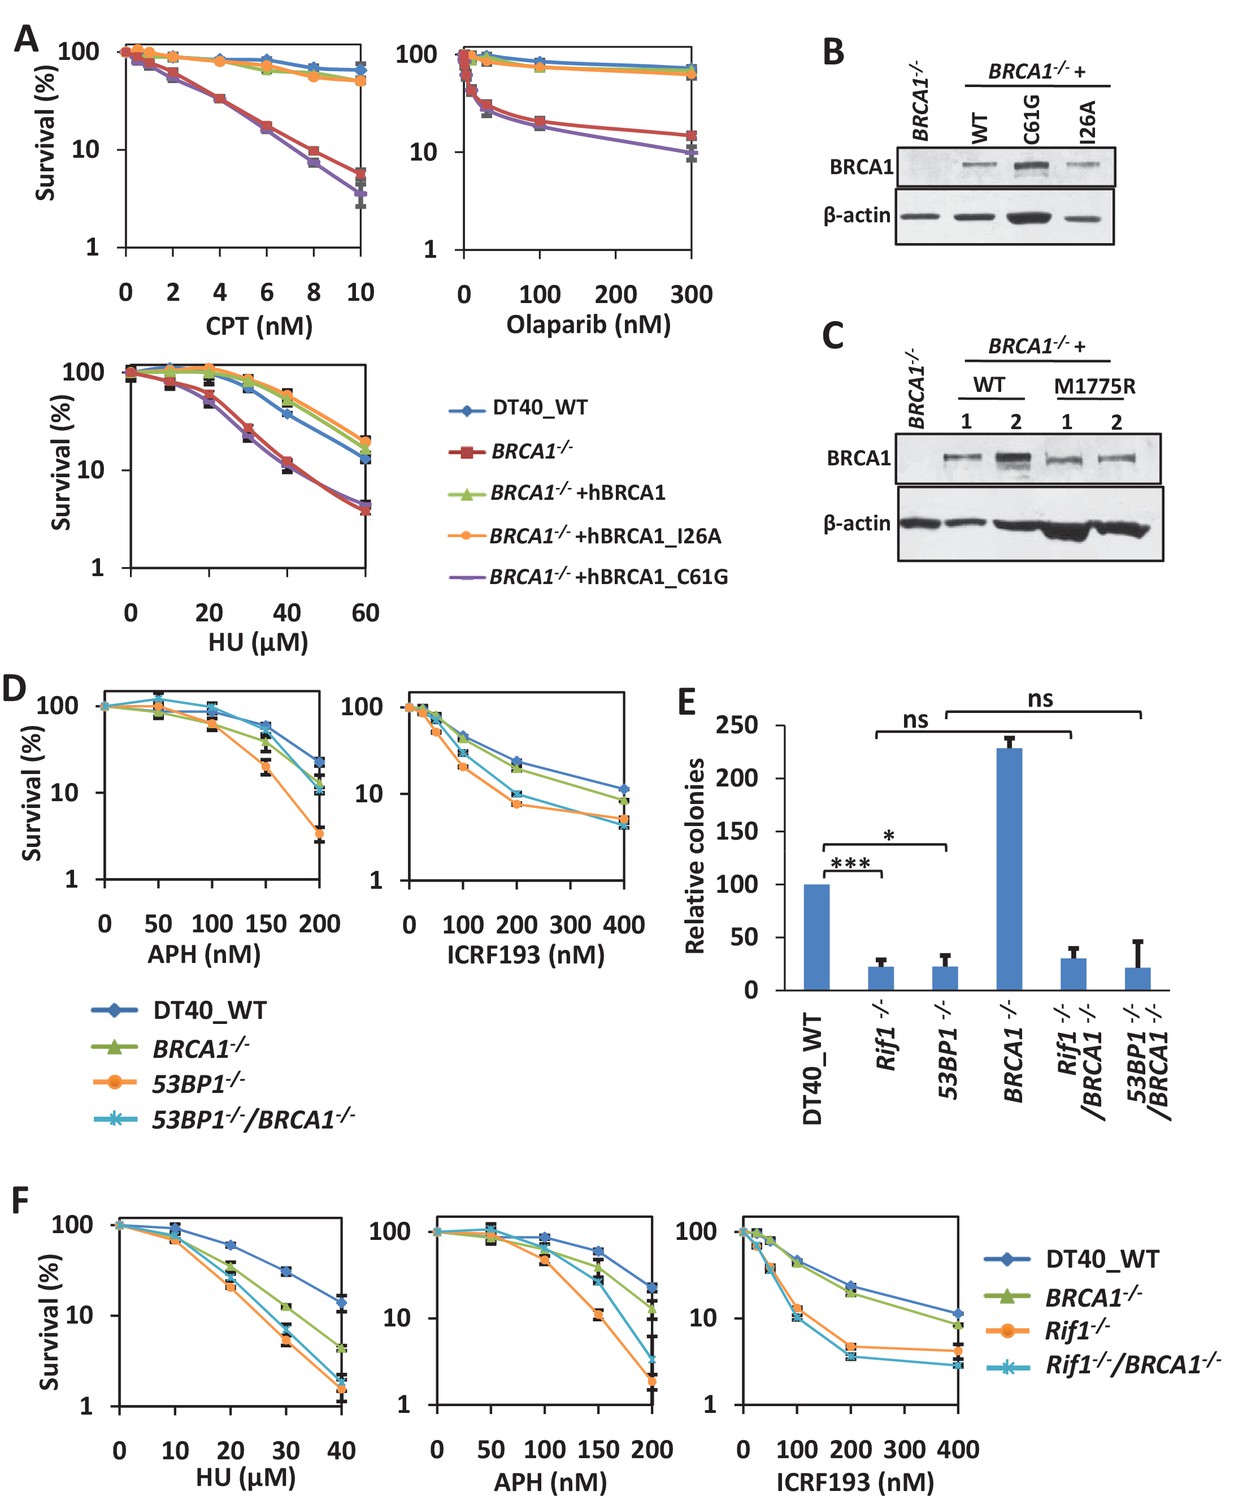
BRCA1 and 53BP1 interact antagonistically to resist replication stress in a DSB repair-independent manner.
(A) Sensitivity assay of BRCA1-/- DT40 cells complemented with wild type or mutant human BRCA1 using MTT staining. (B–C) Western-blotting showing BRCA1 expression levels in the complemented BRCA1-/- cells. (D, F) Genetic interaction analysis between BRCA1 and 53BP1 (D) or RIF1 (F) by sensitivity assay using MTT staining. The mean and s.d. from three independent experiments are shown. (E) Genetic interaction analysis between BRCA1 and 53BP1 or RIF1 by random integration assay. The mean and s.d. from at least three independent experiments are shown. ***p<0.001, *p<0.05, ns p>0.05.
Figure 2—figure supplement 2
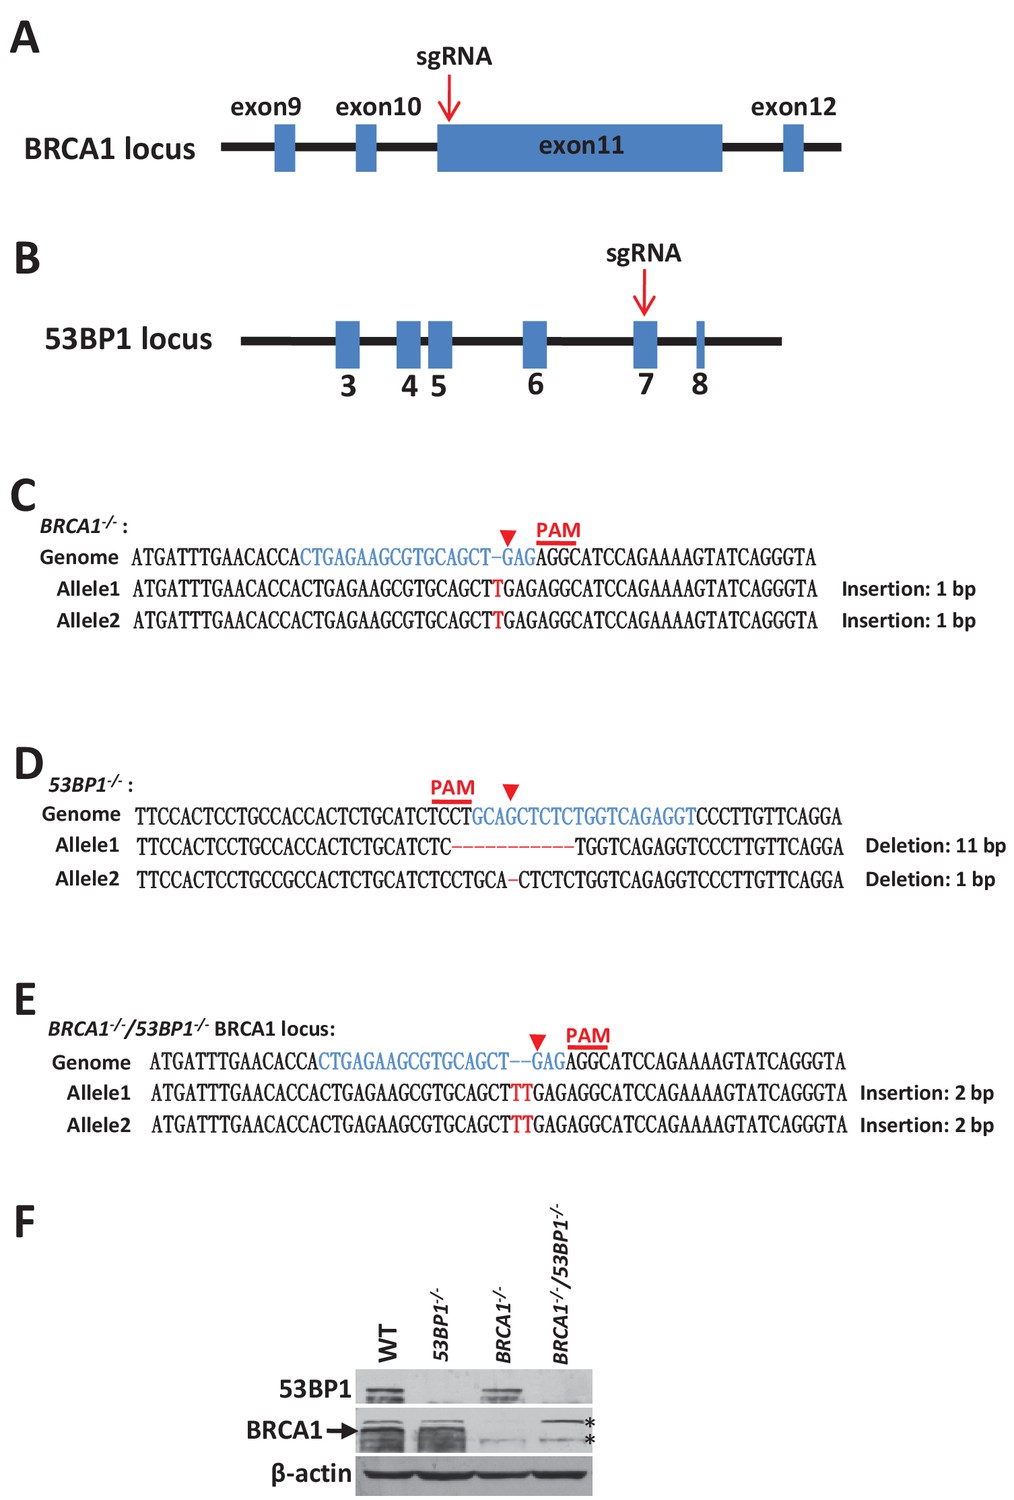
Generation of BRCA1 and 53BP1 knockout HCT116 cells.
(A–B) schematics showing CRISPR sites of BRCA1 (A) and 53BP1 (B) gene. (C–E) Schematic representation of the generation of BRCA1-/- (C), 53BP1-/- (D) and BRCA1-/- 53BP1-/- (E) HCT116 cells. The BRCA1-/-53BP1-/- clone was generated by BRCA1 sgRNA in the 53BP1-/- cells. The guide sequences are highlighted in blue. The PAM sequences are indicated by red lines. The red arrow indicates the putative cleavage site. The red dashes indicate the deleted bases. (F) Immunoblot showing the BRCA1 and 53BP1 protein levels in the wild-type, BRCA1-/-, 53BP1-/- and BRCA1-/- 53BP1-/- HCT116 cells. The asterisks mark crossreactive polypeptides.
Figure 3 with 1 supplement
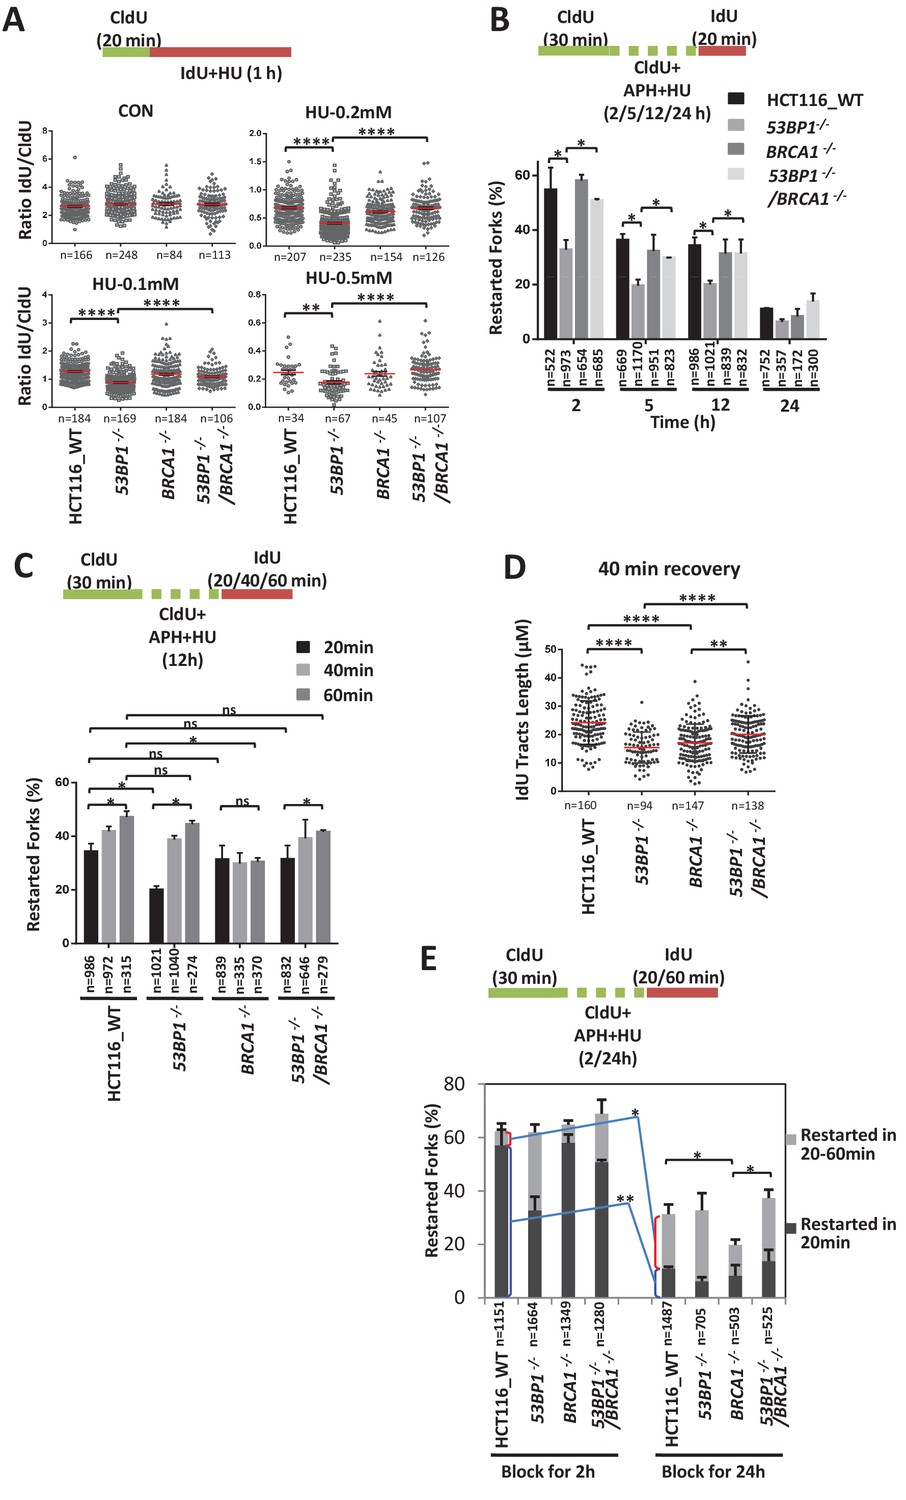
53BP1 and BRCA1 antagonistically promote two distinct fork restart pathways.
(A) DNA combing assay showing the replication progression under low concentration of HU. The sketch above delineates the experimental design. HCT116 cells were pulse-labeled with CldU for 20 min and then incubated with IdU and HU for 1 hr. The ratios of IdU track compared to CldU track were plotted. The mean and s.e.m are shown. (B, C) graphs showing stalled replication fork restart rates after different periods of replication inhibition followed different recovery times. To completely block the replication fork, 5 μM APH and 5 mM HU were added. The mean and s.d. from three independent experiments are shown. (D) A graph showing IdU tracts length after 40 min recovery following 12 hr blocking in (C). (E) A graph showing stalled replication fork restart rates after different periods of replication inhibition followed different recovery times. ****p<0.0001, **p<0.01, *p<0.05, ns p>0.05. Please refer to Figure 3—figure supplement 1 for additional information in support of Figure 3.
Figure 3—figure supplement 1
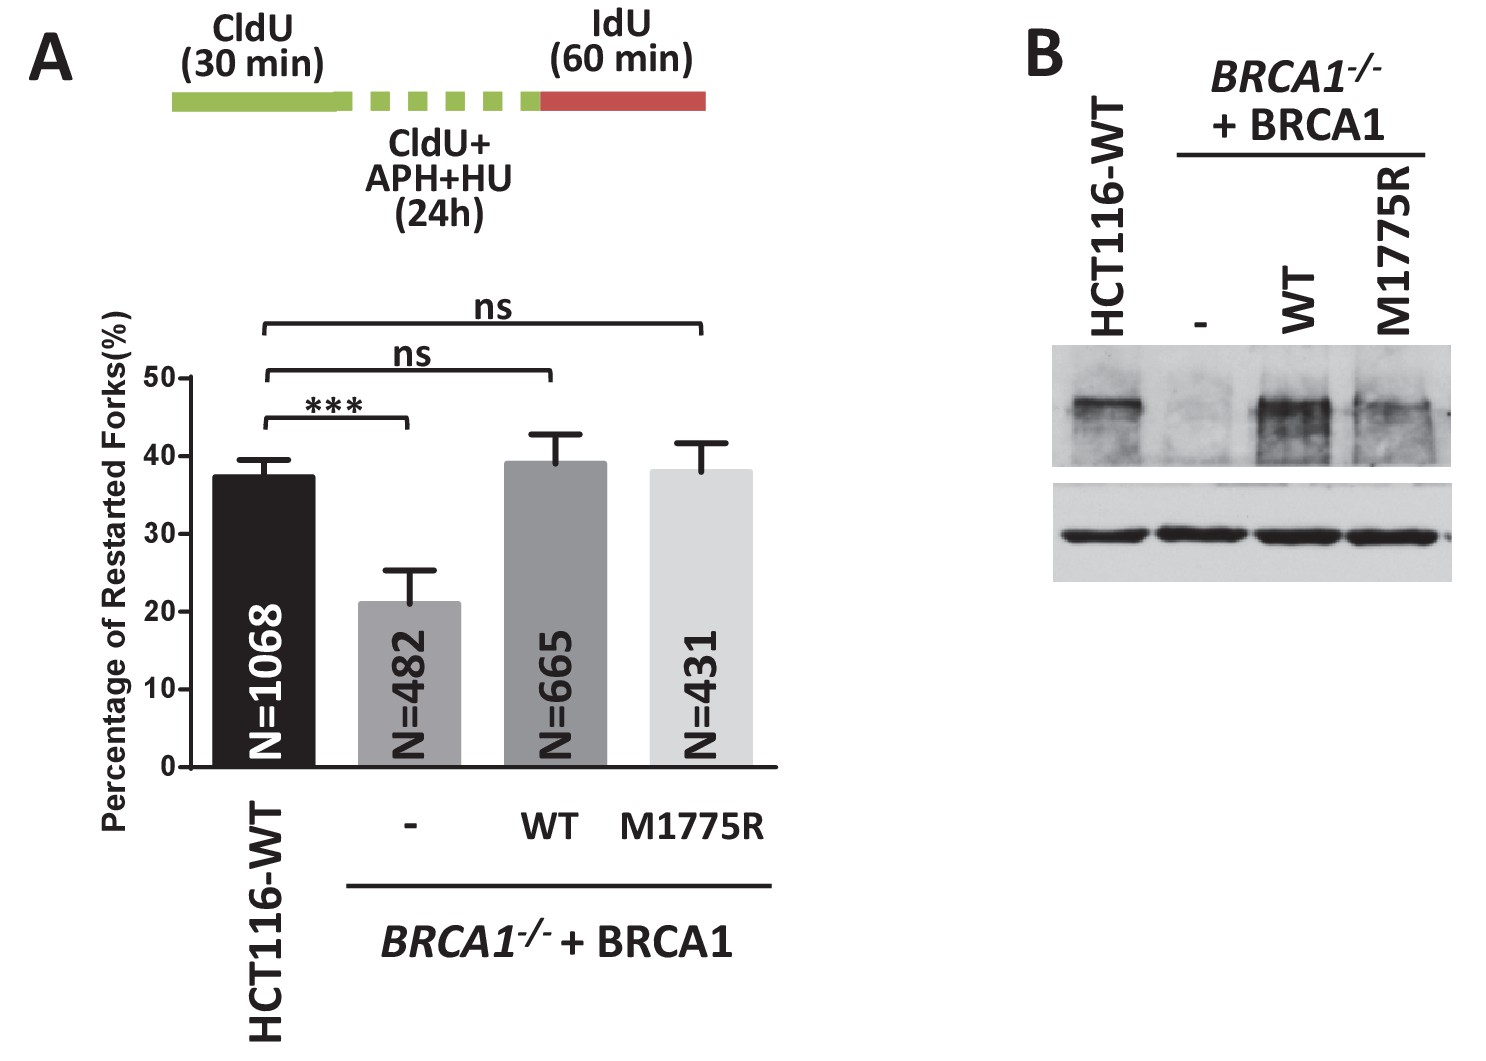
BRCA1 M1775R retains its function in stalled fork restart.
(A) A graph showing stalled replication fork restart rates BRCA1-/- HCT116 cells expressing wild-type or M1775R BRCA1. The mean and s.d. from three independent experiments are shown. ***p<0.001, ns p>0.05. (B) immunoblots showing expression levels of BRCA1. (C) Sensitivity assay of the BRCA1-/- and its complemented HCT116 cells.
Figure 4 with 2 supplements
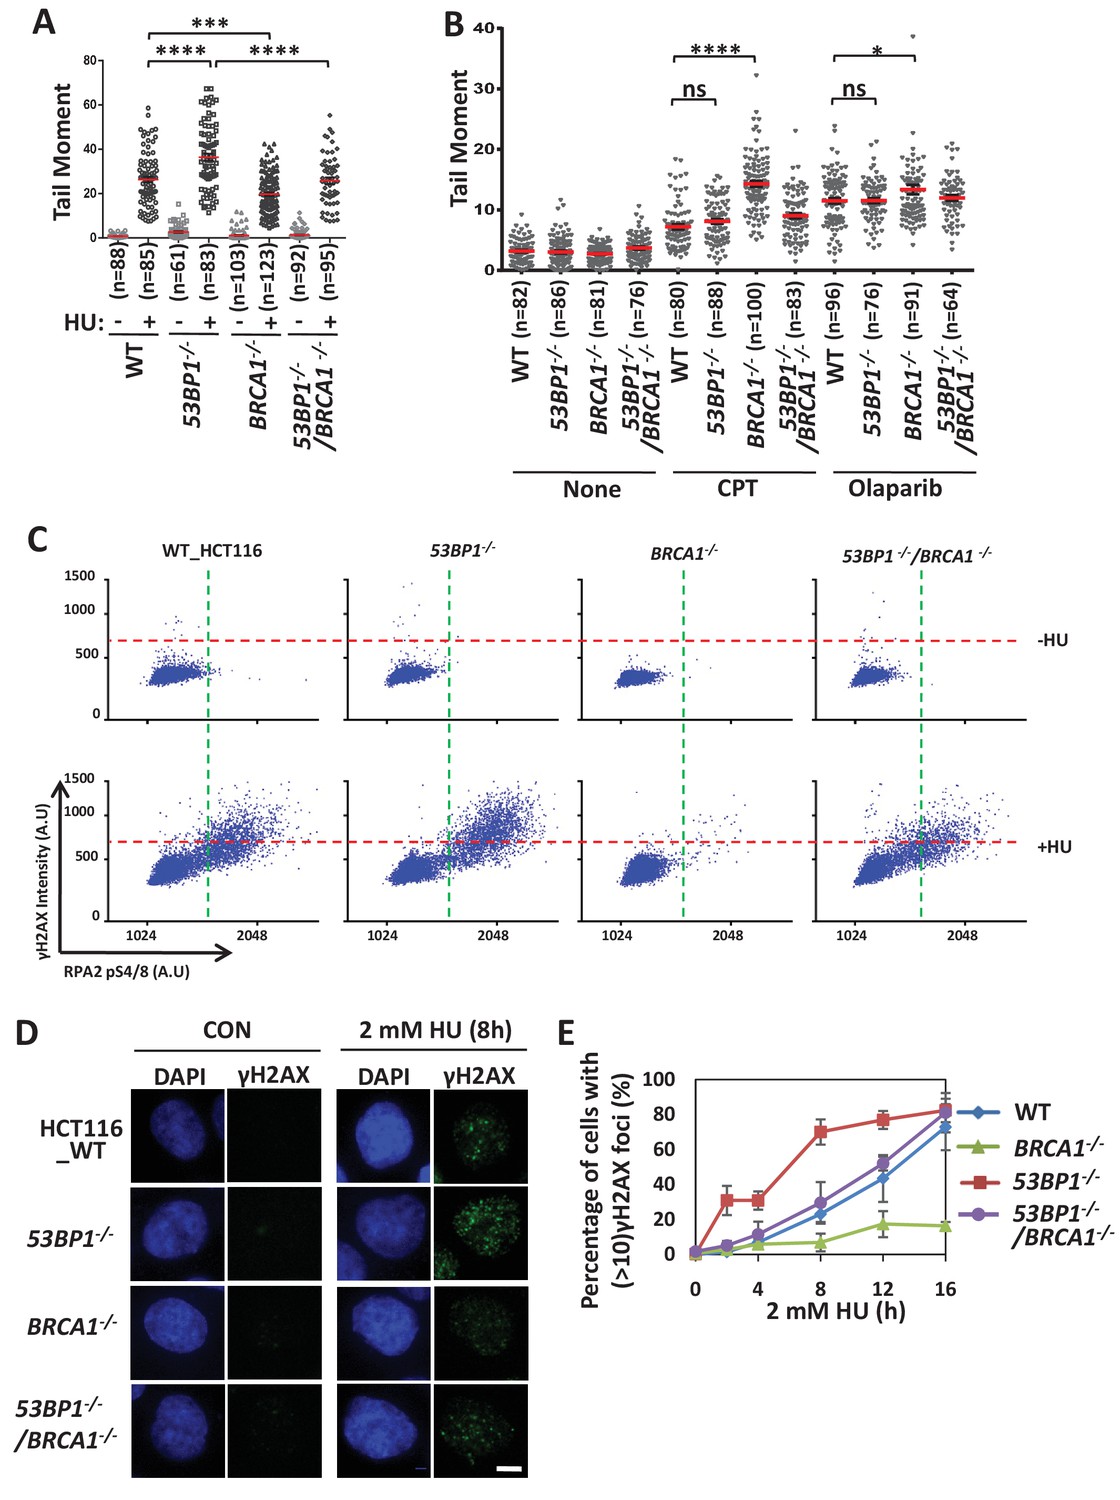
53BP1 and BRCA1 have opposite effects in inducing cleavage of replication forks.
(A, B) Comet assays measuring DSB accumulation in wild-type, 53BP1-/-, BRCA1-/- and 53BP1-/- BRCA1-/- HCT116 cells treated with HU (2 mM for 12 hr; A), CPT (1 μM for 8 hr) and Olaparib (1 μM for 8 hr; B). The mean and s.e.m. are shown. ****p<0.0001, ***p<0.001, *p<0.05, ns p>0.05. (C) QIBC analysis of immunolabeled wild-type, 53BP1-/-, BRCA1-/- and 53BP1-/- BRCA1-/- HCT116 cells. Asynchronous cells were treated with HU (2 mM) for 5 hr before fixing and immunostaining for γH2AX and RPA2-pS4/8. The mean nuclear intensities for γH2AX and RPA2-pS4/8 were determined for each of 5000 individual cells and were plotted. (D, E) Immunostaining (D) and quantification (E) showing γH2AX foci formation over time. The mean and s.d. from three independent experiments are shown. Please refer to Figure 4—figure supplement 1 and Figure 4—figure supplement 2 for additional information in support of Figure 4.
Figure 4—figure supplement 1
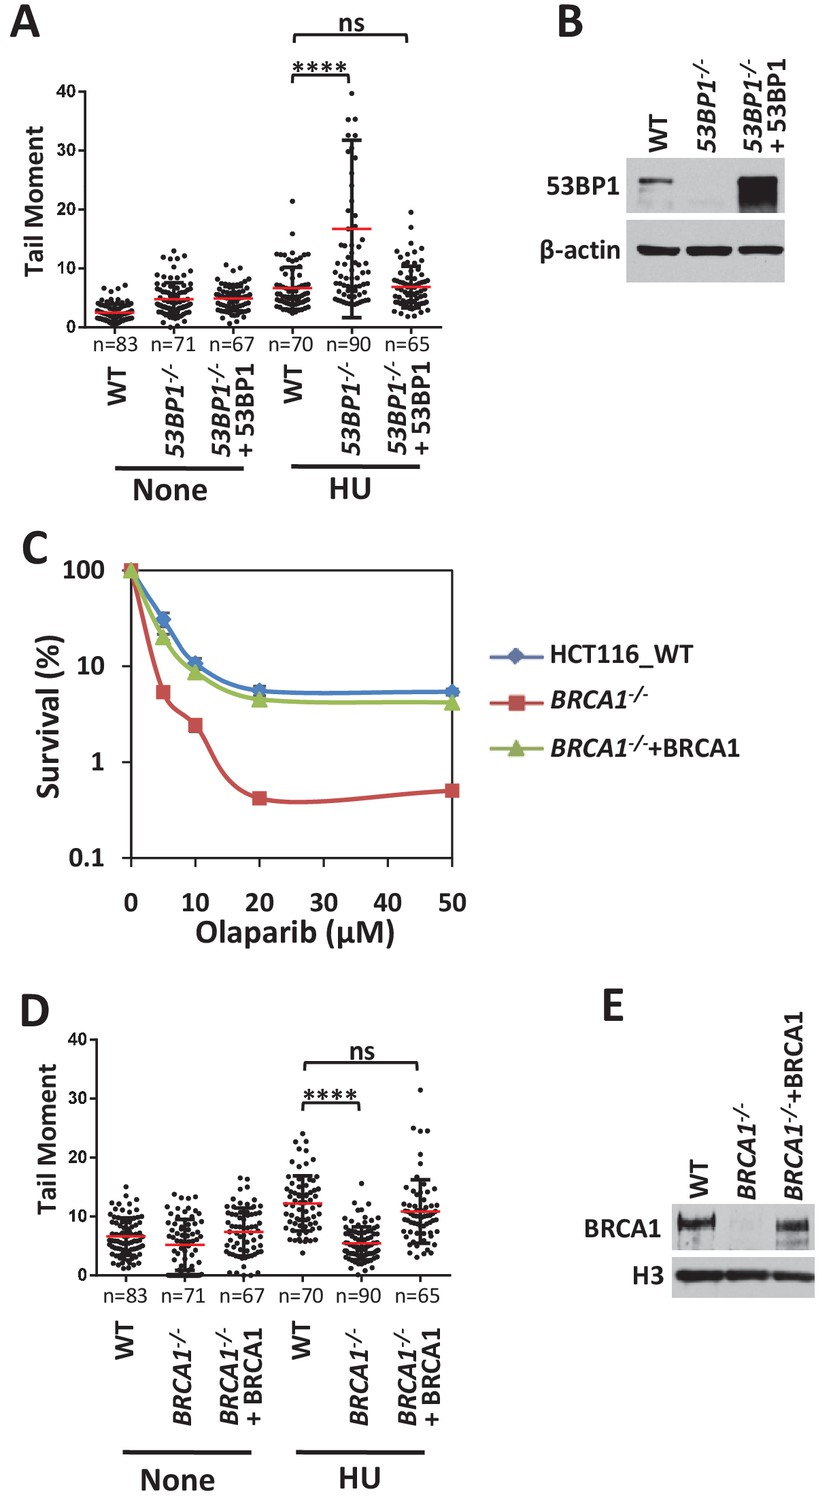
Characterization of BRCA1 and 53BP1 knockout HCT116 cells.
(A, D) Comet assays measuring DSB accumulation in complemented 53BP1-/- (A) and BRCA1-/- (D) HCT116 cells. Cells treated with HU (2 mM) for 12 hr. The mean and s.d. are shown. ****p<0.0001, ns p>0.05. (B, E) immunoblots showing expression levels of 53BP1 (B) and BRCA1 (E). (C) Sensitivity assay of the BRCA1-/- and its complemented HCT116 cells. The mean and s.d. from three independent experiments are shown.
Figure 4—figure supplement 2
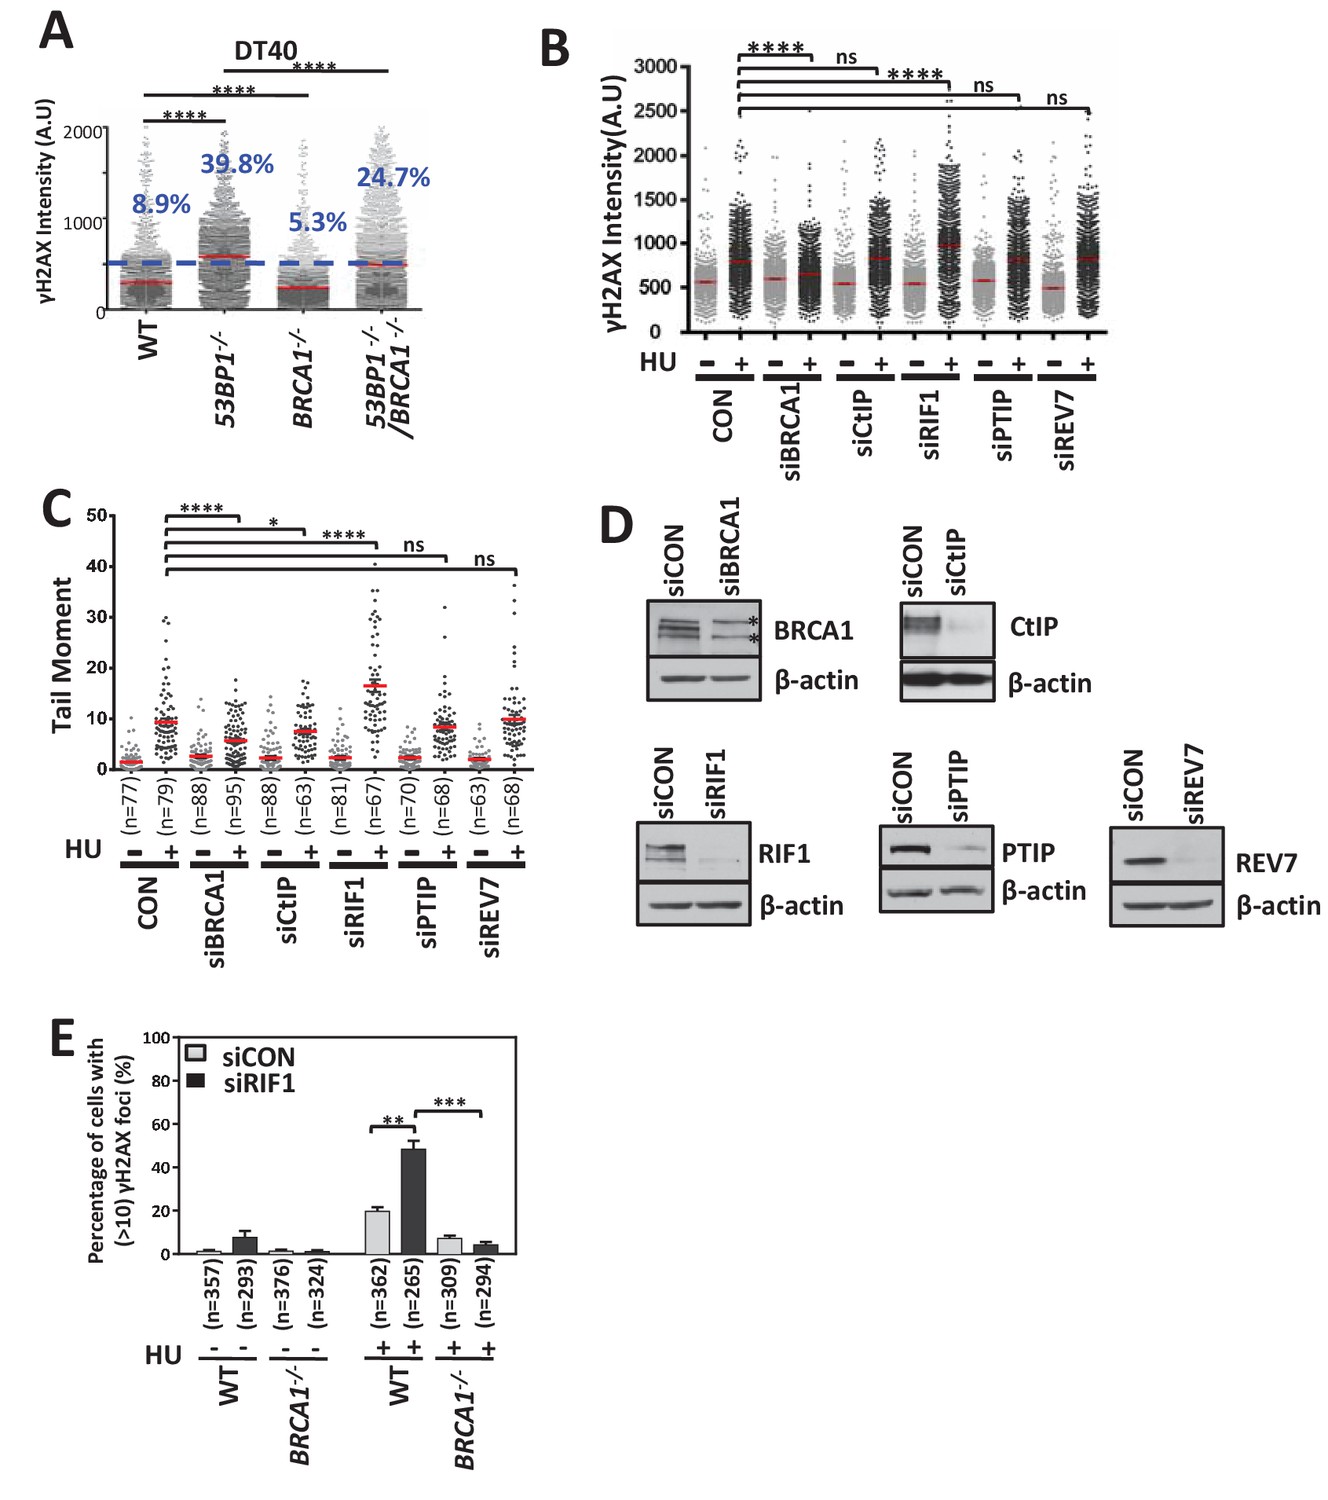
53BP1 and BRCA1 have opposite effects in inducing cleavage of replication forks.
(A) QIBC assay of immunolabeled DT40 cells. Cells were treated with 5 mM HU 5 hr before harvest. Blue dashed lines indicate the cutoff of γH2AX-positive cells. Percentages of γH2AX-positive cells were calculated. mean ±s.e.m (n = 5000) are shown. (B–C) QIBC assay (B) and comet assay (C) of HeLa cells depleted with indicated proteins. Cells were treated with 2 mM HU for 3 hr (B) or 12 hr (C). mean ±s.e.m are shown. (D) Western-blotting showing knockdown efficiency of multiple siRNAs. The asterisks mark crossreactive polypeptides. (E) graphs showing the γH2AX foci formation in the RIF1-depleted cells. Cells were treated with 2 mM HU 3 hr before fixing. Data are means of at least three independent experiments. Error bars indicate s.d. ****p<0.0001, ***p<0.001, **p<0.01, *p<0.05, ns p>0.05.
Figure 5 with 1 supplement
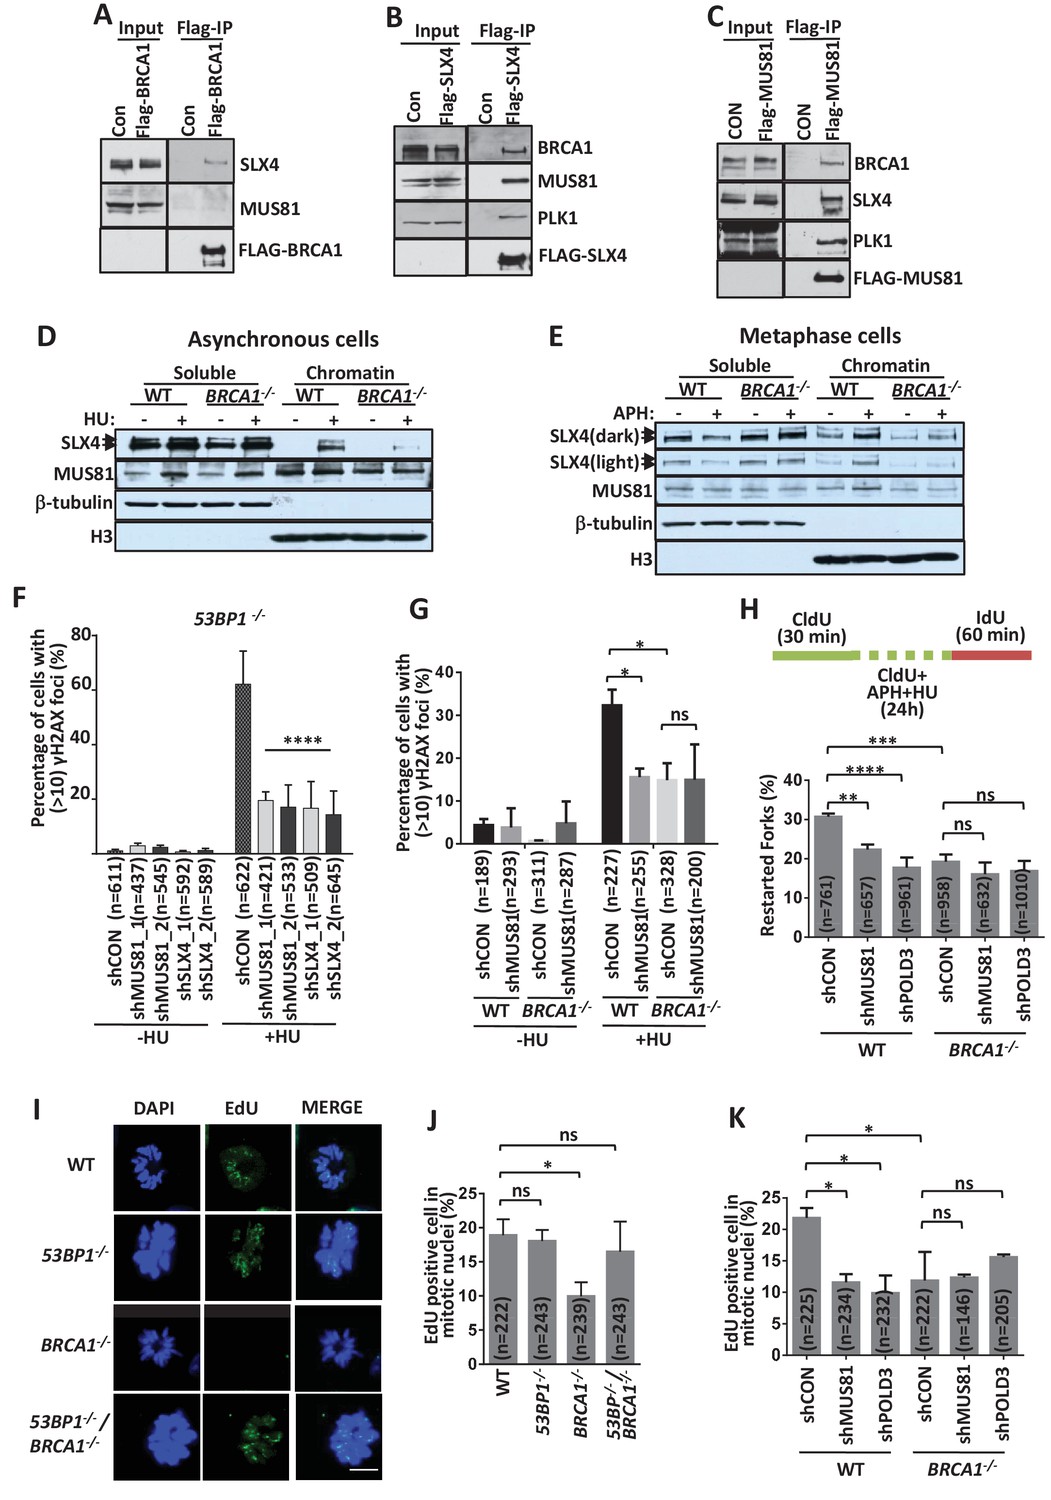
BRCA1 promotes SLX-MUS-coupled BIR pathway.
(A–C) Immunoblot showing the immunoprecipitation from the extracts of HEK293 cells transfected with vectors expressing Flag-tagged BRCA1 (A), SLX4 (B), MUS81 (C) or control vector (Con). (D, E) Immunoblot showing protein level of SLX4 and MUS81 on the chromosome. Asynchronous cells were treated with or without 2 mM HU for 16 hr (D). Metaphase cells (E) were prepared as experimental workflow in Figure 5—figure supplement 1B. (F, G) Graphs showing γH2AX foci formation in MUS81- or SLX4-depleted 53BP1-/- (F) cells and BRCA1-/- (G) HCT116 cells treated with or without 2 mM HU for 3 hr. Knockdown efficiency was showed in Figure 5—figure supplement 1F and G. (H) A graph showing stalled replication fork restart rates in MUS81- or POLD3- depleted BRCA1-/- cells. (I, J) Immunofluorescence (I) and its quantifications (J) showing DNA synthesis (EdU foci, green) in condensed mitotic nuclei (DAPI, blue). Experiments were preformed as the workflow in Figure 5—figure supplement 1C. (K) A graph showing mitotic DNA synthesis in MUS81- or POLD3- depleted BRCA1-/- cells. The mean and s.d. from three independent experiments are shown. ****p<0.0001, ***p<0.001,**p<0.01, *p<0.05, ns p>0.05.
Figure 5—figure supplement 1
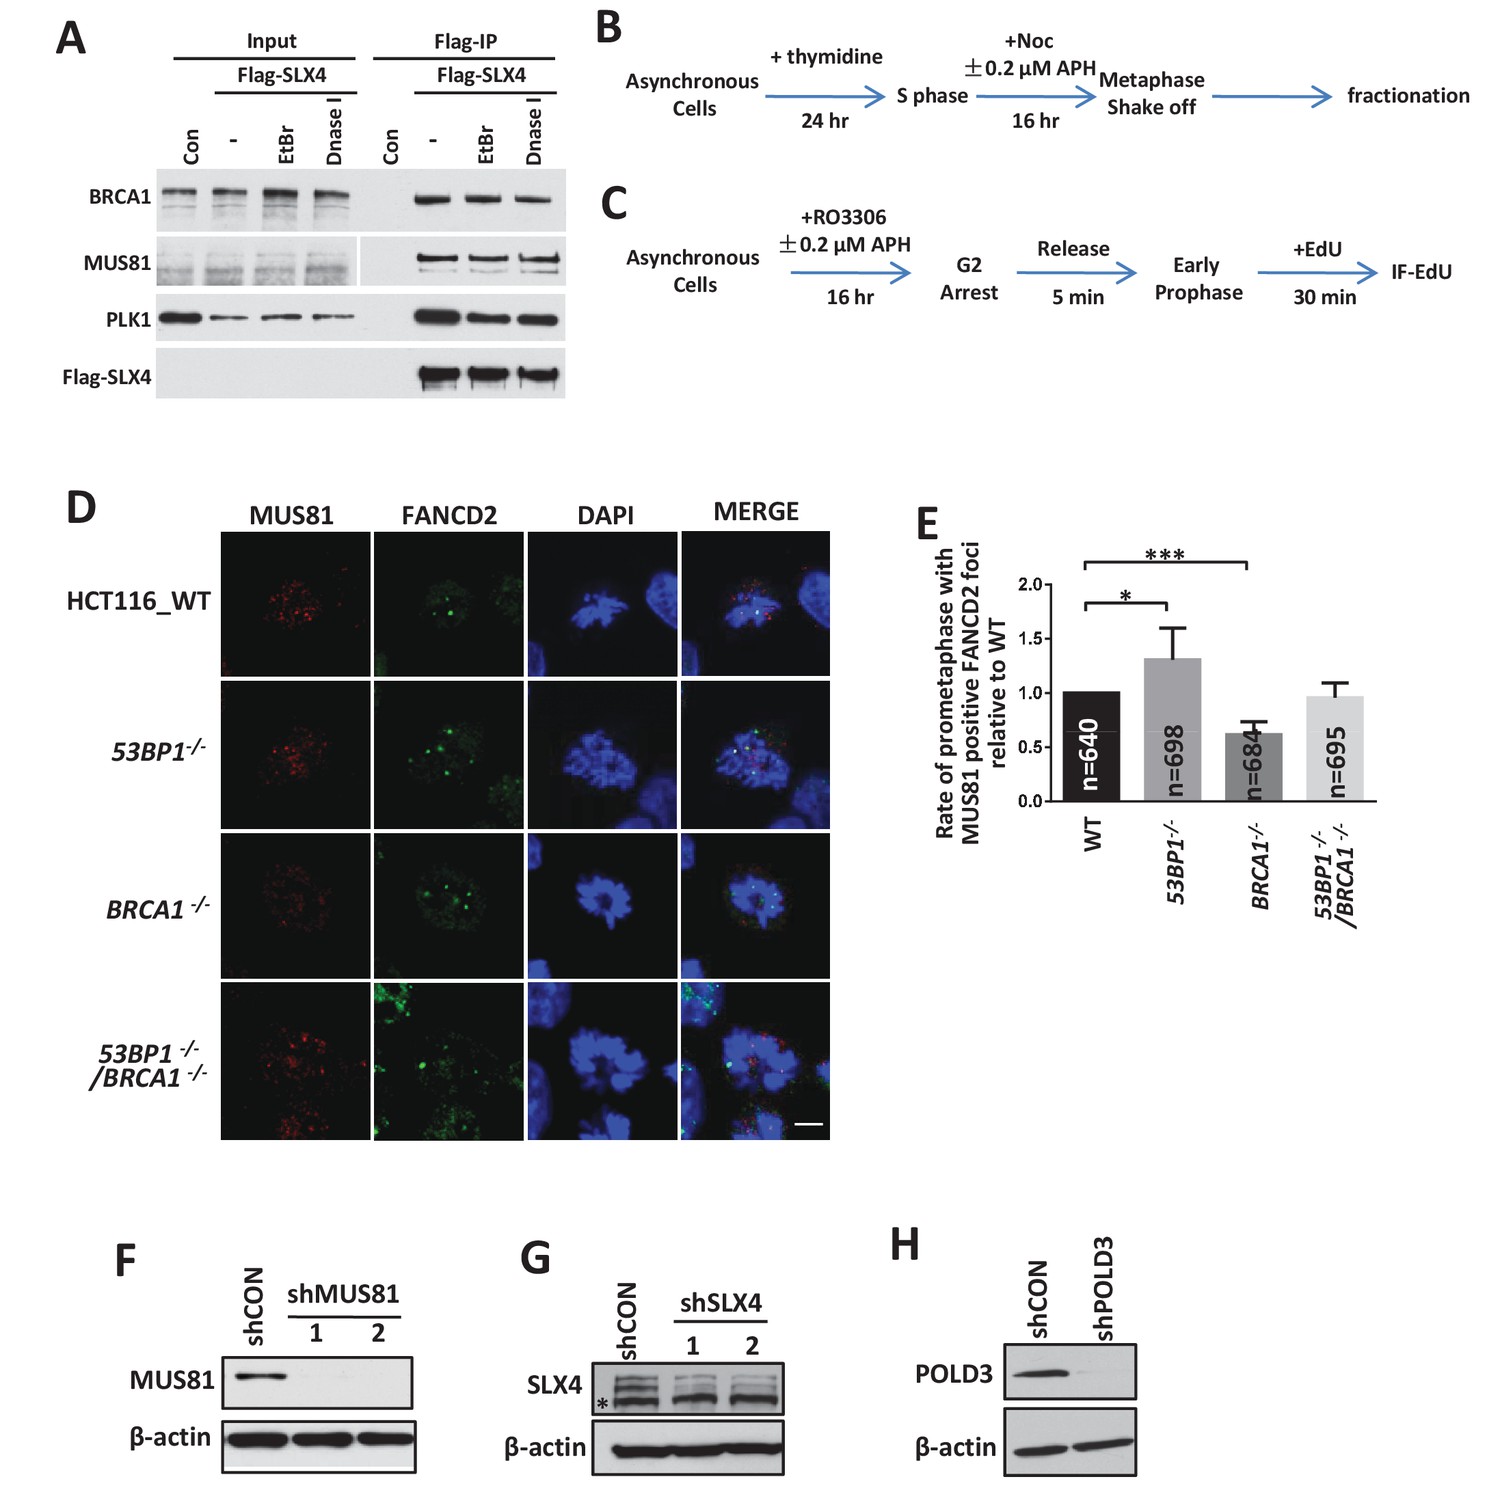
BRCA1 promotes the recruitment of the SLX-MUS complex to stalled forks.
(A) Immunoblot showing the immunoprecipitation of Flag-tagged SLX4 in present of Ethidium Bromide (EtBr; 100 μg/ml) or DnaseI (10 unit/ml). (B–C) experimental workflows for fractionation (B) and immunoflourescence (C). (D–E) Immunofluorescence (D) and its quantifications (E) showing colocalization of MUS81 and FANCD2 in condensed mitotic nuclei. Experiments were preformed as the workflow in (C). The mean and s.d. from four independent experiments are shown. Scale bar 2 μm. ***p<0.001, *p<0.05. (F–H) Western-blotting showing knockdown efficiency of MUS81 (F), SLX4 (G) and POLD3 (H) in HCT116. The asterisk marks a crossreactive polypeptide.
Figure 6 with 1 supplement
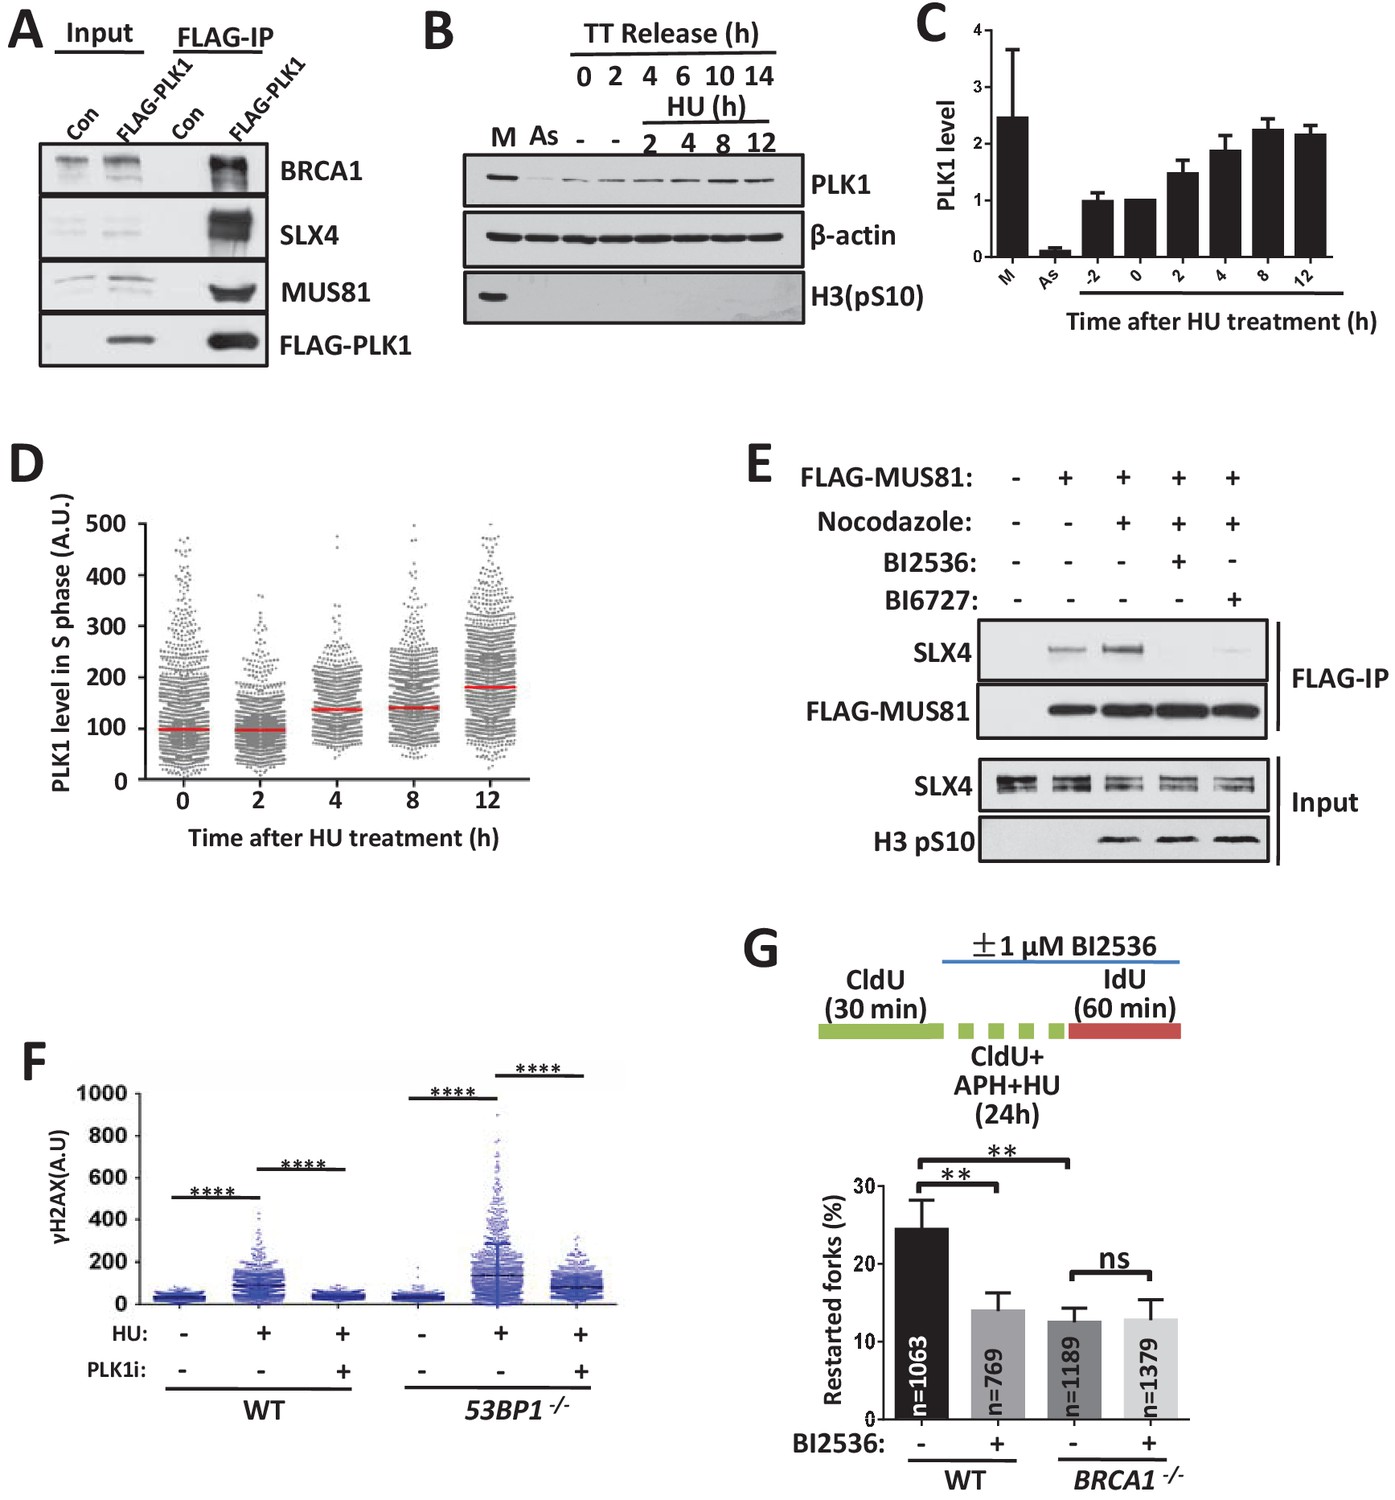
PLK1 controls the switching between the 53BP1-mediated cleavage free pathway to BRCA1-mediated cleavage pathway.
(A) Immunoblot showing the immunoprecipitation from extracts of HEK293 cells tranfected with control vector (Con) or vector expressing Flag-tagged PLK1. (B, C) Immunoblotting (B) and its quantification (C) showing PLK1 levels after replication inhibition. The mean and s.d. from three independent experiments are shown. (D) QIBC analysis of PLK1 expression after replication inhibition. Asynchronous HCT116 cells were treated with 2 mM HU as indicated time before fixing. PLK1 levels of S phase (Figure 6—figure supplement 1A) were gated and plotted. Red lines indicate the medians of PLK1. (E) Immunoblot showing the immunoprecipitation of FLAG-tagged MUS81. Suspension HEK293 cells expressing FLAG-tagged MUS81 were treated with or without nocodazole (100 ng/ml) and PLK1 inhibitors (10 μM BI2536 or BI6727) for 17 hr and 5 hr before harvest, respectively. (F) QIBC analysis of wild-type and 53BP1-/- HCT116 cells treated with 2 mM HU and PLK1 inhibitor (10 μM BI2536) for 3 hr. ****p<0.0001. (G) DNA combing assay showing that PLK1 works in the same pathway with BRCA1 in stalled fork restart. The sketch above delineates the experimental design. The mean and s.d. from three independent experiments are shown. **p<0.01, ns p>0.05. Please refer to Figure 6—figure supplement 1 for additional information in support of Figure 6.
Figure 6—figure supplement 1
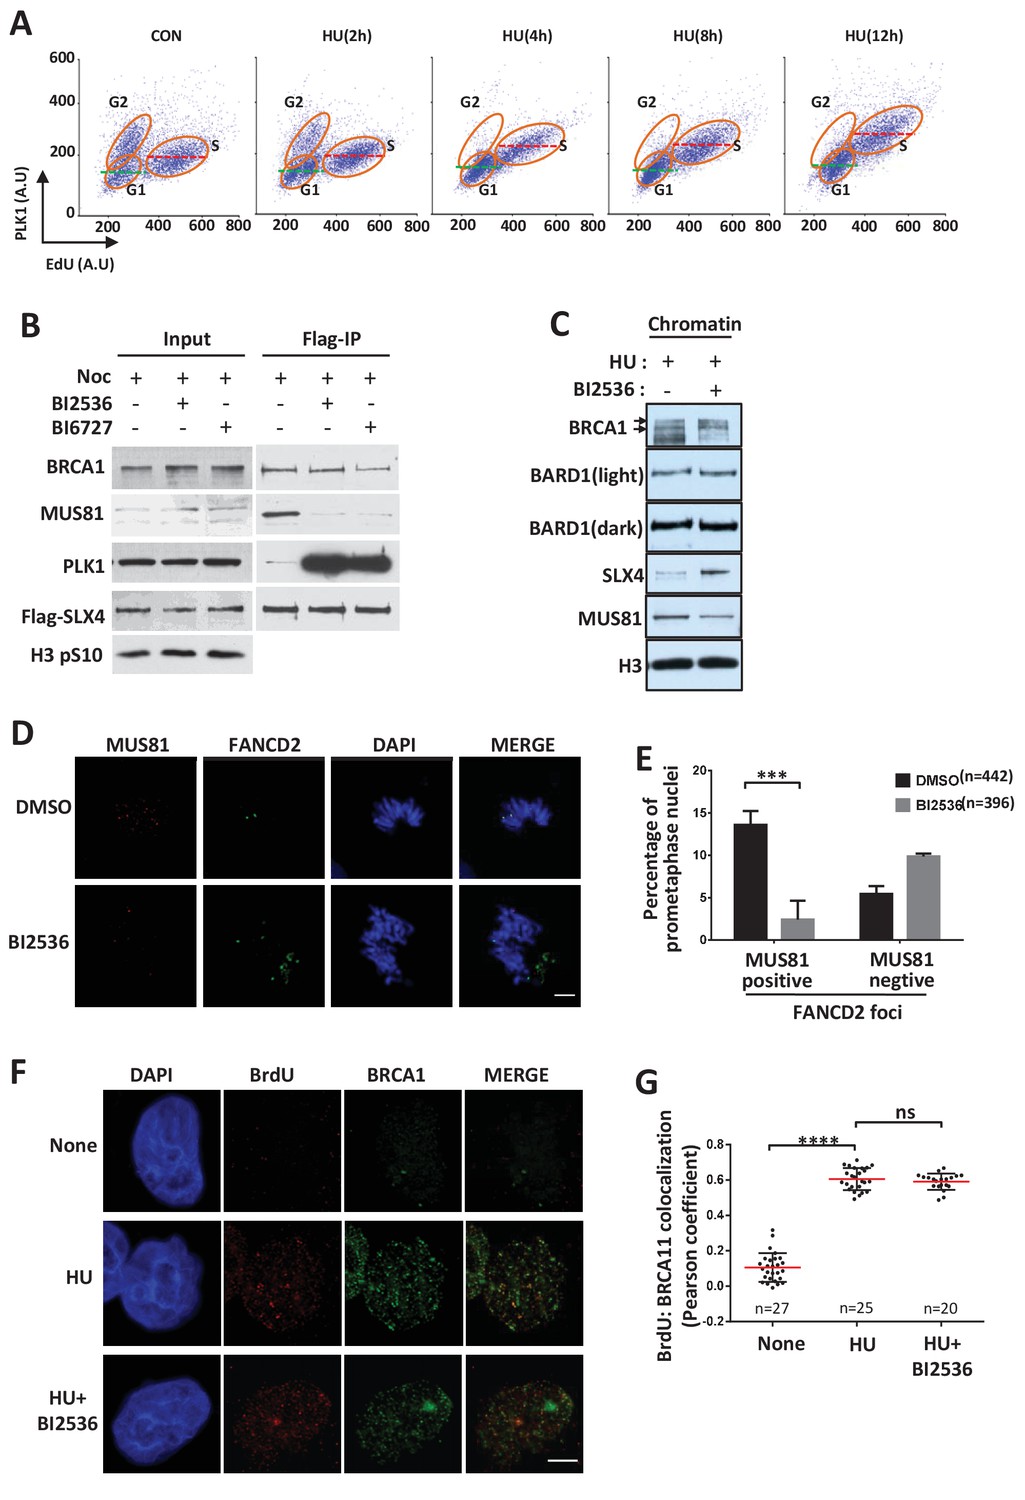
PLK1 promotes the recruitment of MUS81 to stalled replication forks.
(A) QIBC analysis of PLK1 expression after replication inhibition. Asynchronous HCT116 cells were treated with 2 mM HU as indicated time before fixing. The mean levels of PLK1 in the S and G1 phase were showed by red dash lines and green dash lines, respectively. (B) Immunoblot showing the immunoprecipitation of FLAG-tagged SLX4. Suspension HEK293 cells expressing FLAG-tagged SLX4 were treated with or without nocodazole (100 ng/ml) and PLK1 inhibitors (10 μM BI2536 or BI6727) for 17 hr and 5 hr before harvest, respectively. (C) Immunoblot showing protein levels of BRCA1, BARD1, SLX4 and MUS81 on the chromosome. Asynchronous cells were treated with or without 10 μM BI2536 and 5 mM HU for 16 hr before harvest. (D–E) Immunofluorescence (D) and its quantifications (E) showing colocalization of MUS81 and FANCD2 in condensed mitotic nuclei. Experiments were preformed as the workflow in Figure 6—figure supplement 1. PLK1 inhibitor (10 μM BI2536) was added after G2 phase release. (F–G) Immunofluorescence (F) and its quantifications (G) showing colocalization of BRCA1 and ssDNA. HeLa cells were labeled with BrdU for 24 hr and then treated with or without 2 mM HU and 10 μM BI2536 for 5 hr. The Pearson coefficient of colocalization between BRCA1 and BrdU was measured by Huygens Professional Analysis Software. The mean and s.d. from three independent experiments are shown. ****p<0.0001, ***p<0.001, ns p>0.05. Scale bar, 5 μm.
Figure 7
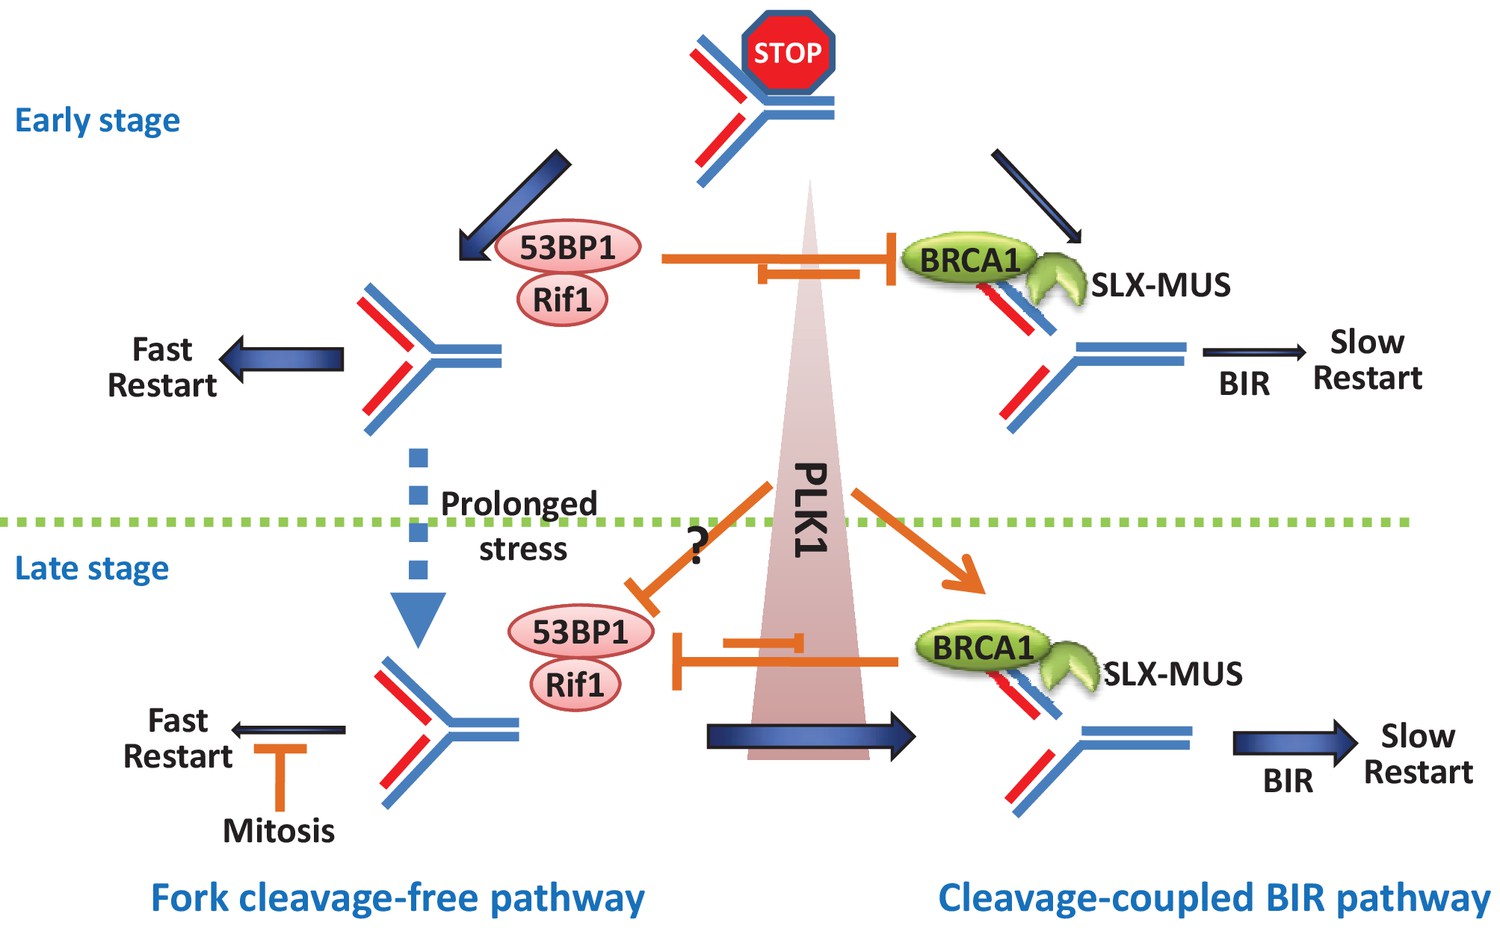
A model showing the pathway choice of stalled replication restart by 53BP1 and BRCA1.
https://doi.org/10.7554/eLife.30523.015
Author response image 1
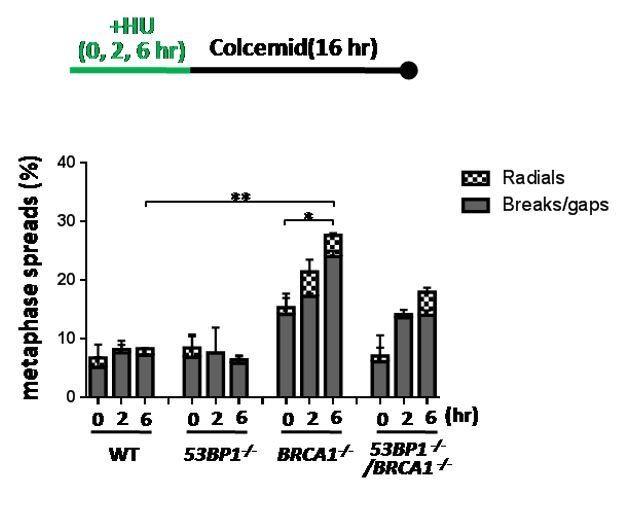
BRCA1 suppresses chromosomal aberration upon replication stress.
Sketch above the graphs delineates experimental design. The % of metaphase spreads with chromosomal aberrations in the indicated HCT116 cell lines was plotted. The mean and s.d. from two independent experiments are shown. ** P<0.01, * P<0.05.
Tables
Key resources table
| Reagent type (species) or resource | Designation | Source or reference | Identifiers | Additional information |
|---|---|---|---|---|
| genetic reagent (Homo sapiens) | MUS81(shRNA) | Sigma-Aldrich (St. Louis, MO, USA) | TRCN0000049726, TRCN0000049727 | |
| genetic reagent (Homo sapiens) | SLX4(shRNA) | Sigma-Aldrich (St. Louis, MO, USA) | TRCN0000143727, TRCN0000142519 | |
| genetic reagent (Homo sapiens) | POLD3(shRNA) | Sigma-Aldrich (St. Louis, MO, USA) | TRCN0000052990 | |
| genetic reagent (Homo sapiens) | BRCA1(siRNA) | PMID:16109739 | ||
| genetic reagent (Homo sapiens) | RIF1(siRNA) | PMID:20711169 | ||
| genetic reagent (Homo sapiens) | CtIP(siRNA) | PMID:23333306 | ||
| genetic reagent (Homo sapiens) | PTIP(siRNA) | PMID:15456759 | ||
| genetic reagent (Homo sapiens) | REV7(siRNA) | PMID:23287467 | ||
| cell line (Homo sapiens) | HCT116 | ATCC | CCL-247 | |
| cell line (Homo sapiens) | Hela | ATCC | CCL-2 | |
| cell line (Homo sapiens) | 293T | ATCC | CRL-3216 | |
| cell line (Homo sapiens) | HEK293 Suspension | ATCC | CRL-1573.3 | |
| cell line (Gallus gallus) | DT40 | other | A gift from Dr. Minoru Takata’s lab | |
| antibody | anti-BrdU(BU1/75)(mouse monoclonal) | BD Biosciences (San Jose, CA, USA) | 347580 | IF: 1:250 |
| antibody | anti-BrdU(B44)(rat monoclonal) | Abcam (Cambridge, UK) | ab6326 | IF:1:50 |
| antibody | Flag(mouse monoclonal) | MBL (Japan) | M185-3L | WB:1:2000 |
| antibody | γH2AX(mouse monoclonal) | Millipore (St. Louis, MO, USA) | 05–636 | IF:1:5000 |
| antibody | RPA2 (rabbit polyclonal) | Bethyl (Montgomery, TX, USA) | A300-244A | WB:1:1000; IF:1:500 |
| antibody | MUS81 (rabbit polyclonal) | Proteintech (China) | 11018–1-AP | WB:1:1000 |
| antibody | MUS81(mouse monoclonal) | Abcam (Cambridge, UK) | ab14387 | IF:1:250 |
| antibody | BRCA1 (rabbit polyclonal) | Millipore (St. Louis, MO, USA) | 07–434 | WB:1:1000 |
| antibody | CtIP (rabbit polyclonal) | Abcam (Cambridge, UK) | ab155988 | WB:1:1000 |
| antibody | PTIP (rabbit polyclonal) | Abcam (Cambridge, UK) | ab70434 | WB:1:1000 |
| antibody | REV7(mouse monoclonal) | BD Biosciences (San Jose, CA, USA) | 612266 | WB:1:1000 |
| antibody | FANCD2(rabbit polyclonal) | Homemade | WB:1:1000;IF:1:250 | |
| antibody | β-actin(mouse monoclonal) | MBL (Japan) | M177-3 | WB:1:1000 |
| antibody | PLK1(mouse monoclonal) | Santa Cruz (Dallas, TX, USA) | F-8 | WB:1:1000;IF:1:250 |
| antibody | PLK1(rabbit polyclonal) | Proteintech (China) | 10305–1-AP | WB:1:1000 |
| antibody | Histone H3-pS10(mouse monoclonal) | Cell Signaling (Danvers, MA, USA) | 9706 s | WB:1:1000 |
| antibody | Histone H3(rabbit polyclonal) | Novus Biologicals (Littleton, USA) | NB500-171 | WB:1:1000 |
| antibody | 53BP1(mouse monoclonal) | Millipore (St. Louis, MO, USA) | MAB3802 | WB:1:1000 |
| antibody | BARD1(rabbit polyclonal) | proteintech (China) | ab22964-1-AP | WB:1:2000 |
| antibody | Donkey anti-mouse(A594, A488) | Invitrogen (Waltham, Massachusetts, USA) | A21203,A21202 | IF:1:250 |
| antibody | Donkey anti-rabbit(A594) | Invitrogen (Waltham, Massachusetts, USA) | A21207 | IF:1:250 |
| antibody | Donkey anti-rabbit(A488) | Jackson Immunoresearch (Baltimore, MD, USA) | 711-546-152 | IF:1:250 |
| antibody | Donkey anti-rat(A488) | Invitrogen(Waltham, Massachusetts, USA) | A21208 | IF:1:250 |
| antibody | Anti-Mouse IgG | Jackson ImmunoResearch (Baltimore, MD, USA) | 115-035-146, Lot111590 | WB:1:5000 |
| antibody | Anti-Rabbit IgG | Jackson ImmunoResearch (Baltimore, MD, USA) | WB:1:5000 | |
| recombinant DNA reagent | pDEST26-HF(Gateway vector) | this paper | Progentiors: pDEST26 from Invitrogen | |
| recombinant DNA reagent | Flag-SLX4(plasmid) | this paper | Progentiors: pDONR221-SLX4; Gateway vector:pDEST36-HF | |
| recombinant DNA reagent | Flag-MUS81(plasmid) | this paper | Progentiors: pDONR221-MUS81; Gateway vector:pDEST36-HF | |
| recombinant DNA reagent | Flag-PLK1(plasmid) | this paper | Progentiors: pDONR221-PLK1; Gateway vector:pDEST36-HF | |
| recombinant DNA reagent | Flag-BRCA1(plasmid) | this paper | Progentiors: pDONR221-BRCA1; Gateway vector:pDEST36-HF | |
| commercial assay or kit | comet assay kit | Trivegen (Gaithersburg, USA) | 4250–050 K | |
| chemical compound, drug | HU(hydroxyurea) | Sigma-Aldrich (St. Louis, MO, USA) | V900323 | |
| chemical compound, drug | APH(aphidicolin) | abcam (Cambridge, UK) | ab142400 | |
| chemical compound, drug | ICRF193 | Sigma-Aldrich (St. Louis, MO, USA) | I4659 | |
| chemical compound, drug | Olaparib | selleck (Houston, TX, USA) | S1060 | |
| chemical compound, drug | CPT(Camptothecin) | Sigma-Aldrich (St. Louis, MO, USA) | C9911 | |
| chemical compound, drug | BI2536 | selleck (Houston, TX, USA) | S1109 | |
| chemical compound, drug | BI6727 | selleck (Houston, TX, USA) | S2235 | |
| chemical compound, drug | IdU | Sigma-Aldrich (St. Louis, MO, USA) | I7125 | |
| chemical compound, drug | CldU | Sigma-Aldrich (St. Louis, MO, USA) | C6891 | |
| chemical compound, drug | EdU | Sigma-Aldrich (St. Louis, MO, USA) | 900584 | |
| chemical compound, drug | BrdU | Sigma-Aldrich (St. Louis, MO, USA) | B5002 | |
| chemical compound, drug | Thymidine | Sigma-Aldrich (St. Louis, MO, USA) | T1895 | |
| chemical compound, drug | Nocodazole | Sigma-Aldrich (St. Louis, MO, USA) | M1404 | |
| chemical compound, drug | RO3306 | selleck (Houston, TX, USA) | S7747 | |
| chemical compound, drug | XL413 | selleck (Houston, TX, USA) | S7547 | |
| software, algorithm | CellProfiler | Carpenter lab website | open-source, public domain software | |
| software, algorithm | Image J | National Institutes of Health | public domain, Java | |
| software, algorithm | Huygens Professional | Scientific Volume Imaging | ||
| software, algorithm | casplab | open-source, public domain software | ||
| software, algorithm | GraphPad Prism | open-source | ||
| other | DAPI stain | Invitrogen (Waltham, Massachusetts, USA) |
Additional files
-
Transparent reporting form
- https://doi.org/10.7554/eLife.30523.016
Download links
A two-part list of links to download the article, or parts of the article, in various formats.
Downloads (link to download the article as PDF)
Open citations (links to open the citations from this article in various online reference manager services)
Cite this article (links to download the citations from this article in formats compatible with various reference manager tools)
53BP1 and BRCA1 control pathway choice for stalled replication restart
eLife 6:e30523.
https://doi.org/10.7554/eLife.30523


